Influence of Land Use and Land Cover Change on the Formation of Local Lightning


Center for Space and Remote Sensing Research, National Central University, No. 300, Jhongda Rd., Jhongli Dist., Taoyuan City 32001, Taiwan
*
Author to whom correspondence should be addressed.
Remote Sens. 2019, 11(4), 407; https://doi.org/10.3390/rs11040407
Submission received: 14 January 2019
/
Revised: 7 February 2019
/
Accepted: 14 February 2019
/
Published: 17 February 2019
(This article belongs to the Special Issue Earth Observations for Addressing Global Challenges)
Abstract
:Land use and land cover (LULC) play a crucial role in the interaction between the land and atmosphere, influencing climate at local, regional, and global scales. LULC change due to urbanization has significant impacts on local weather and climate. Land-cover changes associated with urbanization create higher air temperatures compared to the surrounding rural area, known as the “urban heat island (UHI)” effect. Urban landscapes also affect formation of convective storms. In recent years, the effect of urbanization on local convections and lightning has been studied very extensively. In this paper a long-term study has been carried out taking cloud-to-ground (CG) lightning data (1998–2012) from Tai-Power Company, and particulate matter (PM10), sulfur dioxide (SO2) data (2003–2012) from the Environmental Protection Administration (EPA) of Taiwan, in order to investigate the influence of LULC change through urbanization on CG lightning activity over Taipei taking into account in situ data of population growth, land use change and mean surface temperature (1965–2010). The thermal band of the Land-Sat 7 satellite was used to generate the apparent surface temperature of New Taipei City. It was observed that an enhancement of 60–70% in the flash density over the urban areas compared to their surroundings. The spatial distribution of the CG lightning flashes follows closely the shape of the Taipei city heat island, thereby supporting the thermal hypothesis. The PM10 and SO2 concentrations showed a positive linear correlation with the number of cloud-to-ground flashes, supporting the aerosol hypothesis. These results indicate that both hypotheses should be considered to explain the CG lightning enhancements over the urban areas. The results obtained are significant and interesting and have been explained from the thermodynamic point of view.
1. Introduction
The influence of urban environment on the lightning activity remains a debatable topic, beginning with first publication of Westcott [1], followed by several studies in US, Europe, Asia, Brazil and Australia [2,3,4,5,6,7]. The change of LULC in urban areas leads to a change of surface characteristics. Such change affects not only the dynamic and physical processes in the atmospheric boundary layer, but also affects the surface heat budget to form an urban heat island (UHI). The UHI effect and its associated impact on environment and regional climate have been receiving wide attention in recent years. It has already been established that the intensity of the UHI effect is strongly associated with the urban size, urban surface characteristics, anthropogenic heat release, topography, and meteorological conditions [8,9,10,11,12,13]. It has been hypothesized that convection is enhanced by a UHI-induced mesoscale circulation and as a result of such enhanced convection; increased thunderstorm and lightning activity accompanied with enhanced precipitation are observed over or downwind of major urban areas. During the Metropolitan Meteorological Experiment [14,15], this hypothesis was extensively investigated and substantiated. Modern urbanization, which caused dramatic change in LULC, is basically the demand of increased population and human activity. Contributions of manmade aerosols are also enhanced because of urbanization having significant impacts on local thunderstorm formation leading to an enhanced CG lightning activity particularly over urban area [16,17,18]. However, the physical mechanisms responsible for these effects are not fully understood due to the complex correlations.
The climate of coastal cities like Taipei is influenced by the development of cumulus convection caused by boundaries that occur when moist air is transported by the sea breeze from ocean to land. Taipei City is surrounded by mountains in all directions, except the two river valleys. The two river valleys, Tanshui and Keelung, respectively, in the northwest and northeast of Taipei City carry surface airflow to the open sea. Sea breezes funnel toward the southern part of the Taipei city through two river valleys. These low-level flows are expected to interact not only with the mountains situated south of Taipei City, but also with the UHI of Taipei City. Blending of UHI effect and sea breezes with the local synoptic and orographic structure causes the summer thunderstorm and lightning activity within the New Taipei City and Taipei City to develop a unique climate system. Exploring the impact of such triple interaction on the local atmospheric circulation Kitada et al. [19] indicated that urbanization has nominal effect on the diurnal airflow if urbanization is built up 100–200 km away from mountains. In contrast, a shift of the highest temperature zone from the center of the city to inland suburbs is evident in the case of extensive urbanized coastal areas. The development of Taipei City was started since 1960s, and with time it has become one of the largest trade centers in Eastern and Southeast Asia. Due to such rapid development in the past several decades, Taipei City has been well urbanized. The urban population has increased by a factor of 3.5. The land use for construction has also increased by a factor of three in the last few decades [20].
The effect of UHI leads to many serious environmental problems, such as regional climate change, air pollution, and visibility deterioration. For example, the diurnal temperature change has been decreasing since the 1970s in Taiwan [21]. The occurrence of fog in hours has decreased significantly over the last 40 years [21]. Temperature has been increasing at a rate of approximately 1.1–1.6 °C/century as recorded at eight lowland meteorology stations in Taiwan since 1900 to 2009. This rate of increase is consistent with the warming conditions of other East Asia countries, but significantly higher than the global rate of 0.74 °C/century [22,23]. During the last 30 years, the warming rate in Taiwan has almost doubled and reached 0.23–0.40 °C/decade. LULC caused by rapid urbanization has been attributed as one of the leading cause of such increasing trend of warming by researchers [24,25].
Taiwan, a mountainous island located at western Pacific coast region, is bisected by the Tropic of Cancer and has 300-km Central Mountain Range (CMR) stretching along north to south with more than 100 peaks above 3,000 m. The hot and humid weather condition provides plentiful lightning strikes over this island during premonsoon and monsoon seasons. Considerable research on thunderstorms and lightning has been conducted over tropical areas and in the United States. Compared to those studies the number of studies relating to Taiwan is limited [5,26,27]. The purpose of this study is to investigate the impact of LULC change caused by rapid urbanization on the formation of local lightning during the warm seasons (May–October) from 1998 to 2012 over Taipei, the capital of Taiwan. Possible influence of urban particulate matter on the enhancement of CG lightning activity is another focus of this study. More precisely we have tried to investigate in this study whether the local climate of Taipei is affected by this urbanization through an increase in lightning activity particularly during summer.
2. Data and Methodology
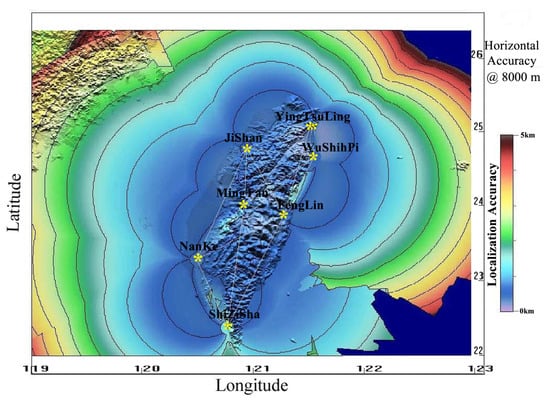
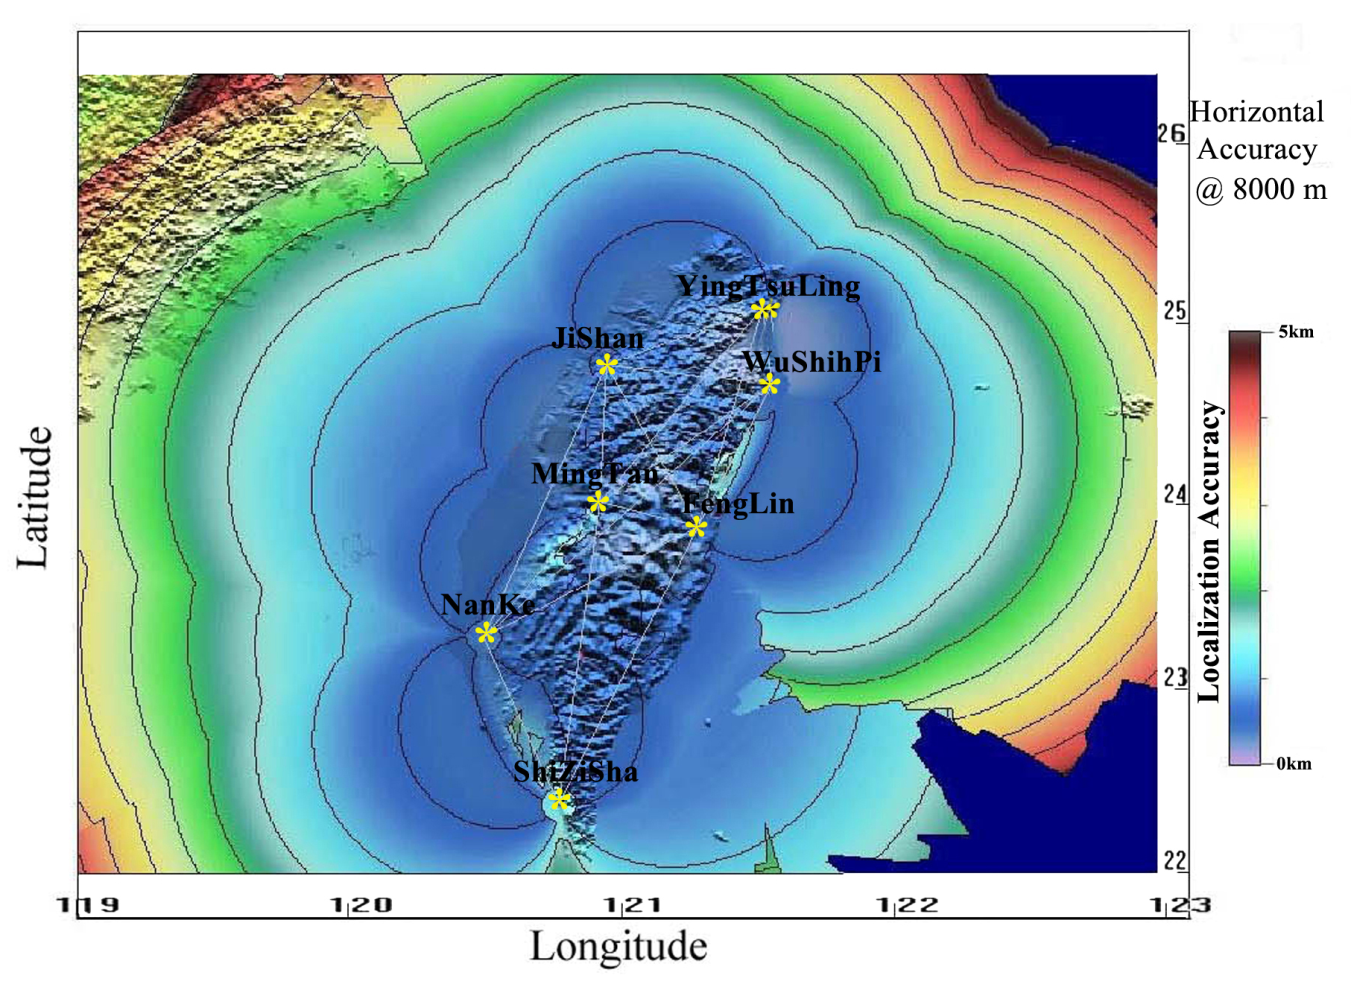
For the present study, we have collected lightning data from Tai-Power Company of Taiwan for the years 1998–2012 to determine the urban effect on lightning over Taipei and its surrounding places. The Lightning Location System (LLS) was built in 1989 with one APA (Advanced Position Analyzer), and six Direction Finders (DFs) installed at sites covering the entire area of Taiwan. The LLS was upgraded to a Total Lightning Detection System (TLDS) in 2002. The TLDS consist of seven lightning detection sensors (SAFIR 3000), which are located at the top of Ying-tsu-ling microwave tower, Wu-shih-pi microwave tower, Ji-shan microwave tower, Nan-Ke extra voltage substation, Feng-lin microwave tower, building roof of Ming-tan power plant, and building roof of Xiao-liou-chiou. The location of these seven sensors, distributed throughout Taiwan, is shown in Figure 1. The VHF interferometric technique is the main basis for the localization principles of SAFIR network [28,29]. The seven lightning detection sensors, formed a lightning detection network, could detect cloud-to-ground (CG) lightning discharges, intra cloud (IC) lightning discharges, and breakdown events. The lightning discharges detection is accomplished through the use of multiple, remote sensors that detect signals emitted by lightning discharges, and by filtering out the signals from non-lightning sources. The long rang localization of all lightning discharges (CG and CC lightning flashes) is governed by triangulation performed on GPS time synchronized direction of arrival provided by interferometric sensor of two different detection station in a SAFIR network. Each sensor detecting a lightning event sends data about the event to a central processor (SCM) that triangulates the results from each sensor creating an optimal estimate of location of the lightning event. The lightning detection network average efficiency is greater than 90%, and the lightning detection localization accuracy is less than 1 km. However, especially near the edges of the network the assumption of more than 90% uniform flash detection efficiency may not be realistic, but because of comparatively higher average detection efficiency and localization accuracy no attempt was taken to correct the detection efficiency because previous studies (e.g., [30] for a Lightning Position and Tracking System (LPATS); [31] for the National Lightning Detection Network in the United States; [32] for a LPATS in Germany, and [33] for a LPATS in Brazil) reported an overall detection efficiency of 90% for several lightning detection networks. For the present study we have only considered only CG lightning discharges and have ignored the IC discharges. CG lightning flash density was computed from the aggregated CG lightning flash data for the period 1998–2012.
Surface temperature data over Taipei are collected from Central Weather Bureau (CWB) for the years 1965–2010. With more than 400 stations, consisting of conventional surface station and Automatic Rainfall and Meteorological Telemetry System (ARMTS), established by CWB, an extremely dense surface observation network was developed over Taiwan. Hourly observations at these stations were used to obtain the daily mean surface temperature. The census record and land use data are collected from various Internet sites of the Taiwan government agencies. Landsat satellite images are employed to demonstrate the urbanization of the city of Taipei and its surrounding areas and are downloaded from United State Geological Survey. Errors for these images refer especially to acquisition loss due to clouds covering the region of interest. Thermal band of the Land-Sat 7 satellite is used to generate apparent surface temperature of Taipei and New Taipei city. The sensors of Land-sat 7 acquire temperature data and store the information as a digital number (DN) with a range between 0 and 255. These DNs are first converted to radiance values using the bias and gain values specific to the individual scene. Thereafter an atmospheric correction using appropriate local values for several parameters are performed to generate more accurate surface temperature map. Air pollutants data were collected from a well-organized air quality-monitoring network operated by Taiwan Environmental Protection Administration (EPA) of Taiwan for the period 2003–2012. Taiwan’s air quality monitoring network measures PM10 concentrations by the automatic Wedding β-gauge monitors, which is one of the US EPA-designated equivalent methods (no. EQPM-0391-081). The PM10 inlet is a cyclone operated at 18.9 min–1. Particles are detected once every hour from its continuous collection on the filter tape and the daily average is computed for at least 16 effective hours every day. A comparison experiment had been made between Wedding β-gauge monitors and the manual samplers because of the frequent abundance of high humidity in the ambient air of Taipei. The results obtained from automatic Wedding β-gauge monitor and the manual samplers were very close. For the present study PM10 and SO2 over Taipei City and New Taipei City are considered.
3. Results
Like the other countries, the population of Taiwan has been steadily increasing for decades. The population of New Taipei City and Taipei City, was 2.7 million in 1965 according to Taiwan government’s census record while it reached 6.6 million in 2010. The proportion of people who live in the twin cities has almost increased by a factor of 2.5 since 1965. This increasing trend has been shown in Figure 2a. Since the population increase over a particular area generally demands a large change in land use and housing development, we have plotted the land use data of the Taipei City and New Taipei City also in Figure 2b for easy comparison. An increasing trend is clearly evident between population and land use change, which is again in phase to a great extent with that of daily mean surface temperature at Taipei, which has been shown in Figure 2c. This result corroborates well the findings of Pinto et al. [3] who found an increase in the surface temperature well correlated to the increased thunderstorm activity and population growth of the São Paulo and Campinas cities.
A least squares–fit line for the past four decades indicates an increase of mean surface temperature approximately by 1.6 °C. This long-term increasing trend of daily surface temperature, despite a short-term cooling during 1992–97, strongly insists us to conclude that the increasing trend of surface temperature in Taipei City is likely a result of land use change due to urbanization and the effect of global warming. Increased land use in the New Taipei City has been further confirmed by images of inhabited region (cyan color) taken by Landsat-4 on 27th October, 1982 and by Landsat-8 on 29th January, 2014 (Figure 3). Based on our rough estimate using the satellite images shown in Figure 3, the built-up areas are 160.2 km2 and 285 km2 in 1982 and 2014, respectively. Thus, an expansion of over 78% during the past 32 years is clearly evident.
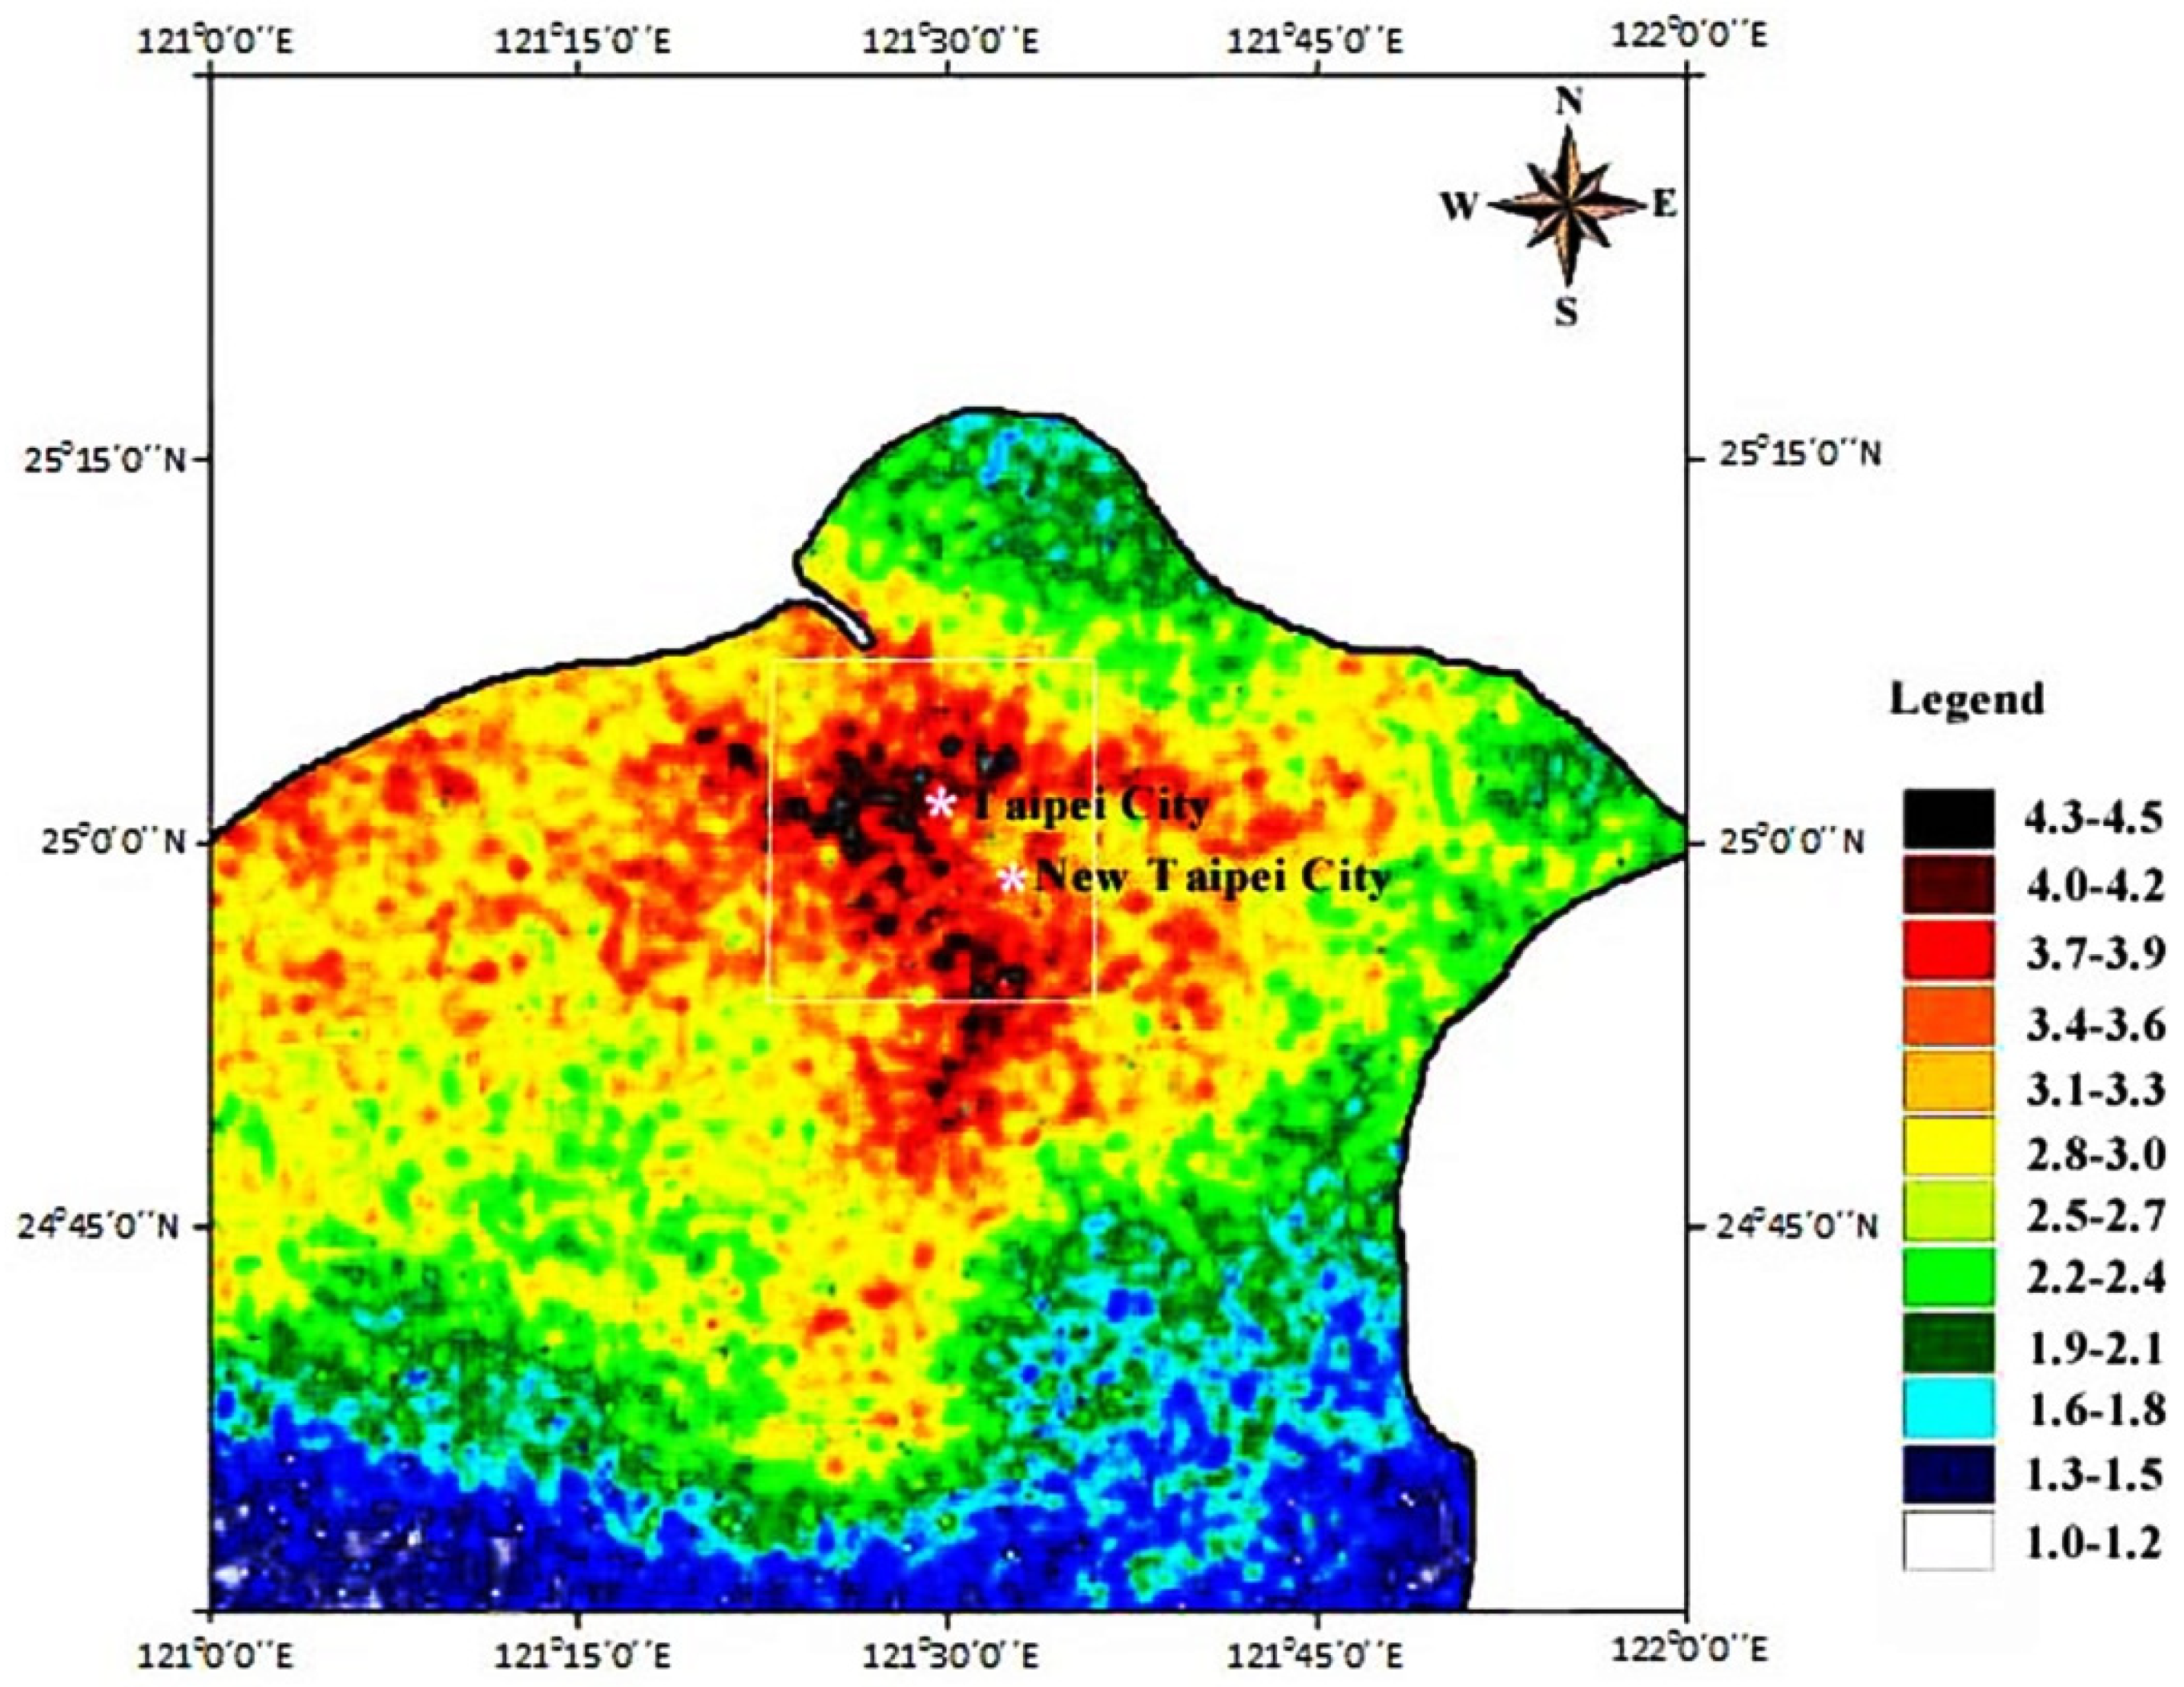
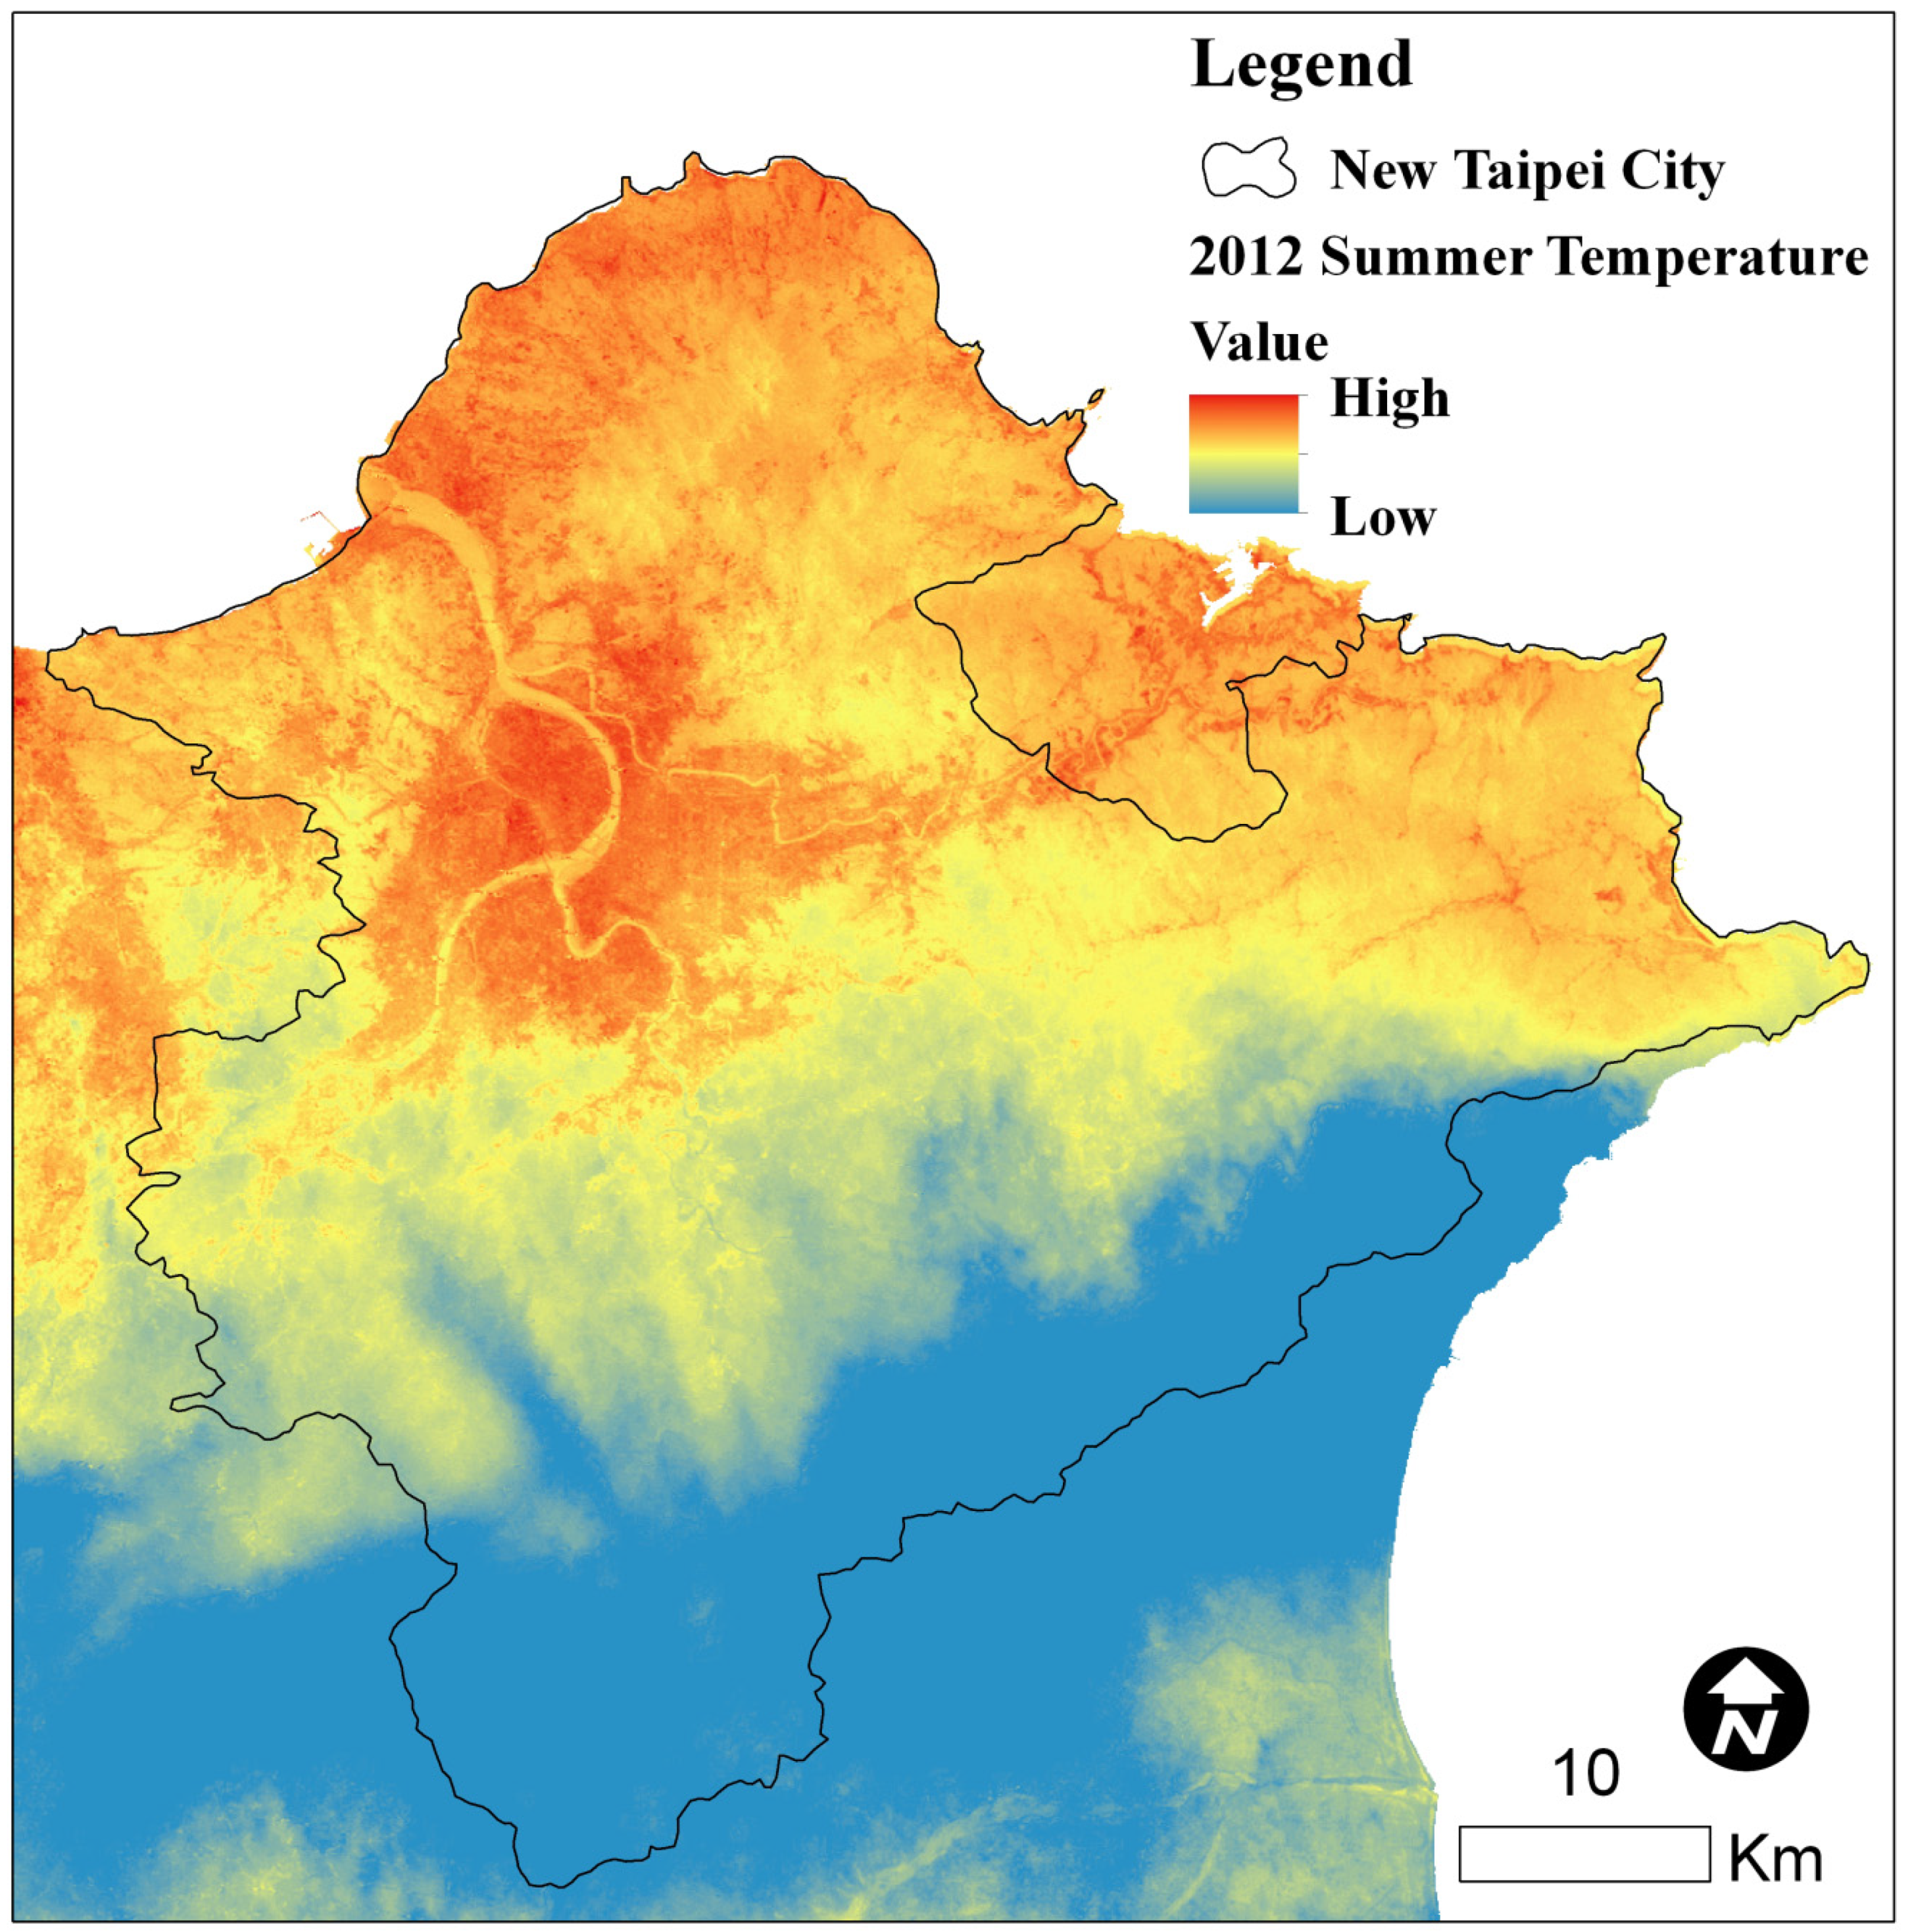
Figure 3,Figure 4 and Figure 5 compare the CG flash density in the northern Taiwan with the geographic position of Taipei City and its apparent surface temperature. Figure 3 presents the urban area of New Taipei City while the CG flash density and the apparent surface temperature over the same region are displayed in Figure 4 and Figure 5, respectively. Figure 3 presents the region where the Taipei City is located (represented by the gray area) within its geopolitical limit. Figure 4 presents the CG flash density for the northern Taiwan computed from the aggregated CG lightning flash data for the period 1998–2012. Spatial distribution of lightning flash density shows clearly an enhancement of the CG flash density over Taipei. The increase of the CG lightning activity for Taipei related to their surroundings was about 60–70%. It is worth mentioning in this context that Taipei has grown vertically over the past 15 years through construction of very tall buildings. It is possible that taller buildings shift the CG:IC ratio on a local scale. That is, a taller vertical profile might be responsible for enhanced CG flashes. Thermal band of the Land-Sat 7 satellite is used to generate Figure 5, which shows the heat island effect. A clear agreement among the three maps is evident, indicating that the CG flashes tend to roughly concentrate over the urbanized area, which also corresponds to the region of highest surface temperature. This result is consistent with the results obtained by Naccarato et al. [30] over large urban areas of Southern Brazil. Furthermore, the CG lightning activity tends to concentrate where the human activities are more intense as is evident from the strong relationship between Figure 3 and Figure 4. This anthropogenic influence results an increase in both the aerosol emissions due to the traffic and industrial activity and the local temperature due to the manmade structures and the lack of vegetation.
The good spatial relationship between the regions of higher number of CG flashes and the higher apparent surface temperature (Figure 4 and Figure 5) might corroborate the thermal effect proposed by Williams and Stanfill [34]. Considering islands to discuss the influence of a portion of land on the cloud electrification and lightning they computed a critical area to assess how large an island should be to guarantee continental behavior. Thermal hypothesis indicated that the critical area required was 110 km2 while that of was about 20,000–30,000 km2 according to aerosol hypothesis. Moreover, the suppression of coalescence over the continent was discussed by them considering the traditional thermal hypothesis according to which the larger updrafts over land would permit less time for droplets to interact for coalescence, thus preventing the warm rain. They finally concluded that the thermal hypothesis could better explain the appreciable difference in the lightning activity between land and sea than the aerosol theory. In the case of our present study the thermal hypothesis could explain well the enhancement of CG flashes over these warmer regions particularly for the Taipei City, which is similar to islands in sea and where the heat island has area about 1600 km2 much larger than the critical area. A further support to the thermal hypothesis showed that the land-sea breeze convergence over Houston combined with the UHI might intensify the thunderstorm generation over the city [35].
The total CG lightning flashes measured during warm seasons for 1998–2012 are presented along with best fit line in Figure 6. It is seen from Figure 6 that lightning increases systematically during this period. This increasing trend in lightning activity suggests that either cloud top heights or amount of deep clouds during monsoon have increased in last few years. This increasing trend of CG lightning is also in phase with population growth and land use change as shown in Figure 2 during this period.
4. Discussion
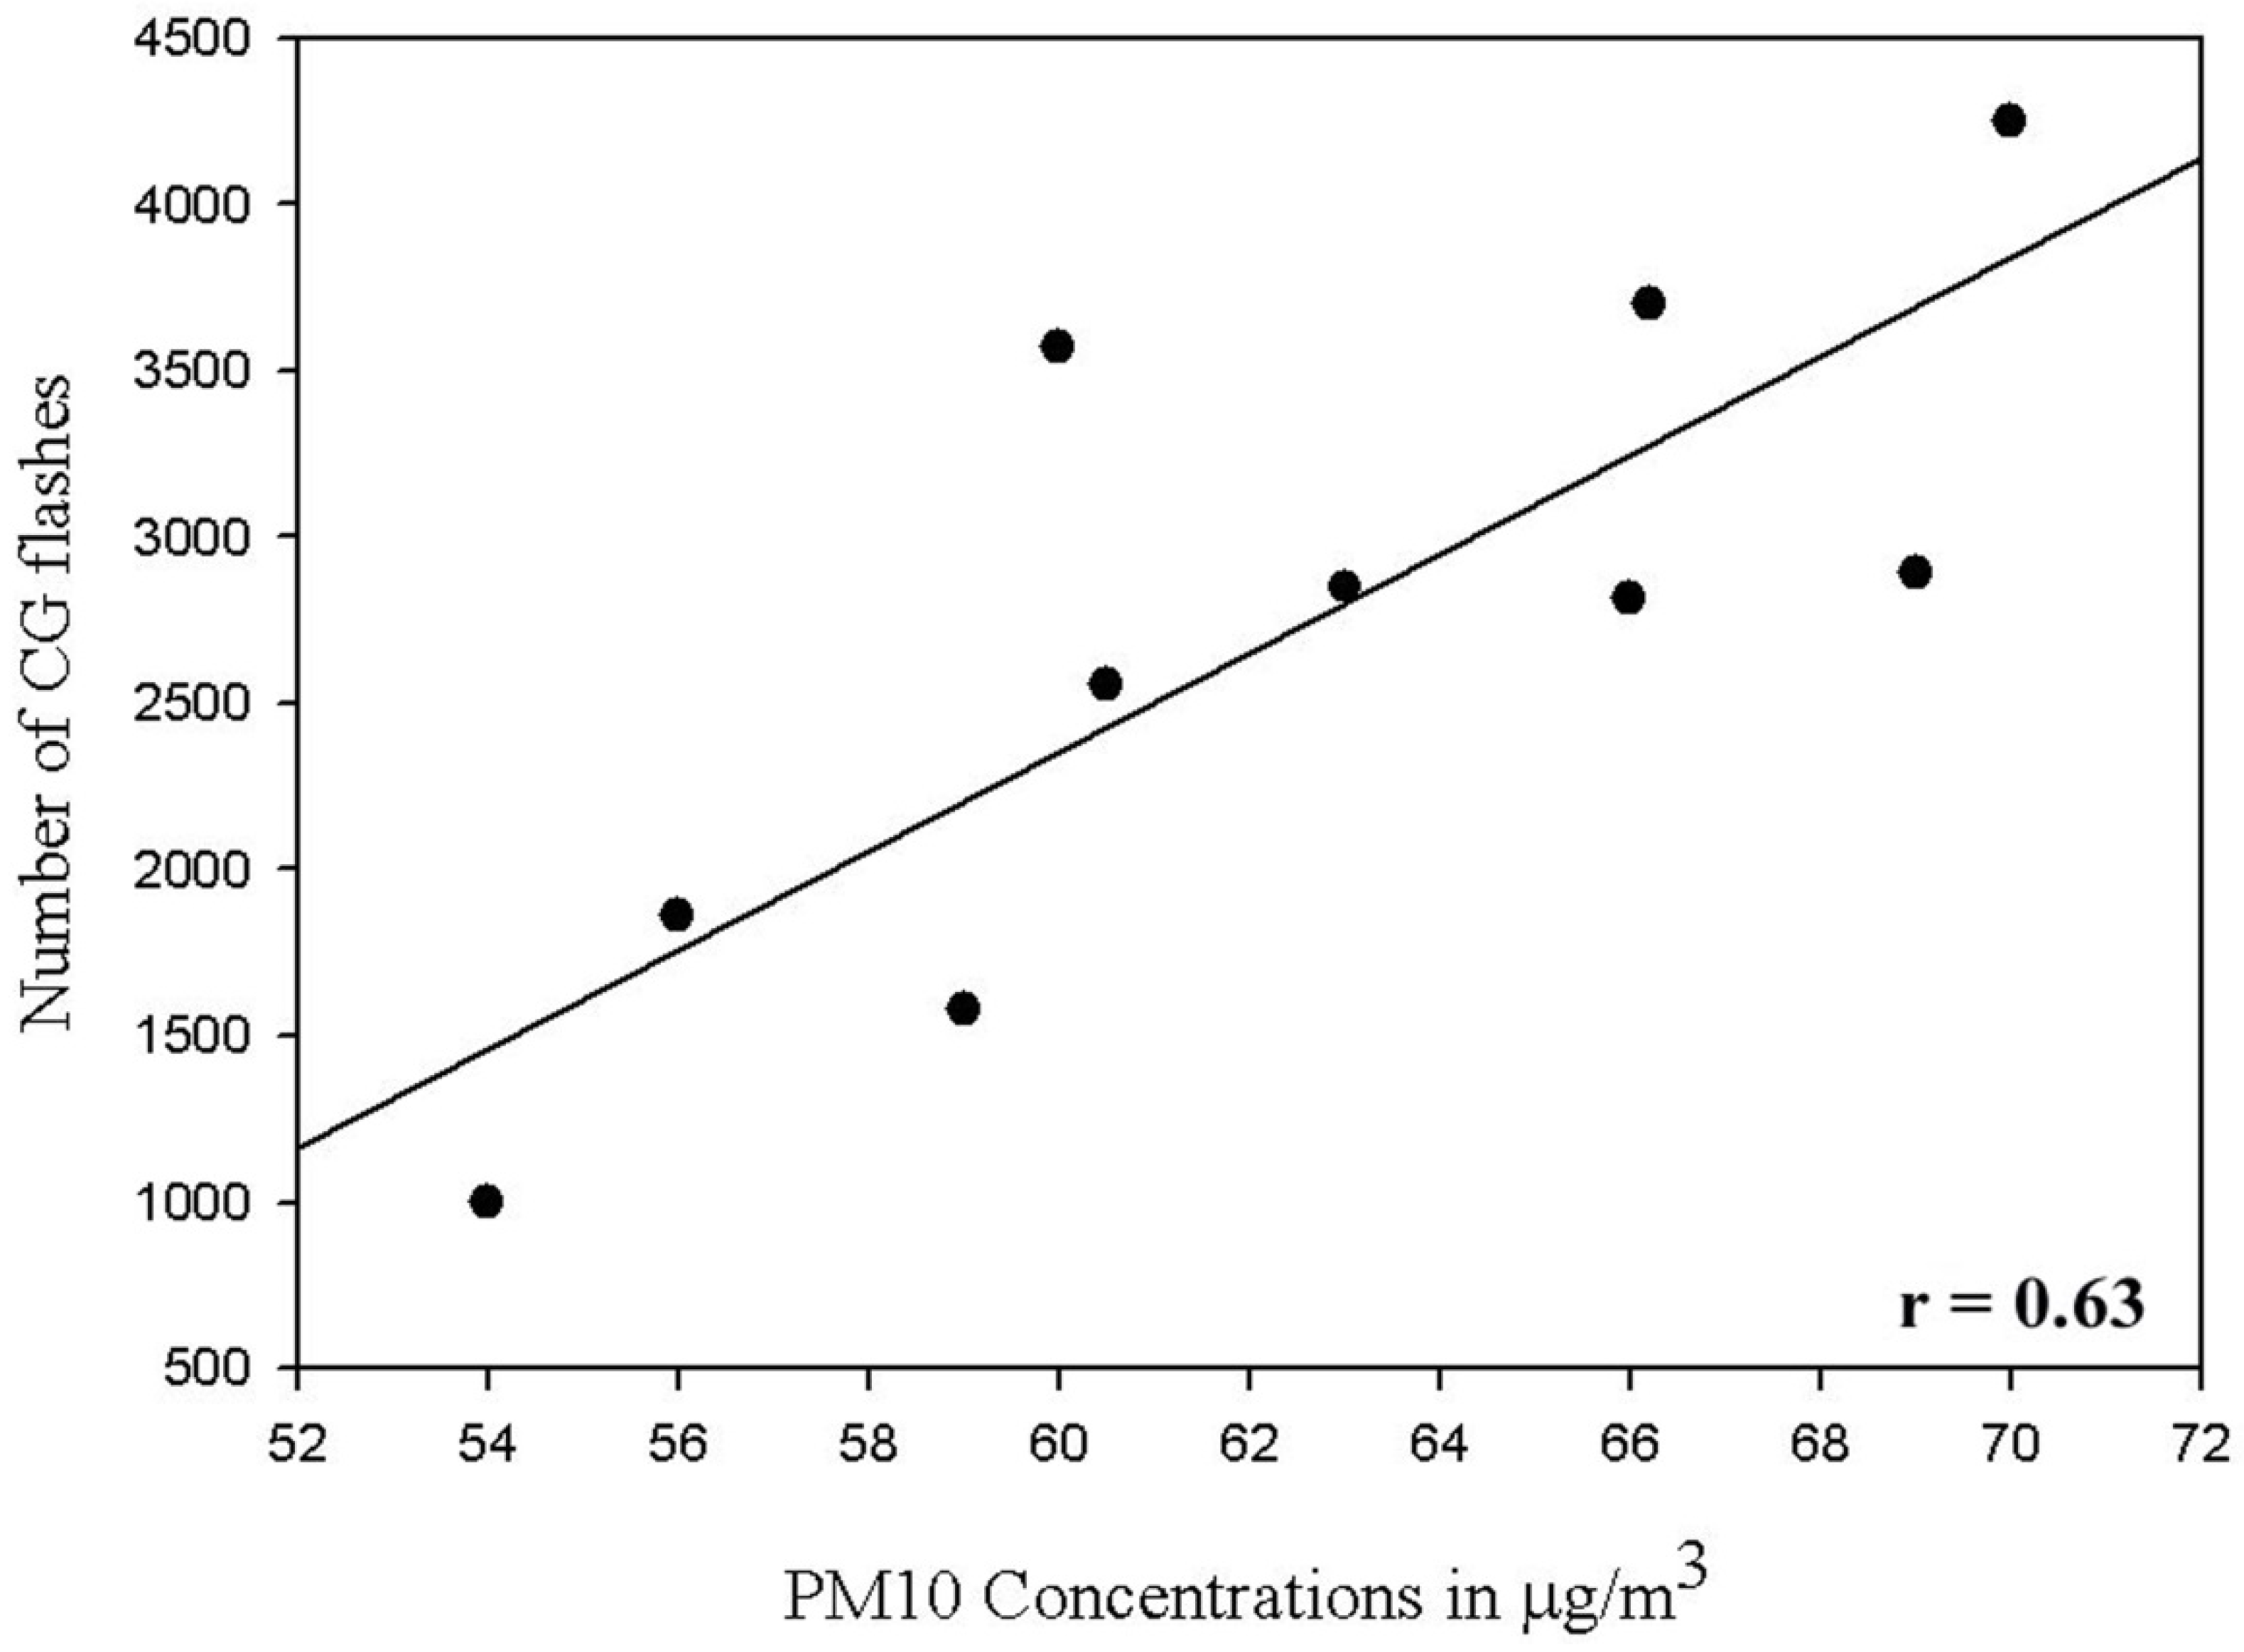
Many studies in the recent years have shown that lightning activity in a region can be affected by changes in thermo-dynamical properties as well as increase in aerosol concentration [5,36,37]. The annual averages of PM10 and SO2 concentrations for Taipei City have been considered in relation to the number of CG flashes to ascertain the possible effect of urban particulate matter on CG lightning activity. Figure 7 and Figure 8 show the scatter plots of CG lightning flashes with PM10 and SO2 concentrations, respectively, along with best fit line. Both the figures exhibit a positive correlation between the two plotted parameters with correlation coefficients 0.63 and 0.71 for the PM10 and SO2 concentrations, respectively. The correlations in Figure 7 and Figure 8 are statistically significant at the 1% significance level. A slight higher correlation coefficient is found between SO2 concentrations and CG lightning flashes compared to that of PM10 and CG lightning flashes. Since the sulphate particles are usually more active in the formation of cloud droplets compared to PM10, a slight higher contribution from SO2 concentration is expected to enhance the CG lightning compared with the PM10 concentration [38]. Our results partially correspond to the results of Soriano et al. [39], but corroborate well the reports of Westcott [1]. These results indicate a possible influence of aerosol concentrations on the number of CG lightning flashes. The results are consistent with previous studies [40,41,42,43], suggesting the enhancement of lightning activity in polluted atmospheric conditions when compared to aerosol clear ones. However, the production of CG lightning is enhanced by the increase cloud water in the mixed phase region and is paralleled by an increase in the electrical charge separation [35].
The Taipei City and its suburbs are surrounded by mountains with two major openings through River valleys. During the warm season, the comparatively cold moist air is transported by sea breezes into the Taipei City through these two river valleys. This moist air is then warmed by urban heat of Taipei City and converges towards the mountains situated south of the city. Convective overturning of moist air is expected to take place because of the orographic forcing facilitating the process of cumulus convection. Thus a zone of higher lightning frequency over Taipei City and its suburbs is formed which is likely enhanced by the warm moist sea breezes and the urban heat [27]. From our results, it is evident that for Taipei the lightning activity showed a significant increase with respect to their surrounding areas during the period of study with a simultaneously increase of surface temperature well correlated with the population growth of the city in terms of population. The results did not reflect anything expected from natural climate cycles and provide clear observational evidence for the anthropogenic influence related to the urban influence on enhanced lightning activity. It is also evident that during the past four decades the daily mean surface temperature of Taipei City has increased 1.6 °C. Therefore, it is highly expected that this urban environment change must have a significant effect on the increase in CG lightning frequency, as observed in Figure 4, over Taipei and its suburbs. Moreover, during the past four decades, the population of Taipei and its built-up area, both, have increased by a factor of 2.5 and 1.8, respectively. Most of the LULC change in Taipei and its suburbs is resulted either by building construction or by various urban surface developments. Penetration of sea breezes through two river valleys is expected to be obstructed by the increased surface roughness over the northwest slopes of the mountains south of Taipei City as indicated by Chen et al. [18], since most of the constructions are concentrated over these regions. This retardation of surface airflow may also lead to an enhancement of low-level convergence over the downwind of major constructed lands and subsequent increase in CG lightning flashes.
5. Conclusions
It has been found from the present study that over Taipei City the enhancement of CG lightning activity follows closely the increase of the apparent surface temperature, which indicates the heat island, thus corroborate the thermal hypothesis. In addition to population growth and land use increase, increased pollution and anthropogenic aerosols are also good indicators of urbanization of any city. Therefore, an assessment of the possible impact of aerosol microphysical forcing on the formation of urban CG lightning is equally important. Apart from the evidence in support of thermal hypothesis, a positive linear correlation between the number of CG flashes and a higher concentration of both SO2 and PM10 has also been found, indicating that the aerosol hypothesis is equally important to support the increase of the number of CG flashes. Positive correlations of 0.63 and 0.71 are found for the PM10 and SO2 concentrations, respectively, when compared separately with the number of CG flashes. This higher positive correlation strongly supports that aerosols play a key role in the enhancement of lightning activity over Taipei City. Williams et al. [44] first proposed that under continental and dirty boundary layer conditions, the available liquid water in the storm updraft is shared amongst an innumerable number of small droplets, thereby suppressing the mean droplet size and thwarting the coalescence process. As a result, the cloud water reaches the mixed phase region to participate in creating excess cloud buoyancy, in precipitation formation, and in electric charge separation and increasing the lightning activity. Therefore, based on possible increases of pollution and aerosols, the contribution of aerosol–microphysical forcing to CG lightning enhancement over Taipei city and its suburbs seems reasonable. It is worth mentioning in this context that both hypotheses act on the same way, probably with combined interaction, at least for the enhancement of CG lightning activity.
It is evident from the perspective of local atmospheric dynamics that the UHI, sea breeze and orographic interaction plays a significant role in the formation of urban CG lightning within the New Taipei City. The spatial variability of CG lightning activity over Taipei is also influenced by the aerosol microphysical forcing. This observation corroborates well the findings of Sequera et al. [45] that combined impact of aerosol and UHI plays crucial role in enhancing the lightning activity over Taipei. It is worth mentioning in this context that the aerosol effects or urban heat island may not only be responsible for the observed trends of lightning over Taipei; the synoptic variability can also affect these trends with equal probability. However, it is a challenging task to quantify the individual contributions of these two physical processes based on present observations because of the complexity of urban modifications of both dynamic and physical processes over this area. Therefore, extensive research is highly needed to fully understand this complex physical mechanism. The present study not only helps to understand the influence of urbanization on the local microclimate system, but also provide valuable environmental information for future urban planning and environmental management.
Author Contributions
“Conceptualization, S.K.K.; Y.-A.L.; Methodology, S.K.K.; Formal Analysis, S.K.K.; Investigation, S.K.K.; Data Curation, S.K.K.; Y.-A.L.; Writing-Original Draft Preparation, S.K.K.; Writing-Review & Editing, S.K.K.; Y.-A.L.; Visualization, Y.-A.L.; Supervision, Y.-A.L.; Project Administration, Y.-A.L.; Funding Acquisition, Y.-A.L.
Funding
This study was supported by the Ministry of Science and Technology (MOST) of Taiwan for financial support through grant nos. 105-2221-E-008-056-MY3 and 107-2111-M-008-036.
Acknowledgments
The authors are thankful to Tai-Power Company of Taiwan for providing lightning data. We are grateful to United States Geological Survey (USGS) for providing Landsat images. Thanks are also given to the Ministry of Science and Technology (MOST) of Taiwan for financial support through grant nos. 105-2221-E-008-056-MY3 and 107-2111-M-008-036. We are also extremely grateful to the anonymous reviewers for their valuable critical comments, which helped us a lot to improve this manuscript.
Conflicts of Interest
The authors declare no conflict of interest.
References
- Westcott, N.E. Summertime cloud-to-ground lightning activity around major Midwestern urban areas. J. Appl. Meteorol. 1995, 34, 1633–1642. [Google Scholar] [CrossRef]
- Steiger, S.M.; Orville, R.E.; Huffines, G. Cloud-to-ground lightning characteristics over Houston, Texas: 1989–2000. J. Geophys. Res. 2002, 107, 4117. [Google Scholar] [CrossRef]
- Pinto, O., Jr.; Pinto, I.R.C.A.; Ferro, M.A.S. A study of the long-term variability of thunderstorm days in southeast Brazil. J. Geophys. Res. Atmos. 2013, 118, 5231–5246. [Google Scholar] [CrossRef] [Green Version]
- Farias, W.R.G.; Pinto, O., Jr.; Pinto, I.R.C.A.; Naccarato, K.P. The influence of urban effect on lightning activity: Evidence of weekly cycle. Atmos. Res. 2014, 135–136, 370–373. [Google Scholar] [CrossRef]
- Kar, S.K.; Liou, Y.A. Enhancement of cloud-to-ground lightning activity over Taipei, Taiwan in relation to urbanization. Atmos. Rese. 2014, 147–148, 11–120. [Google Scholar] [CrossRef]
- Bourscheidt, V.; Pinto, O.; Naccarato, K.P. The effects of Sao Paulo urban heat island on lightning activity: Decadal analysis (1999–2009). J. Geophys. Res. Atmos. 2016, 121, 4429–4442. [Google Scholar] [CrossRef]
- Allen, J.T.; Allen, E.R. A review of severe thunderstorms in Australia. Atmos. Res. 2016, 178–179, 347–366. [Google Scholar] [CrossRef]
- Atkinson, B.W. Numerical modeling of urban heat island intensity. Bound. Layer Meteorol. 2003, 109, 285–310. [Google Scholar] [CrossRef]
- Kim, Y.-H.; Baik, J.J. Daily maximum urban heat island intensity in large cities of Korea. Theor. Appl. Climatol. 2004, 79, 151–164. [Google Scholar] [CrossRef]
- Galanaki, E.; Kotroni, V.; Lagouvardos, K.; Argiriou, A.A. ten-year analysis of cloud-to-ground lightning activity over the Eastern Mediterranean region. Atmos. Res. 2015, 166, 213–222. [Google Scholar]
- Kingfield, D.M.; Calhoun, K.M.; De Beurs, K.M.; Henebry, G.M. Effects of City Size on Thunderstorm Evolution Revealed through a Multiradar Climatology of the Central United States. J. Appl. Meteorol. Climatol. 2018, 57, 295–317. [Google Scholar] [CrossRef]
- Thanh Hoan, N.; Liou, Y.A.; Nguyen, A.K.; Sharma, R.C.; Phien, T.D.; Liou, C.L.; Cham, D.D. Assessing the effects of land-use types in surface urban heat islands for developing comfortable living in Hanoi City. Remote Sens. 2018, 10, 1965. [Google Scholar] [CrossRef]
- Chang, T.-Y.; Liou, Y.A.; Lin, C.Y.; Liu, C.S.; Wang, Y.C. Evaluation of surface heat fluxes in Chiayi plain of Taiwan by remotely sensed data. Int.l J. Remote Sens. 2010, 31, 3885–3898. [Google Scholar] [CrossRef]
- Changnon, S.A.; Braham, R.R.; Semonin, R.G.; Auer, A.H.; Hales, J. METROMEX: A Review and Summary. Meteor. Monogr. 1981, 40, 181. [Google Scholar]
- Huff, F.A. Urban hydrometeorology review. Bull. Am. Meteorol. Soc. 1986, 67, 703–712. [Google Scholar] [CrossRef]
- Rosenfeld, D. Suppression of rain and snow by urban air pollution. Science 2000, 287, 1793–1796. [Google Scholar] [CrossRef]
- Ramanathan, V.; Crutzen, P.J.; Kiehl, J.T.; Rosenfeld, D. Aerosols, climate, and the hydrological cycle. Science 2001, 294, 2119–2124. [Google Scholar] [CrossRef]
- Borys, R.D.; Lowenthal, D.H.; Cohn, S.A.; Brown, W.O.J. Mountain and radar measurements of anthropogenic aerosol effects on snow growth and snowfall rate. Geophys. Res. Lett. 2003, 30, 1538. [Google Scholar] [CrossRef]
- Kitada, T.; Okamura, K.; Tanaka, S. Effects of topography and urbanization on local winds and thermal environment in the Nohbi Plain, coastal region of central Japan: A numerical analysis by mesoscale meteorological model with a k-ε turbulence model. J. Appl. Meteorol. 1998, 37, 1026–1046. [Google Scholar] [CrossRef]
- Chen, T.-C.; Wang, S.-Y.; Yen, M.-C. Enhancement of afternoon thunderstorm activity by urbanization in a valley: Taipei. J. Appl. Meteorol. Climatol. 2007, 46, 1324–1340. [Google Scholar] [CrossRef]
- Lin, C.-Y.; Chen, F.; Huang, J.C.; Chen, W.-C.; Liou, Y.-A.; Chen, W.-N.; Liu, S.-C. Urban heat island effect and its impact on boundary layer development and land–sea circulation over northern Taiwan. Atmos. Environ. 2008, 42, 5635–5649. [Google Scholar] [CrossRef]
- Chung, Y.-S.; Yoon, M.-B.; Kim, H.-S. On climate variations and changes observed in South Korea. Clim. Chang. 2004, 66, 151–161. [Google Scholar] [CrossRef]
- Trenberth, K.E.; Jones, P.D.; Ambenje, P.; Bojariu, R.; Easterling, D.; Tank, A.K.; Parker, D.; Rahimzadeh, F.; Renwick, J.A.; Rusticucci, M.; et al. Observations: Surface and atmospheric climate change. In Climate Change 2007: The Physical Science Basis. Contribution of Working Group I to the Fourth Assessment Report of the Intergovernmental Panel on Climate Change; Solomon, S., Qin, D., Manning, M., Chen, Z., Marquis, M., Averyt, K.B., Tignor, M., Miller, H.L., Eds.; Cambridge University Press: Cambridge, MA, USA, 2007. [Google Scholar]
- Lin, W.-Z.; Tsai, H.-C.; Wang, C.-H.; Teng, W.-H. Urbanization-induced regional climate change on the western plain of Taiwan for the period 1964~1999. In Proceedings of the WSEAS International Conference on Environment, Ecosystems and Development, Venice, Italy, 2–4 November 2005; pp. 7–13. [Google Scholar]
- Fujibe, F. Detection of urban warming in recent temperature trends in Japan. Int. J. Climatol. 2009, 29, 1811–1822. [Google Scholar] [CrossRef] [Green Version]
- Kar, S.K.; Liou, Y.-A.; Ha, K.-J. Characteristics of cloud-to-ground lightning activity over Seoul, South Korea in relation to an urban effect. Ann. Geophys. 2007, 25, 2113–2118. [Google Scholar] [CrossRef] [Green Version]
- Liou, Y.A.; Kar, S.K. Study of cloud-to-ground lightning and precipitation and their seasonal and geographical characteristics over Taiwan. Atmos. Res. 2010, 95, 115–122. [Google Scholar] [CrossRef]
- Richard, P.; Auffray, G. VHF-UHF interferometric measurements, applications to lightning discharge mapping. Radio Sci. 1985, 20, 171–192. [Google Scholar] [CrossRef]
- Richard, P.; Delannoy, A.; Labaune, G.; Laroche, P. Results of spatial and temporal characterization of the VHF–UHF radiation of lightning. J. Geophys. Res. 1986, 91, 1248–1260. [Google Scholar] [CrossRef]
- Naccarato, K.P.; Pinto, O., Jr.; Pinto, I.R.C.A. Evidence of thermal and aerosol effects on the cloud-to-ground lightning density and polarity over large urban areas of Southeastern Brazil. J. Geophys. Res. Lett. 2003, 30, 1674–1677. [Google Scholar] [CrossRef]
- Orville, R.E. Cloud-to-ground lightning flash characteristics in the contiguous United States: 1989–1991. J. Geophys. Res. 1994, 99, 10833–10841. [Google Scholar] [CrossRef]
- Finke, U.; Hauf, T. The characteristics of lightning occurrence in Southern Germany. Beitr. Phys. Atmos. 1996, 69, 361–374. [Google Scholar]
- Pinto, O., Jr.; Pinto, I.R.C.A.; Gomes, M.A.S.S.; Vitorello, I.; Padilha, A.L.; Diniz, J.H.; Carvalho, A.M.; CazettaFilho, A. Cloud-to-ground lightning in southeastern Brazil in 1993. 1: Geographical distribution. J. Geophys. Res. 1999, 104, 31369–31379. [Google Scholar] [CrossRef]
- Williams, E.R.; Stanfill, S. The physical origin of the land-ocean contrast in lightning activity. Comp. Rendus Phys. 2002, 3, 1277–1292. [Google Scholar] [CrossRef]
- Orville, R.E.; Huffines, G.R.; Nielsen-Gammon, J.; Zhang, R.; Ely, B.; Steiger, S.; Phillips, S.; Allen, S.; Read, W. Enhancement of cloud-to-ground lightning over Houston, Texas. Geophys. Res. Lett. 2001, 28, 2597–2600. [Google Scholar] [CrossRef] [Green Version]
- Khain, A.; Lynn, B.; Dudhia, J. Aerosol effects on intensity of landfalling hurricanes as seen from simulations with the WRF model with spectral binmicrophysics. J. Atmos. Sci. 2010, 67, 365–384. [Google Scholar] [CrossRef]
- Kar, S.K.; Liou, Y.-A.; Ha, K.-J. Aerosol effects on the enhancement of cloud-to-ground lightning over major urban areas of South Korea. Atmos. Res. 2009, 92, 80–87. [Google Scholar] [CrossRef]
- Seinfeld, J.M. Air Pollution: Physical and Chemical Fundamentals; McGraw-Hill Co.: New York, NY, USA, 1975; p. 558. [Google Scholar]
- Soriano, L.R.; Pablo, F. Effect of small urban areas in central Spain on the enhancement of cloud-to-ground lightning activity. Atmos. Environ. 2002, 36, 2809–2816. [Google Scholar] [CrossRef]
- Farias, W.R.G.; Pinto, O., Jr.; Naccarato, K.P.; Pinto, I.R.C.A. Anomalous lightning activity over the Metropolitan Region of São Paulo due to urban effects. Atmos. Res. 2009, 91, 485–490. [Google Scholar] [CrossRef]
- Kucienska, B.; Raga, G.B.; Koren, I.; Altaratz, O. Do aerosols affect lightning? A global study of a relation between aerosol optical depth and cloud to ground lightning. In Proceedings of the XV International Conference on Atmospheric Electricity, Norman, OK, USA, 15–20 June 2014. [Google Scholar]
- Yang, X.; Li, Z. Increases in thunderstorm activity and relationships with air pollution in southeast China. J. Geophys. Res. Atmos. 2014, 119, 1835–1844. [Google Scholar] [CrossRef] [Green Version]
- Zhao, P.; Yin, Y.; Xiao, H. The effects of aerosol on development of thunderstorm electrification: A numerical study. Atmos. Res. 2015, 153, 376–391. [Google Scholar] [CrossRef]
- Williams, E.R.; Rosenfeld, D.; Madden, N.; Labrada, C.; Gerlach, J.; Atkinson, L. The role of boundary layer aerosol in the vertical development of precipitation and electrification: Another look at the contrast between lightning over land and over ocean. Reprints. In Eleventh International Conference on Atmospheric Electricity; American Meteorological Society: Boston, MA, USA, 1999; pp. 754–757. [Google Scholar]
- Sequera, P.; González, J.E.; McDonald, K.; Bornstein, R.; Comarazamy, D. Combined impacts of land cover changes and large-scale forcing on southern California summer daily maximum temperatures. J. Geophys. Res. Atmos. 2015, 120, 9208–9219. [Google Scholar] [CrossRef]
Figure 1.
Location of the sensors used in the Total Lightning Detection System (TLDS) of Tai-Power Company, Taiwan.
Figure 1.
Location of the sensors used in the Total Lightning Detection System (TLDS) of Tai-Power Company, Taiwan.

Figure 2.
Long-term variation of (a) the population of New Taipei City and Taipei City; (b) built-up area in New Taipei City (pink line), Taipei City (green line), and the twin cities combined (black); and (c) the summer daily mean surface temperature of Taipei along with linear trend for the period 1965–2010 (according to the twin city governments).

Figure 3.
Landsat image showing the expansion of urbanization over New Taipei City and Taipei City and their surrounding areas. Areas in green are uninhabited land covered by vegetation or forest, and areas in light cyan are inhabited regions. Deep blue indicates water bodies. Off white areas are the expansions of urbanization. Bright green line and Yellow line indicates the boundary of Taipei City and New Taipei City, respectively.

Figure 4.
Lightning flash density in flashes.km–2 for Taipei City and New Taipei City with 1 km resolution.
Figure 4.
Lightning flash density in flashes.km–2 for Taipei City and New Taipei City with 1 km resolution.

Figure 5.
Apparent surface temperature of Taipei City and New Taipei City computed using LandSat-7 thermal data.
Figure 5.
Apparent surface temperature of Taipei City and New Taipei City computed using LandSat-7 thermal data.

Figure 6.
Variation of total CG lightning during warm seasons (May–October) over Taipei.

Figure 7.
Scatter plot of the number of CG flashes and annual averages of PM10 concentrations.

Figure 8.
Scatter plot of the number of CG flashes and annual averages of SO2 concentrations.

© 2019 by the authors. Licensee MDPI, Basel, Switzerland. This article is an open access article distributed under the terms and conditions of the Creative Commons Attribution (CC BY) license (http://creativecommons.org/licenses/by/4.0/).
Share and Cite
MDPI and ACS Style
Kar, S.K.; Liou, Y.-A. Influence of Land Use and Land Cover Change on the Formation of Local Lightning. Remote Sens. 2019, 11, 407. https://doi.org/10.3390/rs11040407
AMA Style
Kar SK, Liou Y-A. Influence of Land Use and Land Cover Change on the Formation of Local Lightning. Remote Sensing. 2019; 11(4):407. https://doi.org/10.3390/rs11040407
Chicago/Turabian StyleKar, Sanjib Kumar, and Yuei-An Liou. 2019. "Influence of Land Use and Land Cover Change on the Formation of Local Lightning" Remote Sensing 11, no. 4: 407. https://doi.org/10.3390/rs11040407
Note that from the first issue of 2016, this journal uses article numbers instead of page numbers. See further details here.