Improving an Extreme Rainfall Detection System with GPM IMERG data


1
ITHACA—Information Technology for Humanitarian Assistance, Cooperation and Action, 10138 Torino, Italy
2
Politecnico di Torino, Dipartimento di Ingegneria dell’Ambiente, del Territorio e delle Infrastrutture, 10129 Torino, Italy
3
Politecnico di Torino, Dipartimento Interateneo di Scienze, Progetto e Politiche del Territorio, 10125 Torino, Italy
*
Author to whom correspondence should be addressed.
Remote Sens. 2019, 11(6), 677; https://doi.org/10.3390/rs11060677
Submission received: 11 January 2019
/
Revised: 16 March 2019
/
Accepted: 19 March 2019
/
Published: 21 March 2019
(This article belongs to the Section Atmospheric Remote Sensing)
Abstract
:Many studies have shown a growing trend in terms of frequency and severity of extreme events. As never before, having tools capable to monitor the amount of rain that reaches the Earth’s surface has become a key point for the identification of areas potentially affected by floods. In order to guarantee an almost global spatial coverage, NASA Global Precipitation Measurement (GPM) IMERG products proved to be the most appropriate source of information for precipitation retrievement by satellite. This study is aimed at defining the IMERG accuracy in representing extreme rainfall events for varying time aggregation intervals. This is performed by comparing the IMERG data with the rain gauge ones. The outcomes demonstrate that precipitation satellite data guarantee good results when the rainfall aggregation interval is equal to or greater than 12 h. More specifically, a 24-h aggregation interval ensures a probability of detection (defined as the number of hits divided by the total number of observed events) greater than 80%. The outcomes of this analysis supported the development of the updated version of the ITHACA Extreme Rainfall Detection System (ERDS: erds.ithacaweb.org). This system is now able to provide near real-time alerts about extreme rainfall events using a threshold methodology based on the mean annual precipitation.

1. Introduction
According to the IPCC (Intergovernmental Panel on Climate Change), “an extreme weather event is an event that is rare at a particular place and time of year. Definitions of rare vary, but an extreme weather event would normally be as rare as or rarer than the 10th or 90th percentile of a probability density function estimated from observations. By definition, the characteristics of what is called extreme weather may vary from place to place in an absolute sense” [1].
Although the definition of these phenomena is not univocal (extreme conditions in one location can be normal in another one), their effect and their consequences, unfortunately, are clear and easily identifiable. As never before, having tools capable of monitoring the amount of rain that affects the Earth’s surface has become a key point for the timely identification of areas potentially affected by floods [2].
In order to face this problem on a global scale, it is necessary to work with data acquired on a continuous basis and made available in real time. Satellites play an important role in the measurement field on a global scale. The main feature concerns the possibility of carrying out a measurement on huge areas of the Earth’s surface (satellites have a more extensive coverage compared to other instruments). For this reason, in the last decades, a great effort has been made to improve the precipitation measurement by satellite data.
Nowadays, a number of early warning systems are freely available: European Flood Awareness System (EFAS) [3], Global Flood Monitoring System (GFMS) [4] and Dartmouth Flood Observatory (DFO) [5] are some examples. They are operating at large scales, with updating cycles in the range of hours to days [6]. Their performances highlight that some gaps (in particular, when we focus on local scales) will remain until new data become available and better approaches are established [7].
The Extreme Rainfall Detection System (ERDS: erds.ithacaweb.org), developed and implemented by ITHACA [8], is a demo service for the monitoring and forecasting of exceptional rainfall events, with a nearly global spatial coverage. ERDS is also an alert system designed to identify hydrometeorological events (such as hurricanes, tropical storms, convective storm, flash flood and heavy rainfall that could lead to flood events or landslides). The information is accessible through a WebGIS application, developed in a complete Open Source environment.
The original version of this system was using NASA TRMM (Tropical Rainfall Measuring Mission) TMPA (TRMM Multi-satellite Precipitation Analysis) 3-hourly data as input. Due to the TRMM instrument shutdown that happened during 8 April 2015 [9], an alternative rainfall source had to be investigated. Currently available satellite rainfall measurements (NASA GPM IMERG, PERSIANN, PERSIANN-CCS and GSMaP) were evaluated, taking into consideration the importance of working with a source of information with a high spatial coverage, a high spatial resolution, a frequent update and a low latency. NASA GPM (Global Precipitation Measurement) data have been chosen for this purpose. This paper describes the analysis performed to adapt ERDS to this newly available satellite data and to increase its accuracy.
The GPM Mission, designed and managed by NASA and JAXA, uses a Core satellite launched on 27 February 2014 and a constellation of international satellites [10]. Thanks also to the other satellites, it is possible to guarantee a covering region between 65°N and 65°S.
The Core satellite has multiple sensors on board (it carries an active and a passive precipitation sensor). These two sensors are a Dual-frequency Precipitation Radar (DPR) and a GPM Microwave Imager (GMI) [10]. While TRMM was designed to measure moderate to heavy rainfall in tropical and subtropical areas, GPM can measure from light rain to heavy rain. Unlike TRMM, GPM Core satellite can also measure snow thanks to GMI high frequency.
The GPM Mission provides different IMERG (Integrated Multi-satellite Retrievals for GPM) products since 12 March 2014. The IMERG algorithm was developed to intercalibrate, merge and interpolate satellite microwave precipitation measurements, microwave-calibrated infrared (IR) satellite measurements, rain gauge analyses and, potentially, other ancillary precipitation estimators. These gridded and georeferenced products are characterized by a spatial coverage between 60°N–60°S and a spatial resolution of 0.1° × 0.1° [11]. The products are provided at several temporal resolutions: 30 min, 3 h, 1 day, 3 days, 7 days and 1 month [12]. The data that were chosen for a near real-time extreme rainfall detection are the ones available in a grid format at a temporal resolution of 30 min. The other aggregation intervals would have led to a longer latency in the provision of alerts.
IMERG products are available in three different versions [11]: early run [13] (with a 4 h latency), late run [14] (with a 12 h latency) and final run (with a 2.5 months latency). The early and late products are multi-satellite data. The final run is, instead, obtained taking advantage of a combination of information acquired from satellite and monthly rain gauges data. Considering the short delay in their availability, IMERG early and late half-hourly data can be used for near real-time flood risk monitoring applications. Final data are, instead, interesting for research purposes because of their longer latency.
Every half-hourly early and late file contains different data fields, including different versions of the precipitation measurement (precipitationCal, precipitationUncal, HQprecipitation and IRprecipitation) and some additional information [10]. IRprecipitation was discarded due to a reduced accuracy. IR sensors can provide rainfall estimation at a high temporal resolution on large areas. However, this measurement is not good enough due to the indirect linkage between precipitation and IR signal [15]. HQprecipitation, instead, was rejected due to the high number of missing data in every file. Contrary to precipitationUncal, precipitationCal early and late run data are subject to a month/location-varying climatological calibration [10]. After a brief analysis performed comparing the rain gauge historical data with these measurements, precipitationCal proved to be the most appropriate source of rainfall information. Several studies conducted at the local scale confirmed the better performance of precipitationCal compared to precipitationUncal [16,17,18].
A considerable amount of studies was performed in order to investigate the GPM IMERG accuracy on small areas (generally, every study focused on a specific country). Guo et al. [16] analyzed the GPM IMERG performance over the seven Chinese subregions (characterized by different elevations, mountain ranges and mean annual precipitation distributions). The GPM data demonstrated a good performance, except during winter time. The study indicated that GPM data underestimated the rainfall measurement almost everywhere, except for some arid and semiarid zones, where GPM overestimated light rain events. The GPM data proved to be more accurate than the TRMM TMPA ones. Khodadoust Siuki et al. [15] highlighted an underestimation over the northeast of Iran. However, the GPM IMERG data proved to have better performance than the TRMM TMPA data. Sharifi et al. [19] examined the GPM IMERG performance over Iran, confirming the slight underestimation on a daily scale. Good results were obtained with rainfall amounts greater than 15 mm/day during rainy periods or in humid regions. Local underestimation or overestimation over mountainous regions indicates that an accurate satellite-based precipitation measurement remains a challenge in some places of Earth’s surface. An underestimation of the GPM IMERG early run data was also identified by Gaona et al. [17] over the Netherlands and by Sahlu et al. [18] over the Upper Blue Nile basin. Kim et al. [20] validated the GPM IMERG data in Far-East Asia during the pre-monsoon and monsoon seasons, reporting several drawbacks induced by topographical factors in the coastal regions. The study highlighted the higher performance of GPM (compared to TRMM) both in light rainfall and in convective rainfall measurement.
Recent evidence suggested that GPM is also able to provide more accurate information about extreme rainfall events compared to TRMM. Prakash et al. [21] compared both the TRMM TMPA research-quality product (V7) and GPM IMERG final run (V03) with the rain gauge measurements over India. Even though the TMPA data showed a larger probability of detection of heavy rainfall events over most parts of the country, it showed a large false alarm ratio and a relatively small critical success index. Moreover, the IMERG data showed notable improvements over TMPA during the comparison with the rain gauge measurements, especially in mountainous areas. Chen et al. [22] compared both the GPM IMERG V05 data and the TRMM 3B42 V7 data with the rain gauge measurements over the Huaihe River basin (China). This work revealed that both products tend to overestimate rainfall events characterized by rainfall rate between 0.5 to 25 mm/day. Conversely, they tend to underestimate light (0–0.5 mm/day) and heavy (>25 mm/day) rainfall. The underestimation is greater for intensities greater than 100 mm/day. The IMERG data proved to have a better performance in temporal and spatial rainfall detection compared to TRMM.
Although a big effort has been made to investigate the performances at a country/basin scale of the rainfall measurements provided by satellite in the spatial and temporal identification of rainfall events, a small number of studies was conducted in order to increase its accuracy. Moreover, a considerable amount of work is still required to increase the overall accuracy of early warning systems working with remotely sensed measurements as input data.
The research work summarized in this article was conducted keeping in mind this lack and trying to introduce a new methodology and new results in the previously mentioned field. The first objective of this study is the assessment of the IMERG accuracy in the extreme rainfall detection at the global scale for different aggregation intervals. The obtained results (summarized in Section 3.1 and Section 3.2) allowed the definition of the proper aggregation intervals to be used in the second part of the work. The second objective is to propose a new extreme rainfall detection methodology based on event-identification thresholds, different for every place of the world, calibrated taking into account the mean annual rainfall. The methodology is described in Section 2.2 while the results are reported in Section 3.3 and discussed in Section 4. The results of this research were implemented in a freely accessible early warning system.
2. Materials and Methods
2.1. Analysis of the Accuracy of the Input Data
An evaluation of the difference in the accuracy between the early and late products (specifically, IMERG V04A precipitationCal data) was performed in order to quantify whether the gain in accuracy in the late product could be considered negligible with respect to the more promptly available early products considering the final use of the data. This study covered the period from 12 March 2014 to 30 April 2017.
The first step for the evaluation of the GPM IMERG products accuracy was the analysis of the presence of cells with a missing precipitation measurement within the area normally covered by the precipitationCal band (with a spatial extent from 60°N to 60°S for a total of 1200 × 3600 cells) for early and late half-hourly data. The two 30° extended bands present at the poles were neglected since, in these areas, only a few measurements are available. The spatial arrangement of pixels characterized by the absence of data was then analyzed to identify areas possibly subject to a reduction in accuracy due to a systematic absence of measure.
The outcomes of the second part of the analysis allowed the assessment of the most appropriate aggregation intervals usable to provide information regarding the rainfall amount and to evaluate the presence of places potentially affected by hydrometeorological disasters. The IMERG half-hourly early and late products were compared with the rain gauge measurements in order to evaluate their relative accuracy. The present study covered different climatic zones with the aim to carry out a valid analysis on a global scale. Fifty different locations were analyzed (Figure 1). The location choice was the result of a preliminary analysis aimed at identifying institutions [23,24] that collect and publish free rain gauge data with a good temporal resolution. In order to investigate the accuracy even at the sub-daily scale, the rain gauge measurements with a temporal resolution of at least one hour were chosen.
The major limitation of this approach is linked to the biased rain gauge distribution. During the work, the difficulty of finding appropriate reference data emerged. A reduced number of organizations, in fact, provide freely available rain gauge measurements characterized by a good temporal resolution, an almost zero percentage of missing data and a historical series that covers several years.
The following aggregation intervals were considered in order to evaluate the cumulated rainfall and the relative intensity: 1, 2, 3, 6, 12, 24, 48, 72, 96, 120, 144 and 168 h.
For the purpose of performing an assessment of the error that characterizes satellite measures, the bias and mean absolute error were calculated for each location and for the previously mentioned set of aggregation intervals. The bias and mean absolute error are obtained as
where
- n is the total number of time instants;
- t is time;
- RSATELLITE is the average rainfall intensity measured by satellite in the time interval t (expressed in mm/h);
- RGAUGE is the average rainfall intensity measured by rain gauge in the same time interval t (expressed in mm/h).
While the bias defines the average difference between the satellite and rain gauge data (and can be either positive or negative), the mean absolute error provides the average magnitude of the error. Both equations are valid only for nonzero rainfall measurements. These parameters, in fact, quantify the differences between the rainfall estimation and the “true” rainfall (i.e., the rainfall measurement provided by rain gauges). A further study was conducted, taking into consideration only a rainfall rate greater than the 99th percentile of the intensities distribution, with the aim of analyzing the GPM IMERG performance in heavy rainfall detection.
The third part of the analysis consisted of the comparison of the observed and estimated events. For every location and for every aggregation interval previously mentioned, a contingency table (Table 1) was generated. In the contingency table, the occurrences of the following four conditions were reported:
- both rain gauge and satellite data are null (case A, correct negatives);
- nonzero rain gauge data and zero satellite data (case B, misses);
- zero rain gauge data and non-null satellite data (case C, false alarms);
- both rain gauge and satellite data are non-null (case D, hits).
Three indices were derived using these tables as a basis: the false alarm ratio, the probability of detection and the critical success index [25].
The false alarm ratio (FAR) was defined on the basis of elements contained in false alarms and hits cells. The ideal situation is characterized by approximately zero FAR.
The probability of detection (POD) was instead evaluated by combining elements contained in the misses and hits cells. The ideal situation is characterized by a unitary POD value.
The critical success index (CSI) can be expressed in terms of POD and FAR. This parameter, unlike POD and FAR, combines the characteristics of hits, false alarms and misses. Thanks to this link, CSI can help in the identification of the most relevant component. The ideal situation is characterized by a unitary CSI.
2.2. Development of an Extreme Rainfall Detection Methodology
The main purpose of this section is to describe some tests conducted in order to develop a new methodology for detecting extreme rainfall and providing alerts in near real-time and with an almost global spatial coverage. The whole study was conducted using GPM IMERG half-hourly early data as the input.
The methodology is based on the concept of activation threshold: an event is identified when the rainfall exceeds a given threshold value. An “event-identification threshold” (EIT) represents the amount of rainfall needed to trigger a flood event induced by extreme rainfall. EITs are used to define near real-time alerts about extreme rainfall. Specifically, an alert is provided if for a selected time interval the accumulated rainfall exceeds the EIT.
The definition of these thresholds was performed using an empirical approach, analyzing rainfall events that have led to a hydrometeorological disaster. These threshold values, obviously, vary from place to place. Moreover, it is impossible to define a threshold if the aggregation interval is not defined. A longer time interval has, in fact, a higher EIT.
To develop this extreme rainfall detection methodology, the first step was to search databases of natural disasters with a global spatial coverage (in particular, we focused on hydrometeorological ones) to be used as truth data. The main adopted database was EM-DAT (The Emergency Events Database) [26]. EM-DAT has also been integrated using information derived from Reliefweb [27] and Floodlist [28], which allowed us to take into consideration also some flood and flash flood events not present in the previous one. In these three databases, the information is provided at the country-scale (the databases indicate for almost all records the country in which the disaster occurred but not the precise coordinates of the affected areas).
The methodology consisted of the identification of the optimal EIT for different aggregation intervals (12 h, 24 h, 48 h, 72 h and 96 h) and for every place of the world. Each temporal interval was studied separately. The study covered 85 different countries, from 12 March 2014 to 30 April 2017. In 63 of these countries, at least 1 hydrological disaster happened. Further, 22 countries in which no disasters occurred were inserted at a later moment for validation purposes. Globally, 211 different disasters were analyzed.
For every temporal interval and for every country, a series of simulations was performed by varying the threshold from 0 mm to 600 mm with a 5 mm step. For each simulation, the occurrences of the following three conditions were reported:
- the number of “false alarms” (a false alarm is a condition that occurs if, at least in one cell of the examined country, the accumulated rainfall exceeds the threshold but, in that day, no disaster is reported in the database for the examined country);
- the number of “missed alarms” (a missed alarm is a condition that happens if, on the day a disaster has occurred in the examined country, in any cell of the country, the amount of rainfall does not exceed the threshold);
- the number of “hits events” (a hit event is a condition that happens if, on the day a disaster has occurred, the accumulated rainfall exceeds the threshold in at least one cell of the examined country).
In this study, only disasters identified in a properly selected time window are considered as “hits events”. According to the duration of the aggregation interval, different time windows were selected. Specifically, the considered useful days are
- for the aggregation of 12, 24 and 48 h, an interval ranging from 4 days before the start date of the disaster to the following 2 days;
- for the aggregation of 72 h, an interval ranging from 4 days before the start date of the disaster to the following 3 days;
- for the aggregation of 96 h, an interval ranging from 4 days before the start date of the disaster to the following 4 days.
Events identified by ERDS before these 4 days have not been counted as “hits events” because an alert given too early may not be useful. The user, in fact, might think that this is a false alarm, seeing the days go by and not observing the occurrence of any disaster. This false sense of confidence could be as dangerous as a missed alarm. Events identified after the selected time windows were instead considered as “missed events”. ERDS, in fact, is a near real-time alert system. In other words, it is essential to adopt thresholds able to identify extreme events in time.
It was, therefore, necessary to define a criterion for the identification of the optimal EITs. One of the possible approaches takes into account the four conditions reported in the standard contingency table (Table 1). While conditions like correct negatives or hits do not influence in a negative way the reliability of the system, misses and false alarms heavily impact it. In order to evaluate the performances of the early warning system, it is crucial to take into account these two situations (a perfectly working system is, in fact, able to minimize both of them). It was consequently possible to evaluate an indicator based on a weighted sum of both conditions. This led to defining, for every threshold, a cost. This cost is made by two different components: false alarms cost and missed alarms cost. While the false alarm cost is relatively simple to be evaluated (it is mainly influenced by the extra work that local authorities and Civil Protection have to face to put in security the potentially affected area and to monitor the situation), the quantification of the missed alarm cost is a challenging problem. It mainly depends on the losses of human lives, the damage grading reported at buildings and infrastructures, temporary interruption to services, etc. This parameter is, therefore, site-specific and presents a higher value in areas with a high degree of anthropization and population density.
Taking into consideration these aspects, it was, therefore, possible to calculate, for each threshold and for each aggregation interval, the total cost.
where
- TOTAL COSTT(i) is the total cost of threshold T related to the aggregation interval i;
- n F.A. (T(i)) is the number of false alarms related to thresholds T and aggregation interval i;
- n M.A. (T(i)) is the number of missed alarms related to threshold T and aggregation interval i;
- C F.A. is the false alarm cost;
- C M.A. is the missed alarm cost.
Note that CF.A. acts as a scaling factor in Equation (6), and as such, it does not influence the position of the threshold minimizing the total cost. It was, in contrast, necessary to define the ratio between the missed alarm and false alarm costs. Several tests were performed using different ratios (1/2, 1/5, 1/10 and 1/20) in order to investigate how the final results vary as the missed alarm cost increases. After having assessed the proper value, it was possible to determine, for every aggregation interval, the total cost corresponding to every threshold value. From this operation, for every aggregation interval, a curve is obtained. The minimum of the total cost curve is the optimal threshold (i.e., the EIT). The goal is to assess a threshold that allows one to balance missed alarms and false alarms (trying to minimize both missed and false alarms) and to maximize the number of identified events. A high percentage of error (both in terms of missed alarms and in terms of false alarms) is in fact expected to reduce the confidence in the reliability of the early warning system and the value of a warning [29].
It was, therefore, decided to analyze the possible relationship between optimal threshold and mean annual rainfall of the country object of study, with the aim to calibrate the methodology with a site-specific parameter. This total rainfall amount (Figure A2 reported in Appendix A) was calculated using 10 years of GPCC (Global Precipitation Climatology Centre) “Monitoring product” [30] with a 1° resolution. The “Monitoring product” is a monthly global data which is available about 2 months after the end of the month which it refers to. About 7000–9000 stations contribute to this dataset. The “Monitoring product” is recommended by GPCC to be used for applications that need high-quality gridded measures of rainfall.
Unfortunately, the accuracy in the extreme rainfall detection could be affected by the adoption of a single EIT for the entire country. There are, in fact, countries were the mean annual rainfall varies in a significant way. The possibility of adopting thresholds, different for each aggregation interval depending on the average annual rainfall, was therefore explored.
As before, the different aggregation intervals were studied separately. For each of these, a series of simulations using this 1° × 1° total rainfall amount was performed. In every simulation, thresholds equal to a percentage of the mean annual rainfall have been adopted. Specifically, the thresholds were calculated using the equation
where
- T represents the threshold;
- T.R. represents the total rainfall (i.e., the mean annual rainfall calculated using 10 years of GPCC data);
- is a parameter representing the fraction of the total rainfall leading to the extreme event identification.
The application of an upper bound and a lower bound proved to be necessary. This constraint was included for two reasons. There are places where the recorded average annual rainfall amount is very low (below 100 mm in a year), which would lead to very low threshold values, comparable with the satellite measurement accuracy, with values around 0.1–0.2. Analogously, in places where the total annual rainfall is very high (above 2000 mm in a year), the EIT could be unrealistically high because in these places, rainfall events tend to occur in the form of low-intensity/high-frequency events.
Several tests were performed. For every aggregation interval, in order to choose the proper thresholds, both the criterion of minimization of the total cost and the maximization of the number of identified events were taken into account. The results obtained with the previous threshold methodology adopted in the Extreme Rainfall Detection System were also considered for comparison with the purpose of increasing the system performances. The methodology adopted in the previous version of ERDS is briefly summarized in Appendix B.
3. Results
3.1. Analysis of the Temporal and Spatial Influence of Missing Data
The temporal series of no data cells contained in every half-hourly GPM IMERG product was analyzed. The presence of missing data resulted as acceptable for both the late and early products since the registered averages of the percentage of no data values were equal to 0.026% for the early product dataset and 0.019% for the late product.
Figure A1 reported in Appendix A shows the spatial distribution of the pixels in which the precipitation value is absent. The most affected areas are the southern part of Patagonia region (South America), the northern part of North America (in particular Quebec province and Newfoundland and Labrador province) and the northeast part of Russia. No significant differences were found between these two versions.
3.2. GPM IMERG Accuracy Evaluation
The bias and mean absolute error were calculated for every aggregation interval previously mentioned. The results are reported in Figure 2, taking advantages of the peculiarity of a boxplot. In these figures, the first quantile, the median value of the distribution and the third quantile are identifiable. The mean values are instead summarized in Table 2. On the whole, a negative value of the bias emerged from the analysis. As a general rule, therefore, the satellite-derived data tend to underestimate rainfall with respect to the rain gauge. Several studies [15,16,17,18,19] reported in Section 1 agreed with this statement. A good accuracy for a near real-time application was obtained with aggregation intervals greater or equal to 12 h. For longer aggregation intervals, the bias tends to have a null value, allowing more accurate information. The early and late data performed similarly.
The results (in terms of false alarm ratio) reported in Figure 3 and Table 3 demonstrate that the GPM IMERG half-hourly data guarantee good performances for a near real-time application with aggregation intervals equal to or greater than 12 h. Smaller time intervals have an unsatisfactory value of false alarm ratio (approximately equal to or greater than 0.5). As expected, FAR showed a decreasing trend for both products. The outcomes demonstrate also that a 24-h aggregation interval ensures a probability of detection greater than 80% and a critical success index greater than 50%. With an aggregation interval of 72 h, a probability of detection greater than 90% was reached.
A further study was conducted taking into account only rainfall rate greater than the 99th percentile of the intensities distribution. The obtained results allowed us to understand the GPM IMERG performances in heavy rainfall detection. Figure 4 and Table 4 show the modest underestimation of GPM data.
3.3. Development and Test of a New Extreme Rainfall Detection Methodology
A scatter diagram (Figure 5) was used to investigate the relationship between the optimal thresholds and the total rainfall for a set of different conditions, taking into account every country. Every scatter plot refers to a different ratio between the false alarm cost and the missed alarm cost.
Similar results were obtained also for the other aggregation intervals. Overall, these graphs outline that a ratio equal to 1/5 represents the most appropriate value to be used for the next steps of the study. Even if, for some aggregation intervals, the best results were obtained with a ratio equal to 1/2, this value was discarded because it does not allow us to take into account the greater severities of a missed alarm, especially in highly populated areas. A ratio equal to 1/5 represents a more realistic condition and obtains good results in terms of correlation coefficient (the value is, in fact, very similar to the one related to a ratio equal to 1/2). Moreover, several studies confirmed the results gathered using this approach. A study conducted by the European Civil Protection and Humanitarian Aid Operations outlined that “every euro spent for disaster risk reduction and preparedness saves between four and seven euros in disaster response” [31]. Schröter et al. [32] found that early warning systems are characterized by a benefit/cost ratio between 1/2.6 and 1/9. Hugenbusch et al. [33] pointed out that the World Bank estimated that every dollar spent on risk reduction saves seven dollars in relief and repairs.
Figure 6 provides an overview of the results obtained for a 24-h aggregation interval using a ratio between the false alarm cost and the missed alarm cost equal to 1/5. The red dots represent the minimum of each total cost curve for every analyzed country (i.e., they represent the EITs).
The outcomes summarized in Figure 6 show that using a single threshold for every location of the Earth’s surface is not advisable. The range of obtained optimal values is, in fact, very large. Using an average value globally would result in
- the introduction of too many false alarms in areas with a higher value of optimal threshold and
- a high number of missed events in areas with a lower value of optimal threshold.
Figure 7 shows the relation between optimal threshold (obtained using Equation (6)) and the total rainfall for a 24-h aggregation interval using a missed alarm costs equal to 5. A good correlation between the optimal threshold and the total rainfall emerges from this figure. The results related to the other aggregation intervals are instead reported in Appendix A (from Figure A3, Figure A4, Figure A5 and Figure A6).
Figure 8 shows the results (in terms of total cost and identified events) achieved for a 24-h aggregation interval applying Equation (7), considering a missed alarm cost five times greater than the false alarm one. In the graph, better results (compared to the one obtained using the threshold methodology adopted in the previous version of ERDS) are highlighted with a red dot. The optimal simulation (and its related total rainfall percentage and lower/upper boundaries) corresponds to the one characterized by a low total cost and a high percentage of identified events.
The best results for every aggregation interval were achieved with the parameters summarized in Table 5. The threshold masks obtained with the parameters summarized in Table 5 are instead reported in Figure A7 of Appendix A.
3.4. Implementation
The Extreme Rainfall Detection System, implemented with the methodology described in this article, is hosted in a specific cloud server and set up with all the necessary software. Moreover, ad hoc software modules were developed because no existing software satisfied the requirements of the methodology. The software modules are available on GitHub [34,35]. The main components of this system are needed to perform four main steps: mirroring the source GPM site, accumulating rainfall data, generating alerts and publishing alerts.
A local repository of GPM IMERG data is hosted in the cloud server and updated regularly, as soon as a new measure is published by NASA. This behaviour is implemented in a software module that is able to mirror a subset of the GPM official data repository by checking on it during scheduled times of the day. From the point of view of the technology, the official GPM repository is constituted by a set of gridded files, stored in HDF5 format and published by means of the ftp protocol in Reference [36]. Each HDF5 file contains the rainfall measurement over a period of 30 min. Despite the mentioned temporal resolution of the source data, new files are published and grouped two by two, obtaining a temporal resolution equal to 1 h. In conclusion, the software module establishes a connection with the official GPM IMERG repository every hour and downloads locally the two latest files available. Files that are older than necessary are deleted from the local repository.
A second software module is devoted to perform rain-data accumulation over several periods of time. In particular, this module is triggered every time a new GPM IMERG file is available locally, as a result of the previous step. This module is tuned to perform rain data accumulation on the following periods: 12, 24, 48, 72 and 96 h. The resulting values, expressed in mm of rainfall, are stored locally as grid files into a georeferenced TIFF file. Each GeoTIFF file contains results related to a single period of accumulation.
A third software module is dedicated to perform the generation of the alerts. It is triggered as soon as new accumulation data are produced from the previous step. The concept behind this task is basic: if the accumulated rain values exceed the event-identification threshold defined with the methodology described before for the respective accumulation period, an alert is produced. This analysis is performed on a pixel-by-pixel basis. As a result, the pixel locations characterized by an alert are marked with a value equal to 1, while the non-alerted pixel locations are marked with a value equal to 0. These values are stored locally into a GeoTIFF file. Before publishing, the alerts produced on areas entirely occupied by sea or ocean were discarded. In order to complete this operation, a mask containing, in each cell, the water coverage of the area was used. This mask is freely available on NASA’s website [37]. Alerts provided on cells characterized by a water coverage equal to 100% were discarded. ERDS, in fact, is a tool developed in order to provide alerts on populated areas.
Both the accumulated rainfall data and the related alert data are published on the web. The publication is two-fold: on the one hand, the data are published in a georeferenced grid format (i.e., GeoTIFF) that can be used for generating maps in a Desktop GIS environment or for performing further analysis; on the other hand, a map representation of the data is published with the aim of allowing a quick check of the rain distribution and of the alerts.
The first level of publication is performed by taking advantage of a web server software installed on the local server, the scope of which is to make the GeoTIFF files available for download through the http protocol. In order to guide the download and make it easier for the end users, a specific homepage was designed as well (see http://erds.ithacaweb.org). This home page is also used to communicate the latest update of the system in terms of the available rain data.
With regards to the second level of publication, the technology used is the Web Map Service (WMS). A WMS produces maps of spatially referenced data dynamically from geographic information. WMS-produced maps are generally rendered in a pictorial format such as PNG, GIF or JPEG. A specific software (called GeoServer) is used for providing this service.
4. Discussion
The quantitative evaluation of the GPM IMERG accuracy was established using statistical performance scores and time series analyses. The obtained results are quite revealing in several ways. Firstly, there is no significant accuracy increase associated with the use of GPM IMERG half-hourly late data (provided with a longer latency) in a near real-time Extreme Rainfall Detection System. The use of the late product for an early warning would be appropriate only in the case of a noticeable improvement in terms of accuracy. Secondly, in addition to a high value of bias, mean absolute error and false alarm ratio, there is a probability of detection not acceptable for aggregation intervals lower than 12 h. It is, therefore, convenient to set the minimum rainfall aggregation interval to 12 h to be able to detect events with an acceptable accuracy. This choice takes into account several aspects, such as the requirements of the system, the ideal latency in the provision of information or the final use of the output. As a consequence, similar aggregation intervals are suitable for these purposes. It is, however, important to highlight the limitations in terms of the accuracy of the outputs obtained using this aggregation interval. The results reported in Table 3 highlight that this aggregation interval is characterized by a relatively high mean value of the false alarm ratio (equal to 0.46). Moreover, the mean value of the probability of detection is equal to 0.71. The ERDS outputs will be affected accordingly.
Summarizing, the current version of ERDS automatically downloads the most recent GPM IMERG early run data and cumulates them according to specific time intervals. More importantly, ERDS generates rainfall alerts where and when the rainfall amount is higher than a specific set of event-identification thresholds.
The current version of ERDS is able to provide alerts every hour with a 0.1° × 0.1° resolution in the latitude range between 60°N and 60°S. The ERDS data are uploaded every hour because GPM IMERG data, despite the 30 min resolution, is made public in pairs of two. The latency is about 4 h. The previous version of ERDS instead provided alerts every 3 h with a 0.25° × 0.25° resolution in the latitude range between 50°N and 50°S. The latency was about 8 h. The new input data allowed the improvement of the system in terms of spatial and temporal resolution, as well as the extent. The greater temporal resolution allowed for the capture of short-term rainfall events that commonly occurred in some areas. It is important to keep in mind that, in some cases, the alerts related to such events can be produced with a modest delay due to the latency of the input data.
The results gathered from the study highlighted several advantages towards the previous ERDS version. The different results obtained are summarized in Table 6. Only for the 12-h aggregation interval, there is no comparison with the previous threshold methodology because, in the previous system, this aggregation interval was not used.
The improvement in the performances of the new ERDS method is clear for all aggregation intervals but becomes extremely relevant when aggregation intervals greater than 48 h are considered. Note that many events are identified with several aggregation intervals.
A further study was performed in order to examine the ERDS performance in relation to the disaster type. The left plot of Figure 9 shows, for each analyzed subcategory, the number of identified events compared to the total for this specific subcategory. In the right plot of Figure 9, instead, the same results are shown in terms of percentages.
ERDS is an alert system designed to identify hydrometeorological events, such as hurricanes, tropical storms, heavy rainfall that could lead to flood events, flash floods, convective storms, etc. However, there are some types of phenomena that put a strain on this alert system. Specifically, ERDS may fail in the identification of convective storms characterized by a high spatial and temporal variability and discontinuity. They can indeed be transparent to the satellite (rainfall could affect an area smaller than the size of a single cell of GPM data) or their intensity may be underestimated. ERDS may also fail in the identification of heavy rain-induced landslides or in the provision of a timely alert in the case of intense flash floods affecting very small basins. ERDS, in fact, is characterized by a delay of about 4 h (due to original GPM data delay plus the time required by the data download, processing and alert evaluation in the ERDS system). If the event is very short, very intense and can cause a flood within 4 h, the alert will be provided too late. Conversely, the system showed a good performance regarding the identification of hydrometeorological disasters like hurricanes, cyclones, tropical storms, heavy rainfall that might lead to flood events and flash floods characterized by durations greater than the ERDS latency.
5. Conclusions
This work highlighted the potential of the NASA GPM IMERG half-hourly early run data (a satellite precipitation measurement) as the input for a near real-time Extreme Rainfall Detection System. The new input data allowed spatial and temporal resolution to increase. Moreover, the current threshold methodology enabled system performance to increase, allowing the detection of 13% more events. These findings suggest that, in general, this precipitation measurement provides satisfactory results. However, a number of important limitations need to be considered.
The system performances are deeply influenced by the input data resolution. The system is working at the global scale with a spatial resolution of 0.1° × 0.1°. These characteristics could lead to a wrong picture of rainfall events that vary greatly on a small scale and over time. A local-scale validation is advisable. Further studies aimed at developing a temporal/spatial downscaling of the GPM data could help to provide more accurate and reliable outputs. Moreover, one of the major problems with this kind of application is the error that may be present in the rainfall measurement. The system has no control over any underestimation, overestimation or random errors. Furthermore, no remedy is in place with reference to any kind of temporary interruptions in the provision of data.
With this type of application, the model calibration and performance evaluation continue to be challenging problems in large data-scarce regions or in areas where only a few hydrometeorological events were recorded. The currently adopted thresholds may be influenced by this problem.
Before concluding, it is important to highlight an additional information. One of the aspects to be taken into consideration is the noncoincidence between the place where the alert was given and the place where the flood may occur. ERDS is a tool developed for rainfall monitoring. The system provides an alert where the amount of rainfall is higher than a specific threshold. The system, however, does not take into account the morphology of the territory or information regarding basins. The flood, therefore, may occur in the alerted cell or in nearby ones. Further studies could be done in order to take into account this important aspect.
Author Contributions
Formal analysis, P.M.; methodology, P.M. and F.L.; software, P.M. and S.B.; writing—original draft, P.M.; writing—review and editing, P.M., F.L., S.B., P.B. and F.D.
Funding
F.L. acknowledges the funding support provided by the European Research Council (ERC) through the project “Coping with water scarcity in a globalized world” (ERC-2014-CoG, project 288 647473). F.D. acknowledges the funding support provided by the DG ECHO through the project “TRIgger BUffers for inundaTion Events” (TRIBUTE, ECHO/SUB/2016/742480/PREV08).
Acknowledgments
We express our gratitude to Paolo Pasquali, who helped us in the development of the web app.
Conflicts of Interest
The authors declare no conflict of interest.
Appendix A
Figure A1 shows the results obtained during the analysis of the presence of cells with missing precipitation measurement within the area normally covered by the precipitationCal band. The methodology is described in Section 2.1.
Figure A1.
The spatial distribution of no data: The first graph (a) is related to the GPM IMERG half-hourly early product, while the second graph (b) is related to the GPM IMERG half-hourly late product. The colours refer to the number of half-hourly files in which the measure is absent in the precipitationCal band (the analysis was performed from 12 March 2014 to 30 April 2017 on 55008 files). The reference system is WGS84.

Figure A2 shows the total rainfall amount (i.e., the mean annual rainfall) adopted during the development of the new extreme rainfall detection methodology (described in Section 2.2).
Figure A2.
The mean annual rainfall calculated using 10 years of GPCC monthly “Monitoring product”. The white areas are places characterized by an absence of measurement. The reference system is WGS84.
Figure A2.
The mean annual rainfall calculated using 10 years of GPCC monthly “Monitoring product”. The white areas are places characterized by an absence of measurement. The reference system is WGS84.

Figure A3, Figure A4, Figure A5 and Figure A6 show the relationship between the optimal thresholds and the total rainfall for a set of different aggregation interval (12, 48, 72 and 96 h) using a missed alarm cost equal to 5 and a false alarm cost equal to 1. The results related to a 24-h aggregation interval were instead discussed in detail in Section 3.3.
Figure A3.
The optimal thresholds for every country object of study obtained using a false alarm cost equal to 1 and a missed alarm cost equal to 5 compared to the total rainfall of the country: The results refer to a 12-h aggregation interval. The countries naming follow ISO 3166.
Figure A3.
The optimal thresholds for every country object of study obtained using a false alarm cost equal to 1 and a missed alarm cost equal to 5 compared to the total rainfall of the country: The results refer to a 12-h aggregation interval. The countries naming follow ISO 3166.

Figure A4.
The optimal thresholds for every country object of study obtained using a false alarm cost equal to 1 and a missed alarm cost equal to 5 compared to the total rainfall of the country: The results refer to a 48-h aggregation interval. The countries naming follow ISO 3166.
Figure A4.
The optimal thresholds for every country object of study obtained using a false alarm cost equal to 1 and a missed alarm cost equal to 5 compared to the total rainfall of the country: The results refer to a 48-h aggregation interval. The countries naming follow ISO 3166.

Figure A5.
The optimal thresholds for every country object of study obtained using a false alarm cost equal to 1 and a missed alarm cost equal to 5 compared to the total rainfall of the country: The results refer to a 72-h aggregation interval. The countries naming follow ISO 3166.
Figure A5.
The optimal thresholds for every country object of study obtained using a false alarm cost equal to 1 and a missed alarm cost equal to 5 compared to the total rainfall of the country: The results refer to a 72-h aggregation interval. The countries naming follow ISO 3166.

Figure A6.
The optimal thresholds for every country object of study obtained using a false alarm cost equal to 1 and a missed alarm cost equal to 5 compared to the total rainfall of the country: The results refer to a 96-h aggregation interval. The countries naming follow ISO 3166.
Figure A6.
The optimal thresholds for every country object of study obtained using a false alarm cost equal to 1 and a missed alarm cost equal to 5 compared to the total rainfall of the country: The results refer to a 96-h aggregation interval. The countries naming follow ISO 3166.

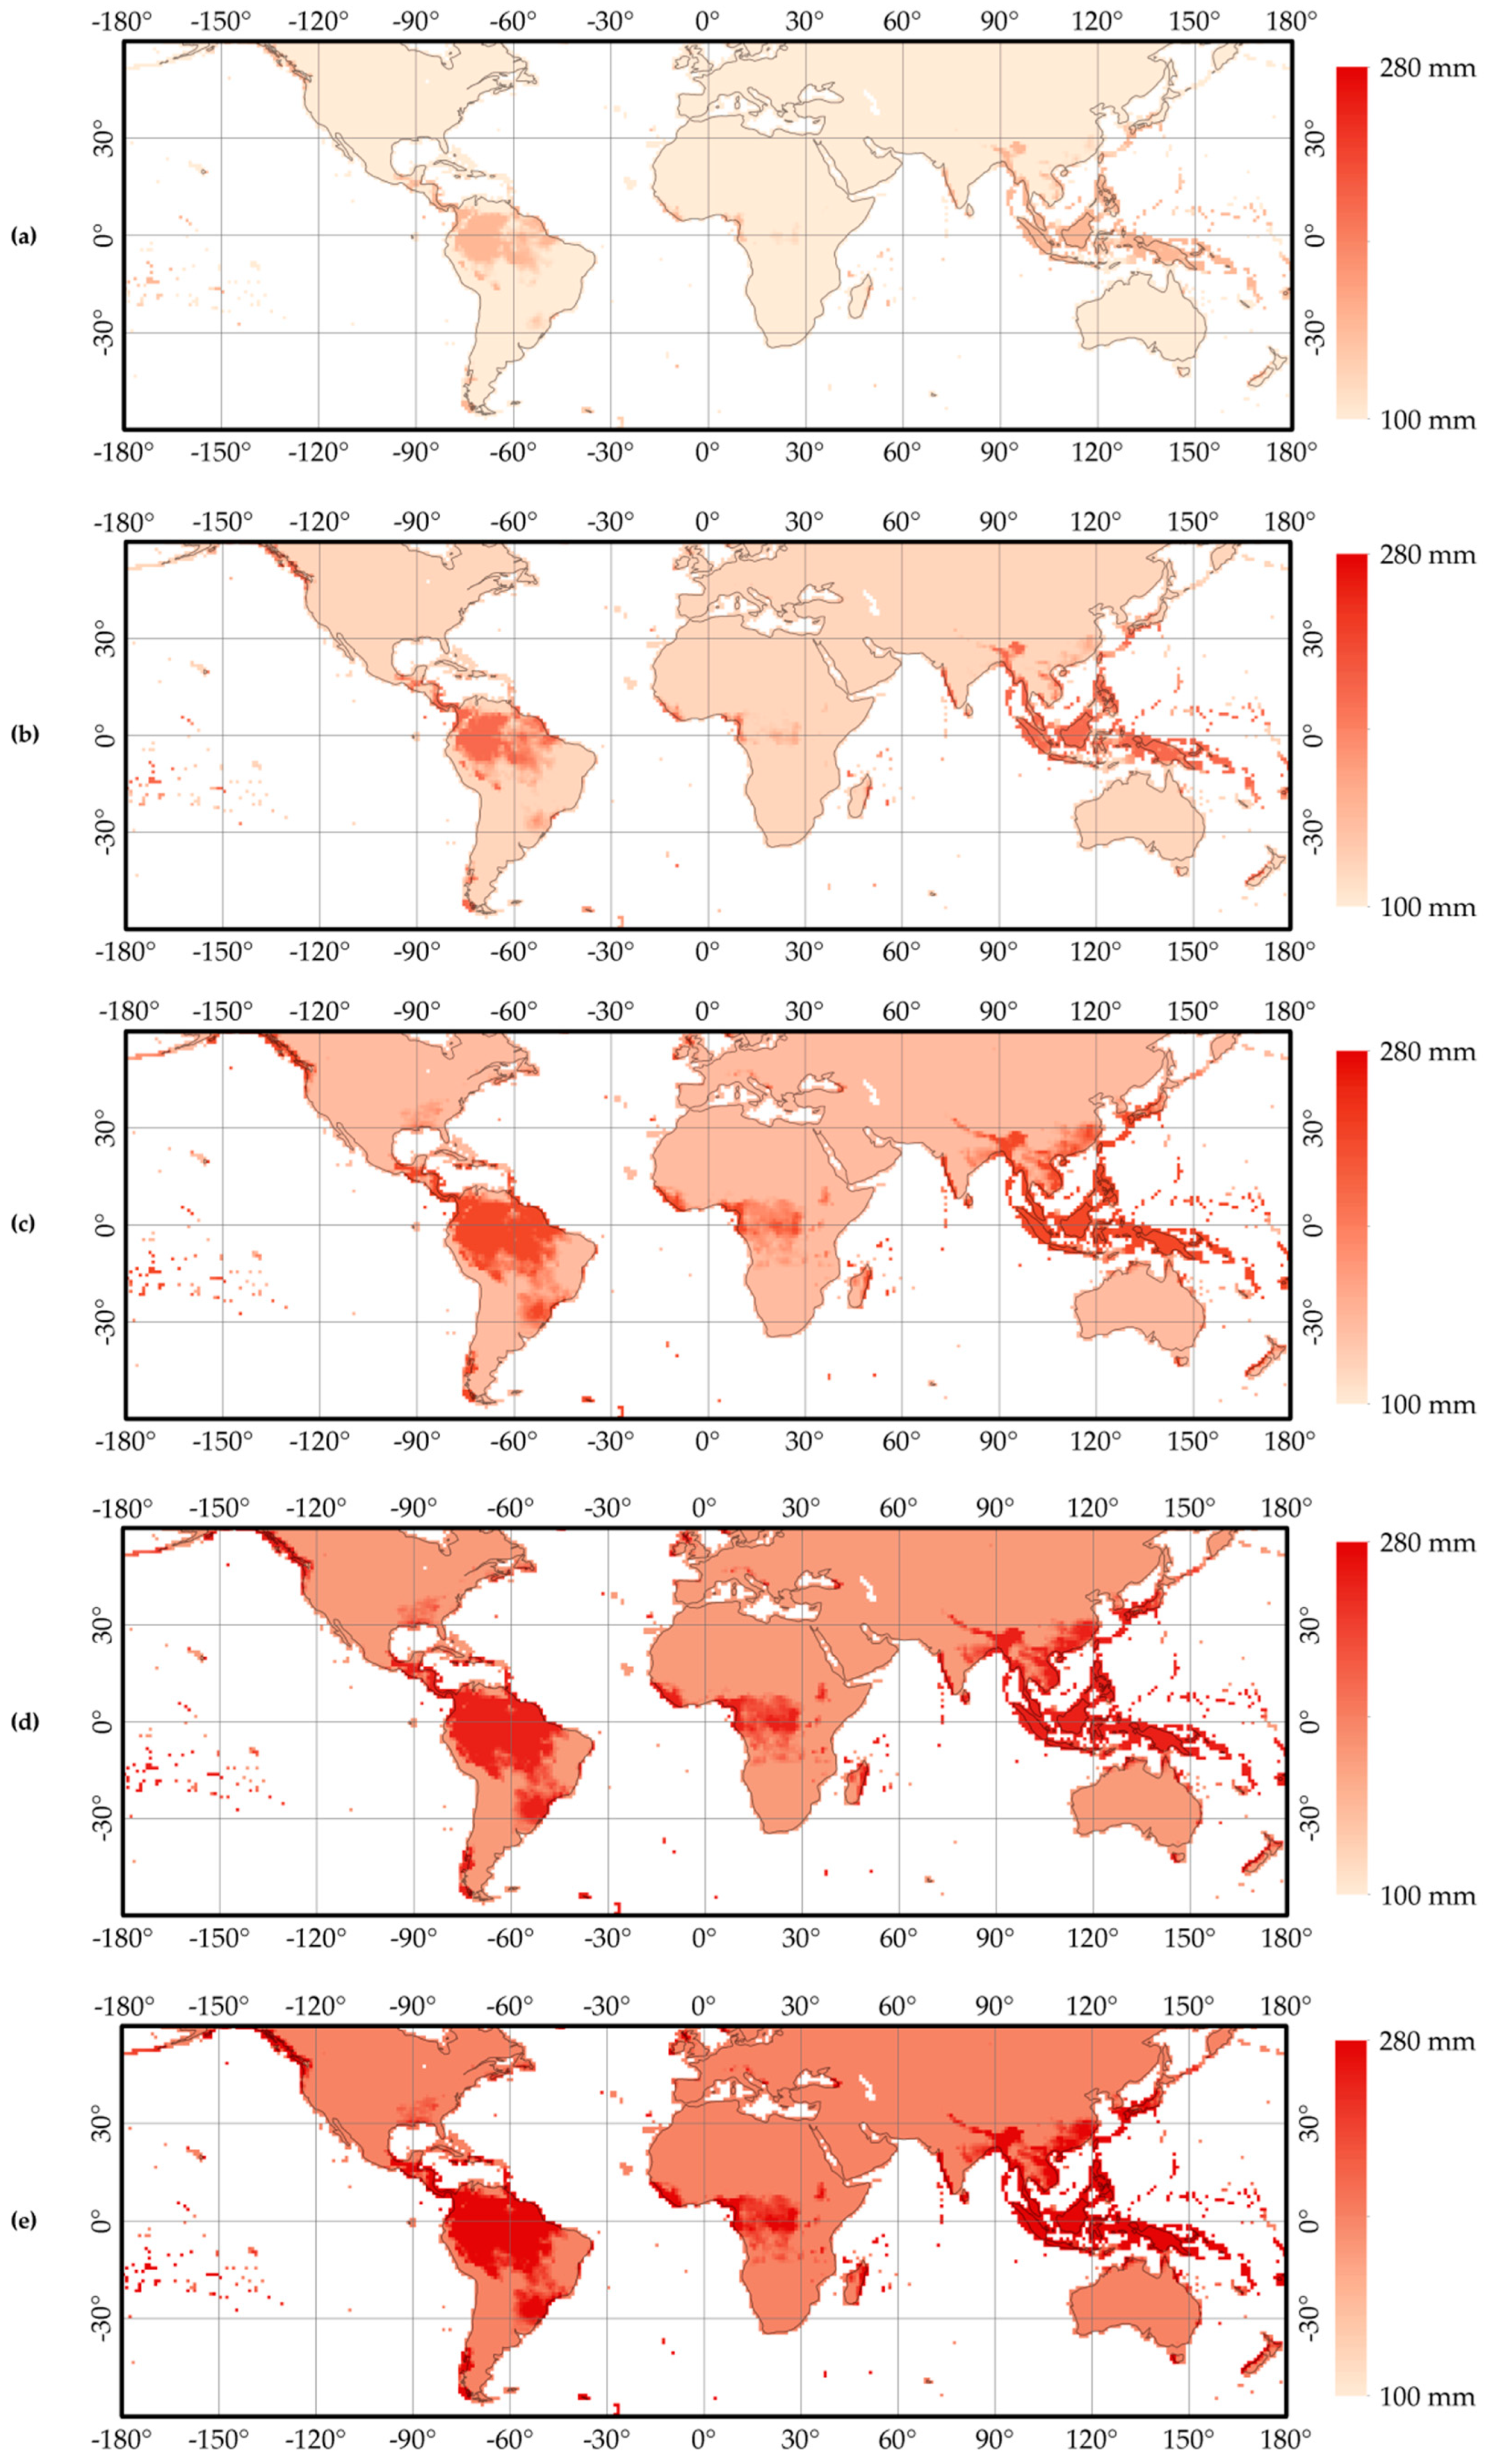
Figure A7 shows the thresholds masks currently adopted in the updated version of the Extreme Rainfall Detection System. The threshold values were calculated for a set of aggregation intervals (12, 24, 48, 72 and 96 h) using the methodology described in Section 2.2. Every thresholds mask has a 1° × 1° spatial resolution and was obtained applying the parameters summarized in Table 5 at the mean annual rainfall reported in Figure A2.
Figure A7.
The event-identification threshold used for the extreme rainfall detection: The images are related to the 12 (a), 24 (b), 48 (c), 72 (d) and 96 (e) hours aggregation intervals. The reference system is WGS84.
Figure A7.
The event-identification threshold used for the extreme rainfall detection: The images are related to the 12 (a), 24 (b), 48 (c), 72 (d) and 96 (e) hours aggregation intervals. The reference system is WGS84.
Appendix B
The previous version of ERDS was using thresholds for the identification of extreme events depending on a climatological classification [38]. Three different macro-areas were identified, using Koppen–Geiger classification [39] as a basis. These macro-areas can be seen in Figure A8.
Figure A8.
The ERDS macro-areas based on Koppen–Geiger climate classification: The different colours correspond to different corrective coefficients. The reference system is WGS84.
Figure A8.
The ERDS macro-areas based on Koppen–Geiger climate classification: The different colours correspond to different corrective coefficients. The reference system is WGS84.

Specifically, selected thresholds, shown in Table A1, were multiplied by a corrective coefficient equal to
Where the accumulated rainfall was exceeding the corresponding threshold value, ERDS was able to provide an alert. This alert could be of three entities: level 1 (low entity), level 2 (medium entity) or level 3 (high entity).

Table A1.
The threshold values used in the previous version of the Extreme Rainfall Detection System.
Table A1.
The threshold values used in the previous version of the Extreme Rainfall Detection System.
| 24 h | 48 h | 72 h | 96 h | 120 h | 144 h | |
|---|---|---|---|---|---|---|
| Threshold Alert Level 1 (mm) | 150 | 230 | 310 | 390 | 470 | 500 |
| Threshold Alert Level 2 (mm) | 210 | 290 | 370 | 450 | 530 | 560 |
| Threshold Alert Level 3 (mm) | 270 | 350 | 430 | 510 | 590 | 620 |
References
- Stocker, T.F.; Qin, D.; Plattner, G.K.; Tignor, M.; Allen, S.K.; Boschung, J.; Nauels, A.; Xia, Y.; Bex, V.; Midgley, P.M. IPCC, Climate Change 2013: The Physical Science Basis. Contribution of Working Group I to the Fifth Assessment Report of the Intergovernmental Panel on Climate Change; Cambridge University Press: Cambridge, UK; New York, NY, USA, 2013; p. 1454. [Google Scholar]
- Mazzoglio, P.; Boccardo, P.; Laio, F.; Balbo, S.; Disabato, F. ERDS: A satellite-based approach in the extreme rainfall detection field. In Proceedings of the AIT 2018 Conference Abstract, Firenze, Italy, 4–6 July 2018; p. 137. Available online: https://aitonline.files.wordpress.com/2018/07/abstract_book1.pdf (accessed on 11 January 2019).
- EFAS. Available online: www.efas.eu (accessed on 11 January 2019).
- Global Flood Monitoring System. Available online: http://flood.umd.edu (accessed on 11 January 2019).
- Dartmouth Flood Observatory (DFO). Available online: http://floodobservatory.colorado.edu (accessed on 11 January 2019).
- Alfieri, L.; Cohen, S.; Galantowicz, J.; Schumann, G.J.P.; Trigg, M.A.; Zsoter, E.; Prudhomme, C.; Kruczkiewicz, A.; Coughlan de Perez, E.; Flamig, Z.; et al. A global network for operational flood risk reduction. Environ. Sci. Policy 2018, 84, 149–158. [Google Scholar] [CrossRef]
- Salamon, P.; Kettner, A.; Coughlan de Perez, E.; Rudari, R.; Trigg, M.; Weerts, A.; Cohen, S.; Prados, A.; Wu, H.; Schumann, G.J.P.; et al. The Global Flood Partnership Annual Meeting 2018–Bridging the Gap between Science and Users; PUBSY No. JRC113100; European Commission: Ispra, Italy, 2018; ISBN 978-92-79-93665-4. [Google Scholar] [CrossRef]
- ITHACA—Information Technology for Humanitarian Assistance, Cooperation and Action. Available online: www.ithacaweb.org (accessed on 11 January 2019).
- Huffman, G.J.; Bolvin, D.T.; Nelkin, E.J.; Wolff, D.B.; Adler, R.F.; Gu, G.; Hong, Y.; Bowman, K.P.; Stocker, E.F. The TRMM Multisatellite Precipitation Analysis (TMPA): Quasi-global, multiyear, combined-sensor precipitation estimates at fine scales. J. Hydrometeorol. 2007, 8, 38–55. [Google Scholar] [CrossRef]
- Huffman, G.J.; Bolvin, D.T.; Nelkin, E.J. Integrated Multi-satellitE Retrievals for GPM (IMERG) Technical Documentation. 2018. Available online: https://pmm.nasa.gov/sites/default/files/document_files/IMERG_doc_180207.pdf (accessed on 11 January 2019).
- Huffman, G.J.; Bolvin, D.T.; Braithwaite, D.; Hsu, K.; Joyce, R.; Kidd, C.; Nelkin, E.J.; Sorooshian, S.; Tan, J.; Xie, P. NASA Global Precipitation Measurement (GPM) Integrated Multi-satellitE Retrievals for GPM (IMERG) Algorithm Theoretical Basis Document (ATBD) Version 5.2. 2018. Available online: https://pmm.nasa.gov/sites/default/files/document_files/IMERG_ATBD_V5.2.pdf (accessed on 11 January 2019).
- GPM Data Downloads. Available online: https://pmm.nasa.gov/data-access/downloads/gpm (accessed on 11 January 2019).
- Huffman, G.J. GPM IMERG Early Precipitation L3 Half Hourly 0.1 Degree x 0.1 Degree V04; Goddard Earth Sciences Data and Information Services Center (GES DISC): Greenbelt, MD, USA, 2015.
- Huffman, G.J. GPM IMERG Late Precipitation L3 Half Hourly 0.1 Degree x 0.1 Degree V04; Goddard Earth Sciences Data and Information Services Center (GES DISC): Greenbelt, MD, USA, 2015.
- Khodadoust Siuki, S.; Saghafian, B.; Moazami, S. Comprehensive evaluation of 3-hourly TRMM and half-hourly GPM-IMERG satellite precipitation products. Int. J. Remote Sens. 2016, 38, 558–571. [Google Scholar] [CrossRef]
- Guo, H.; Chen, S.; Bao, A.; Behrangi, A.; Hong, Y.; Ndayisaba, F.; Hu, J.; Stepanian, P.M. Early assessment of Integrated Multi-satellite Retrievals for Global Precipitation Measurement over China. Atmos. Res. 2016, 176–177, 121–133. [Google Scholar] [CrossRef]
- Gaona, M.F.; Overeem, A.; Leijnse, H.; Uijlenhoet, R. First-year evaluation of GPM rainfall over the Netherlands: IMERG day 1 final run (V03D). J. Hydrometeorol. 2016, 17, 2799–2814. [Google Scholar] [CrossRef]
- Sahlu, D.; Nikolopoulos, E.I.; Moges, S.A.; Anagnostou, E.N.; Hailu, D. First evaluation of the day-1 IMERG over the upper Blue Nile Basin. J. Hydrometeorol. 2016, 17, 2875–2882. [Google Scholar] [CrossRef]
- Sharifi, E.; Steinacker, R.; Saghafian, B. Assessment of GPM-IMERG and other precipitation products against gauge data under different topographic and climatic conditions in Iran: Preliminary results. Remote Sens. 2016, 8, 135. [Google Scholar] [CrossRef]
- Kim, K.; Park, J.; Baik, J.; Choi, M. Evaluation of topographical and seasonal feature using GPM IMERG and TRMM 3B42 over Far-East Asia. Atmos. Res. 2017, 187, 95–105. [Google Scholar] [CrossRef]
- Prakash, S.; Mitra, A.K.; Pai, D.S.; AghaKouchak, A. From TRMM to GPM: How well can heavy rainfall be detected from space? Adv. Water Resour. 2016, 88, 1–7. [Google Scholar] [CrossRef]
- Chen, C.; Chen, Q.; Duan, Z.; Zhang, J.; Mo, K.; Li, Z.; Tang, G. Multiscale comparative evaluation of the GPM IMERG v5 and TRMM 3B42 v7 precipitation products from 2015 to 2017 over a climate transition area of China. Remote Sens. 2018, 10, 944. [Google Scholar] [CrossRef]
- Local Climatological Data (LCD). Available online: www.ncdc.noaa.gov/cdo-web/datatools/lcd (accessed on 11 January 2019).
- Klimadatendeutschland. Available online: https://rcc.dwd.de/DE/leistungen/klimadatendeutschland/klarchivstunden.html%5Enn=561158 (accessed on 11 January 2019).
- Nurmi, P. Recommendations on the Verification of Local Weather Forecasts. ECMWF Technical Memorandum n° 430. 2003. Available online: www.ecmwf.int/en/elibrary/11401-recommendations-verification-local-weather-forecasts (accessed on 11 January 2019).
- EM-DAT: The Emergency Events Database–Université catholique de Louvain (UCL)–CRED, D. Guha-Sapir. Brussels, Belgium. Available online: www.emdat.be (accessed on 11 January 2019).
- Reliefweb. Available online: https://reliefweb.int (accessed on 11 January 2019).
- Floodlist. Available online: http://floodlist.com (accessed on 11 January 2019).
- Simmons, K.M.; Sutter, D. False alarms, tornado warnings, and tornado casualties. Weather Clim. Soc. 2009, 1, 38–53. [Google Scholar] [CrossRef]
- Schneider, U.; Becker, A.; Finger, P.; Meyer-Christoffer, A.; Rudolf, B.; Ziese, M. GPCC Monitoring Product: Near Real-Time Monthly Land-Surface Precipitation from Rain-Gauges based on SYNOP and CLIMAT Data; GPCC: Ahmedabad, India, 2011. [CrossRef]
- European Civil Protection and Humanitarian Aid Operations. Available online: https://ec.europa.eu/echo/printpdf/what/humanitarian-aid/disaster_preparedness_en (accessed on 11 January 2019).
- Schröter, K.; Ostrowski, M.; Velasco, C.; Sempere-Torres, D.; Nachtnebel, H.; Kahl, B.; Beyene, M.; Rubin, C.; Gocht, M. Effectiveness and Efficiency of Early Warning Systems for Flash-Floods (EWASE). CRUE Research Report No I-5. Available online: www.researchgate.net/publication/255947664_Effectiveness_and_Efficiency_of_Early_Warning_Systems_for_Flash-Floods_EWASE (accessed on 11 January 2019).
- Hugenbusch, D.; Neumann, T.; Neumann, T. Cost-Benefit Analysis of Disaster Risk Reduction. Aktion Deutschland Hilft e.V GERMANY. 2016. Available online: www.aktion-deutschland-hilft.de/fileadmin/fm-dam/pdf/publikationen/aktion-deutschland-hilft-studie-zur-katastrophenvorsorge-englische-version-english-version.pdf (accessed on 11 January 2019).
- Gpm-accumul. Available online: https://github.com/ITHACA-org/gpm-accumul (accessed on 11 January 2019).
- Erds-web. Available online: https://github.com/ITHACA-org/erds-web (accessed on 11 January 2019).
- GPM IMERG Data. Available online: ftp://jsimpson.pps.eosdis.nasa.gov/NRTPUB/imerg/early (accessed on 11 January 2019).
- Surfrac0.1.PPS. Available online: https://pmm.nasa.gov/sites/default/files/downloads/surfrac0.1.PPS.gz (accessed on 11 January 2019).
- Tiepolo, M.; Cristofori, E.; Albanese, A.; Boccardo, P. 8. Early Warning Systems & Geomatics: Value-added Information in the Absence of High Resolution Data. In Planning to Cope with Tropical and Subtropical Climate Change; De Gruyter Open: Warsaw, Poland, 2016; pp. 141–153. [Google Scholar] [CrossRef]
- Kottek, M.; Grieser, J.; Beckc, C.; Rudolf, B.; Rubel, F. World Map of the Köppen-Geiger climate classification updated. Meteorol. Z. 2006, 15, 259–263. [Google Scholar] [CrossRef]
Figure 1.
The spatial distribution of the rain gauges used for the evaluation of the accuracy of GPM (Global Precipitation Measurement) IMERG (Integrated Multi-satellite Retrievals for GPM) data. The reference system is WGS84.
Figure 1.
The spatial distribution of the rain gauges used for the evaluation of the accuracy of GPM (Global Precipitation Measurement) IMERG (Integrated Multi-satellite Retrievals for GPM) data. The reference system is WGS84.

Figure 2.
The bias (a) and mean absolute error (MAE) (b) evaluated for nonzero rainfall intensities: The orange boxplot refers to the GPM IMERG half-hourly early data while the red boxplot refers to the GPM IMERG half-hourly late data.
Figure 2.
The bias (a) and mean absolute error (MAE) (b) evaluated for nonzero rainfall intensities: The orange boxplot refers to the GPM IMERG half-hourly early data while the red boxplot refers to the GPM IMERG half-hourly late data.

Figure 3.
The false alarm ratio (a), the probability of detection (b) and the critical success index (c): The orange boxplot refers to the GPM IMERG half-hourly early data while the red boxplot refers to the GPM IMERG half-hourly late data.
Figure 3.
The false alarm ratio (a), the probability of detection (b) and the critical success index (c): The orange boxplot refers to the GPM IMERG half-hourly early data while the red boxplot refers to the GPM IMERG half-hourly late data.

Figure 4.
The bias (a) and mean absolute error (b) related to the heavy rainfall events: The orange boxplot refers to the GPM IMERG half-hourly early data while the red boxplot refers to the GPM IMERG half-hourly late data.
Figure 4.
The bias (a) and mean absolute error (b) related to the heavy rainfall events: The orange boxplot refers to the GPM IMERG half-hourly early data while the red boxplot refers to the GPM IMERG half-hourly late data.

Figure 5.
The optimal thresholds for every country object of study obtained for four different conditions: The results refer to a 24-h aggregation interval and were obtained with a false alarm cost equal to 1. Regarding the missed alarm cost, the following costs were used: 2 (a), 5 (b), 10 (c) and 20 (d).
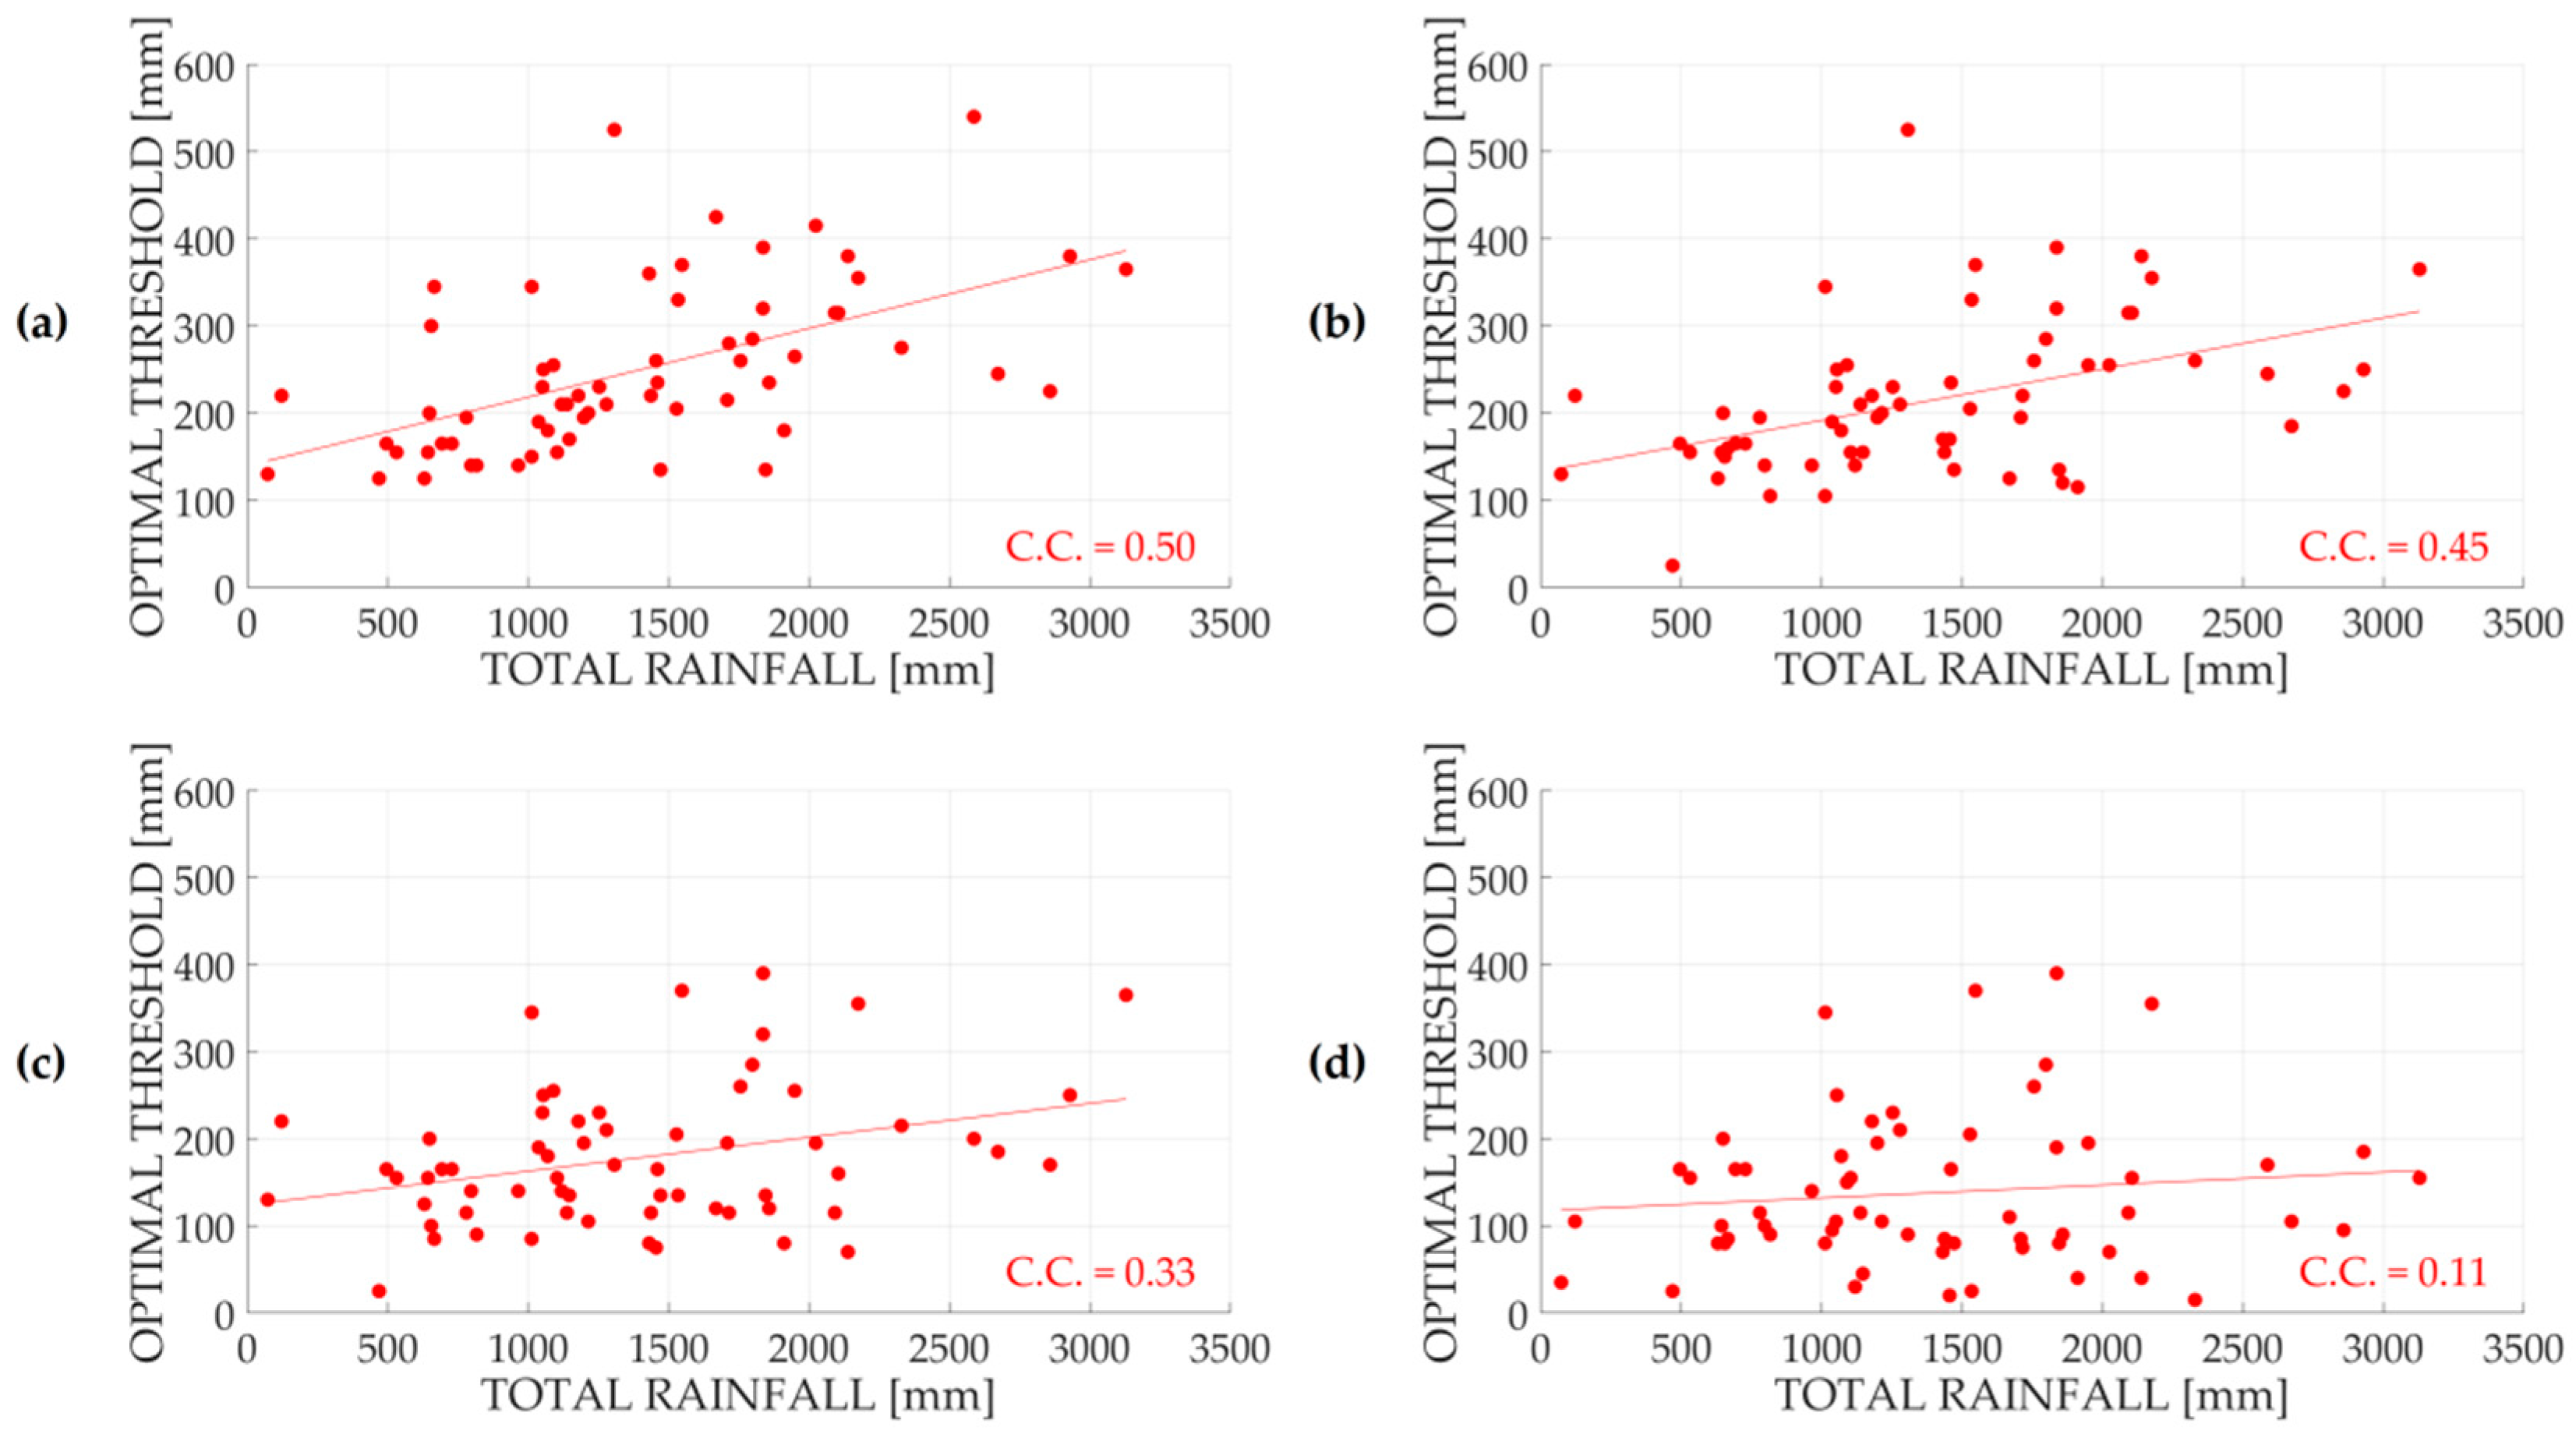
Figure 6.
The optimal thresholds for every country object of study obtained using a false alarm cost equal to 1 and a missed alarm cost equal to 5: The results refer to a 24-h aggregation interval. The countries naming follow ISO 3166.
Figure 6.
The optimal thresholds for every country object of study obtained using a false alarm cost equal to 1 and a missed alarm cost equal to 5: The results refer to a 24-h aggregation interval. The countries naming follow ISO 3166.
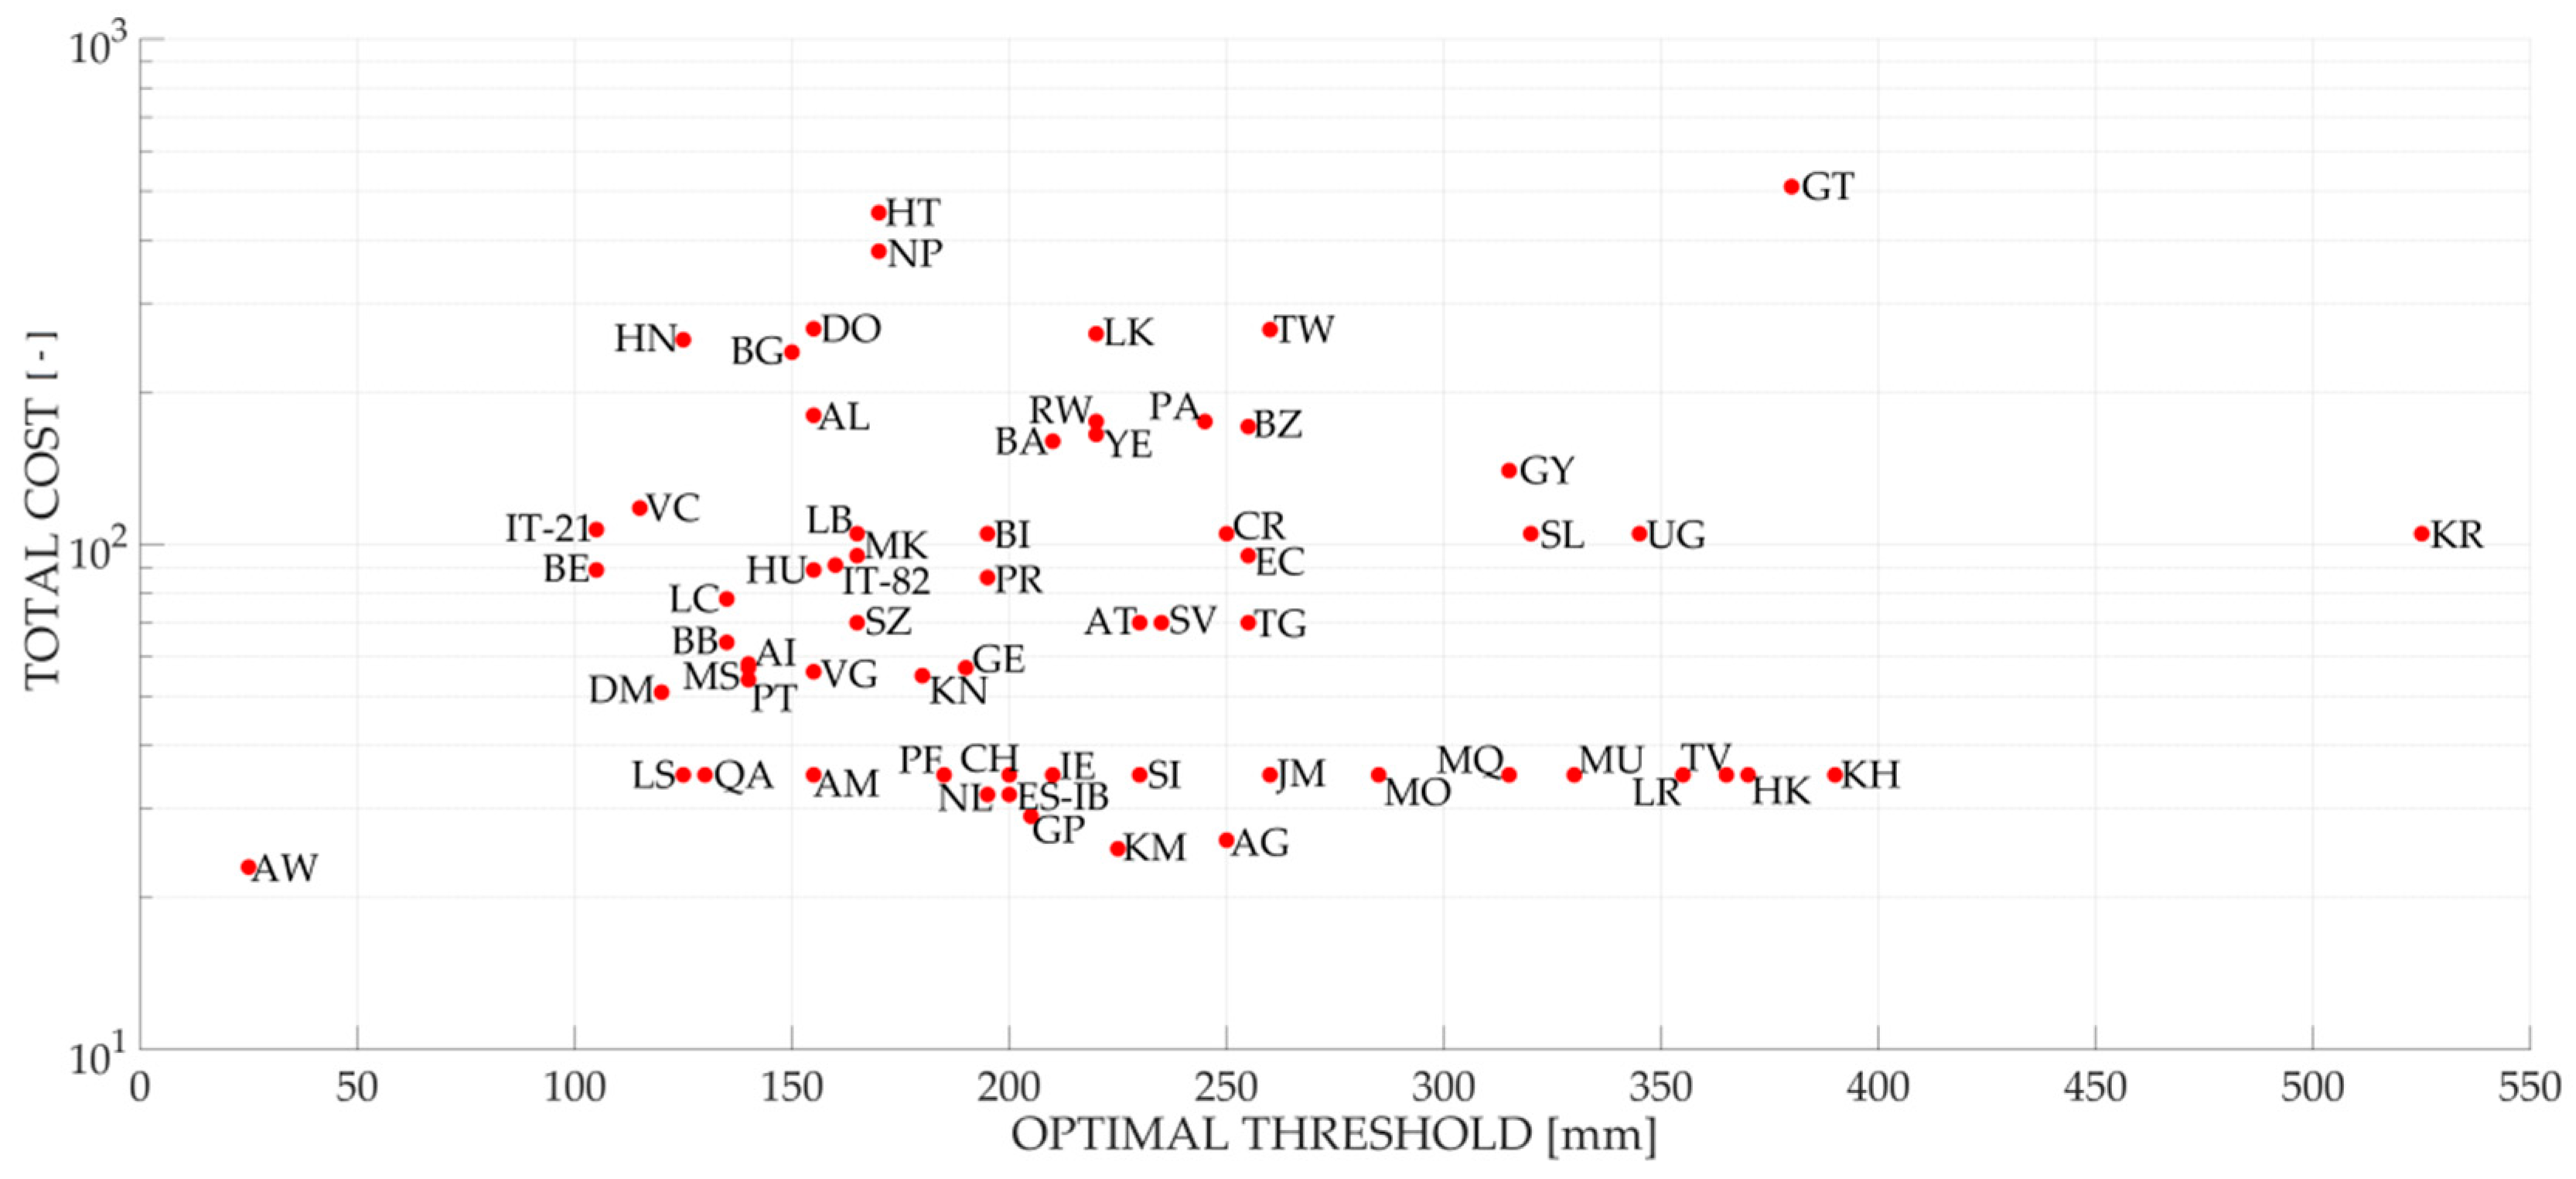
Figure 7.
The optimal thresholds for every country object of study obtained using a false alarm cost equal to 1 and a missed alarm cost equal to 5 compared to the total rainfall of the country: The results refer to a 24-h aggregation interval. The countries naming follow ISO 3166.
Figure 7.
The optimal thresholds for every country object of study obtained using a false alarm cost equal to 1 and a missed alarm cost equal to 5 compared to the total rainfall of the country: The results refer to a 24-h aggregation interval. The countries naming follow ISO 3166.
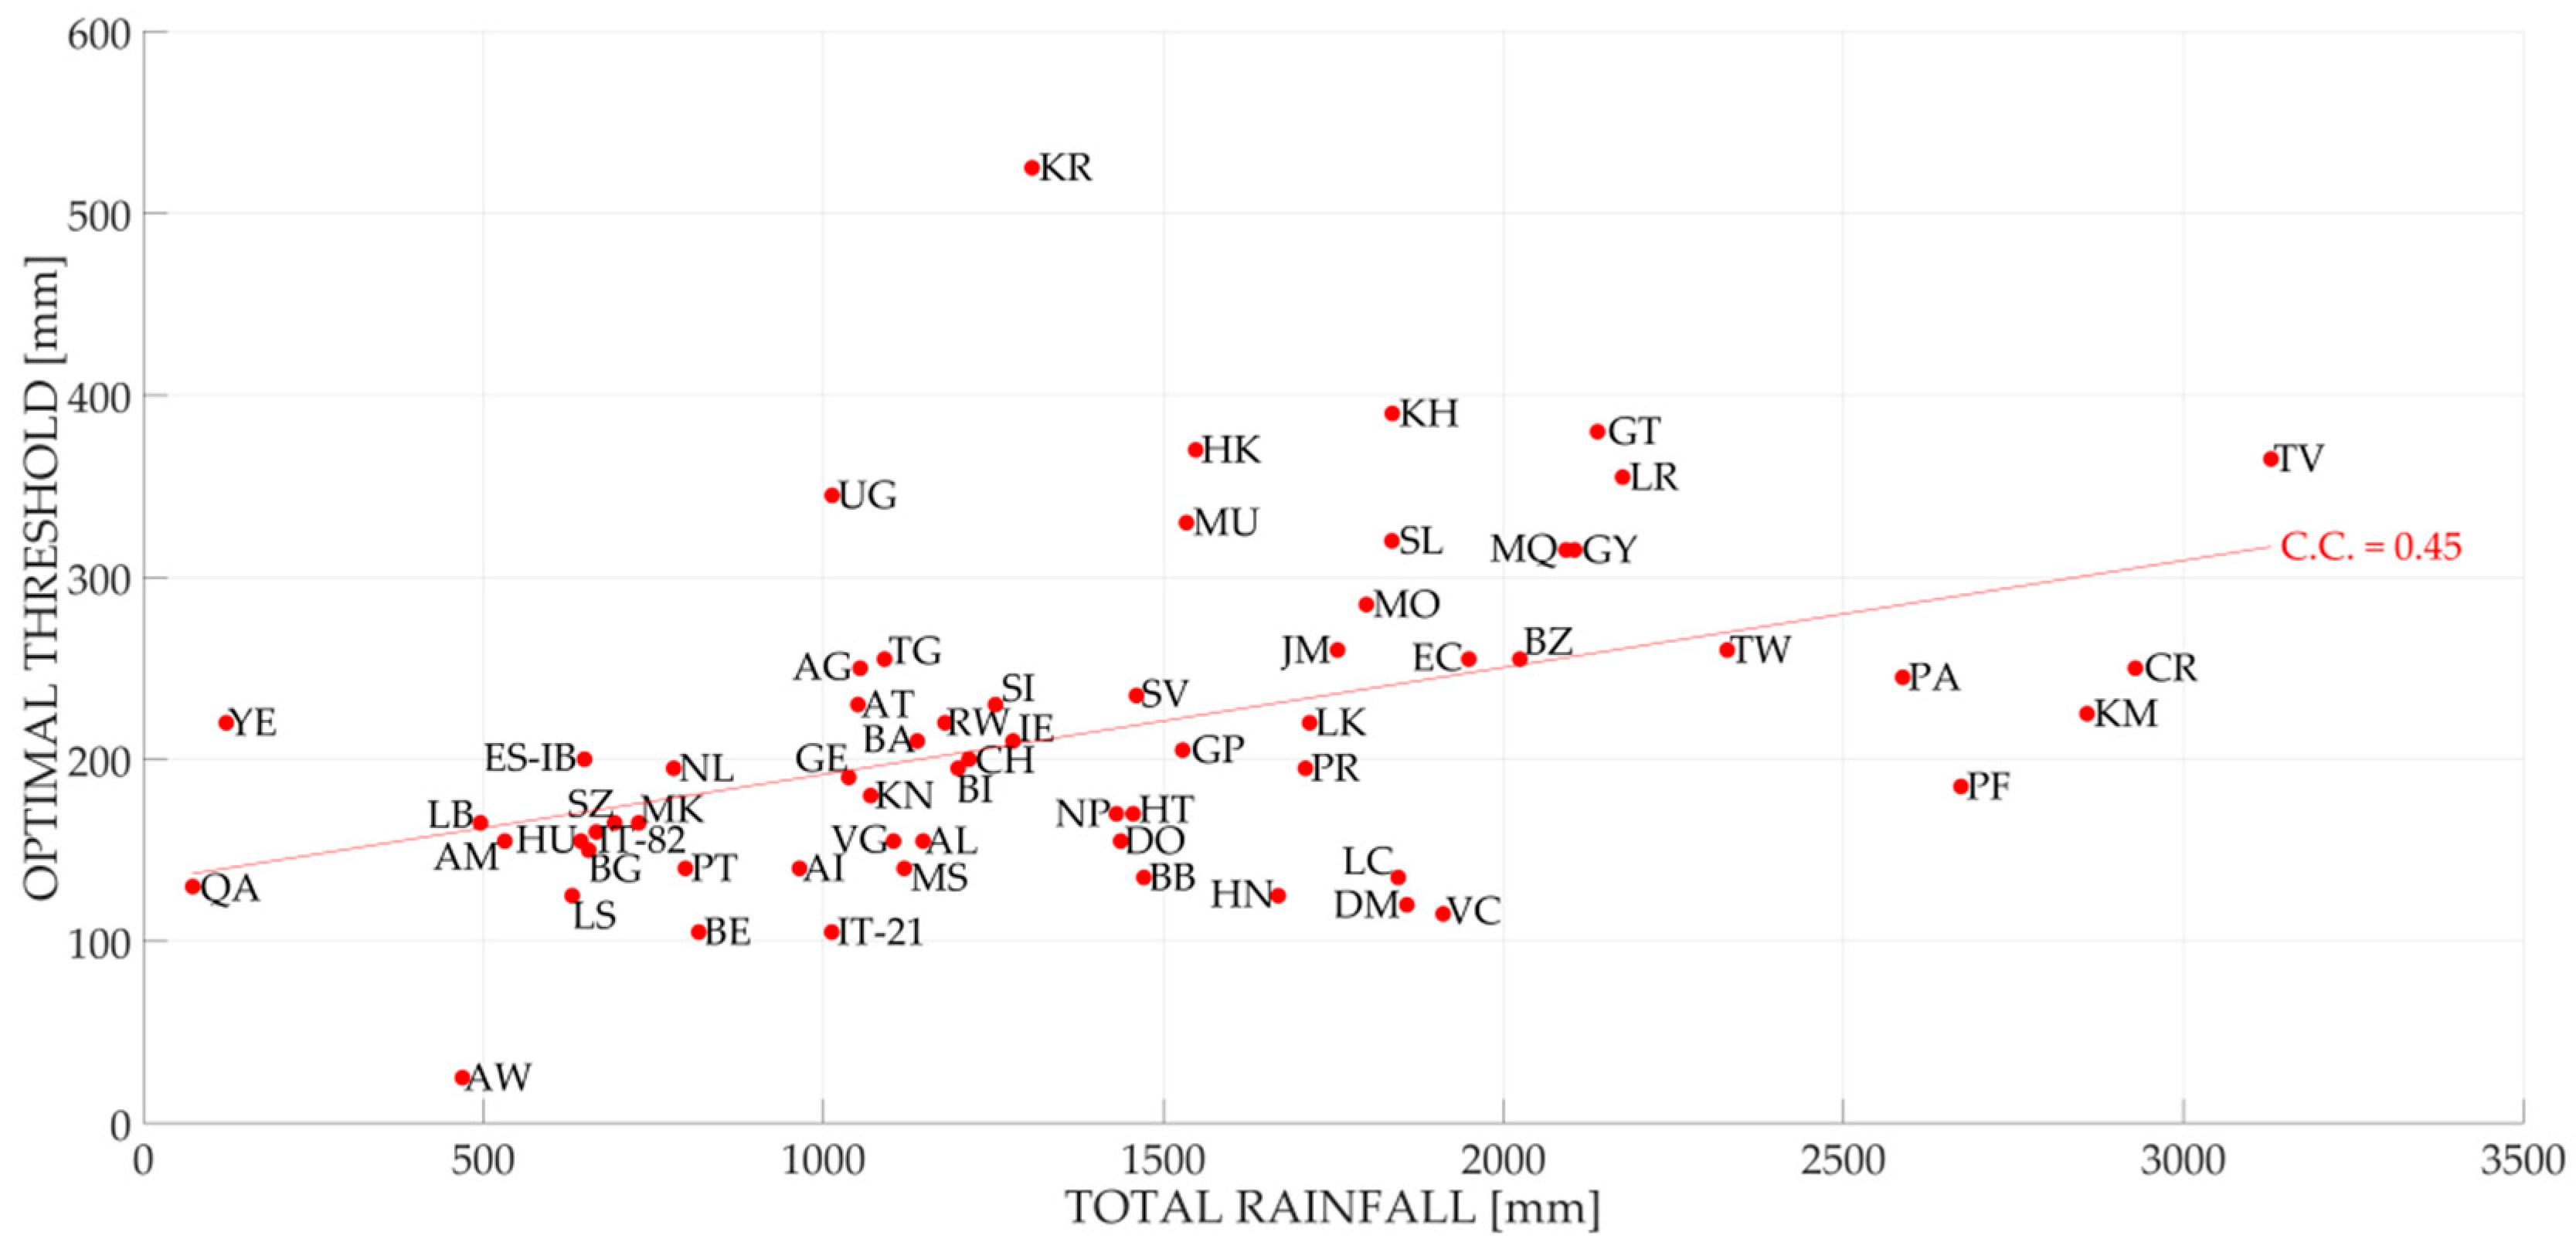
Figure 8.
A comparison between the results obtained for a 24-h aggregation interval: Both the total cost (a) and the percentage of identified events (b) were derived using a false alarm cost equal to 1 and a missed alarm cost equal to 5. The horizontal axis was labelled with the parameters used in the simulations performed during the development of the new extreme rainfall detection methodology: the first value represents the percentage of the total rainfall while the values reported between the square brackets correspond to the lower and the upper boundaries. When no lower or upper boundaries were used, the ∞ symbol was reported. Better results (compared to the one obtained using the threshold methodology adopted in the previous version of ERDS) are highlighted with a red dot.

Figure 9.
The ERDS performance compared to the disaster type: “A” represents “convective storms”, “B” represents “flood events”, “C” represents “hurricanes and cyclones”, “D” represents “heavy rain-induced landslides”, “E” represents “flash floods” and “F” represents “tropical storms”. (a) The results in terms of the number of events and (b) the results in terms of percentage.

Table 1.
An example of a contingency table usable to evaluate the quality of the predictions.
| Rain Gauge | ||||
|---|---|---|---|---|
| = 0 mm/h | >0 mm/h | |||
| Satellite | = 0 mm/h | Correct Negatives (A) | Misses (B) | Estimated Non events |
| >0 mm/h | False Alarms (C) | Hits (D) | Estimated Events | |
| Observed Non events | Observed Events | |||
Table 2.
The bias and MAE values calculated taking into account only the nonzero rainfall intensities both for the early (E) and for the late (L) products.
Table 2.
The bias and MAE values calculated taking into account only the nonzero rainfall intensities both for the early (E) and for the late (L) products.
| 1 h | 2 h | 3 h | 6 h | 12 h | 24 h | 48 h | 72 h | 96 h | 120 h | 144 h | 168 h | ||
|---|---|---|---|---|---|---|---|---|---|---|---|---|---|
| BIAS | E | −0.51 | −0.39 | −0.33 | −0.24 | −0.17 | −0.13 | −0.09 | −0.08 | −0.07 | −0.07 | −0.07 | −0.07 |
| L | −0.53 | −0.41 | −0.35 | −0.26 | −0.19 | −0.13 | −0.10 | −0.09 | −0.08 | −0.07 | −0.07 | −0.07 | |
| MAE | E | 2.19 | 1.58 | 1.28 | 0.87 | 0.59 | 0.40 | 0.28 | 0.23 | 0.20 | 0.19 | 0.18 | 0.17 |
| L | 2.11 | 1.55 | 1.26 | 0.87 | 0.59 | 0.40 | 0.28 | 0.23 | 0.20 | 0.19 | 0.18 | 0.17 |
Table 3.
False alarm ratio (FAR), probability of detection (POD) and critical success index (CSI) mean values calculated both for the early (E) and for the late (L) products.
Table 3.
False alarm ratio (FAR), probability of detection (POD) and critical success index (CSI) mean values calculated both for the early (E) and for the late (L) products.
| 1 h | 2 h | 3 h | 6 h | 12 h | 24 h | 48 h | 72 h | 96 h | 120 h | 144 h | 168 h | ||
|---|---|---|---|---|---|---|---|---|---|---|---|---|---|
| FAR | E | 0.58 | 0.56 | 0.55 | 0.51 | 0.46 | 0.40 | 0.32 | 0.27 | 0.23 | 0.19 | 0.17 | 0.14 |
| L | 0.56 | 0.54 | 0.52 | 0.48 | 0.44 | 0.37 | 0.30 | 0.25 | 0.22 | 0.18 | 0.16 | 0.14 | |
| POD | E | 0.47 | 0.53 | 0.57 | 0.64 | 0.71 | 0.78 | 0.85 | 0.88 | 0.91 | 0.93 | 0.94 | 0.95 |
| L | 0.51 | 0.56 | 0.59 | 0.65 | 0.71 | 0.78 | 0.84 | 0.88 | 0.90 | 0.92 | 0.93 | 0.94 | |
| CSI | E | 0.28 | 0.31 | 0.33 | 0.38 | 0.43 | 0.51 | 0.60 | 0.67 | 0.72 | 0.76 | 0.79 | 0.82 |
| L | 0.30 | 0.33 | 0.35 | 0.40 | 0.45 | 0.53 | 0.61 | 0.67 | 0.72 | 0.76 | 0.80 | 0.82 |
Table 4.
The bias and MAE values calculated both for the early (E) and for the late (L) products, taking into account only heavy rainfall conditions.
Table 4.
The bias and MAE values calculated both for the early (E) and for the late (L) products, taking into account only heavy rainfall conditions.
| 1 h | 2 h | 3 h | 6 h | 12 h | 24 h | 48 h | 72 h | 96 h | 120 h | 144 h | 168 h | ||
|---|---|---|---|---|---|---|---|---|---|---|---|---|---|
| BIAS | E | −10.35 | −9.01 | −8.02 | −6.21 | −4.59 | −3.18 | −2.16 | −1.72 | −1.50 | −1.31 | −1.19 | −1.08 |
| L | −10.02 | −8.71 | −7.76 | −6.03 | −4.48 | −3.10 | −2.11 | −1.68 | −1.47 | −1.29 | −1.17 | −1.06 | |
| MAE | E | 11.88 | 10.31 | 9.18 | 7.10 | 5.17 | 3.57 | 2.41 | 1.89 | 1.63 | 1.41 | 1.26 | 1.13 |
| L | 11.58 | 10.07 | 8.97 | 6.96 | 5.07 | 3.49 | 2.36 | 1.84 | 1.60 | 1.39 | 1.24 | 1.11 |
Table 5.
The threshold values used in the current extreme rainfall detection methodology.
| Aggregation Interval (hours) | (%) | Lower Bound (mm) | Upper Bound (mm) |
|---|---|---|---|
| 12 | 6 | 100 | 150 |
| 24 | 8 | 120 | 210 |
| 48 | 12 | 140 | 240 |
| 72 | 15 | 170 | 260 |
| 96 | 16 | 190 | 280 |
Table 6.
The ERDS performance (a comparison between the results obtained with the previous thresholds and with the current ones).
Table 6.
The ERDS performance (a comparison between the results obtained with the previous thresholds and with the current ones).
| Previous Thresholds | Current Thresholds | |
|---|---|---|
| 12-h Aggregation Interval | - | 150 * |
| 24-h Aggregation Interval | 131 * | 137 * |
| 48-h Aggregation Interval | 85 * | 120 * |
| 72-h Aggregation Interval | 48 * | 112 * |
| 96-h Aggregation Interval | 39 * | 118 * |
| Total Number of Identified Events | 135 * | 162 * |
| % of Identified Events | 64% | 76.8% |
* On a total of 211 disasters analyzed.
© 2019 by the authors. Licensee MDPI, Basel, Switzerland. This article is an open access article distributed under the terms and conditions of the Creative Commons Attribution (CC BY) license (http://creativecommons.org/licenses/by/4.0/).
Share and Cite
MDPI and ACS Style
Mazzoglio, P.; Laio, F.; Balbo, S.; Boccardo, P.; Disabato, F. Improving an Extreme Rainfall Detection System with GPM IMERG data. Remote Sens. 2019, 11, 677. https://doi.org/10.3390/rs11060677
AMA Style
Mazzoglio P, Laio F, Balbo S, Boccardo P, Disabato F. Improving an Extreme Rainfall Detection System with GPM IMERG data. Remote Sensing. 2019; 11(6):677. https://doi.org/10.3390/rs11060677
Chicago/Turabian StyleMazzoglio, Paola, Francesco Laio, Simone Balbo, Piero Boccardo, and Franca Disabato. 2019. "Improving an Extreme Rainfall Detection System with GPM IMERG data" Remote Sensing 11, no. 6: 677. https://doi.org/10.3390/rs11060677
Note that from the first issue of 2016, this journal uses article numbers instead of page numbers. See further details here.