Development of Supraglacial Ponds in the Everest Region, Nepal, between 1989 and 2018


1
Graduate School of Environmental Science, Hokkaido University, Sapporo, Hokkaido 060-0810, Japan
2
Faculty of Environmental Earth Science, Hokkaido University, Sapporo, Hokkaido 060-0810, Japan
*
Author to whom correspondence should be addressed.
Remote Sens. 2019, 11(9), 1058; https://doi.org/10.3390/rs11091058
Submission received: 25 March 2019
/
Revised: 22 April 2019
/
Accepted: 2 May 2019
/
Published: 5 May 2019
(This article belongs to the Special Issue Remote Sensing of Environmental Changes in Cold Regions)
Abstract
:Several supraglacial ponds are developing and increasing in size and number in the Himalayan region. They are the precursors of large glacial lakes and may become potential for glacial lake outburst floods (GLOFs). Recently, GLOF events originating from supraglacial ponds were recorded; however, the spatial, temporal, and seasonal distributions of these ponds are not well documented. We chose 23 debris-covered glaciers in the Everest region, Nepal, to study the development of supraglacial ponds. We used historical Landsat images (30-m resolution) from 1989 to 2017, and Sentinel-2 (10-m resolution) images from 2016 to 2018 to understand the long-term development and seasonal variations of these ponds. We also used fine-resolution (0.5–2 m) WorldView and GeoEye imageries to reveal the high-resolution inventory of these features and these images were also used as references for accuracy assessments. We observed a continuous increase in the area and number of ponds from 1989–2017, with minor fluctuations. Similarly, seasonal variations were observed at the highest ponded area in the pre- and postmonsoon seasons, and lowest ponded area in the winter season. Substantial variations of the ponds were also observed among glaciers corresponding to their size, slope, width, moraine height, and elevation. The persistency and densities of the ponds with sizes >0.005 km2 were found near the glacier terminuses. Furthermore, spillway lakes on the Ngozompa, Bhote Koshi, Khumbu, and Lumsamba glaciers were expanding at a faster rate, indicating a trajectory towards large lake development. Our analysis also found that Sentinel-2 (10-m resolution) has good potential to study the seasonal changes of supraglacial ponds, while fine-resolution (<2 m) imagery is able to map the supraglacial ponds with high accuracy and can help in understanding the surrounding morphology of the glacier.

1. Introduction
High Mountain Asian glaciers are the perennial sources of water for approximately 1.4 billion people [1]. Glaciers in this region are losing their mass and volume [2,3,4,5] at a significant rate due to a warming climate. The increased storage of meltwater from glaciers and snow in the form of supraglacial and proglacial lakes is also an indication of volumetric loss of glacier ice and snow [6,7]. The number of glacial lakes and supraglacial ponds have been increasing in size and number [8,9] in the region. Supraglacial ponds are common features on the surfaces of relatively slow-moving, debris-covered glaciers [10] in comparison to clean glaciers. These features grow by the coalescence of small ponds [11]. About 13–36% of the Himalayan region’s glacierized area exhibits debris cover [12], which shows very slow movement rates at their tongues [13,14]. The debris-covered glaciers have heterogeneous surfaces with debris thickness ranging from a few centimeters to meters, and they have different thermal properties [15]. The thermal properties of the debris play an important role in the heat conduction from the surface to debris–ice interface. Setting of the debris-covered glaciers favors the formation and expansion of supraglacial ponds, whose hydrological buffering roles remain unconstrained [12]. Supraglacial ponds are known for meltwater storage [16], progressively buffering the runoff regimes of the glacier-originated river in increased projections of debris cover [12]. They play an important role in the ablation of debris-covered glaciers [17,18] through absorbing atmospheric energy [19,20]. The majority of absorbed atmospheric energy leaves the pond system through englacial conduits [16,20,21], and hydraulic connection of pond to englacial water level exerts a key control on whether the pond contributes to longer-term terminus disintegration [10]. This process enlarges the englacial conduits which can collapse the roof of the conduits, leading to the formation of ice cliffs and new ponds [20,22,23]. However, the majority of ponds occupy closed basins with no perennial connection to the englacial system and can undergo rapid growth until they find the connection [24]. Ponds are highly recurrent and persistent with high interannual variability [19], but small ponds have the potential to expand rapidly [25].
Previous studies on supraglacial ponds have shown that the ponded areas change from year-to-year [11,16,19,26], which may be due to the downwasting of glaciers [4,5,6,27]. These features also show substantial seasonal variations in response to draining and freeze–thaw activities in different seasons [19], and seasonal differences in the ice melt [28]. The condition of pond formation according to the glacier’s characteristics, including slope and surface velocity has also been demonstrated [18,19,29,30].
The use of multitemporal satellite imagery is a common technique for monitoring large glacial lakes [9,11,31,32,33,34]. Several previous studies were conducted in the Nepal Himalaya, focusing on the development of such lakes (e.g., [31,34,35,36]), hazard assessments (e.g., [13,30,34,37,38]), and community involvement in glacial lake research (e.g., [39,40]). Most of these studies demonstrated the development of glacial lakes usually on a decadal basis [8,41,42], and were regionally aggregated [11]. Furthermore, these studies were glacier or lake specific [13,24,43,44] or used one time satellite imagery [45]. Remote sensing techniques are also used for monitoring supraglacial ponds [16,19,26]. Spatial, seasonal, and interannual patterns of the ponds for five debris-covered glaciers in the Langtang Valley, Nepal were studied [19] using Landsat images of 30-m resolution, which found high variability in the emergence of ponds among glaciers and also pronounced seasonal variations.
The Everest region in the Nepal Himalaya can be considered a hotspot of glacial lakes and supraglacial ponds [16,37,45]. However, there is no research being conducted on the spatial and seasonal variations and long-term development of the ponds on an annual basis, despite their importance in studies on the impact of recent climate change [45,46]. Such studies are also important in understanding the evolution of ponds into large glacial lakes in the future. Efforts for documenting the development of the ponds and their variations were made in the region [16] by using satellite imageries of 0.5–2 m resolution. However, this study incorporated only eight glaciers and used historical imageries only from 2000 to 2015.
To address this shortcoming, we assessed the development of supraglacial ponds on all of the 23 debris-covered glaciers in the region. Our first aim was to present the historical development of the supraglacial ponds on annual basis from 1989 to 2017, to understand the year-to-year variations and long-term evolution in the Everest region of Nepal. We used atmospherically corrected surface reflectance Level-2 science products of Landsat images for this purpose. Secondly, we aimed, for the first time in this area of research, to understand the seasonal variations of the ponds by analyzing Sentinel-2 images of 10-m resolution in combination with long-term development. Our third aim was to prepare a high-resolution inventory (2-m spatial resolution) of the supraglacial ponds by using WorldView-2, WorldView-3 and GeoEye-1 images for 2015–2016. Finally, we evaluated the relationship between the ponded areas and the morphometric characteristics of the glaciers.
2. Materials and Methods
2.1. Study Area
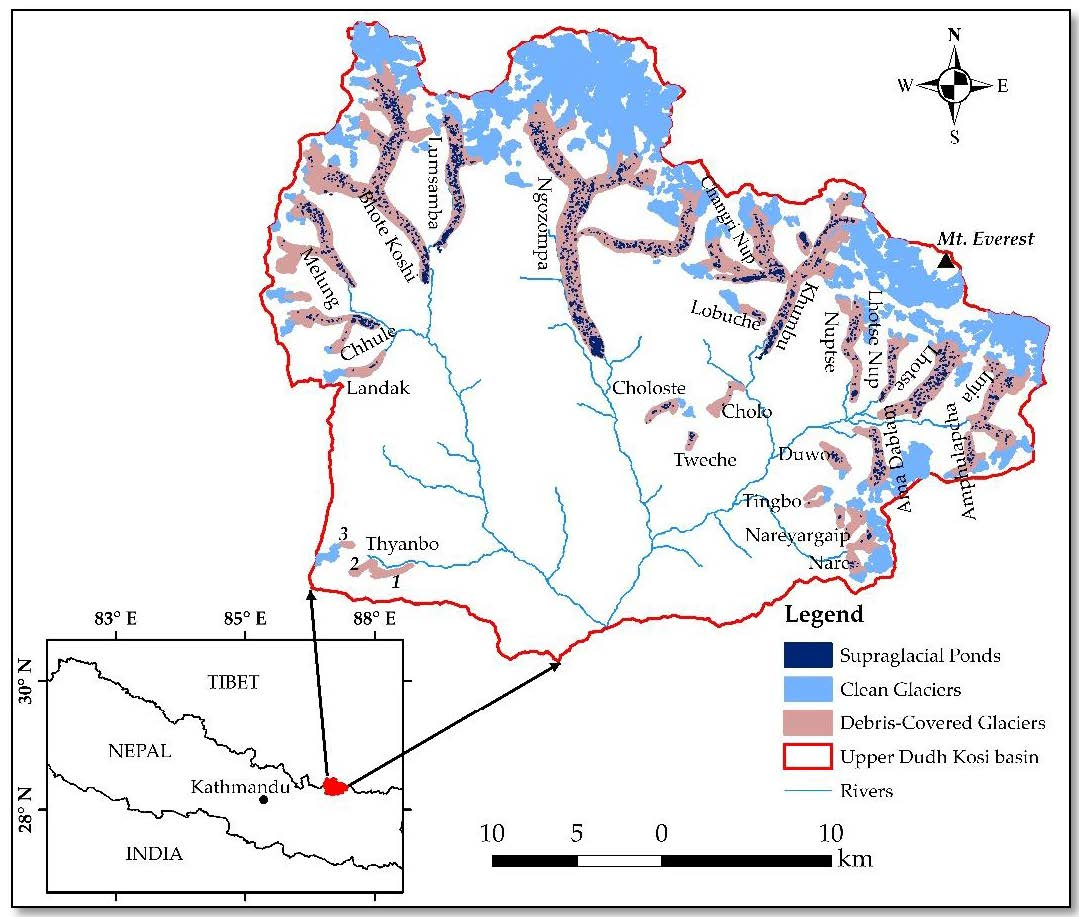
The Everest region is located in the Solukhumbu District in the northeastern part of Nepal (Figure 1). This area includes Sagarmatha (Mt. Everest) National Park (SNP), a World Heritage site that is the highest mountainous area in the world. This region includes the upper catchment of the Dudh Koshi River (DKR) basin, which is one of the most widely glaciated regions in the Nepal Himalaya. This river is one of the seven major tributaries of the Koshi River. The SNP covers the northern part of the DKR basin, and encompasses an area of 1148 km2, with elevations ranging from 2845 m a.s.l. at Jorsalle to 8848 m a.s.l. at the peak of Mt. Everest. More than 60% of the park area has an elevation higher than 5000 m. The total number of glaciers in the whole DKR basin is 287 and cover an area of 391.1 km2 which was 9.62% of the basin in 2010 [47]. The glaciers in this region are characterized by the presence of debris in their lower reaches. The debris area covers approximately 28% (110 km2) of the total glacier area in the DKR basin [47]. The SNP includes 132 glaciers covering an area of 262 km2 which is 23% of the park area.
We chose 23 debris-covered glaciers in the SNP covering approximately 88% and 230.7 km2 of the total glacier area in the park. The debris portion of the selected glaciers occupy an area of 103.4 km2, which is 45% of the total area of the studied glaciers. Debris-covered glaciers slope relatively gently in comparison to clean glaciers and have the potential to form large glacial lakes. All supraglacial ponds that were plotted by Salerno [45] in 2008 covered 18% of the total lake area in the park. These supraglacial ponds are precursors to large glacier lakes. They are vulnerable to increasing temperatures. The Nare Drangka and Dig Tsho glacial lakes experienced glacier lake outburst floods (GLOFs) in 1977 and 1985, respectively. Some of the supraglacial ponds on the Lhotse and Changri Shar Glaciers also experienced GLOFs in 2015, 2016 [48], and in 2017 [49], respectively. Inter- and intra-annual changes in glacier-scale ponded areas of up to 17% and 52% respectively, have been observed, which indicates drainage events, pond expansion and coalescence, and melt season pond expansion [16].
2.2. Datasets and Preprocessing
To assess the evolution and variation of the supraglacial ponds from 1989 to 2018 we used data from multiple platforms and sensors with medium to high resolution. These were Landsat (30-m resolution), Sentinel-2 (10-m resolution); WorldView-2, WorldView-3 and GeoEye-1 (2-m and 0.5-m resolution).
2.2.1. Landsat
We used surface reflectance Level-2 science products of the Landsat 5 Thematic Mapper (TM), Landsat 7 Enhanced Thematic Mapper (ETM+), and Landsat 8 operational land imager (OLI) to study the long-term development of the supraglacial ponds. These products were available after 1987 for our study site. Images were downloaded from the USGS website for each year from 1987 to 2017. Unfortunately, no suitable scenes were available from the same month for each year, which would minimize error from monthly variation of the ponds due to the presence of significant cloud during the summer monsoon season and snow during the winter and premonsoon season. Seasonal changes in glaciers and glacial lakes are relatively minor from September to December [50]. Therefore, images that lie within the three-month period of October to December (Figure 2) were selected for the whole period except for 1990, 2013, and 2014. We obtained the images from January for 1990 and September for 2013 and 2014. Most utilized scenes were without snow or cloud cover on the debris portions of the glaciers and were suitable for pond identification. However, no suitable scenes were available for 1987, 1988, 1991, 1997, 1999, 2006, 2007, 2011, and 2012 due to extensive snow or cloud cover and data gaps caused by a scan line error. We used two scenes for 2014, one from September, and the other from November, to minimize the effect of clouds. In total, 23 scenes (Table S1) were used for the 22 different years for our study. Surface reflectance products are atmospherically corrected products using a radiative transfer model, which are the Second Simulation of Satellite Signal in the Solar Spectrum (6S) for the Landsat 5 and 7 and an internal algorithm for Landsat 8. In these models, the effects of water vapor, aerosol, and ozone were removed to obtain accurate surface reflectance. Landsat images were also radiometrically calibrated and orthorectified using ground control points and a digital elevation model (DEM).
2.2.2. Sentinel-2
We obtained Sentinel-2A and 2B images for 2016–2018 from the European Space Agency’s (ESA) Sentinel Scientific Data Hub, incorporating the postmonsoon (October), winter (December–January), and premonsoon (April–May) seasons (Figure 2). Two scenes of Sentinel-2 were acquired to cover the entire study area for each period. We acquired images from two time periods of the same month for the premonsoon season of 2018 to minimize the error due to freezing of the ponds. We used 14 Sentinel 2A and four Sentinel 2B images of the level 1C (Table S2) covering the entire study area for the eight different time periods. The ESA sen2cor plugin, which is available on the Sentinel Application Platform (SNAP) was used for atmospheric and terrain correction of the Level 1C images and to produce an atmospherically corrected Level 2A bottom of atmosphere (BOA) reflectance product. The Level 2A product is similar to that of the Landsat surface reflectance product. We chose only 10-m resolution bands, being Blue, Green, Red, and Infrared bands for our study’s purposes. A mosaic of two scenes of the same period was created to incorporate the entire area.
2.2.3. WorldView and GeoEye
High-resolution WorldView and GeoEye images from 2015 and 2016 were obtained from the DigitalGlobe Foundation. We obtained the 0.5-m (panchromatic) and 2-m (multispectral) resolution Basic 1B imagery products (Level 1) of WorldView-2, WorldView-3 and GeoEye-1 images (Table S3). These images were radiometrically and sensor corrected but not projected to a plane using a map projection or datum. Therefore, we orthorectified each scene in ERDAS Imagine using rational polynomial coefficients and the 30-m Shuttle Radar Topography Mission (SRTM) DEM. These images covered 22 of the 23 debris-covered glaciers studied here and were used to prepare the high resolution inventory map of the supraglacial ponds in the SNP.
2.2.4. Digital Elevation Model (DEM)
We obtained High Mountain Asia 8-m DEMs derived from along-track optical imagery, version 1 for the period 2015 to 2016 from the Earth Data website [51] for an analysis of glacier characteristics. These DEMs were generated from very-high-resolution (VHR) stereoscopic imagery from DigitalGlobe satellites. We filled the gap that existed in each of the individual DEM tiles using the focal statistics tool in ArcMap and the filled tiles were mosaicked to cover the entire glacier area. However, these DEMs have significant data gaps in accumulation zones of the glaciers so we used the SRTM DEM based on data collected in 2000 to identify the accumulation and ablation areas.
2.3. Methods
2.3.1. Glacier Characteristics
We manually identified and digitized the boundaries of the 22 debris-covered glaciers using 2-m resolution images of WorldView and GeoEye from 2015 to 2016. A Sentinel-2 image from 2016 was used for the Thyanbo Glacier, for which high-resolution images were not available. In our study, the terminus of the Changri Nup and Changri Shar Glaciers were merged together and considered a single glacier, the Changri Nup Glacier. The Imja and Lhotse Shar Glaciers were also merged together and considered a single glacier, the Imja Glacier. Clean-type glaciers were ignored from the inventory in our study.
We evaluated eight descriptive metrics for the debris-covered area of the glaciers and compared them with ponded areas using Spearman’s rank-order correlation [19]. We produced correlation coefficients (rs) ranging from a perfect negative correlation (−1) to a perfect positive correlation (+1).
The total glacier area, debris-covered area, and width of the glaciers were determined by using the outlines of the glaciers. We averaged the width of the glaciers based on 3–13 transects, depending on the sizes of the glaciers. The minimum and mean elevations of the debris-covered glaciers were computed based on the 8-m DEM, assuming that air temperature has a strong control on the surface mass balance of the glaciers. Similarly, the accumulation-area ratio (AAR) was calculated based on the equilibrium-line altitude (ELA) of 5477 based on a previous study in the Everest region [52]. We approximated the average height of the moraine from the glacier surface (DGM) based on the 3–13 transects to understand the cumulative downwasting of the glacier surface [19,29]. Similarly, we estimated the mean gradients of the glaciers using a recent 8-m DEM, which has a strong control on pond formation and distribution [19,30,45]. The aspect of the debris-covered part of the glaciers was computed, however, rs was not estimated for this metric, and we used this metric solely to understand the dominance of the ponds on certain aspects of the glaciers.
The boundaries of the glaciers for 1990 was adopted from the glacier inventory of the ICIMOD [47] and were modified to obtain the extent of the debris-covered area using Landsat images of the corresponding period. The boundaries of the debris-covered glaciers from the 1990s were used as references to map the supraglacial ponds for the entire study period.
2.3.2. Supraglacial Pond Mapping
Automatic lake mapping methods for glacial lakes and supraglacial ponds have been well discussed [16,19,53]. However, the possibility of misclassification and omission of ponds increases significantly with moderate resolution of the dataset [16]. Manual editing is recommended to increase the accuracy of the mapping [54,55], and therefore, to improve the results, we adopted postediting after applying the water index and band ratios. Preprocessed scenes of each Landsat, Sentinel, and WorldView and GeoEye images were clipped to the boundary of the debris-covered glaciers. Several combination of bands for normalized difference water index (NDWI) have been proposed by several previous studies [11,19,53,56]. Modified NDWI (MNDWI) that uses the SWIR and Green band is useful in built-up or urbanized area to minimize the noise [56]. The bands used in MNDWI are similar to normalized difference snow index (NDSI) and it omits the ponded area especially when pond is frozen. The NDWI proposed by [53] uses the Blue band in combination with NIR band, which misclassify the ponded area as shadow area [11], especially in high mountain areas with significant shadow. Therefore, here we used NDWI by using NIR and Green band (Equation (1)) for each scene as used by previous studies (e.g., [11,19,53,57,58]) to delineate the boundaries of the supraglacial ponds.
Band ratios (BR1) of green-to-near-infrared (Equation (2)) were applied, which is useful for differentiating between moisture and nonmoisture [19].
The presence of shadow leads to misclassified ponds [53] due to similar reflectance with water bodies. Therefore, we used the quality assessment (QA) band available in the Landsat surface reflectance product and scene classification algorithm in sen2cor for Sentinel-2 images to remove the effect of the shadow. The above-mentioned metrics did not work efficiently for the images with snow cover and frozen ponds. Prior efforts to identify snow have used NDSI [59] which is similar to the MNDWI (Equation (3)) [56], but cannot differentiate between the presence of snow and water bodies.
The mask obtained from the conventional NDSI leads to the significant removal of ponds. Therefore, considering that snow had the highest reflectance in the mountains, we applied the spectral metric (BR2) (Equation (4)).
Supraglacial lakes are evident where the surface gradient of a glacier is less than 2° [18,19,30], while discrete and small isolated ponds are evident where slopes are between 2 and 10° [18]. This suggests that a glacial lake can expand in a debris-covered glacier which has low inclination and little ice flux from upstream [60]. We used a higher surface slope threshold of 30° [19] to eliminate steep avalanche fans or icefall from the debris-covered area in which ponds can form.
In our work, initially, we applied several thresholds of NDWI that range from 0.0 to 0.50 and checked the results from each threshold. The results obtained from threshold 0.3 was better than the other results, which was crosschecked with the histogram of NDWI. Similar approach was applied to detect threshold for BR2 and threshold of 1.2 for BR1 used by [19] was adopted. Finally, ponds that met the slope threshold as well as NDWI > 0.3 or BR1 > 1.2 and BR2 > 0.45 were delineated, following an approach similar to [19] and [11]. However, the threshold values can vary with time and may lead to overestimation and underestimation of ponds. Therefore, all delineated ponds were checked for accuracy and edited manually to minimize the error due to variations in thresholds values and reflectance among turbid and blue ponds. During manual editing, we edited the boundaries of ponds by including all pure pixels of water body and about half of the pixels that surround the pure pixels. Different area thresholds have been used for glacial lake mapping, ranging from 0.003 to 0.1 km2 [11,37,41,61,62]. The possibility of an overestimation of a pond area can increase at smaller thresholds (4 pixels or less), particularly for coarse resolution images. Therefore, we used the minimum of 5 pixels [50] for mapping supraglacial ponds, an area of 0.005, 00005, 0.00002 km2 for the Landsat, Sentinel, and WorldView and GeoEye images, respectively. Polygons smaller than these thresholds were removed. We also generated the Sentinel-2 and WorldView and GeoEye ponds with an area threshold of 0.005 km2 to compare with the Landsat ponds.
3. Results
3.1. Glacier Distribution and Characteristics
The morphometric characteristics of the debris portions of the 23 glaciers studied for 2015–2016 are presented in Table 1. They exhibited a wide range of geometric conditions. The smallest glacier was Tweche Glacier (0.31 ± 0.003 km2) in which no accumulation zone was observed, while the largest was Ngozompa Glacier with a total area of 77.71 ± 0.24 km2, with debris-covering area of 25.99 ± 0.09 km2. The proportion of debris-covered glaciers to the total glacier area ranged from 30% (Khumbu) to 100% (Tweche). The average glacier width was 465.8 m. The two extremes were Changri Nup Glacier, with the largest average width of 923 m, and Thaynbo Glacier, with the smallest average width of 206 m. The mean DGM, that is, the elevation difference between the lowest elevation of the glacier and the dominant outermost lateral moraine peak elevation, was 63.2 m. The Thyanbo Glacier had the lowest mean DGM (15 m), and the Imja Glacier had the highest mean DGM (129 m). The minimum elevation of all glaciers (debris-covered area) exceeded 4600 m a.s.l., with the exception of Cholo and Thyanbo glaciers that extended below 4500 m a.s.l. Only six glaciers had a mean elevation below 5000 m a.s.l.
The mean slope of the glaciers ranged from 6.8° (Lumsamba) to 20.3° (Tingbo), and 11 glaciers had mean surface gradients below 10°. Only four glaciers, Ngozompa, Imja, Nareyargaip, and Khumbu glaciers, had an accumulation area greater than 50% and the remainder of the glaciers were dominated by the ablation part with debris-covered portions. The Cholo and Thyanbo glaciers were oriented towards the east, with mean average azimuth of 88.8°, while the remainder of the glaciers were oriented towards the south (south, southwest, and southeast) with an average azimuth of 188.7°.
3.2. High-Resolution Inventory of Supraglacial Ponds in the Everest Region
Our mapping of supraglacial ponds in the Everest region using 2-m resolution imagery and an area threshold of 0.00002 km2 has identified 3009 ponds (Figure 1) with a total area of 2.04 ± 0.32 km2 and a mean size of 0.0007 km2 in the years 2015 and 2016. The Shapiro–Wilk distribution test at 95% confidence interval reveals that the distribution of ponds was not normal (Figure 3a,b) and skewed positively with a factor of 20.9. The probability distribution of ponded area reveals that ~98% (n = 2949) of ponds had an area of <0.005 km2, which contributes approximately 45% of total ponded area (Figure 3b). Only ~2% (n = 60) of the supraglacial ponds of sizes >0.005 km2 contribute to 55% of the total ponded area. The three largest studied glaciers, Ngozompa, Bhote Koshi, and Khumbu glaciers feature 60% of the total ponded area among 22 glaciers, and the maximum number (896) and area (0.61 ± 0.1 km2) of supraglacial ponds were observed in the Ngozompa Glacier. The majority of the glaciers (n = 14) that have debris-covered areas <5 km2 (Table 1) exhibited only 13% of the total ponded area.
We observed significant variability in pond cover among the studied glaciers, ranging from 0.03% (Tingbo Glacier) to 3.89% (Khumbu Glacier) of the debris-covered area in 2015 and 2016. The rank-order correlation coefficient between pond area and different morphometric characteristics of the glaciers was estimated and it exhibited a very strong rank-order correlation with the total glacier area (rs = 0.90) and debris area (rs = 0.90), a strong correlation with the mean slope (rs = −0.75), mean elevation (rs = 0.72), and glacier width (rs = 0.70), and a moderate correlation with the AAR (rs = 0.61) which is statistically significant at 99% confidence level. However, no significant rank-order correlation was found for glacier minimum elevation (rs = −0.11) and DGM (rs = 0.21). The altitudinal area distribution of the ponds shows that supraglacial ponds can be found as high as ~5560 m a.s.l., ~200 m lower than the upper extent of debris portion of the glacier (Figure 4a). Most ponds were concentrated at lower reaches of the glacier, below 5200 m a.s.l. and the highest area (~20%) of the pond was observed between 5100 and 5200 m a.s.l. About 87% of the ponded area was observed in the glaciers with slopes of <10°, of which 55% of the ponded area was observed on slopes from 2–6°, 17% on slopes <2° and 15% on slopes from 6–10° (Figure 4b).
3.3. Long-Term Evolution of the Ponds
Between 1989 and 2017 we mapped a total of 1026 supraglacial ponds (>0.005 km2) in the Everest region on the surfaces of 23 debris-covered glaciers. We excluded the large pond at the Changri Nup Glacier for an analysis. This was observed in only a few images due to the presence of shadow. Approximately 59% (n = 594) of the supraglacial ponds were <0.01 km2 in size, which accounts for only one-third of the total ponded area over the period studied. Of the total ponded area studied during the period, ponds with sizes of 0.01–0.02 km2, and >0.02 km2 had ponded areas of 32% (n = 294), and 35% (n = 120), respectively.
The Shapiro–Wilk distribution test statistics at 95% confidence interval reveals that the distribution of ponds was not normal (Figure 5a) and skewed positively with a factor of 4.23. The skewness factor was reduced to 3.71 when we ignored the large ponds at one of the tributaries of the Khumbu Glacier. The probability distribution of ponded area also reveals that ~90% (n = 923) of ponds have an area <0.025 km2, and approximately 96% (n = 983) of the ponds have an area <0.05 km2, which contributes approximately 60% and 73% of total ponded area between 1989 and 2017, respectively (Figure 5b,c). Only 4% (n = 43) of the ponds comprise approximately 27% of the total pond coverage. It is notable that the distribution of supraglacial ponds according to dimensional size was also far from normal in each year, with an abundance of small ponds and few large ponds. The frequency of ponds in the 0.02 to 0.04 km2 dimensional class has increased significantly in recent years, which was also indicated by the increase in the median size of the ponds.
We observed an overall increase in area (Figure 6a,d) and number (Figure 6b) of ponds from 1989 to 2017, with minor fluctuations (Tables S4–S6). The overall area of the ponds has increased from 0.378 ± 0.19 km2 in 1989 to approximately 1.324 ± 0.727 km2 in 2017, representing an overall growth of 350%. The size of the ponds and lakes varied from 0.005 to 0.13 km2, with a mean size of 0.015 ± 0.019 km2 (Figure 6c). The rate of increase was comparatively slower between 1980 and 2005 (0.01 km2/yr) than between 2008 and 2017 (0.07 km2/yr). In the 1989 imagery, 25 supraglacial ponds were identified and this number increased to 85 (340%) in 2017, with the highest number of ponds in 2015 (88). The number of ponds almost doubles between 1989 and 2002, slightly decreases between 2003 and 2005, and increases rapidly from 2009. The year-by-year variations in number and total area for different dimensional classes of supraglacial ponds show that the frequency of small-sized ponds (<0.01 km2) was higher than the larger ponds (>0.02 km2) in each studied year, however, the area covered by larger ponds contributes significantly more than the small ponds in the majority of years (Figure 6b,d). We observed the highest increase in the number of ponds that have dimensional classes of <0.01 km2 in the recent period. However, the highest increase in pond areas was observed in the dimensional class of >0.02 km2. The increase in pond areas with the class >0.02 km2 ranges from 45 to 54% after 2008. Ponds were observed in 16 of the 23 studied glaciers in the region, whereas ponded areas were not observed in the Cholo, Choloste, Landak, Nare, Tingbo, and Tweche glaciers (<1 km2). However, a significant ponded area was observed in frequent years from 1989 to 2017 in the smaller Lobuche Glacier (0.45 km2).
3.3.1. Glacier Wise Trends of Pond Cover
The glaciers studied here demonstrate the significant variability in pond cover over time. Of the 23 glaciers we investigated, supraglacial ponds were observed in nine glaciers in 1989 and 16 glaciers in 2014 and 2015, while no ponds were observed in 13 and 7 glaciers in 1989 and 2017, respectively. All glaciers except for Lobuche Glacier experienced either increments in area of ponds or the appearance of new ponds. The increments of pond cover vary among the glaciers, and the largest increase in number, from 8 to 27 and in area, from 0.063 ± 0.048 to 0.424 ± 0.237 km2 was observed on the Ngozompa Glacier during the period studied of 28 years (Figure 6a). Similarly, the Bhote Koshi and Khumbu glaciers contributed significant increases in ponded area. The Ngozompa, Bhote Koshi, and Khumbu glaciers exhibited a total ponded area of 81% in 1989 and 67% in 2017. The Ngozompa Glacier alone contributed approximately 32% of total ponded area in 2017. The Nareyargaip and Lumsamba glaciers record increased pond coverage by approximately ten times than that in 1989, although the actual increase in pond area was 0.053 km2.
Substantial interannual variation in the ponded area was observed due to draining of the ponds within the year. The ponded area on the Ngozompa Glacier increased by approximately 370% from 1990–1993 and then decreased until 1996. This variation in pond area was contributed to by the formation and development of one large pond (0.1 km2) 1.5 km from the current outlet of the glacier. It was almost completely drained (0.007 km2) by 1994. Similarly, a large pond on the Bhote Koshi Glacier also lost its size by 530% within a period of 1–2 years, from 1990–1992 and contributed to a decrease in ponded area on this glacier within this period.
The Thyanbo, Chhule, Melung, Bhote Koshi, Lumsamba, Ngozompa, Khumbu, and Nuptse glaciers exhibited the presence of either spillway lakes or ponds near their terminuses. However, the area of the spillways on the Ngozompa, Bhote Koshi, Khumbu, and Lumsamba glaciers increased significantly. Most of these ponds were larger than the ponds in the upstream region and exhibited ~40% of the total ponded area in 2017.
3.3.2. Pond Persistency
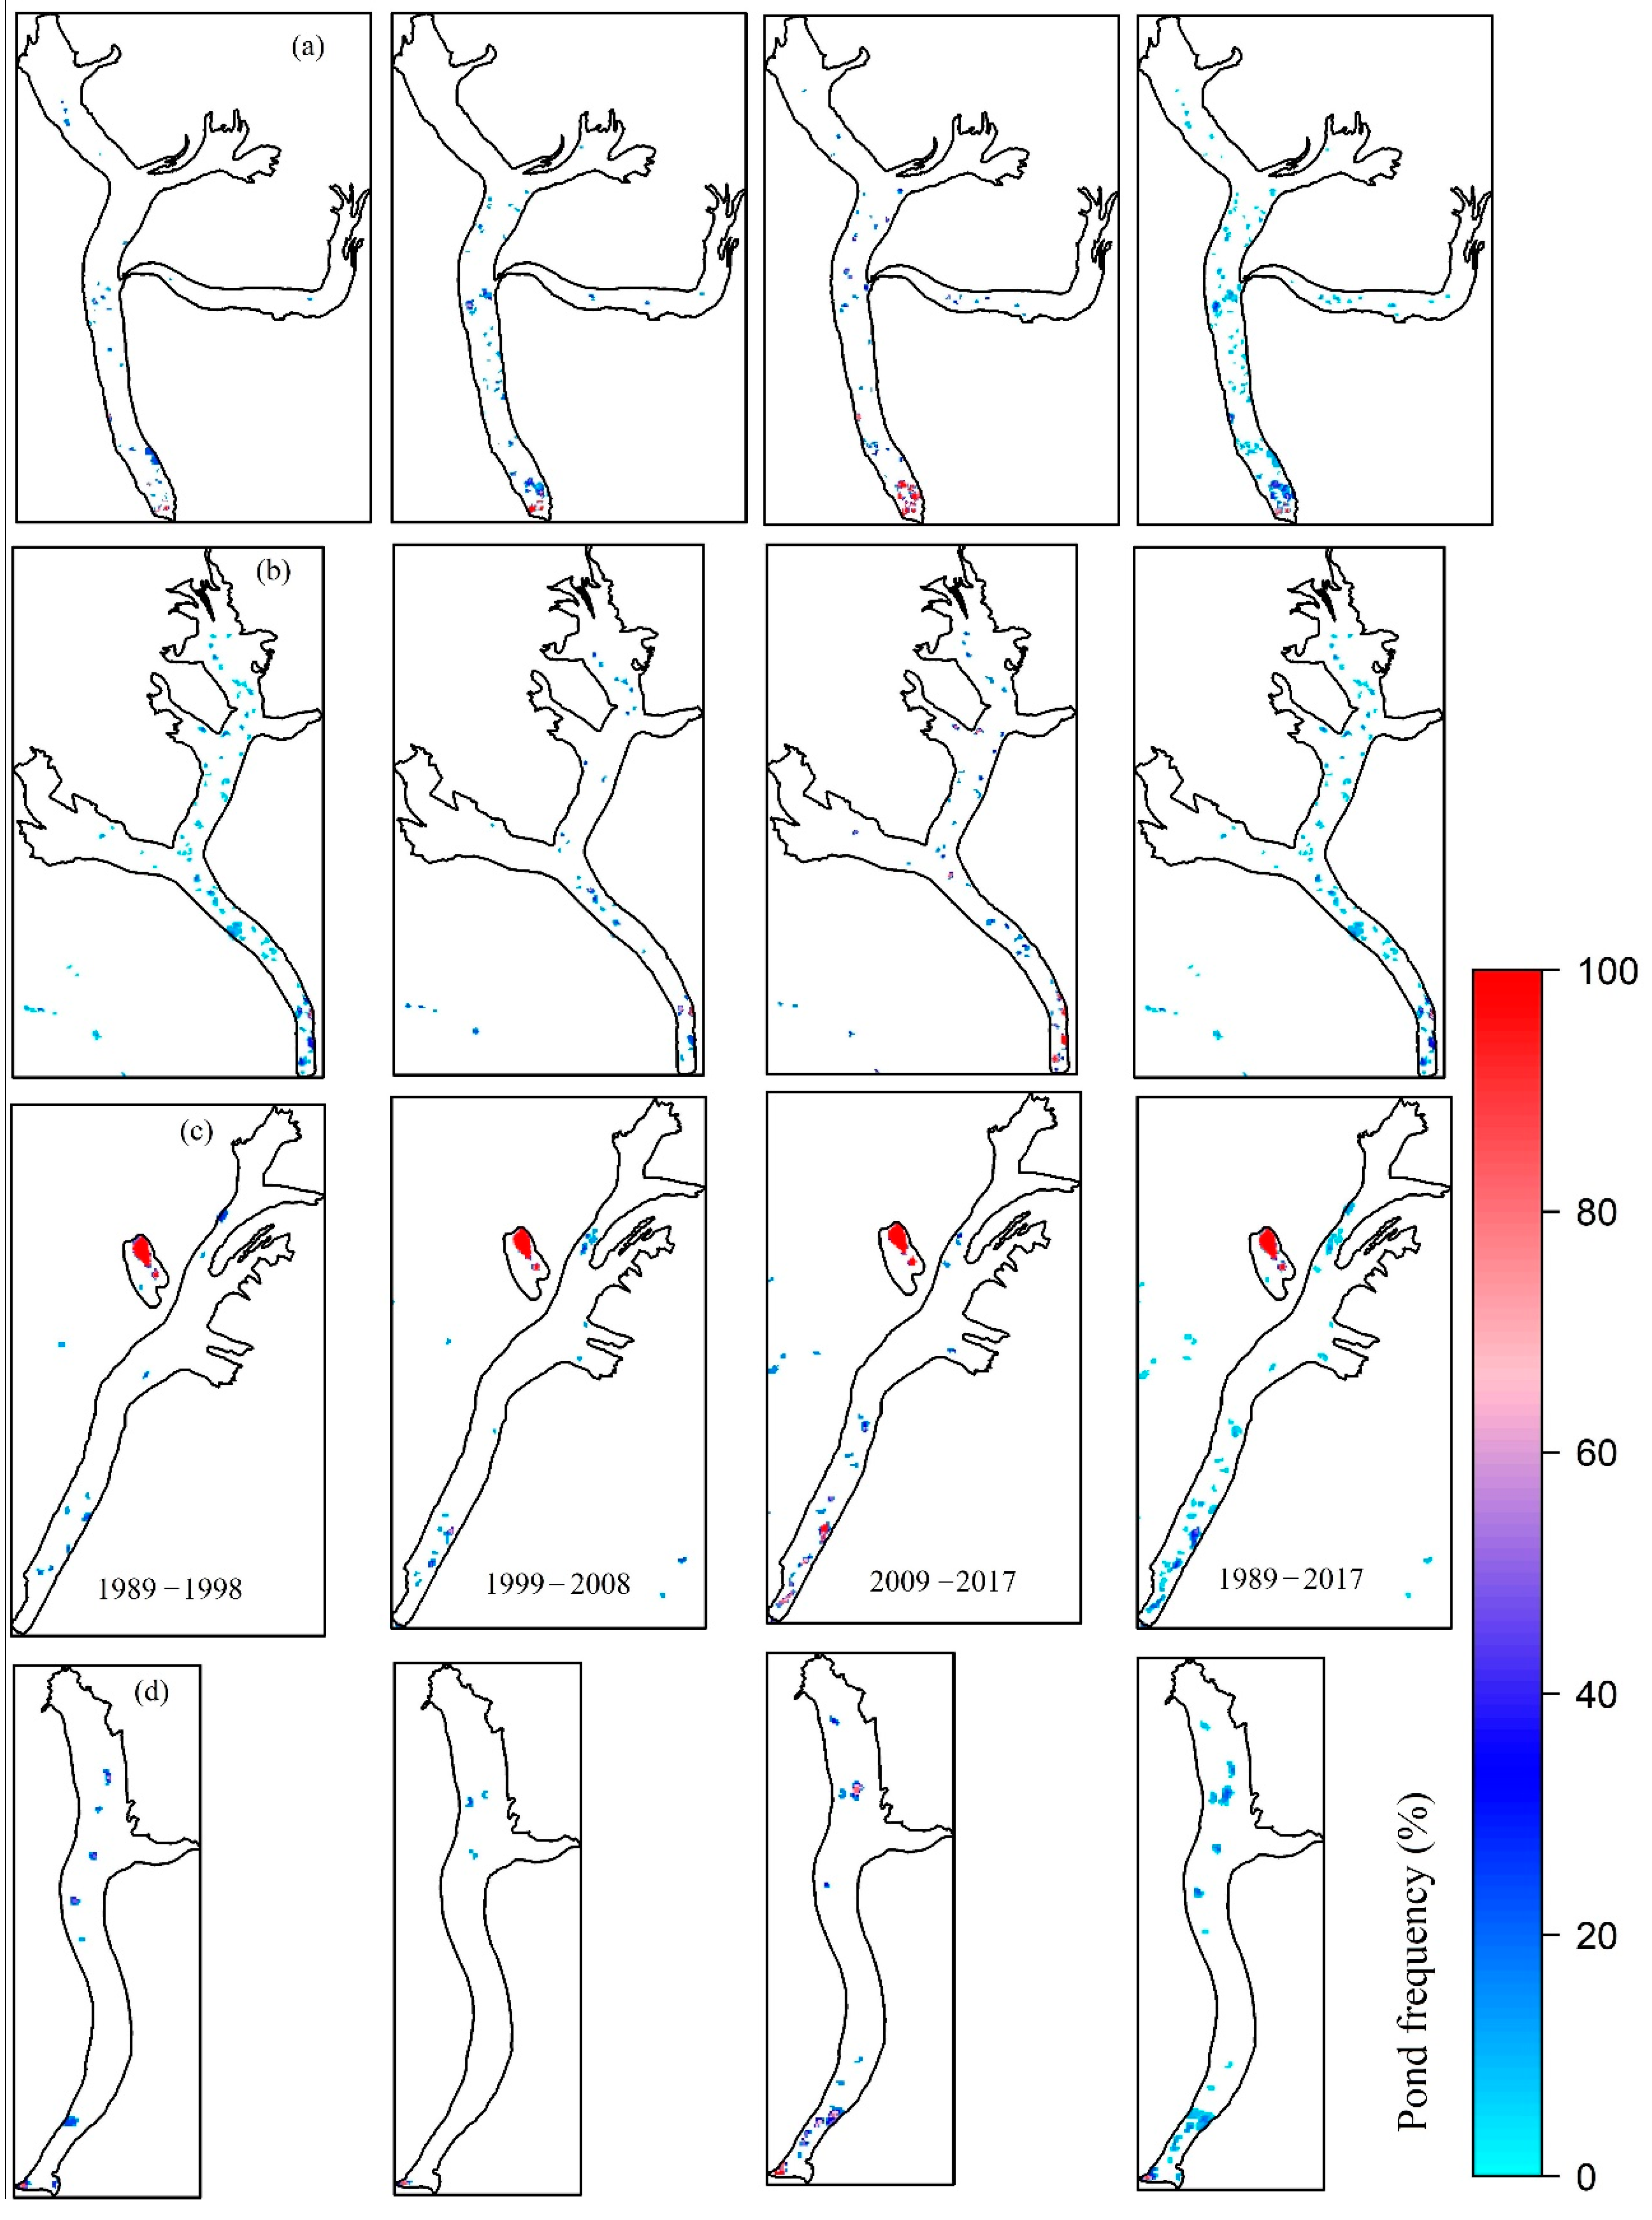
Pond persistency is described in terms of the frequency of the ponds. Most ponds at the glacier terminuses, especially on Ngozompa, Khumbu, and Bhote Koshi glaciers were very persistent (Figure 7). One of the tributaries of the Khumbu Glacier had a very persistent pond over 22 scenes over the studied 28-year period, with very little expansion in size. However, ponds in the smaller glaciers with relatively higher slopes tend to be less persistent for a longer time period (Figure S1). Pond frequency maps for the periods 1989–1998, 1999–2008, and 2009–2017 were computed to highlight the expansion, distribution, and persistence between different shorter periods. The distribution of ponds has expanded and shows more persistence in the later period (2009–2017) than in the early and middle periods.
3.4. Seasonal Pond Cover
We mapped a total of 3027 supraglacial ponds (>0.0005 km2) for eight different seasons between January 2016 and May 2018. The mean size was 0.0046 ± 0.0014 km2. Supraglacial pond cover in the Everest region shows no clear trend among seasons; however, the smallest number and area of the ponds were recorded in the winter season (Figure 8). Ponded areas in the pre- and postmonsoon seasons of 2016 were very similar at 1.7 ± 0.55 km2; however the highest number and area of the ponds were observed in the premonsoon season of 2018.
4. Discussion
4.1. Supraglacial Pond Inventory Using Remote Sensing
We used the multitemporal and multiresolution satellite imageries for monitoring the long-term development and short-term variations of the supraglacial ponds in the Everest region and updated the glacier inventory of the ICIMOD [47] for the 23 debris-covered glaciers of the region using 2-m resolution imageries.
We were able to prepare the historical inventory for 28 years from 1989 to 2017 by using Landsat images of medium resolution with area thresholds of >0.005 km2 (5 pixels). The supraglacial ponds smaller than this size were excluded from our historical inventory. The 10-m Sentinel-2 images were used for seasonal variations of the ponds and 2-m WorldView and GeoEye imageries were used to prepare the high-resolution inventory of the supraglacial ponds. The areal uncertainty of the delineated features for ponds and glaciers was generated by multiplying a perimeter by half of a cell resolution [36,50] and was varied among different resolutions. The values of uncertainties estimated using this method is higher. However, we used manual editing technique after applying automatic mapping. Therefore, highly accurate boundaries of ponds are expected from our study, which was crosschecked by using 0.5-m resolution panchromatic band of WorldView imageries. Higher-resolution panchromatic images (0.5-m) were available for 25 and 29 October 2016, which was almost the same time period as that of Sentinel-2 (30 October 2016) and Landsat (10 November 2016), and these were used for an accuracy assessment of the ponds. These images covered the Khumbu, Nuptse, Lhotse Nup, and Lhotse glaciers. Ponds (>0.005 km2) on these glaciers were manually digitized using panchromatic images. The mean uncertainty of ponds for the 0.5-m resolution images was 1.25%, which can be considered negligible. We analyzed the aerial error by comparing the area of the ponds obtained from 0.5-m resolution images with 2-, 10-, and 30-m resolution images. We found 12 supraglacial ponds covering an area of 0.3 km2 on the surface of the four glaciers (>0.005 km2) and found total areal difference of 5.7, 9.2, and 14.9% with 2-, 10-, and 30-m resolutions, respectively, for the total ponded area. However, the maximum aerial error for individual ponds ranged from 20 to 85% for different resolution imageries. High error among individual ponds was mainly caused by the inability of the semiautomatic method to detect narrow channels that connect the ponds, which can be manually mapped with high-resolution images. Nevertheless, the majority of the ponds (65–75%) had an aerial error of less than 7, 14, and 22% for the 2-, 10-, and 30-m resolution imageries, respectively. Few cases of the ponds which were mapped using three different sensors are available in supplementary file (Figure S2).
The inventory using 2-m resolution with thresholds of 5 pixels for each image suggested that Landsat and Sentinel-2 images were unable to map 45% and 13%, respectively, of the total ponded area. These statistics were 98% and 83% of the total number of ponds mapped by 2-m imagery for the Landsat and Sentinel-2 imagery, respectively. The inventory also revealed that ponds <1 pixel of Landsat (900 m2) accounted for 19% of the total ponded area and those <1 pixel of Sentinel-2 accounted for 4% of total ponded area. These estimations were upper bounds and are comparable with other findings [16]. These results suggest that Landsat images are suitable for understanding the long-term development of supraglacial ponds with sizes of >0.005 km2. Our estimations also suggest that Sentinel-2 images have the potential to study seasonal variations, and that WorldView images can be used for higher accuracy, detailed inventories of the ponds. The fluctuation of shallow and small size ponds can be large and require images with <10-m resolution [16,63]. The amount of sediments in the ponds and when frozen also hindered the pond mapping with coarse resolution imagery [16,64]. The capability of 15-m ASTER images to detect and monitor the supraglacial lakes in comparison to much coarser resolution has been highlighted [64]. Here, we demonstrated the application of the 10-m Sentinel-2 images to detect and monitor supraglacial ponds on a seasonal basis. Sentinel-2 imageries with 10-m spatial resolution and 5-day temporal resolution can potentially be used for mapping supraglacial ponds of sizes >0.0005 km2, which may help to understand, with higher accuracy, the short-term variations of the ponds.
4.2. Spatial, Temporal, and Seasonal Trends in Supraglacial Pond Development
We used satellite imagery with different resolutions ranging from 2-m to 30-m to study the long-term development and short-term variation of the ponds as well as to prepare the high-resolution inventory. Previous studies on supraglacial ponds in the Everest region were conducted by using single image or by using imageries which cover part of the Everest region or by decadal timespan studies [16,41,45]. However, year-to-year variations of the ponds from glacier-to-glacier are required to understand the pond dynamics of a studied glacier. Here, we present the year-to-year, season-to-season, and glacier-to-glacier variations of the supraglacial ponds in the SNP, Nepal. The results from this historical study reveal an increase in the number and area of the ponds with substantial temporal, spatial, and seasonal variations. The detection of substantial increases in area of the supraglacial ponds suggests that ice melt is increasing at a higher rate in recent time periods [4,5], and that ice melt is much higher at ice cliffs with supraglacial ponds [18,65]. Ponds that occupy a closed basin with no perennial connections can undergo rapid growth [24], and development of new ponds increase heat absorption, which increases ice melt through under- and side-cutting [20]. The development of new ponds also enhances the growth of the ponds.
The increase in the area and number of ponds can be attributed to the increase in temperature in this region. We used the Asian Precipitation–Highly-Resolved Observation Data Integration Towards Evaluation of the Water Resources (APHRODITE) dataset [66] to understand the general trend of temperature for the region. Point data at an elevation of 5000 m a.s.l. were extracted from the gridded dataset. Temperature shows a decreasing trend (−0.04 °C/yr) from 1961 to 1988 (Figure 9a) and an increasing trend (0.02 °C/yr) from 1989 to 2015 (Figure 9b). Significant surface lowering of glaciers in many parts of the Himalayas has been observed [2,3,5] with increase in temperature which resulted in lowering surface gradient and glacier velocity [14], which favors the development of supraglacial ponds and glacial lakes [24,67,68]. Wastage of glacier in recent period provides the sufficient melt water to develop the supraglacial ponds and helps in expanding their size [10,17,43], which may likely grow monotonically if glaciers continue losing their mass [24] . The expansion in ponded area contributes substantially to ablation of the glacier due to undercutting, calving, and melting imposed by ponded water.
The results of seasonal variation of the ponds obtained from the 10-m Sentinel-2 imageries show the intra-annual dynamics for three seasons: premonsoon, postmonsoon, and winter, corresponding to seasonal ice melt [15,28]. Here, we excluded the monsoon season because satellite observations during monsoon periods are severely limited by sporadic cloud cover. Considering the three seasons for analysis, supraglacial pond cover in the Everest region showed the least during the winter season and ponded area was comparable in the premonsoon and postmonsoon seasons. Seasonality of the ponds by previous studies due to the ablation processes of the glaciers in different seasons has been reported [19,26]. The main reason for less pond cover during the winter season is the unavailability of melt water and the presence of a frozen surface, which makes accurate mapping challenging.
4.3. Glacier Characteristics and Pond Cover
We utilized the 2-m imagery to map the glacier boundaries of the 22 debris-covered glaciers and pond covers on them. The debris-covered areas of the studied glaciers showed significant variability in pond cover in 2015 and 2016, ranging from 0.03% (Tingbo Glacier) to 3.89% (Khumbu Glacier) of the debris-covered area. The pond cover on each glacier was correlated with the glacier’s characteristics and showed very strong rank-order correlation with the total area of the glacier and debris-covered area [19] and strong correlation with the slope and width of the glacier. This also suggests higher pond cover for the larger glaciers, which generally have surface gradients of <10° [18]. In the Everest region, approximately 6, 45, and 69% of the glacier areas have slopes of less than 2, 6, and 10°, respectively, suggesting that all the glaciers studied have the potential to form supraglacial ponds.
The lowest percentage of pond cover on the Tingbo Glacier is correlated with its smallest size and steepest mean slope (20.3°) of all the glaciers studied. Similarly, the highest pond cover on the Khumbu Glacier is the result of a low mean gradient (7.6°) and stagnant tongue [14]. A series of several interconnected ponds at the terminus (0.12 km2) and a large pond of the same size at a tributary of the glacier in 2017 contributed to the significant pond cover on the Khumbu Glacier. The highest area of pond (0.61 km2) in the Ngozompa Glacier was also highly correlated with its largest area, low mean slope, high DGM [29,49], and glacier width, with southern aspect (Table 1). Similarly, Bhote Koshi, Changri Nup, and Lumsamba glaciers exhibited high pond cover of 1.6, 3.1, and 3% of the debris-covered area and covered an area of 0.28, 0.23, and 0.16 km2, respectively. The higher ponded area on these glaciers can be explained by the large debris-covered area, low mean slope, southern aspect, and higher DGM and width of the glaciers (Table 1). The ponded area is also strongly correlated with mean elevation of the glaciers, corresponding to large area of the glaciers at higher elevations (5000–5300 m a.s.l.) and less area of the glaciers at lower elevations (4400–4900 m a.s.l.).
4.4. Future Development of the Lakes and Associated Risk
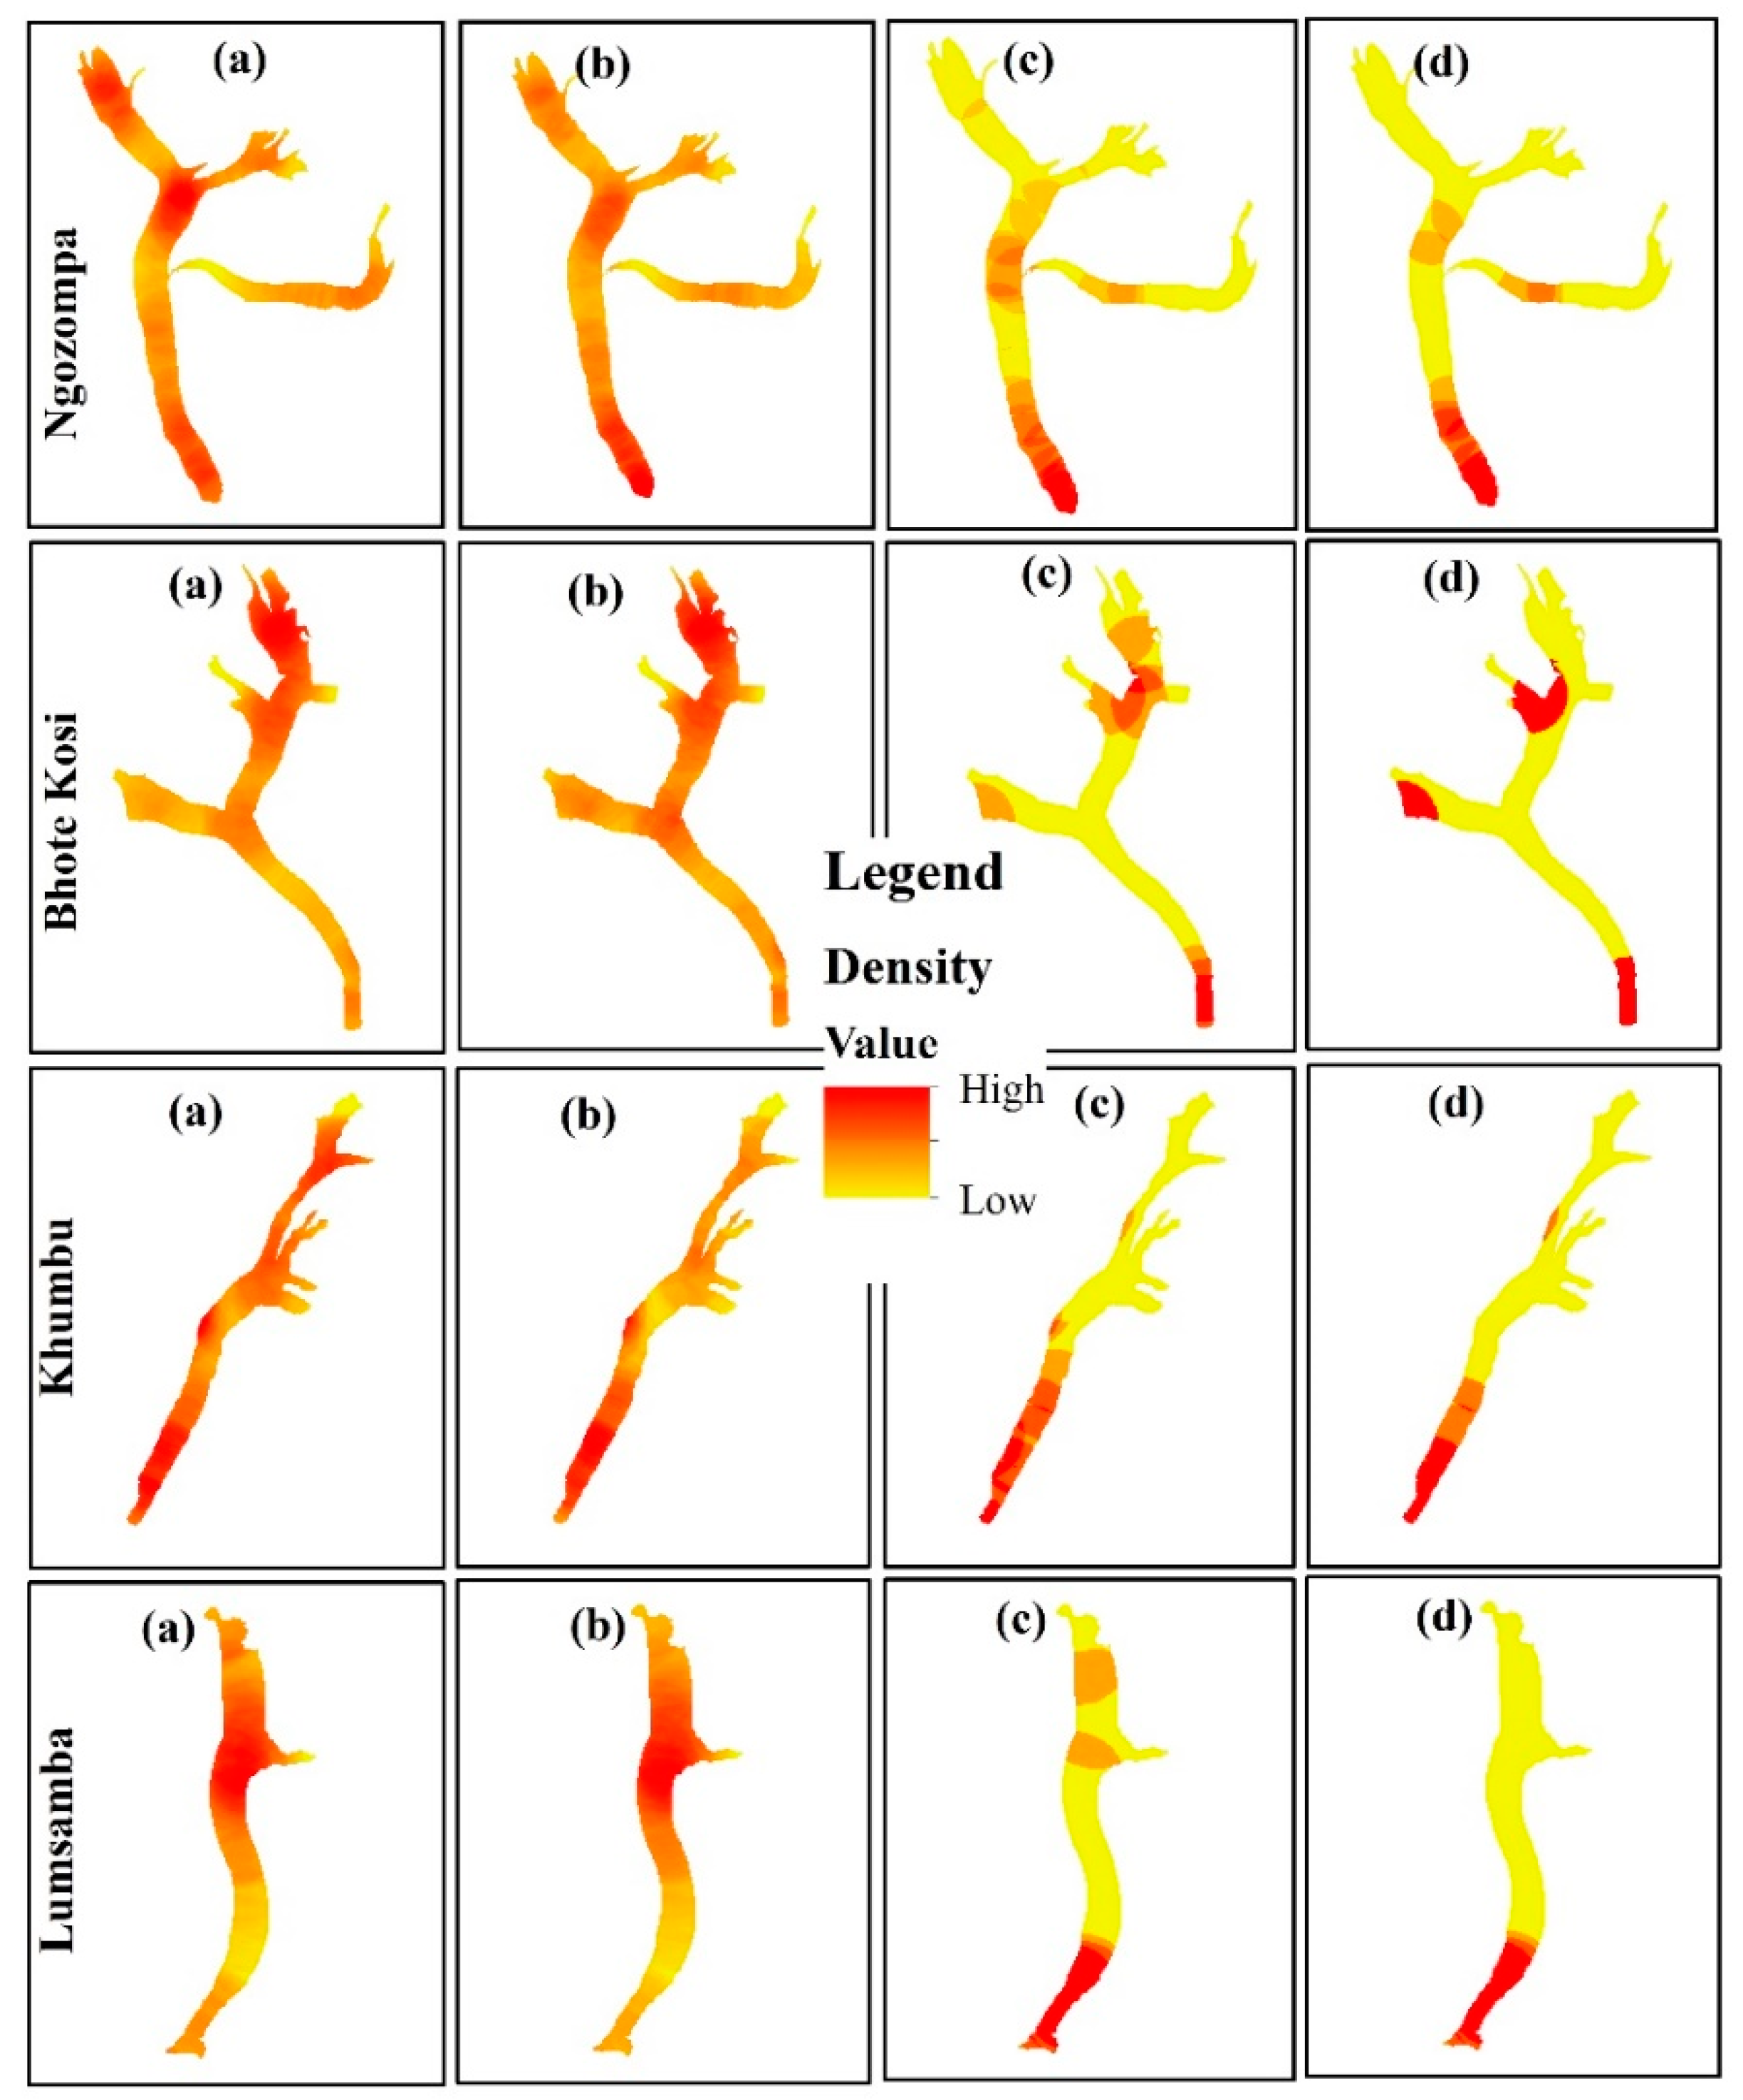
A significant increase in the area and number of ponds in the Everest region was clearly observed. The ponds which are located above the level of outlet channel of the glacier can grow until they are intercepted by an englacial conduit, and may fully or partially drain [44]. However, nearly half of the total ponded area is contributed to by the ponds near the terminus (up to ~2 km) of the glaciers where the slope was 0–4°. The highest densities of the ponds with sizes >0.005 km2 at the terminuses of the four larger glaciers (Figure 10) suggest that these glaciers have the potential to form a large lake. A series of ponds may evolve into a large glacial lake [31,33,34,44], corresponding to warming temperatures and a trend of negative glacier mass balance [4,6,27] if the level of outlet channel remains at the same elevation. An increasing temperature can reduce the snow extent, and reducing albedo also reduces glacier extent [67], which provides more melt water to the ponds. Furthermore, we found an increase in area by 16% from the 1990s to 2016 in the debris-covered portion of the glaciers in the Everest region. We expect a potential increase in the ponded area in the future. Lakes with sizes <0.1 km2 have been considered as less hazardous [38]; however, drainage of supraglacial ponds with sizes <0.1 km2 also have the potential for GLOFs [48,49] by coalescing several ponds and contributing water from subglacial storage. Therefore, an estimation of the volume of these features is required [16] to understand the potential flood volume, although area–volume relationships can be used [16,49,62,63].
The spillway lakes on the Ngozompa, Bhote Koshi, Khumbu, and Lumsamba glaciers (Figure 11) appeared to have the greatest potential for developing into glacial lakes. This corresponds to the dominance of very gentle slopes (<2°) [18,29,30], stagnant glacier terminuses [14], and higher mean DGM (>60 m) [29]. Furthermore, these ponds are associated with islands of ice with cliffs, and well-built terminal moraines, which also favor a trajectory towards a large glacial lake [16]. Additionally, the lake-terminating glaciers are retreating and showed maximum thinning towards their termini [69], also indicates the sign of lake expansion. It is possible that the lowering of the glacier’s surface leads to a reduction in the gradients and may enhance the possibility of the development of glacial lakes [29].
Nepal has experienced greatest national-level economic consequences (22% of global total) due to glacier floods [70]. The total number of GLOF events in Nepal documented by [71] from different sources were 24 GLOFs and out of which 14 were originated within Nepal and 10 originated in Tibet which caused floods in Nepal. Further, recent GLOFs in Upper Barun Valley in 2017 [72], Bhote Koshi and Sun Koshi River in 2016 [73] has caused geomorphic and infrastructure damage, and fatalities. Additionally, floods that originated from supraglacial ponds were also recorded in Lhotse Glacier in 2015 and 2016 [48], and Changri Shar Glacier in 2017 [49]. The potential flood volume from the supraglacial ponds assumed to be smaller and hazard associated with this could be minor due to their small size in comparison to the large glacial lakes. However, the peak discharge of GLOF event that originated from supraglacial ponds in Lhotse Glacier was estimated to be 210 ± 43 m3s−1 with 2.65 × 10⁶ m3 of total maximum flood volume [48]. This event was supplemented by the stored water within englacial conduits through hydraulically efficient pathways and catastrophic glacier buoyancy. Therefore, catastrophic GLOFs might occur where series of supraglacial ponds are already developed with the presence of large spillway lakes specifically on large glacier, e.g., Ngozompa, Bhote Koshi, and Khumbu glaciers. Besides, several floods that originated from glaciers and caused serious floods in Nepal are not documented. The results obtained from our study through remote sensing techniques, can be used for “first-pass” hazard assessment in regions where field access is difficult [30]. Further detailed studies of the morphological characteristics of glaciers and the regular monitoring of lakes are required to understand the risk of GLOFs and glacier-related hazard management.
4.5. Limitations of the Study
We used Landsat images of 30-m resolution and mapped ponds with sizes >0.005 km2 (5 pixels) to understand the historical development, and this led to the omission of 45% of the total ponded area. Images from the monsoon seasons were not used in our study due to the presence of significant cloud cover in the images. The use of radar images with a similar resolution, which can penetrate cloud, is recommended to understand the dynamics of ponds in the monsoon season. Our study was limited in the areal estimation of ponds and volumetric estimations are suggested for hazard assessment. Furthermore, pond bathymetry is required [16] as well as an understanding of englacial connectivity [22]. The exponential expansion of spillway lakes on Ngozompa, Bhote Koshi, Khumbu, and Lumsamba glaciers suggests that they require detailed investigations to understand their trajectory toward large glacial lakes. Such knowledge is lacking in this area of research. Although we used 0.5-m resolution images for accuracy assessment, field-based studies are essential for more accurate mapping and to gain a better understanding of the surrounding morphology, particularly at the locations of spillway lakes. Recent new technology, the unmanned aerial vehicle (UAV), can be used for this purpose.
5. Conclusions
We presented an extensive application of multiresolution satellite imageries to study the historical development and seasonal variations in the Everest region. We also developed a high-resolution inventory of the supraglacial ponds in the region. We used atmospherically corrected images spanning 28 years for a long-term study and three years for understanding seasonal variations of the supraglacial ponds at the surface of all debris-covered glaciers in the region. The use of Sentinel-2 images with 10-m resolution to study the seasonal variations, and the use of historical Landsat imagery from 1989–2017 to study the year-to-year variations for 28 years is novel. Also novel is the high resolution inventory of the supraglacial ponds for 2015 and 2016 presented here.
Our results show that supraglacial ponds are widely distributed on glaciers in the Everest region, and also show the rapid increase in their area and number from 1989–2017. We mapped a total of 1026 supraglacial ponds with sizes >0.005 km2 for the entire period studied from 1989 to 2017, and only 25 in 1989 and 85 in 2017. We found a net increase in area of ponds of 350% in 28 years, from 1989–2017. High-persistence ponds were evident at the terminus of the glaciers and the persistency increased in the recent period (2009–2017) more than in the earlier period (1989–1998). It was also found that the densities of the ponds with sizes >0.005 km2 were highest around the terminus of the glaciers. Spillway lakes and associated ponds were observed at the tongues of Ngozompa, Khumbu, Bhote Koshi, and Lumsamba glaciers, where exponential expansion was found. This is suggestive of a large lake developing in the future. The seasonal analysis showed the lowest ponded areas to be in the winter season and comparable ponded areas in the pre- and postmonsoon seasons. The temperature trend showed that annual mean temperature increased at the rate of 0.02 °C/yr from 1989–2015 in the region, which may contribute to an increase in ponded cover due to increasing ice melt. However, the characteristics of the glaciers and roles of already developed supraglacial ponds have also had a significant influence on the increase in the area of the ponds.
We have presented the results of a high-resolution inventory, in which we mapped 3009 supraglacial ponds with sizes >0.00002 km2 on the surface of 22 debris-covered glaciers in the region, with the highest number and area of ponds on the Ngozompa Glacier, the largest glacier in the region. The ponded area was strongly correlated with area, slope, width, and mean elevation of the glacier.
We also presented the results from different resolution imageries. Landsat imagery (30 m) has the potential to map the supraglacial ponds (>0.005 km2) to help understand their historical evolution. However, it has led to the omission of ponded areas smaller than 0.005 km2 (45%). Sentinel-2 (10 m) with high temporal resolution has high potential to map small features and it will help to understand the seasonal variations of supraglacial ponds.
Supplementary Materials
The following materials are available online at https://www.mdpi.com/2072-4292/11/9/1058/s1, Table S1: List of Landsat imagery used in the study, Table S2: List of Sentinel-2 imageries used in the study, Table S3: List of WorldView and GeoEye imageries used in the study, Table S4: Ponded area mapped using Landsat images from 1989–2017, Table S5: Number of ponds mapped using Landsat images from 1989–2017, Table S6: Fractional pond cover correspondence to debris-covered area obtained from Landsat images, Figure S1: Distribution of the supraglacial ponds on the 12 debris-covered glaciers showing the persistency of ponds from 1989–2017, and Figure S2: Examples of ponds obtained with the Landsat (a, d, & g), Sentinel-2 (b, e, & h), WorldView-2 (c & i), and GeoEye-1 (f) at the surface of the selected glaciers i.e., terminuses of Nuptse Glacier (a, b, & c), near terminus of the Ngozompa Glacier (d, e, & f), and terminus of the Melung Glacier (g, h, & i).
Author Contributions
Conceptualization, M.B.C. and T.W.; Investigation, methodology, and formal analysis, M.B.C.; Project administration and supervision, T.W.; Writing—original draft, M.B.C.; Writing—review and editing, T.W.
Funding
The Ministry of Education, Culture, Sports, Science and Technology of Japan (MEXT) and JSPS Grant-in-aid for Scientific Research (B) Grant Number JP16H05641 (Teiji Watanabe) supported our study for the promotion of science.
Acknowledgments
We express thanks to DigitalGlobe Foundation for providing the WorldView and GeoEye imagery and Hexagon Geospatial for providing license for the ERDAS Imagine. We also thank Masami Kaneko of Rakuno Gakuen University, Japan, for providing satellite imageries.
Conflicts of Interest
The authors declare no conflicts of interest.
References
- Immerzeel, W.W.; van Beek, L.P.H.; Bierkens, M.F.P. Climate change will affect the Asian water towers. Science 2010, 328, 1382–1385. [Google Scholar] [CrossRef] [PubMed]
- Bolch, T.; Kulkarni, A.; Kaab, A.; Huggel, C.; Paul, F.; Cogley, J.G.; Frey, H.; Kargel, J.S.; Fujita, K.; Scheel, M.; et al. The State and Fate of Himalayan Glaciers. Science 2012, 336, 310–314. [Google Scholar] [CrossRef] [PubMed] [Green Version]
- Kääb, A.; Berthier, E.; Nuth, C.; Gardelle, J.; Arnaud, Y. Contrasting patterns of early twenty-first-century glacier mass change in the Himalayas. Nature 2012. [Google Scholar] [CrossRef] [PubMed]
- Sherpa, S.F.; Wagnon, P.; Brun, F.; Berthier, E.; Vincent, C.; Lejeune, Y.; Arnaud, Y.; Kayastha, R.B.; Sinisalo, A. Contrasted surface mass balances of debris-free glaciers observed between the southern and the inner parts of the Everest region (2007–2015). J. Glaciol. 2017, 63, 637–651. [Google Scholar] [CrossRef]
- Acharya, A.; Kayastha, R.B. Mass and Energy Balance Estimation of Yala Glacier (2011–2017), Langtang Valley, Nepal. Water 2018, 11, 6. [Google Scholar] [CrossRef]
- Shea, J.M.; Immerzeel, W.W.; Wagnon, P.; Vincent, C.; Bajracharya, S. Modelling glacier change in the Everest region, Nepal Himalaya. Cryosphere 2015, 9, 1105–1128. [Google Scholar] [CrossRef] [Green Version]
- Nie, Y.; Liu, Q.; Liu, S. Glacial Lake Expansion in the Central Himalayas by Landsat Images, 1990–2010. PLoS ONE 2013, 8, e83973. [Google Scholar] [CrossRef] [PubMed]
- Khadka, N.; Zhang, G.; Thakuri, S. Glacial Lakes in the Nepal Himalaya: Inventory and Decadal Dynamics (1977–2017). Remote Sens. 2018, 10, 1913. [Google Scholar] [CrossRef]
- Zhang, G.; Yao, T.; Xie, H.; Wang, W.; Yang, W. An inventory of glacial lakes in the Third Pole region and their changes in response to global warming. Glob. Planet. Chang. 2015, 131, 148–157. [Google Scholar] [CrossRef]
- Röhl, K. Characteristics and evolution of supraglacial ponds on debris-covered Tasman Glacier, New Zealand. J. Glaciol. 2008, 54, 867–880. [Google Scholar] [CrossRef] [Green Version]
- Gardelle, J.; Arnaud, Y.; Berthier, E. Contrasted evolution of glacial lakes along the Hindu Kush Himalaya mountain range between 1990 and 2009. Glob. Planet. Chang. 2011, 75, 47–55. [Google Scholar] [CrossRef] [Green Version]
- Irvine-Fynn, T.D.L.; Porter, P.R.; Rowan, A.V.; Quincey, D.J.; Gibson, M.J.; Bridge, J.W.; Watson, C.S.; Hubbard, A.; Glasser, N.F. Supraglacial Ponds Regulate Runoff From Himalayan Debris-Covered Glaciers. Geophys. Res. Lett. 2017, 44, 11,894–11,904. [Google Scholar] [CrossRef] [Green Version]
- Bolch, T.; Buchroithner, M.F.; Peters, J.; Baessler, M.; Bajracharya, S. Identification of glacier motion and potentially dangerous glacial lakes in the Mt. Everest region/Nepal using spaceborne imagery. Nat. Hazards Earth Syst. Sci. 2008, 8, 1329–1340. [Google Scholar] [CrossRef] [Green Version]
- Quincey, D.J.; Luckman, A.; Benn, D. Quantification of Everest region glacier velocities between 1992 and 2002, using satellite radar interferometry and feature tracking. J. Glaciol. 2009, 55, 596–606. [Google Scholar] [CrossRef]
- Chand, M.B.; Kayastha, R.B. Study of thermal properties of supraglacial debris and degree-day factors on Lirung Glacier, Nepal. Sci. Cold Arid Reg. 2018, 10, 357–368. [Google Scholar] [CrossRef]
- Watson, C.S.; Quincey, D.J.; Carrivick, J.L.; Smith, M.W. The dynamics of supraglacial ponds in the Everest region, central Himalaya. Glob. Planet. Chang. 2016, 142, 14–27. [Google Scholar] [CrossRef] [Green Version]
- Benn, D.I.; Bolch, T.; Hands, K.; Gulley, J.; Luckman, A.; Nicholson, L.I.; Quincey, D.; Thompson, S.; Toumi, R.; Wiseman, S. Response of debris-covered glaciers in the Mount Everest region to recent warming, and implications for outburst flood hazards. Earth Sci. Rev. 2012, 114, 156–174. [Google Scholar] [CrossRef] [Green Version]
- Reynolds, J.M. On the Formation of Supraglacial Lakes on Debris-Covered Glaciers. Available online: http://hydrologie.org/redbooks/a264/iahs_264_0153.pdf (accessed on 1 May 2019).
- Miles, E.S.; Willis, I.C.; Arnold, N.S.; Steiner, J.; Pellicciotti, F. Spatial, seasonal and interannual variability of supraglacial ponds in the Langtang Valley of Nepal, 1999–2013. J. Glaciol. 2017, 63, 88–105. [Google Scholar] [CrossRef]
- Sakai, A.; Takeuchi, N.; Fujita, K.; Nakawo, M. Role of Supraglacial Ponds in the Ablation Process of a Debris-Covered Glacier in the Nepal Himalayas. Available online: http://hydrologie.org/redbooks/a264/iahs_264_0119.pdf (accessed on 1 May 2019).
- Miles, E.S.; Pellicciotti, F.; Willis, I.C.; Steiner, J.F.; Buri, P.; Arnold, N.S. Refined energy-balance modelling of a supraglacial pond, Langtang Khola, Nepal. Ann. Glaciol. 2016, 57, 29–40. [Google Scholar] [CrossRef] [Green Version]
- Miles, E.S.; Steiner, J.; Willis, I.; Buri, P.; Immerzeel, W.W.; Chesnokova, A.; Pellicciotti, F. Pond Dynamics and Supraglacial-Englacial Connectivity on Debris-Covered Lirung Glacier, Nepal. Available online: https://www.frontiersin.org/articles/10.3389/feart.2017.00069/full (accessed on 1 May 2019).
- Watson, C.S.; Quincey, D.J.; Carrivick, J.L.; Smith, M.W.; Rowan, A.V.; Richardson, R. Heterogeneous water storage and thermal regime of supraglacial ponds on debris-covered glaciers. Earth Surf. Process. Landf. 2018, 43, 229–241. [Google Scholar] [CrossRef]
- Benn, D.I.; Wiseman, S.; Hands, K.A. Growth and drainage of supraglacial lakes on debris-mantled Ngozumpa Glacier, Khumbu Himal, Nepal. J. Glaciol. 2001, 47, 626–638. [Google Scholar] [CrossRef]
- Sakai, A.; Nishimura, K.; Kadota, T.; Takeuchi, N. Onset of calving at supraglacial lakes on debris-covered glaciers of the Nepal Himalaya. J. Glaciol. 2009, 55, 909–917. [Google Scholar] [CrossRef] [Green Version]
- Qiao, L.; Mayer, C.; Liu, S. Distribution and interannual variability of supraglacial lakes on debris-covered glaciers in the Khan Tengri-Tumor Mountains, Central Asia. Environ. Res. Lett. 2015, 10. [Google Scholar] [CrossRef]
- Gardelle, J.; Berthier, E.; Arnaud, Y.; Kääb, A. Region-wide glacier mass balances over the Pamir-Karakoram-Himalaya during 1999–2011. Cryosphere 2013, 7, 1263–1286. [Google Scholar] [CrossRef] [Green Version]
- Chand, M.B.; Kayastha, R.B.; Parajuli, A.; Mool, P.K. Seasonal variation of ice melting on varying layers of debris of Lirung Glacier, Langtang Valley, Nepal. Proc. Int. Assoc. Hydrol. Sci. 2015, 368, 21–26. [Google Scholar] [CrossRef] [Green Version]
- Sakai, A.; Fujita, K. Formation conditions of supraglacial lakes on debris-covered glaciers in the Himalaya. J. Glaciol. 2010, 56, 177–181. [Google Scholar] [CrossRef]
- Quincey, D.J.; Richardson, S.D.; Luckman, A.; Lucas, R.M.; Reynolds, J.M.; Hambrey, M.J.; Glasser, N.F. Early recognition of glacial lake hazards in the Himalaya using remote sensing datasets. Glob. Planet. Chang. 2007, 56, 137–152. [Google Scholar] [CrossRef]
- Lamsal, D.; Sawagaki, T.; Watanabe, T.; Byers, A.C. Assessment of glacial lake development and prospects of outburst susceptibility: Chamlang South Glacier, eastern Nepal Himalaya. Geomat. Nat. Hazards Risk 2016, 7, 403–423. [Google Scholar] [CrossRef]
- Somos-Valenzuela, M.A.; McKinney, D.C.; Rounce, D.R.; Byers, A.C. Changes in Imja Tsho in the Mount Everest region of Nepal. Cryosphere 2014, 8, 1661–1671. [Google Scholar] [CrossRef] [Green Version]
- Watanabe, T.; Ives, J.D.; Hammond, J.E. Rapid Growth of a Glacial Lake in Khumbu Himal, Himalaya: Prospects for a Catastrophic Flood. Mt. Res. Dev. 1994, 14, 329. [Google Scholar] [CrossRef]
- Watanabe, T.; Lamsal, D.; Ives, J.D. Evaluating the growth characteristics of a glacial lake and its degree of danger of outburst flooding: Imja Glacier, Khumbu Himal, Nepal. Nor. Geogr. Tidsskr. 2009, 63, 255–267. [Google Scholar] [CrossRef]
- Byers, A.C.; McKinney, D.C.; Somos-Valenzuela, M.; Watanabe, T.; Lamsal, D. Glacial lakes of the Hinku and Hongu valleys, Makalu Barun National Park and Buffer Zone, Nepal. Nat. Hazards 2013, 69, 115–139. [Google Scholar] [CrossRef]
- Fujita, K.; Sakai, A.; Nuimura, T.; Yamaguchi, S.; Sharma, R.R. Recent changes in Imja Glacial Lake and its damming moraine in the Nepal Himalaya revealed by in situ surveys and multi-temporal ASTER imagery. Environ. Res. Lett. 2009, 4, 045205. [Google Scholar] [CrossRef]
- Rounce, D.R.; McKinney, D.C.; Lala, J.M.; Byers, A.C.; Watson, C.S. A new remote hazard and risk assessment framework for glacial lakes in the Nepal Himalaya. Hydrol. Earth Syst. Sci. 2016, 20, 3455–3475. [Google Scholar] [CrossRef]
- Aggarwal, A.; Jain, S.K.; Lohani, A.K.; Jain, N. Glacial lake outburst flood risk assessment using combined approaches of remote sensing, GIS and dam break modelling. Geomat. Nat. Hazards Risk 2016, 7, 18–36. [Google Scholar] [CrossRef]
- Singh, R.B.; Schickhoff, U.; Mal, S. Climate change, glacier response, and vegetation dynamics in the Himalaya: Contributions toward future earth initiatives. In Climate Change, Glacier Response, and Vegetation Dynamics in the Himalaya; Springer International Publishing: New York, NY, USA, 2016; pp. 1–399. [Google Scholar]
- Watanabe, T.; Byers, A.C.; Somos-Valenzuela, M.A.; McKinney, D.C. The Need for Community Involvement in Glacial Lake Field Research: The Case of Imja Glacial Lake, Khumbu, Nepal Himalaya. In Climate Change, Glacier Response, and Vegetation Dynamics in the Himalaya; Springer International Publishing: New York, NY, USA, 2016; pp. 235–250. [Google Scholar]
- Shrestha, F.; Gao, X.; Khanal, N.R.; Maharjan, S.B.; Shrestha, R.B.; Wu, L.; Mool, P.K.; Bajracharya, S.R. Decadal glacial lake changes in the Koshi basin, central Himalaya, from 1977 to 2010, derived from Landsat satellite images. J. Mt. Sci. 2017, 14, 1969–1984. [Google Scholar] [CrossRef]
- Bajracharya, S.R.; Mool, P. Glaciers, glacial lakes and glacial lake outburst floods in the Mount Everest region, Nepal. Ann. Glaciol. 2009, 50, 81–86. [Google Scholar] [CrossRef]
- Thompson, S.S.; Benn, D.I.; Dennis, K.; Luckman, A. A rapidly growing moraine-dammed glacial lake on Ngozumpa Glacier, Nepal. Geomorphology 2012, 145, 1–11. [Google Scholar] [CrossRef]
- Benn, D.I.; Wiseman, S.; Warren, C.R. Rapid Growth of a Supraglacial Lake, Ngozumpa Glacier, Khumbu Himal, Nepal. Available online: http://hydrologie.org/redbooks/a264/iahs_264_0177.pdf (accessed on 1 May 2019).
- Salerno, F.; Thakuri, S.; D’Agata, C.; Smiraglia, C.; Manfredi, E.C.; Viviano, G.; Tartari, G. Glacial lake distribution in the Mount Everest region: Uncertainty of measurement and conditions of formation. Glob. Planet. Chang. 2012, 92, 30–39. [Google Scholar] [CrossRef]
- Richardson, S.D.; Reynolds, J.M. An overview of glacial hazards in the Himalayas. Quat. Int. 2000, 65–66, 31–47. [Google Scholar] [CrossRef]
- Bajracharya, S.; Maharjan, S.; Shrestha, F.; Bajracharya, O.; Baidya, S. Glacier Status in Nepal and Decadal Change from 1980 to 2010 Based on Landsat Data; International Centre for Integrated Mountain Development: Patan, Nepal, 2014. [Google Scholar]
- Rounce, D.R.; Byers, A.C.; Byers, E.A.; Mckinney, D.C. Brief Communications: Observations of a Glacier Outburst Flood from Lhotse Glacier, Everest Area, Nepal. Cryosphere 2016, 11, 443–449. [Google Scholar] [CrossRef]
- Miles, E.S.; Watson, C.S.; Brun, F.; Berthier, E.; Esteves, M.; Quincey, D.J.; Miles, K.E.; Hubbard, B.; Wagnon, P. Glacial and geomorphic effects of a supraglacial lake drainage and outburst event, Everest region, Nepal Himalaya. Cryosphere 2018, 12, 3891–3905. [Google Scholar] [CrossRef]
- Jiang, S.; Nie, Y.; Liu, Q.; Wang, J.; Liu, L.; Hassan, J.; Liu, X.; Xu, X. Glacier Change, Supraglacial Debris Expansion and Glacial Lake Evolution in the Gyirong River Basin, Central Himalayas, between 1988 and 2015. Remote Sens. 2018, 10, 986. [Google Scholar] [CrossRef]
- Shean, D. High Mountain Asia 8-Meter Dems Derived from Along-Track Optical Imagery; Version 1; NASA National Snow and Ice Data Center Distributed Active Archive Center: Boulder, CO, USA.
- King, O.; Quincey, D.J.; Carrivick, J.L.; Rowan, A.V. Spatial variability in mass loss of glaciers in the Everest region, central Himalayas, between 2000 and 2015. Cryosphere 2017, 11, 407–426. [Google Scholar] [CrossRef]
- Huggel, C.; Kääb, A.; Haeberli, W.; Teysseire, P.; Paul, F. Remote sensing based assessment of hazards from glacier lake outbursts: A case study in the Swiss Alps. Can. Geotech. J. 2002, 39, 316–330. [Google Scholar] [CrossRef]
- Shukla, A.; Garg, P.K.; Srivastava, S. Evolution of Glacial and High-Altitude Lakes in the Sikkim, Eastern Himalaya Over the Past Four Decades (1975–2017). Front. Environ. Sci. 2018, 6, 81. [Google Scholar] [CrossRef]
- Mergili, M.; Müller, J.P.; Schneider, J.F. Spatio-temporal development of high-mountain lakes in the headwaters of the Amu Darya River (Central Asia). Glob. Planet. Chang. 2013, 107, 13–24. [Google Scholar] [CrossRef]
- Xu, H. Modification of normalised difference water index (NDWI) to enhance open water features in remotely sensed imagery. Int. J. Remote Sens. 2006, 27, 3025–3033. [Google Scholar] [CrossRef]
- Jha, L.K.; Khare, D. Detection and delineation of glacial lakes and identification of potentially dangerous lakes of Dhauliganga basin in the Himalaya by remote sensing techniques. Nat. Hazards 2017, 85, 301–327. [Google Scholar] [CrossRef]
- Bolch, T.; Peters, J.; Yegorov, A.; Pradhan, B.; Buchroithner, M.; Blagoveshchensky, V. Identification of potentially dangerous glacial lakes in the northern Tien Shan. Nat. Hazards 2011, 59, 1691–1714. [Google Scholar] [CrossRef] [Green Version]
- Hall, D.K.; Riggs, G.A.; Salomonson, V.V. Development of methods for mapping global snow cover using moderate resolution imaging spectroradiometer data. Remote Sens. Environ. 1995, 54, 127–140. [Google Scholar] [CrossRef]
- Sakai, A. Glacial Lakes in the Himalayas: A Review on Formation and Expansion Processes. Glob. Environ. Res. 2012, 16, 23–30. [Google Scholar]
- Zhang, Y.; Fujita, K.; Liu, S.; Liu, Q.; Nuimura, T. Distribution of debris thickness and its effect on ice melt at Hailuogou glacier, southeastern Tibetan Plateau, using in situ surveys and ASTER imagery. J. Glaciol. 2011, 57, 1147–1157. [Google Scholar] [CrossRef]
- Fujita, K.; Sakai, A.; Takenaka, S.; Nuimura, T.; Surazakov, A.B.; Sawagaki, T.; Yamanokuchi, T. Potential flood volume of Himalayan glacial lakes. Nat. Hazards Earth Syst. Sci. 2013, 13, 1827–1839. [Google Scholar] [CrossRef]
- Cook, S.J.; Quincey, D.J. Estimating the volume of Alpine glacial lakes. Earth Surf. Dynam 2015, 3, 559–575. [Google Scholar] [CrossRef]
- Wessels, R.L.; Kargel, J.S.; Kieffer, H.H. ASTER measurement of supraglacial lakes in the Mount Everest region of the Himalaya. Ann. Glaciol. 2002, 34, 399–408. [Google Scholar] [CrossRef]
- Sakai, A.; Nakawo, M.; Fujita, K. Melt rate of ice cliffs on the Lirung Glacier, Nepal Himalayas, 1996. Bull. Glacier Res. 1998, 16, 57–66. [Google Scholar]
- APHRODITE’s Water Resources. Available online: http://aphrodite.st.hirosaki-u.ac.jp/ (accessed on 25 February 2019).
- Li, Z.; Fan, K.; Tian, L.; Shi, B.; Zhang, S.; Zhang, J. Response of Glacier and Lake Dynamics in Four Inland Basins to Climate Change at the Transition Zone between the Karakorum And Himalayas. PLoS ONE 2015, 10, e0144696. [Google Scholar] [CrossRef]
- Shrestha, A.B.; Eriksson, M.; Mool, P.; Ghimire, P.; Mishra, B.; Khanal, N.R. Glacial lake outburst flood risk assessment of Sun Koshi basin, Nepal. Geomat. Nat. Hazards Risk 2010, 1, 157–169. [Google Scholar] [CrossRef] [Green Version]
- King, O.; Dehecq, A.; Quincey, D.; Carrivick, J. Contrasting geometric and dynamic evolution of lake and land-terminating glaciers in the central Himalaya. Glob. Planet. Chang. 2018, 167, 46–60. [Google Scholar] [CrossRef] [Green Version]
- Carrivick, J.L.; Tweed, F.S. A global assessment of the societal impacts of glacier outburst floods. Glob. Planet. Chang. 2016, 144, 1–16. [Google Scholar] [CrossRef] [Green Version]
- ICIMOD. Glacial Lakes and Glacial Lake Outburst Floods in Nepal; International Centre for Integrated Mountain Development: Kathmandu, Nepal, 2011. [Google Scholar]
- Byers, A.C.; Rounce, D.R.; Shugar, D.H.; Lala, J.M.; Byers, E.A.; Regmi, D. A rockfall-induced glacial lake outburst flood, Upper Barun Valley, Nepal. Landslides 2019, 16, 533–549. [Google Scholar] [CrossRef]
- Cook, K.L.; Andermann, C.; Gimbert, F.; Adhikari, B.R.; Hovius, N. Glacial lake outburst floods as drivers of fluvial erosion in the Himalaya. Science 2018, 362, 53–57. [Google Scholar] [CrossRef] [PubMed]
Figure 1.
The glaciers studied in the Sagarmatha National Park (Upper Dudh Koshi basin), Nepal. Glacier outlines and supraglacial ponds were delineated using 2-m resolution images of WorldView and GeoEye except Thyanbo Glacier, for which Sentinel-2 of 10-m resolution image was used.
Figure 1.
The glaciers studied in the Sagarmatha National Park (Upper Dudh Koshi basin), Nepal. Glacier outlines and supraglacial ponds were delineated using 2-m resolution images of WorldView and GeoEye except Thyanbo Glacier, for which Sentinel-2 of 10-m resolution image was used.

Figure 2.
Temporal and seasonal distributions of scenes used in the study. Blue marks are for Landsat, red marks for Sentinel-2, and green marks for WorldView and GeoEye scenes.
Figure 2.
Temporal and seasonal distributions of scenes used in the study. Blue marks are for Landsat, red marks for Sentinel-2, and green marks for WorldView and GeoEye scenes.

Figure 3.
Distribution of ponded areas (1989–2017) in the Everest region using (a) normal Q-Q plot, and (b) normal probability plot.
Figure 3.
Distribution of ponded areas (1989–2017) in the Everest region using (a) normal Q-Q plot, and (b) normal probability plot.

Figure 4.
The relationship between ponded area and glacier characteristics with (a) elevation and (b) slope. The altitudinal area distribution of the debris portion of the glacier and area of all supraglacial ponds were mapped using 2-m resolution imagery in the Everest region. The elevation class value on the y-axis indicates the uppermost value.

Figure 5.
The distribution of pond areas (1989–2017) in the Everest region with (a) normal Q-Q plot of pond area, (b) normal probability plot of pond area, and (c) frequency distribution of ponds.
Figure 5.
The distribution of pond areas (1989–2017) in the Everest region with (a) normal Q-Q plot of pond area, (b) normal probability plot of pond area, and (c) frequency distribution of ponds.

Figure 6.
Long-term development of the supraglacial ponds in the Everest region from 1989–2017 with (a) total ponded area for all study glaciers and three selected glaciers, Ngozompa, Bhote Koshi, and Khumbu glaciers, (b) changes in number for three dimensional classes, (c) variation in the mean area, and (d) changes in the area of three-dimensional classes of supraglacial ponds.

Figure 7.
Distribution of supraglacial ponds in (a) Ngozompa, (b) Khumbu, (c) Bhote Koshi, and (d) Lumsamba glaciers in different time periods from 1989 and 2017, highlighting the persistence of individual ponds. The pond persistency of the remainder of the glaciers is provided in the supplementary file (Figure S1).

Figure 8.
Seasonal changes in the number and area of the supraglacial ponds (>0.0005 km2) between January 2016 and May 2018 obtained from Sentinel-2 images of 10-m resolution.
Figure 8.
Seasonal changes in the number and area of the supraglacial ponds (>0.0005 km2) between January 2016 and May 2018 obtained from Sentinel-2 images of 10-m resolution.

Figure 9.
The temperature trend in the Everest region for the time period (a) 1961–1988 and (b) 1989–2015 using APHRODITE gridded dataset.
Figure 9.
The temperature trend in the Everest region for the time period (a) 1961–1988 and (b) 1989–2015 using APHRODITE gridded dataset.

Figure 10.
The densities of supraglacial ponds at the surface of the four selected glaciers with different area thresholds of the ponds, being greater than (a) 20 m2, (b) 100 m2, (c) 3600 m2, and (d) 5000 m2.
Figure 10.
The densities of supraglacial ponds at the surface of the four selected glaciers with different area thresholds of the ponds, being greater than (a) 20 m2, (b) 100 m2, (c) 3600 m2, and (d) 5000 m2.

Figure 11.
Spillway ponds and associated supraglacial ponds at the termini of (a) Ngozompa Glacier from November 2016, (b) Khumbu Glacier from October 2016, (c) Bhote Koshi Glacier from November 2015, and (d) Lumsamba Glacier from April 2016.
Figure 11.
Spillway ponds and associated supraglacial ponds at the termini of (a) Ngozompa Glacier from November 2016, (b) Khumbu Glacier from October 2016, (c) Bhote Koshi Glacier from November 2015, and (d) Lumsamba Glacier from April 2016.


Table 1.
Morphometric characteristics of the glaciers and supraglacial ponds and lakes of the Sagarmatha National Park in 2015 and 2016.
Table 1.
Morphometric characteristics of the glaciers and supraglacial ponds and lakes of the Sagarmatha National Park in 2015 and 2016.
| Glacier | Area (km2) | Width (m) | DGM (m) | Elevation1 (m a.s.l.) | Slope (°) | AAR (%) | Aspect | Pond/Lake Cover (%) | ||
|---|---|---|---|---|---|---|---|---|---|---|
| Clean + Debris | Debris (%) | Min. | Mean | |||||||
| Landak | 1.6 | 1.0 (60) | 312 | 41 | 4857 | 5030 | 12.0 | 30 | SE | 0.21 |
| Chhule | 4.9 | 3.4 (69) | 408 | 22 | 4794 | 4980 | 10.5 | 14 | SE | 1.67 |
| Melung | 7.2 | 6.3 (88) | 443 | 58 | 4967 | 5184 | 9.7 | 11 | SE | 0.69 |
| Bhote Koshi | 30.3 | 17.9 (59) | 510 | 63 | 4756 | 5104 | 9.6 | 38 | S | 1.55 |
| Lumsamba | 10.9 | 5.1 (47) | 463 | 61 | 4900 | 5166 | 6.8 | 45 | S | 2.98 |
| Ngozompa | 77.7 | 26.0 (33) | 904 | 75 | 4669 | 5022 | 7.0 | 57 | S | 2.33 |
| Changri Nup | 12.3 | 7.4 (60) | 923 | 98 | 5094 | 5257 | 9.6 | 38 | SE | 3.11 |
| Nuptse | 5.3 | 3.3 (63) | 419 | 49 | 4938 | 5237 | 9.2 | 44 | S | 1.22 |
| Lhotse Nup | 2.3 | 1.6 (69) | 297 | 39 | 4930 | 5075 | 8.9 | 18 | SW | 1.53 |
| Lhotse | 10.5 | 5.9 (56) | 740 | 42 | 4813 | 5051 | 7.1 | 33 | SW | 1.54 |
| Amphu | 2.2 | 1.3 (60) | 380 | 113 | 5021 | 5166 | 14.5 | 12 | SW | 0.65 |
| Imja | 15.3 | 5.5 (36) | 718 | 129 | 4980 | 5145 | 8.7 | 53 | SW | 0.52 |
| Ama Dablam | 7.7 | 2.4 (31) | 441 | 63 | 4753 | 4911 | 8.8 | 37 | S | 2.06 |
| Duwo | 1.5 | 1.2 (81) | 616 | 57 | 4714 | 4809 | 13.4 | 1 | SW | 1.30 |
| Lobuche | 1.4 | 0.6 (44) | 364 | 44 | 4943 | 5018 | 15.8 | 48 | SE | 3.24 |
| Cholotse | 1.2 | 0.8 (72) | 344 | 70 | 4859 | 4967 | 13.2 | 21 | SW | 0.81 |
| Tweche | 0.3 | 0.3 (100) | 268 | 64 | 4967 | 5035 | 13.7 | 0 | SW | 1.62 |
| Cholo | 1.0 | 1.0 (95) | 253 | 39 | 4427 | 4732 | 16.5 | 5 | E | 0.06 |
| Nareyargaip | 5.4 | 2.1 (39) | 375 | 107 | 5042 | 5268 | 15.5 | 61 | S | 2.17 |
| Nare | 1.6 | 0.7 (42) | 526 | 108 | 4983 | 5112 | 12.5 | 24 | S | 0.17 |
| Thyanbo2 | 2.2 | 1.4 (62) | 206 | 15 | 4347 | 4653 | 13.9 | 26 | E | |
| Tingbo | 0.9 | 0.5 (56) | 235 | 26 | 4855 | 5051 | 20.3 | 19 | SW | 0.03 |
| Khumbu | 27.2 | 8.0 (30) | 568 | 70 | 4885 | 5132 | 7.7 | 66 | SW | 3.89 |
| rs | 0.90 | 0.90 | 0.70 | 0.21 | −0.11 | 0.72 | −0.75 | 0.61 | ||
1 Elevation data are based on the debris-covered portions of the glaciers. 2 High-resolution pond cover was not available for this glacier.
© 2019 by the authors. Licensee MDPI, Basel, Switzerland. This article is an open access article distributed under the terms and conditions of the Creative Commons Attribution (CC BY) license (http://creativecommons.org/licenses/by/4.0/).
Share and Cite
MDPI and ACS Style
Chand, M.B.; Watanabe, T. Development of Supraglacial Ponds in the Everest Region, Nepal, between 1989 and 2018. Remote Sens. 2019, 11, 1058. https://doi.org/10.3390/rs11091058
AMA Style
Chand MB, Watanabe T. Development of Supraglacial Ponds in the Everest Region, Nepal, between 1989 and 2018. Remote Sensing. 2019; 11(9):1058. https://doi.org/10.3390/rs11091058
Chicago/Turabian StyleChand, Mohan Bahadur, and Teiji Watanabe. 2019. "Development of Supraglacial Ponds in the Everest Region, Nepal, between 1989 and 2018" Remote Sensing 11, no. 9: 1058. https://doi.org/10.3390/rs11091058
Note that from the first issue of 2016, this journal uses article numbers instead of page numbers. See further details here.