Mapping of Coastal Cities Using Optimized Spectral–Spatial Features Based Multi-Scale Superpixel Classification


Abstract
:
1. Introduction
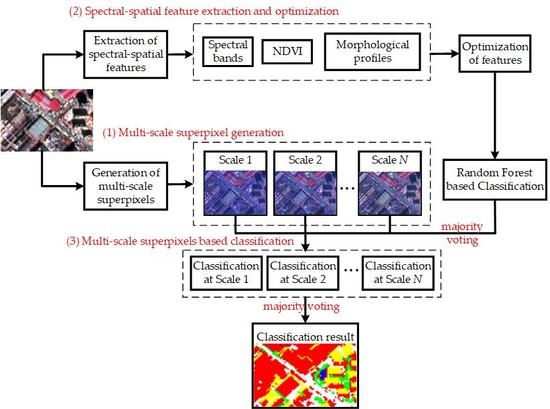
2. Methodology
2.1. Multi-Scale Superpixel Generation
- (1)
- Define a scale parameter i . The scale parameter is the threshold for breaking the merge of different pixels and determines the size of the superpixels/objects.
- (2)
- Calculate the color and shape of each superpixel by:where D is the number of features utilized to calculate the color heterogeneity such as spectral heterogeneity, is the weight of the k-th feature, is the standard deviation of the feature values in the k-th feature in the superpixel, and represent the smoothness and compactness of the superpixel, respectively, and is the weight of the smoothness.
- (3)
- Calculate the regional heterogeneity of each superpixel bywhere is the weight of the shape.
- (4)
- Compare the regional heterogeneity h of each superpixel with the predefined scale parameter i and merge any of the two adjacent superpixels whose regional heterogeneity is smaller than i.
- (5)
- If the regional heterogeneity of the newly generated superpixel is larger than i, the merging process will be terminated.
2.2. Spectral–Spatial Feature Extraction and Optimization
2.3. Multi-Scale Superpixel-based Classification
3. Experiments and Results
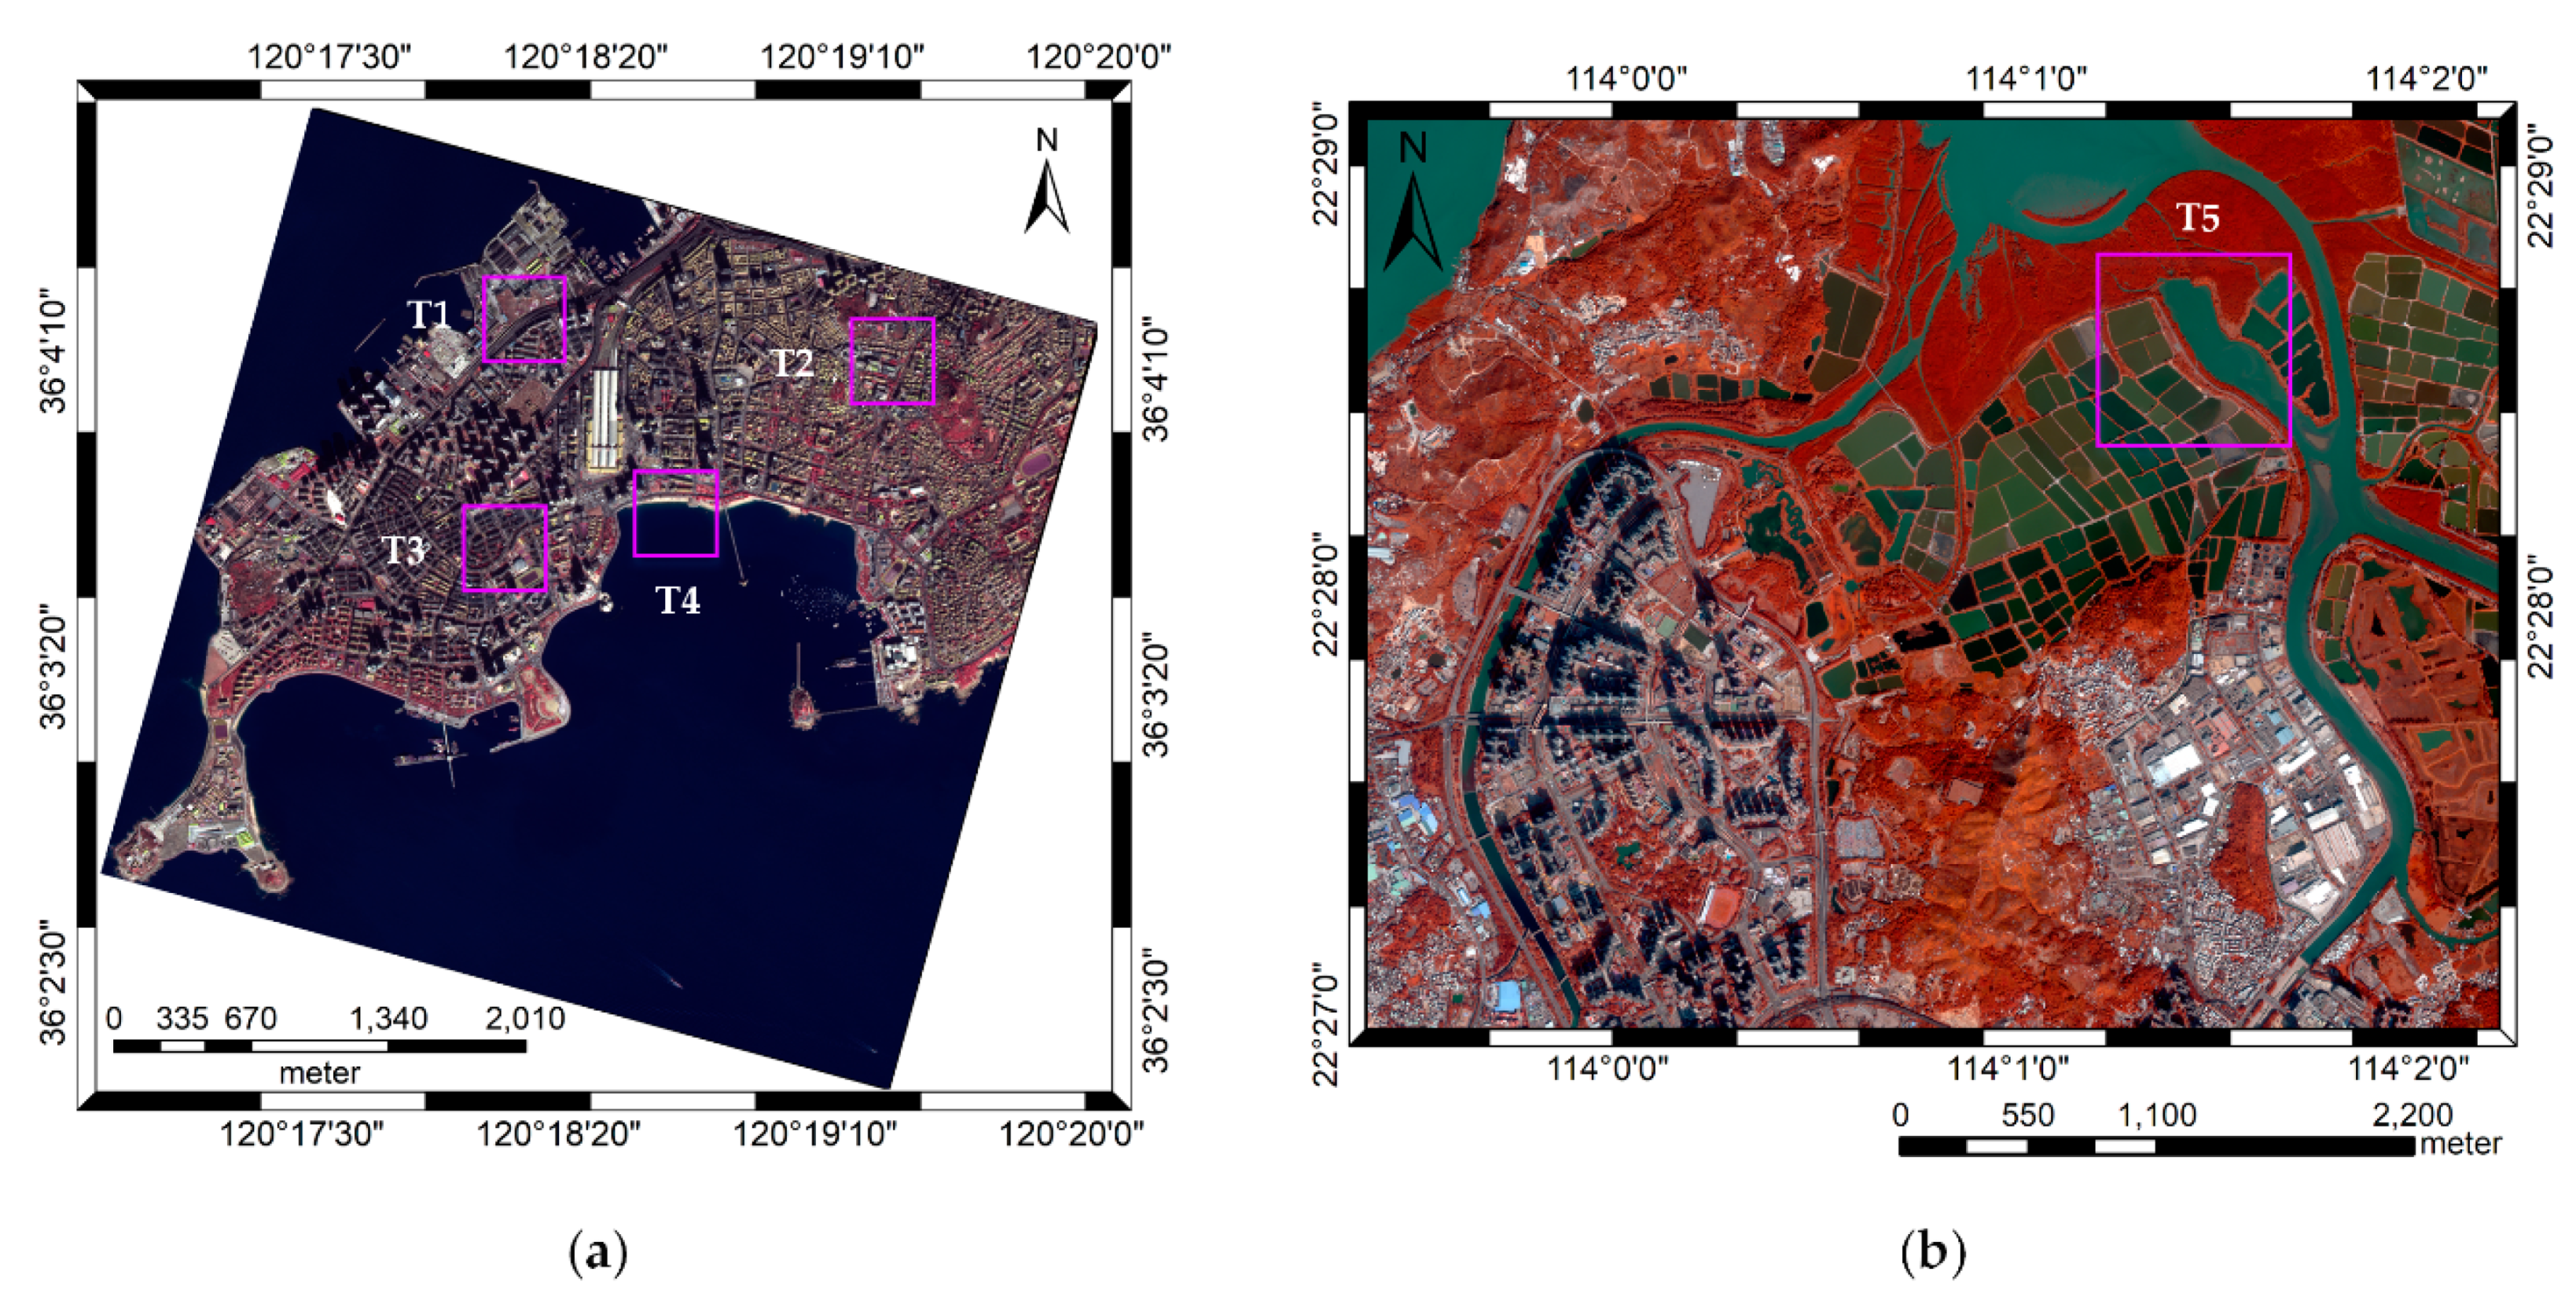
3.1. Introduction of Datasets
3.2. Experimental Settings
- (1)
- Experiment merely using the raw multi-spectral features and NDVI (defined as Raw);
- (2)
- Experiment using the spectral–spatial features (defined as SS);
- (3)
- Experiment using the optimized spectral–spatial features (defined as OSS);
- (4)
- Experiment using the proposed method (defined as OSS-MSSC);
- (5)
- Experiment using a favorite image classification model using convolutional neural network with 16 weight layers (denoted as VGG (Visual Geometry Group), the source code can be download from https://github.com/ry/tensorflow-vgg16) because of its simplicity and accuracy;
- (6)
- Experiment using the multi-scale superpixel based VGG by majority voting (defined as MSS-VGG).
- For the area attribute, ;
- For the standard deviation attribute, ;
- For the moment of inertia attribute, ;
3.3. Experimental Results
3.3.1. Optimization Results of the Features
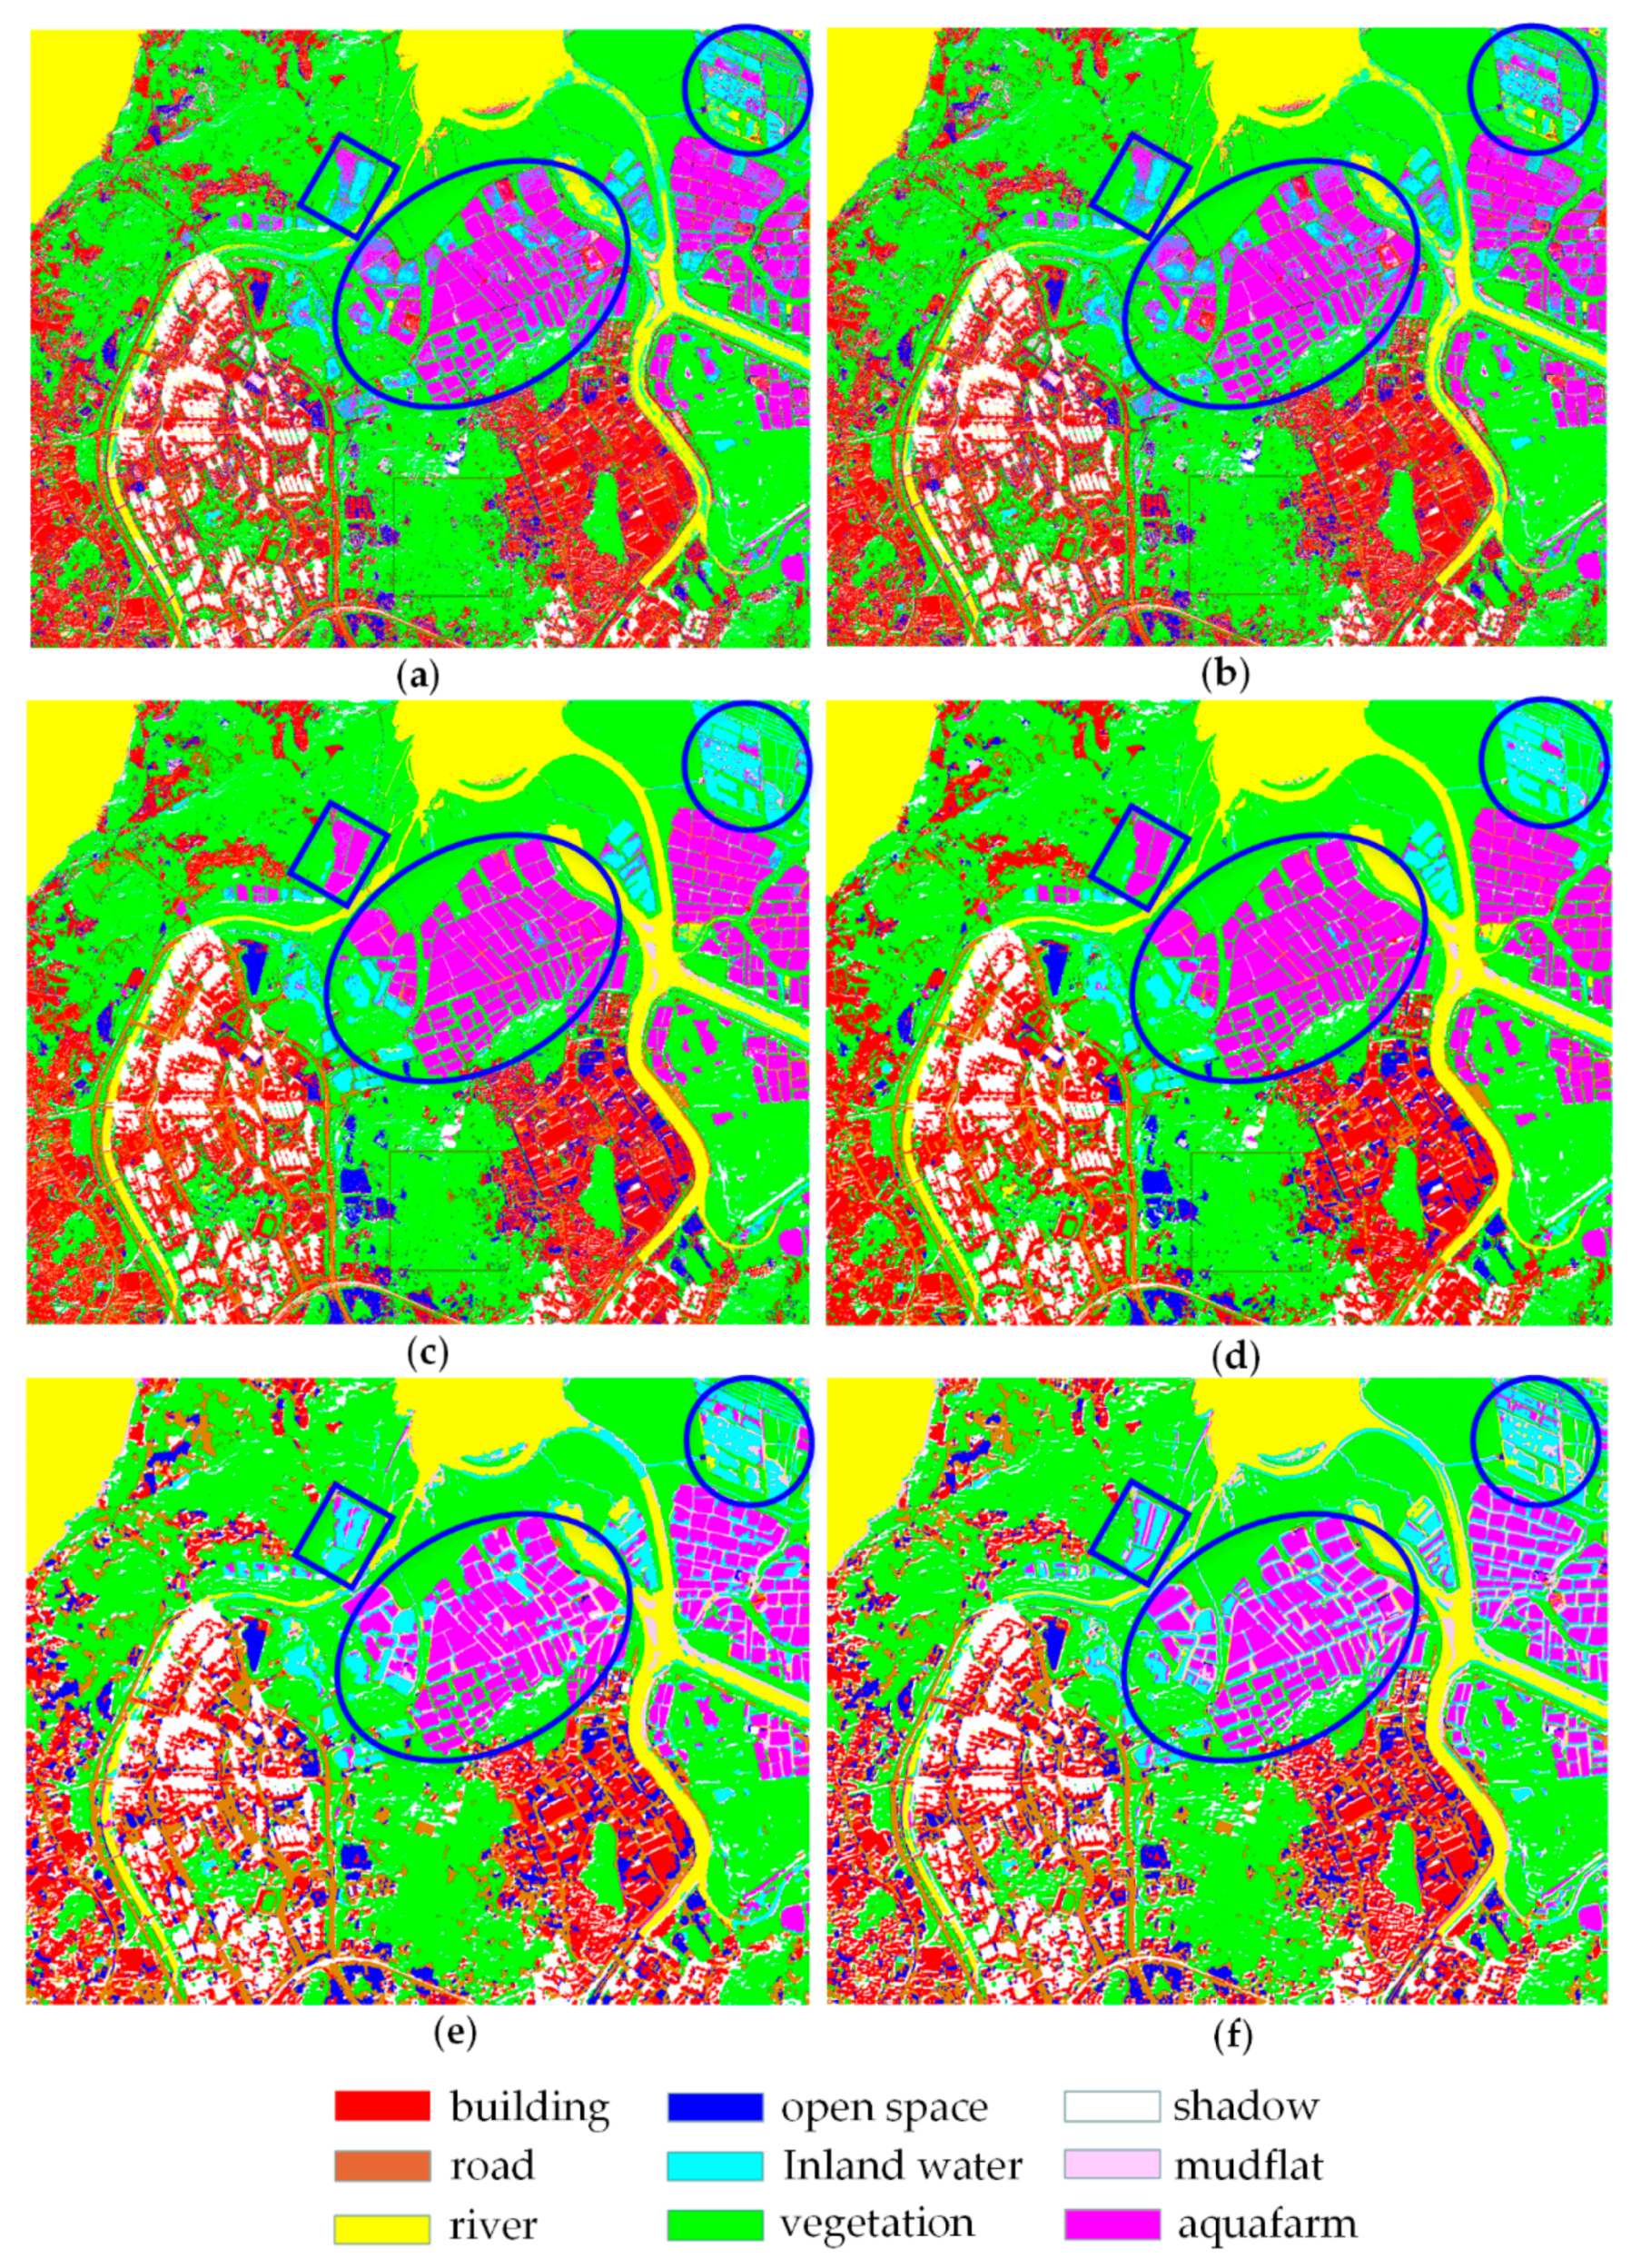
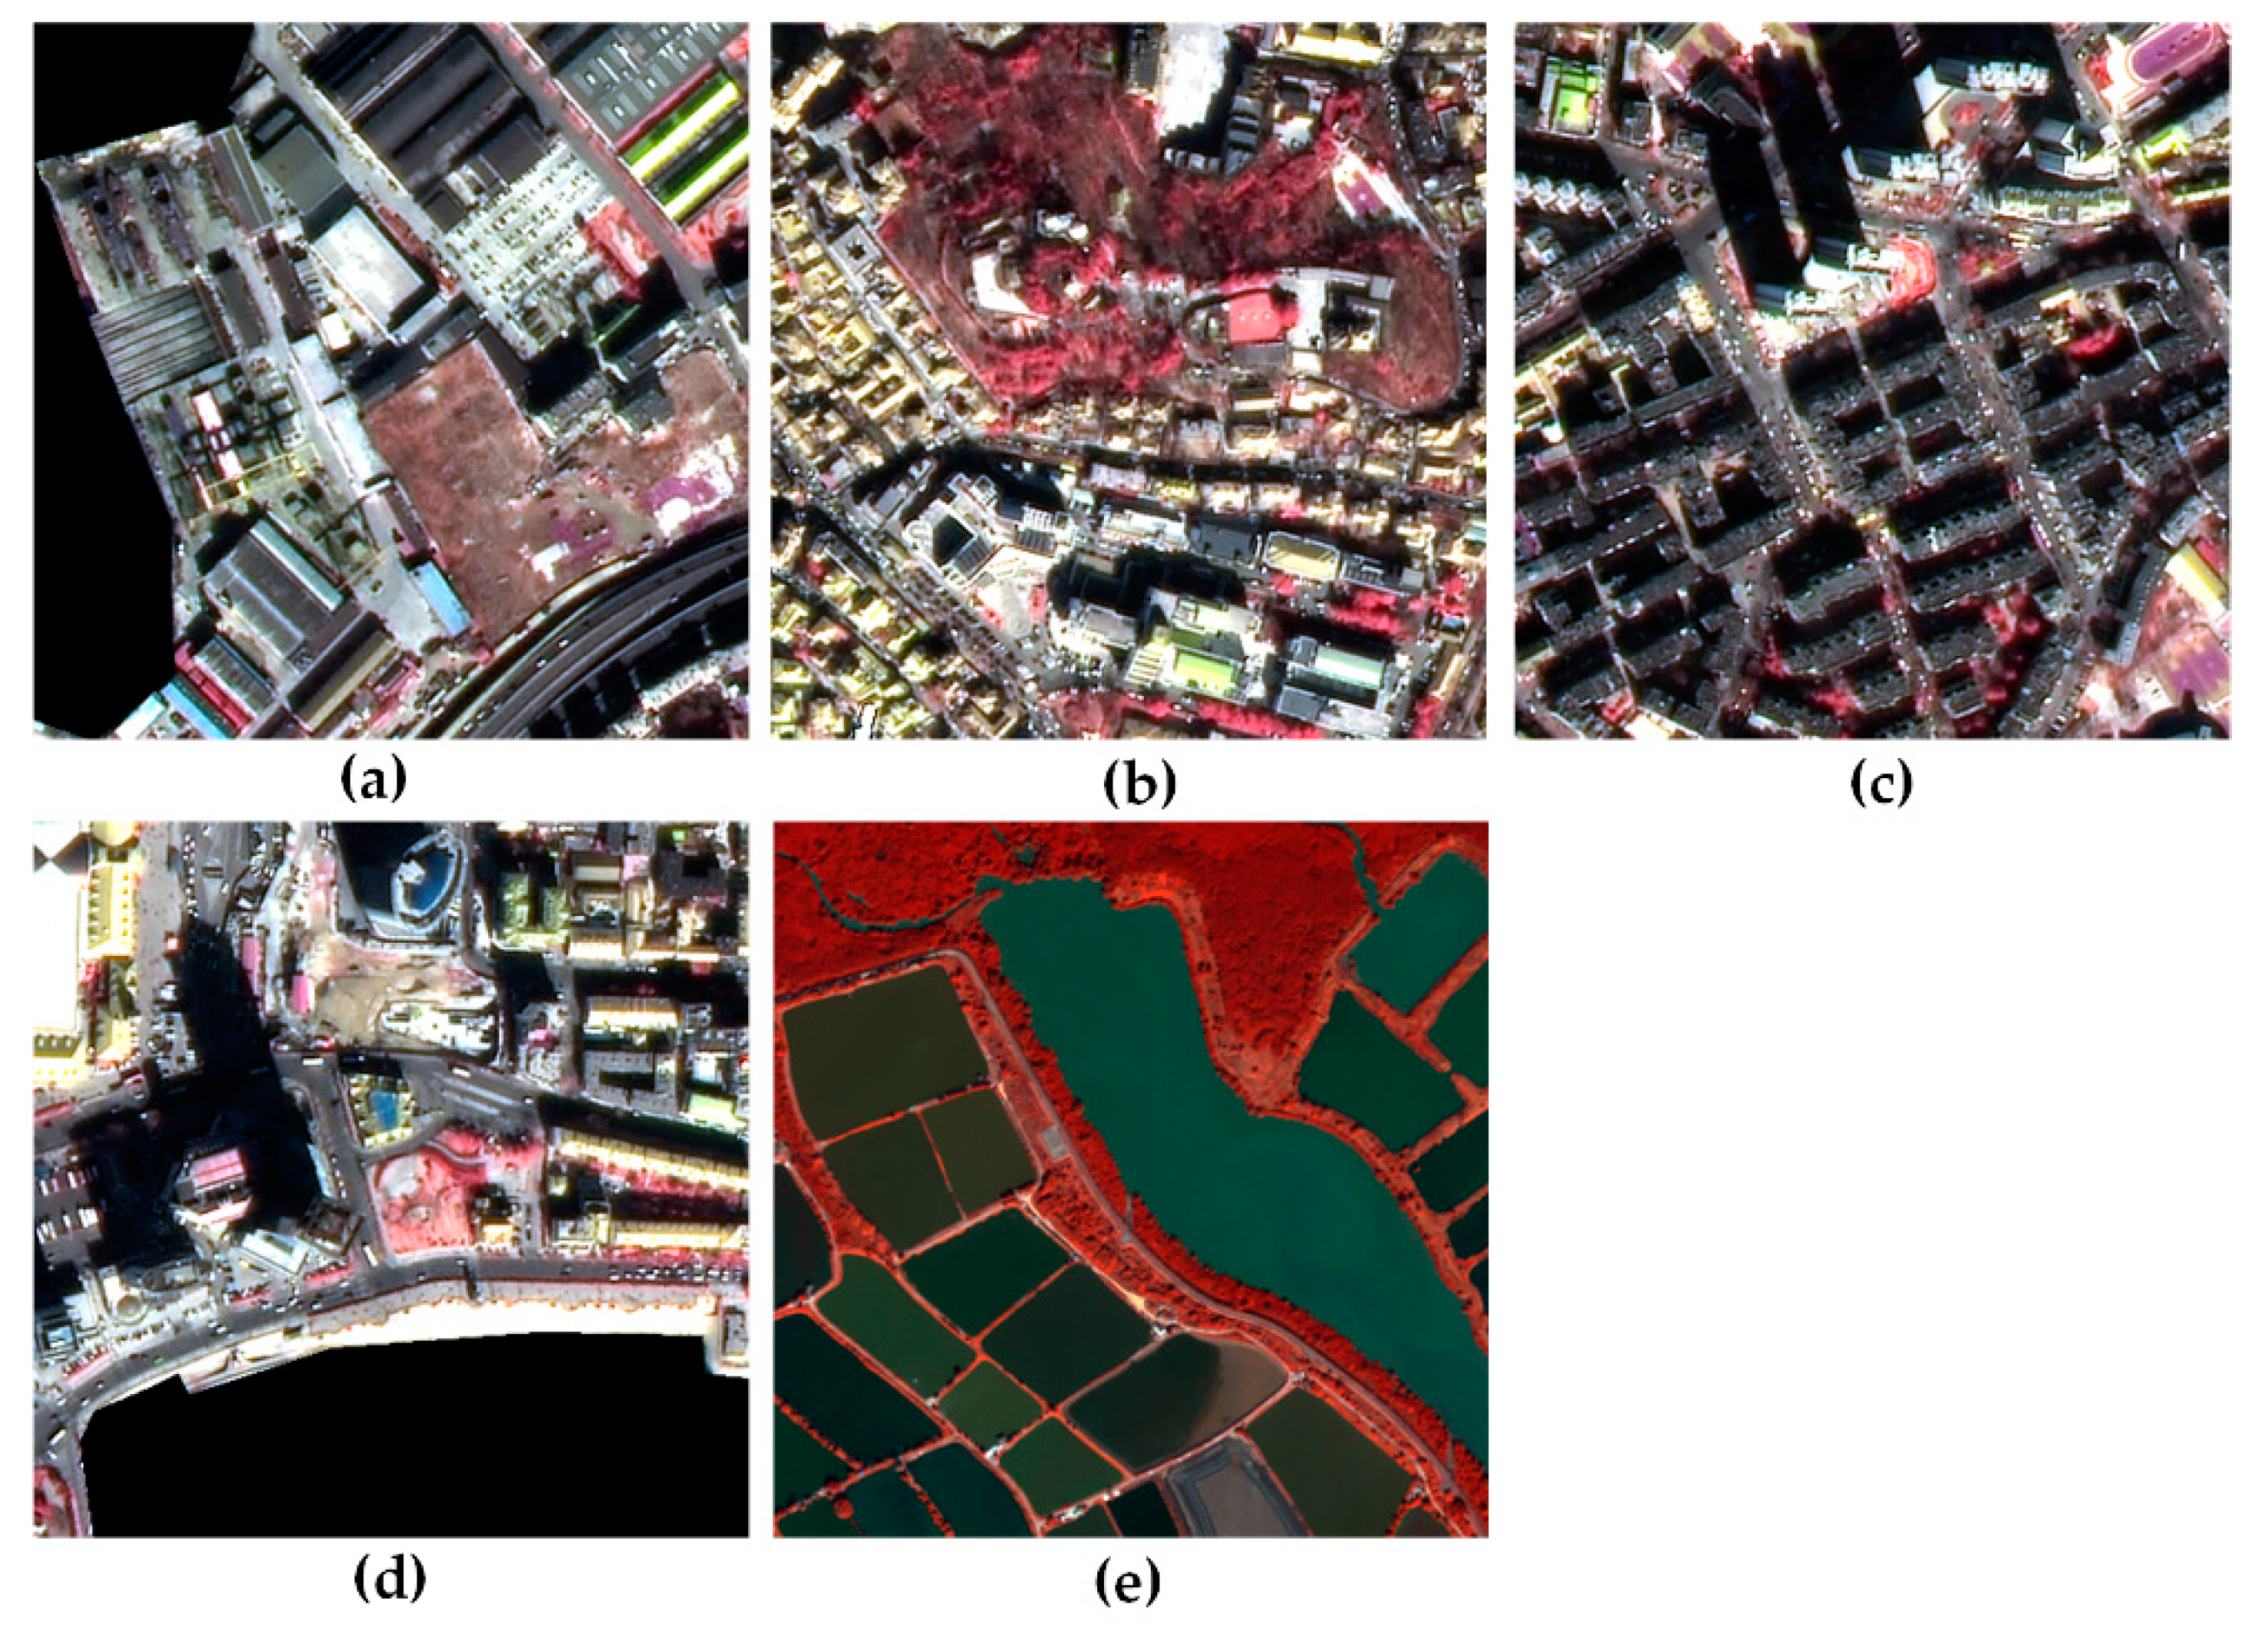
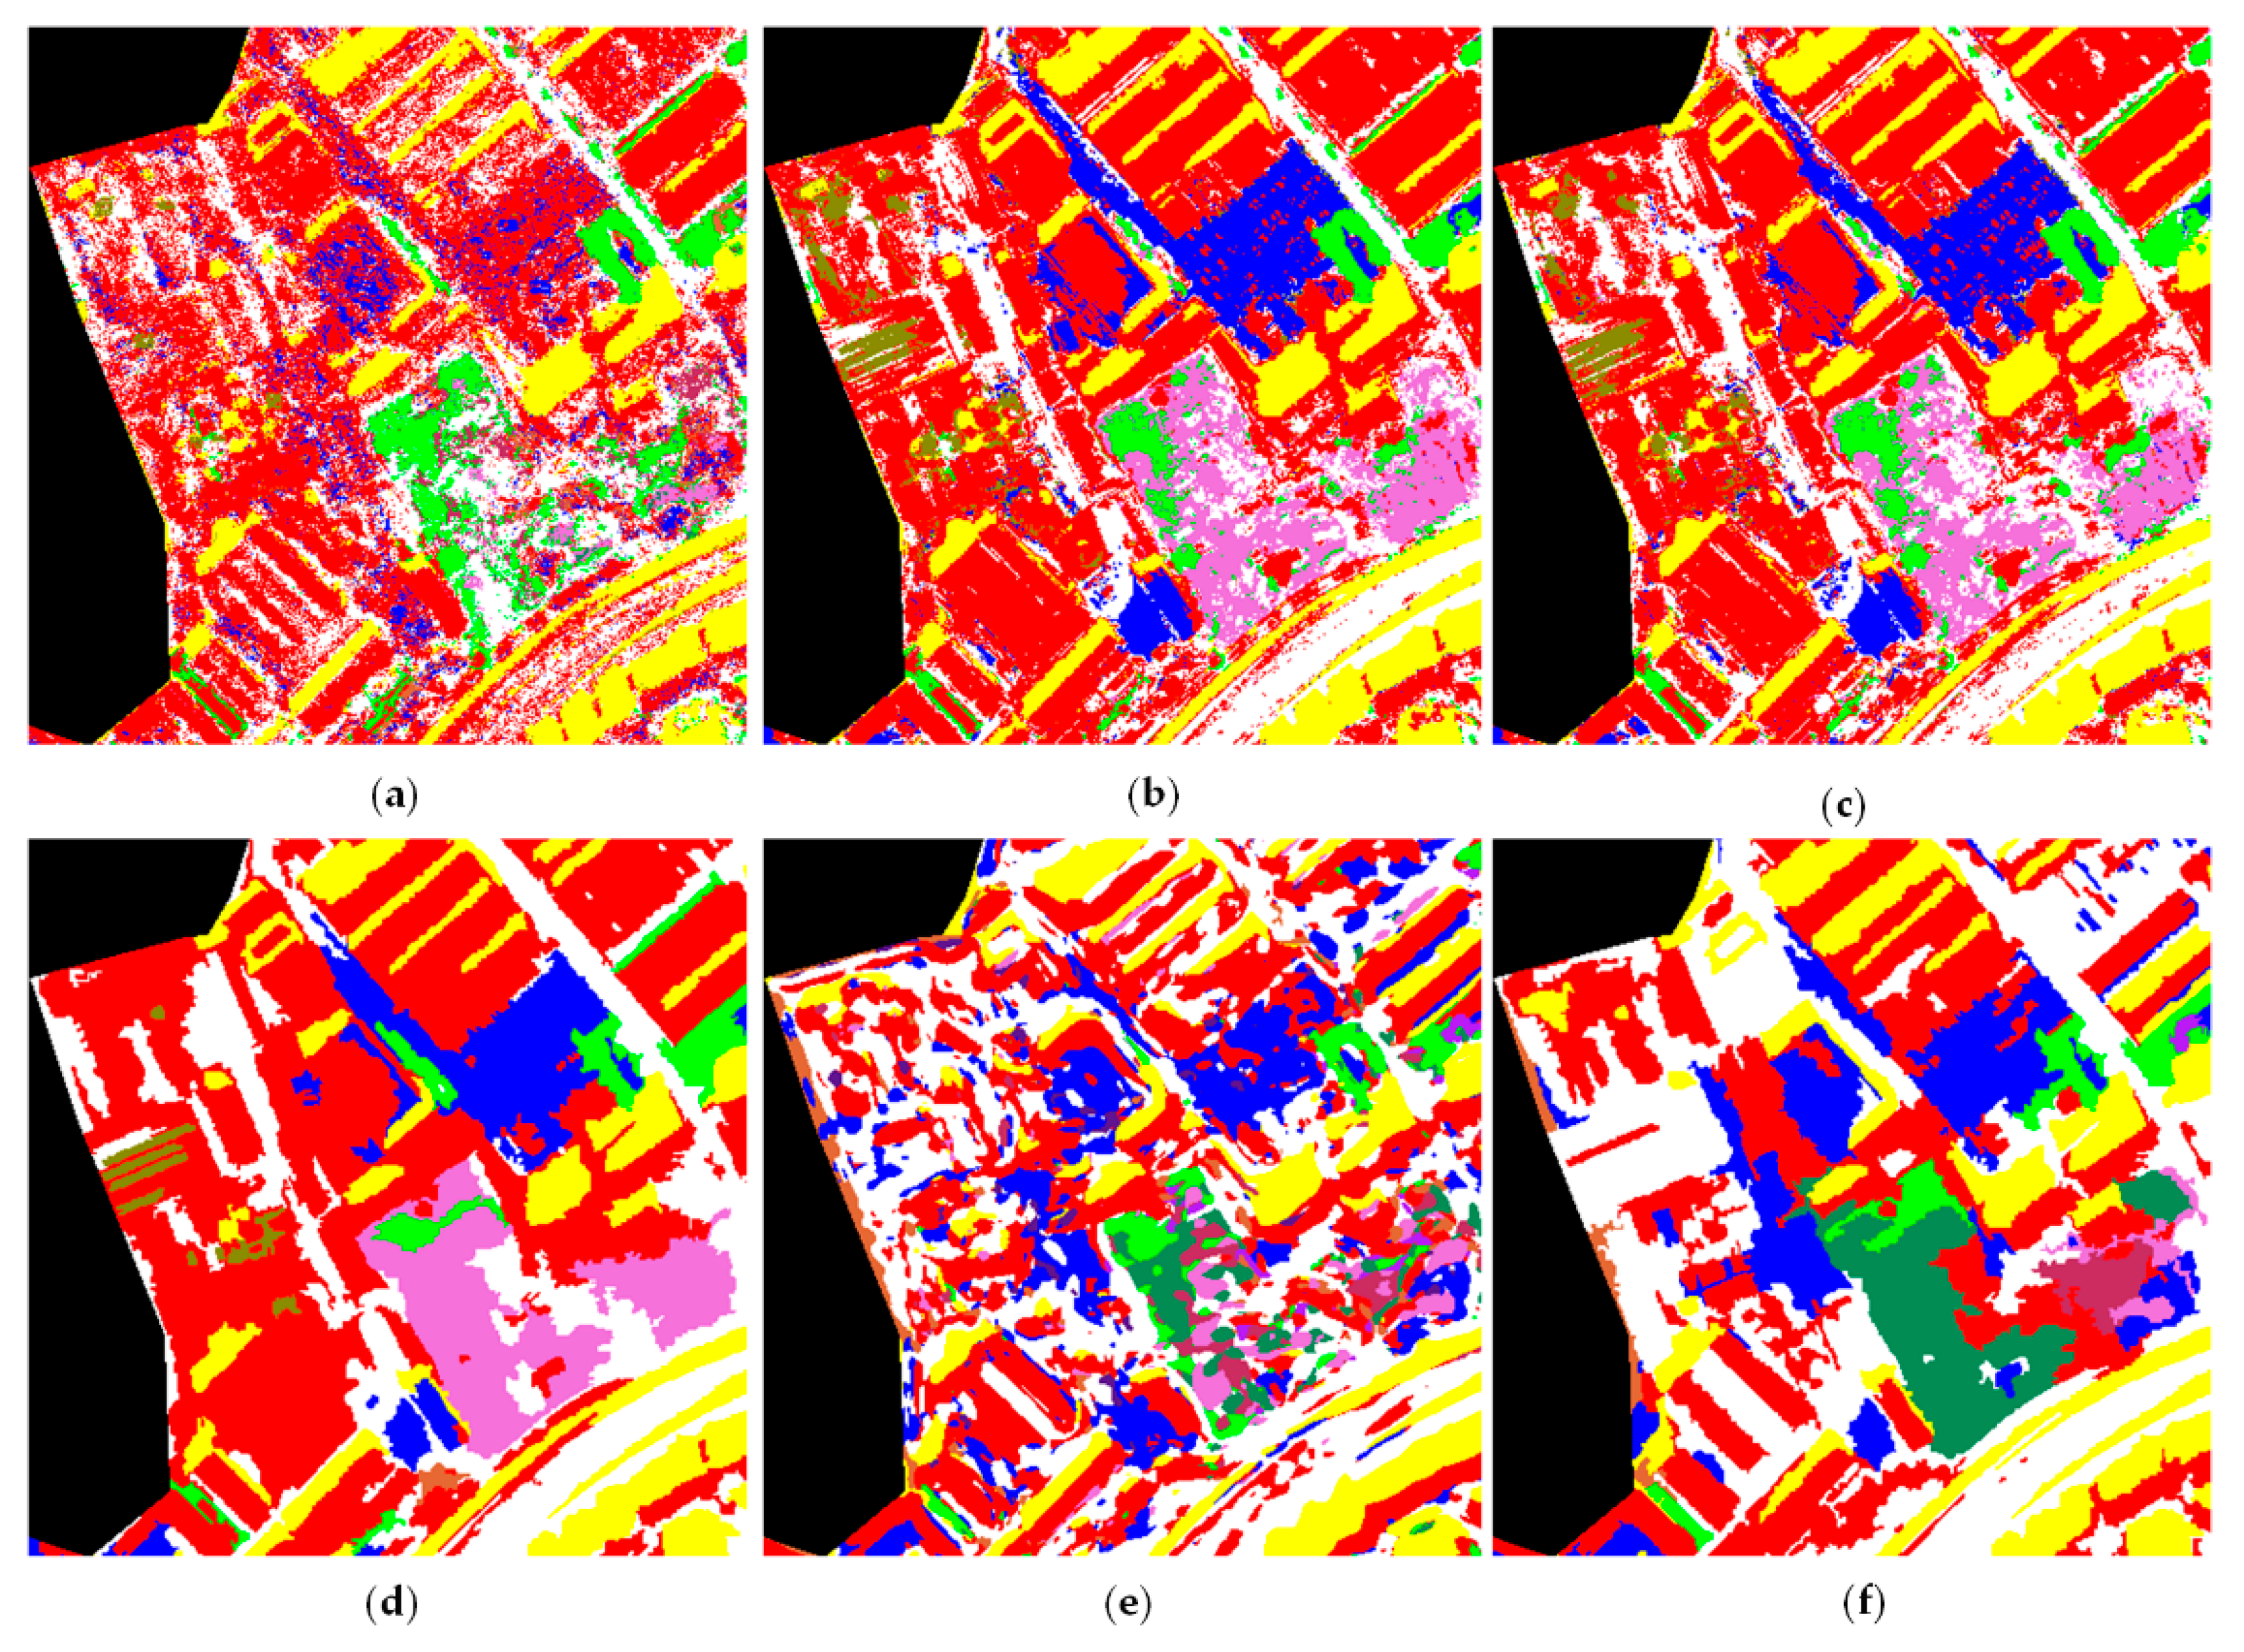
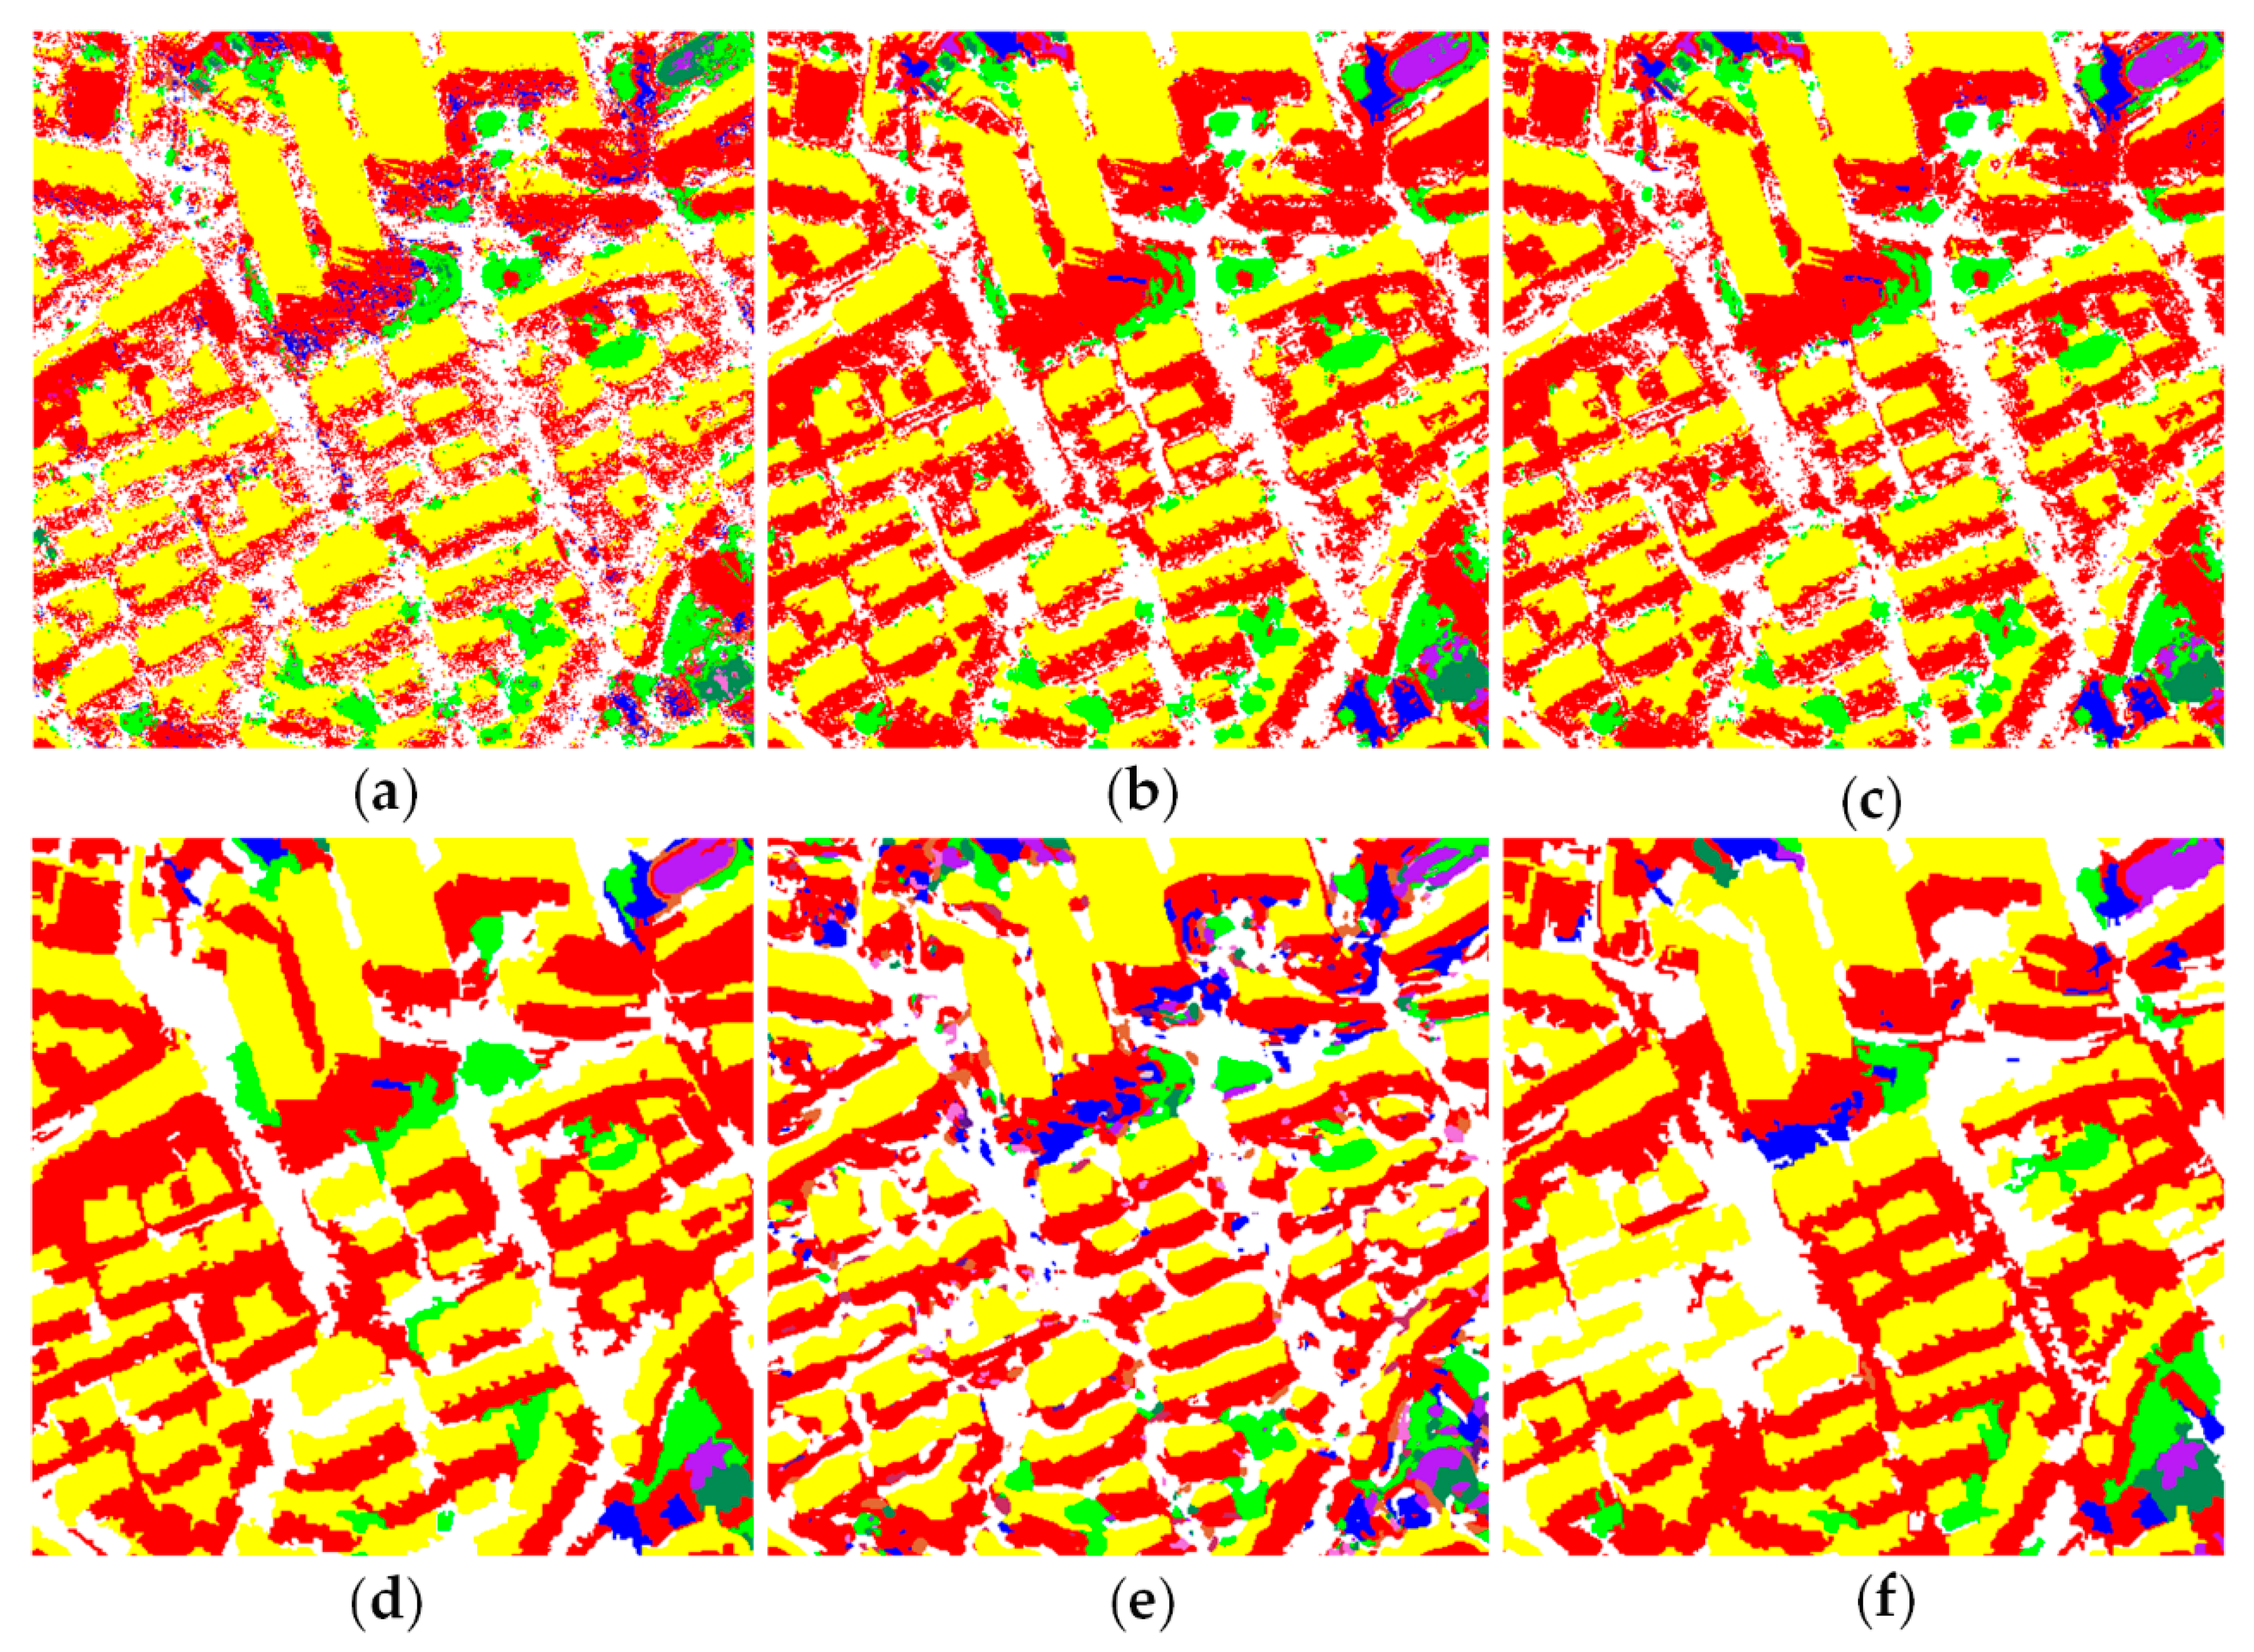
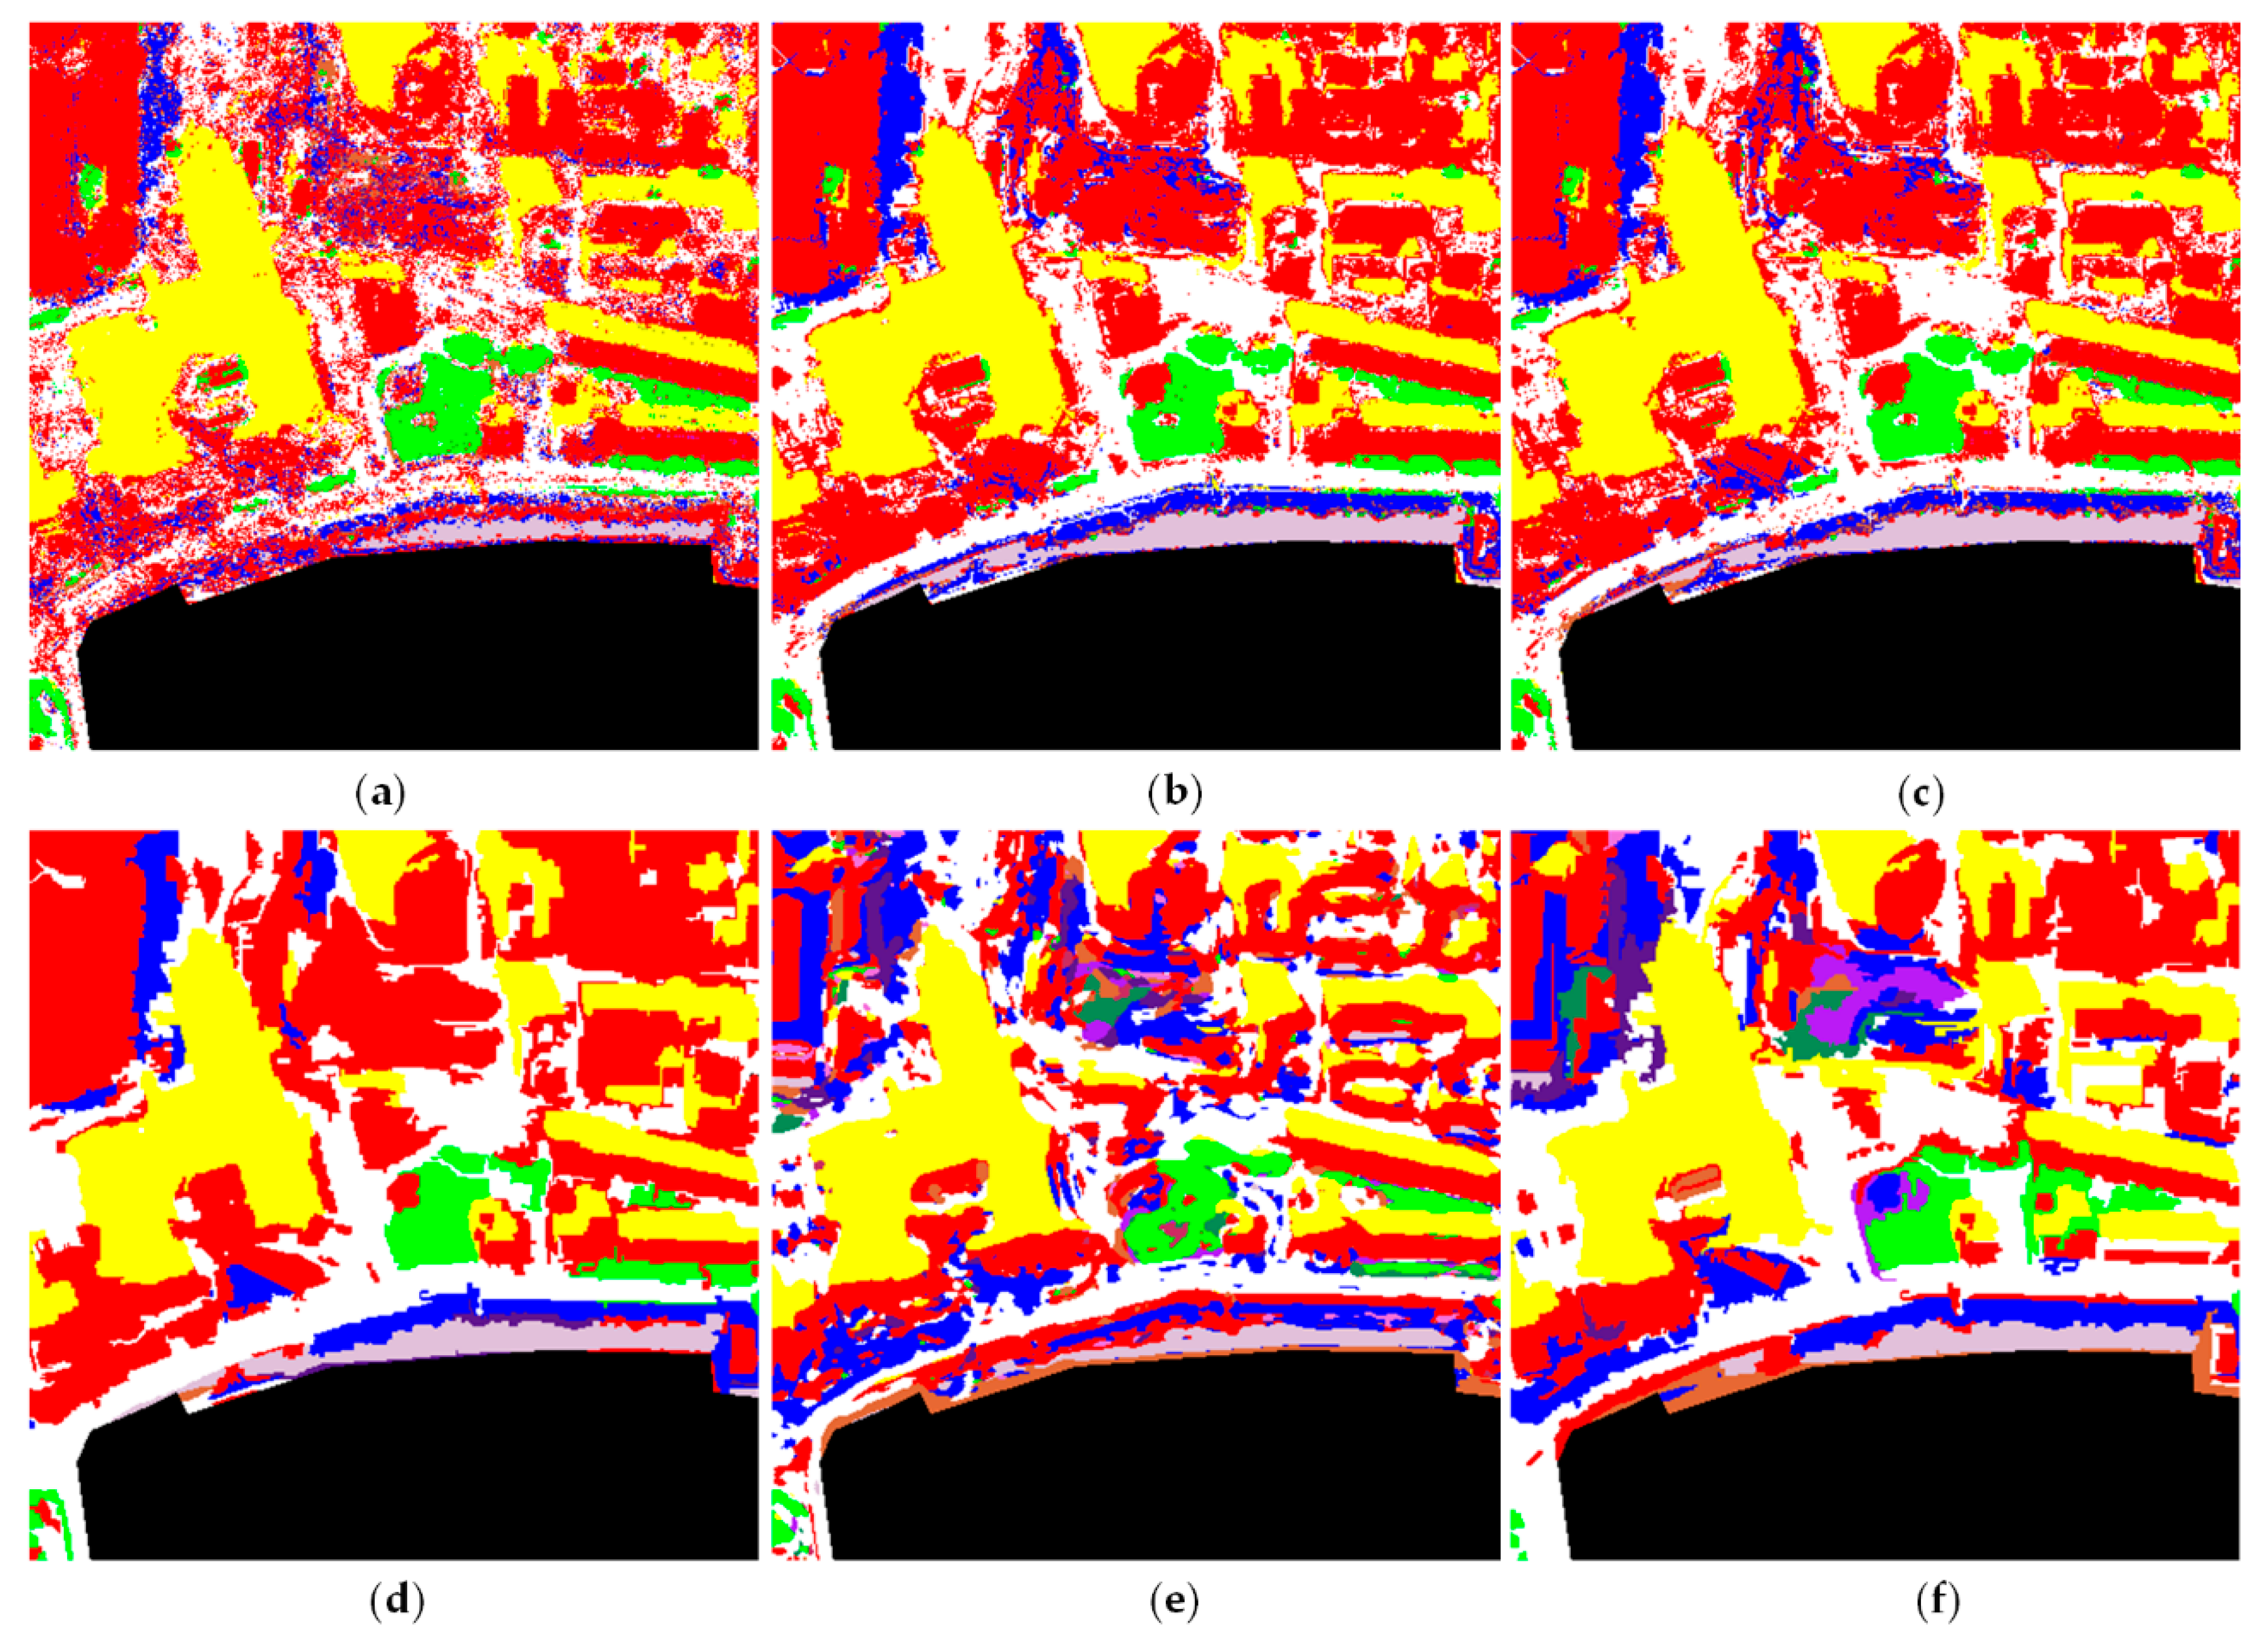
3.3.2. Qualitative Evaluation
3.3.3. Quantitative Evaluation
4. Discussion
4.1. The Effectiveness of Spectral–Spatial Features
4.2. The Effectiveness of Feature Optimization
4.3. The Effectiveness of the Multi-Scale Superpixel Classification
5. Conclusions
Author Contributions
Funding
Acknowledgments
Conflicts of Interest
References
- Barragán, J.M.; de Andrés, M. Analysis and trends of the world’s coastal cities and agglomerations. Ocean Coast. Manag. 2015, 114, 11–20. [Google Scholar] [CrossRef]
- de Andrés, M.; Barragán, J.M.; Sanabria, J.G. Ecosystem services and urban development in coastal social-ecological systems: The bay of cádiz case study. Ocean Coast. Manag. 2018, 154, 155–167. [Google Scholar] [CrossRef]
- Dhiman, R.; Kalbar, P.; Inamdar, A.B. GIS coupled multiple criteria decision making approach for classifying urban coastal areas in India. Habitat Int. 2018, 71, 125–134. [Google Scholar] [CrossRef]
- Chen, J.; Du, P.; Wu, C.; Xia, J.; Chanussot, J. Mapping urban land cover of a large area using multiple sensors multiple features. Remote Sens. 2018, 10, 872. [Google Scholar] [CrossRef]
- Huang, X.; Weng, C.; Lu, Q.; Feng, T.; Zhang, L. Automatic labelling and selection of training samples for high-resolution remote sensing image classification over urban areas. Remote Sens. 2015, 7, 16024–16044. [Google Scholar] [CrossRef]
- Georganos, S.; Grippa, T.; Vanhuysse, S.; Lennert, M.; Shimoni, M.; Kalogirou, S.; Wolff, E. Less is more: Optimizing classification performance through feature selection in a very-high-resolution remote sensing object-based urban application. GISci. Remote Sens. 2018, 55, 221–242. [Google Scholar] [CrossRef]
- Fang, L.; Li, S.; Kang, X.; Benediktsson, J.A. Spectral-spatial classification of hyperspectral images with a superpixel-based discriminative sparse model. IEEE Trans. Geosci. Remote Sens. 2015, 53, 4186–4201. [Google Scholar] [CrossRef]
- Vargas, J.E.; Saito, P.T.; Falcao, A.X.; De Rezende, P.J.; Dos Santos, J.A. Superpixel-based interactive classification of very high-resolution images. In Proceedings of the 27th SIBGRAPI Conference, Rio de Janeiro, Brazil, 26–30 August 2014; pp. 173–179. [Google Scholar] [CrossRef]
- Stutz, D.; Hermans, A.; Leibe, B. Superpixels: An evaluation of the state-of-the-art. Comput. Vis. Image Underst. 2018, 166, 1–27. [Google Scholar] [CrossRef] [Green Version]
- Fu, Z.; Sun, Y.; Fan, L.; Han, Y. Multiscale and multifeature segmentation of high-spatial resolution remote sensing images using superpixels with mutual optimal strategy. Remote Sens. 2018, 10, 1289. [Google Scholar] [CrossRef]
- Achanta, R.; Shaji, A.; Smith, K.; Lucchi, A.; Fua, P.; Süsstrunk, S. Slic superpixels compared to state-of-the-art superpixel methods. IEEE Trans. Pattern Anal. 2012, 34, 2274–2282. [Google Scholar] [CrossRef]
- Felzenszwalb, P.F.; Huttenlocher, D.P. Efficient graph-based image segmentation. Int. J. Comput. Vis. 2004, 59, 167–181. [Google Scholar] [CrossRef]
- Shi, J.; Malik, J. Normalized cuts and image segmentation. IEEE Trans. Pattern Anal. 2000, 22, 888–905. [Google Scholar] [CrossRef] [Green Version]
- Tu, B.; Yang, X.; Li, N.; Ou, X.; He, W. Hyperspectral image classification via superpixel correlation coefficient representation. IEEE J. Sel. Top. Appl. Earth Obs. Remote Sens. 2018, 11, 4113–4127. [Google Scholar] [CrossRef]
- Belgiu, M.; Drǎguţ, L. Comparing supervised and unsupervised multiresolution segmentation approaches for extracting buildings from very high-resolution imagery. ISPRS J. Photogramm. Remote Sens. 2014, 96, 67–75. [Google Scholar] [CrossRef]
- Csillik, O. Fast segmentation and classification of very high-resolution remote sensing data using slic superpixels. Remote Sens. 2017, 9, 243. [Google Scholar] [CrossRef]
- Dingle Robertson, L.; King, D.J. Comparison of pixel-and object-based classification in land cover change mapping. Int. J. Remote Sens. 2011, 32, 1505–1529. [Google Scholar] [CrossRef]
- Hussain, M.; Chen, D.; Cheng, A.; Wei, H.; Stanley, D. Change detection from remotely sensed images: From pixel-based to object-based approaches. ISPRS J. Photogramm. Remote Sens. 2013, 80, 91–106. [Google Scholar] [CrossRef]
- Herold, M.; Liu, X.H.; Clarke, K.C. Spatial metrics and image texture for mapping urban land use. Photogramm. Eng. Remote Sens. 2003, 69, 991–1002. [Google Scholar] [CrossRef]
- Zhang, C.; Sargent, I.; Pan, X.; Li, H.; Gardiner, A.; Hare, J.; Atkinson, P.M. An object-based convolutional neural network (oCNN) for urban land use classification. Remote Sens. Environ. 2018, 216, 57–70. [Google Scholar] [CrossRef]
- Ghamisi, P.; Benediktsson, J.A.; Cavallaro, G.; Plaza, A. Automatic framework for spectral–spatial classification based on supervised feature extraction and morphological attribute profiles. IEEE J. Sel. Top. Appl. Earth Obs. Remote Sens. 2014, 7, 2147–2160. [Google Scholar] [CrossRef]
- Bhardwaj, K.; Patra, S. An unsupervised technique for optimal feature selection in attribute profiles for spectral-spatial classification of hyperspectral images. ISPRS J. Photogramm. Remote Sens. 2018, 138, 139–150. [Google Scholar] [CrossRef]
- Demir, B.; Bruzzone, L. Histogram-based attribute profiles for classification of very high-resolution remote sensing images. IEEE Trans. Geosci. Remote Sens. 2016, 54, 2096–2107. [Google Scholar] [CrossRef]
- Khodadadzadeh, M.; Li, J.; Prasad, S.; Plaza, A. Fusion of hyperspectral and lidar remote sensing data using multiple feature learning. IEEE J. Sel. Top. Appl. Earth Obs. Remote Sens. 2017, 8, 2971–2983. [Google Scholar] [CrossRef]
- Falco, N.; Mura, M.D.; Bovolo, F.; Benediktsson, J.A.; Bruzzone, L. Change detection in vhr images based on morphological attribute profiles. IEEE Geosci. Remote Sens. 2013, 10, 636–640. [Google Scholar] [CrossRef]
- Benediktsson, J.A.; Bruzzone, L.; Chanussot, J.; Mura, M.D.; Salembier, P.; Valero, S. Hierarchical analysis of remote sensing data: Morphological attribute profiles and binary partition trees. In Proceedings of the International Conference on Mathematical Morphology and Its Applications to Image and Signal Processing, Verbania-Intra, Italy, 6–8 July 2011; pp. 306–319. [Google Scholar] [CrossRef]
- Song, B.; Li, J.; Mura, M.D.; Li, P.; Plaza, A.; Bioucas-Dias, J.M.; Benediktsson, J.A.; Chanussot, J. Remotely sensed image classification using sparse representations of morphological attribute profiles. IEEE Trans. Geosci. Remote Sens. 2014, 52, 5122–5136. [Google Scholar] [CrossRef]
- Xia, J.; Ghamisi, P.; Yokoya, N.; Iwasaki, A. Random Forest Ensembles and Extended Multiextinction Profiles for Hyperspectral Image Classification. IEEE Trans. Geosci. Remote Sens. 2018, 56, 202–216. [Google Scholar] [CrossRef]
- Zhang, A.; Ma, P.; Liu, S.; Sun, G.; Huang, H.; Zabalza, J.; Wang, Z.; Lin, C. Hyperspectral band selection using crossover-based gravitational search algorithm. IET Image Process. 2018, 13, 280–286. [Google Scholar] [CrossRef]
- Li, C.; Huang, J.; Li, Z.; Wang, R. Plane-wave least-squares reverse time migration with a preconditioned stochastic conjugate gradient method. Geophysics 2018, 83, S33–S46. [Google Scholar] [CrossRef]
- Huang, J.; Liao, W.; Li, Z. A multi-block finite difference method for seismic wave equation in auxiliary coordinate system with irregular fluid-solid interface. Eng. Comput. 2018, 35, 334–362. [Google Scholar] [CrossRef]
- Yong, P.; Huang, J.; Li, Z.; Liao, W.; Qu, L.; Li, Q.; Liu, P. Optimized equivalent staggered-grid fd method for elastic wave modelling based on plane wave solutions. Geophys. J. Int. 2017, 208, 1157–1172. [Google Scholar] [CrossRef]
- Huang, C.-L.; Wang, C.-J. A GA-based feature selection and parameters optimizationfor support vector machines. Expert Syst. Appl. 2006, 31, 231–240. [Google Scholar] [CrossRef]
- Ghamisi, P.; Benediktsson, J.A. Feature selection based on hybridization of genetic algorithm and particle swarm optimization. IEEE Geosci. Remote Sens. 2015, 12, 309–313. [Google Scholar] [CrossRef]
- Rashedi, E.; Nezamabadi-Pour, H.; Saryazdi, S. GSA: A gravitational search algorithm. Inform. Sci. 2009, 179, 2232–2248. [Google Scholar] [CrossRef]
- Güvenç, U.; Sönmez, Y.; Duman, S.; Yörükeren, N. Combined economic and emission dispatch solution using gravitational search algorithm. Sci. Iran. 2012, 19, 1754–1762. [Google Scholar] [CrossRef] [Green Version]
- Zhang, A.; Liu, S.; Sun, G.; Huang, H.; Ma, P.; Rong, J.; Ma, H.; Lin, C.; Wang, Z. Clustering of Remote Sensing Imagery Using a Social Recognition-Based Multi-objective Gravitational Search Algorithm. Cogn. Comput. 2018, 1–10. [Google Scholar] [CrossRef]
- Rodriguez-Galiano, V.F.; Chica-Olmo, M.; Abarca-Hernandez, F.; Atkinson, P.M.; Jeganathan, C. Random Forest classification of Mediterranean land cover using multi-seasonal imagery and multi-seasonal texture. Remote Sens. Environ. 2012, 121, 93–107. [Google Scholar] [CrossRef]
- Ghosh, A.; Sharma, R.; Joshi, P.K. Random forest classification of urban landscape using Landsat archive and ancillary data: Combining seasonal maps with decision level fusion. Appl. Geogr. 2014, 48, 31–41. [Google Scholar] [CrossRef]
- Kavzoglu, T.; Colkesen, I. An assessment of the effectiveness of a rotation forest ensemble for land-use and land-cover mapping. Int. J. Remote Sens. 2013, 34, 4224–4241. [Google Scholar] [CrossRef]
- Kavzoglu, T. Chapter 33—Object-Oriented Random Forest for High-resolution Land Cover Mapping Using Quickbird-2 Imagery. In Handbook of Neural Computation; Samui, P., Sekhar, S., Balas, V.E., Eds.; Academic Press: Cambridge, MA, USA, 2017; pp. 607–619. [Google Scholar] [CrossRef]
- Han, M.; Zhu, X.; Yao, W. Remote sensing image classification based on neural network ensemble algorithm. Neurocomputing 2012, 78, 133–138. [Google Scholar] [CrossRef]
- Padmanaban, R.; Bhowmik, A.K.; Cabral, P.; Zamyatin, A.; Almegdadi, O.; Wang, S. Modelling Urban Sprawl Using Remotely Sensed Data: A Case Study of Chennai City, Tamilnadu. Entropy 2017, 19, 163. [Google Scholar] [CrossRef]
- Cheema, M.J.M.; Bastiaanssen, W.G.M. Land use and land cover classification in the irrigated Indus Basin using growth phenology information from satellite data to support water management analysis. Agric. Water Manag. 2010, 97, 1541–1552. [Google Scholar] [CrossRef]
- Bassa, Z.; Bob, U.; Szantoi, Z.; Ismail, R. Land cover and land use mapping of the iSimangaliso Wetland Park, South Africa: Comparison of oblique and orthogonal random forest algorithms. J. Appl. Remote Sens. 2016, 10, 15–17. [Google Scholar] [CrossRef]
- Li, S.; Ni, L.; Jia, X.; Gao, L.; Zhang, B.; Peng, M. Multi-scale superpixel spectral–spatial classification of hyperspectral images. Int. J. Remote Sens. 2016, 37, 4905–4922. [Google Scholar] [CrossRef]
- Tong, H.; Maxwell, T.; Zhang, Y.; Dey, V. A supervised and fuzzy-based approach to determine optimal multi-resolution image segmentation parameters. Photogramm. Eng. Remote Sens. 2012, 78, 1029–1044. [Google Scholar] [CrossRef]
- Costa, G.; Feitosa, R.; Cazes, T.; Feijó, B. Genetic adaptation of segmentation parameters. In Object-Based Image Analysis; Springer: Heidelberg/Berlin, Germany, 2008; pp. 679–695. [Google Scholar] [CrossRef]
- Chen, J.; Pan, D.; Mao, Z. Image-object detectable in multiscale analysis on high-resolution remotely sensed imagery. Int. J. Remote Sens. 2009, 30, 3585–3602. [Google Scholar] [CrossRef]
- Das, A.; Bhardwaj, K.; Patra, S. Morphological complexity profile for the analysis of hyperspectral images. In Proceedings of the 2018 4th International Conference on Recent Advances in Information Technology (RAIT), Dhanbad, India, 15–17 March 2018; pp. 1–6. [Google Scholar] [CrossRef]
- Mura, M.D.; Benediktsson, J.A.; Waske, B.; Bruzzone, L. Morphological attribute profiles for the analysis of very high-resolution images. IEEE Trans. Geosci. Remote Sens. 2010, 48, 3747–3762. [Google Scholar] [CrossRef]
- Ghamisi, P.; Couceiro, M.S.; Benediktsson, J.A. A novel feature selection approach based on FODPSO and SVM. IEEE Trans. Geosci. Remote Sens. 2015, 53, 2935–2947. [Google Scholar] [CrossRef]
- Marpu, P.R.; Pedergnana, M.; Mura, M.D.; Benediktsson, J.A.; Bruzzone, L. Automatic generation of standard deviation attribute profiles for spectral–spatial classification of remote sensing data. IEEE Geosci. Remote Sens. 2012, 10, 293–297. [Google Scholar] [CrossRef]
- Zhang, A.; Sun, G.; Ma, P.; Jia, X.; Ren, J.; Huang, H.; Zhang, X. Coastal Wetland Mapping with Sentinel-2 MSI Imagery Based on Gravitational Optimized Multilayer Perceptron and Morphological Attribute Profiles. Remote Sens. 2019, 11, 952. [Google Scholar] [CrossRef]
- Maurer, T. How to pan-sharpen images using the Gram-Schmidt pan-sharpen method-a recipe. In Proceedings of the 2013 ISPRS Hannover Workshop, Hannover, Germany, 21–24 May 2013; pp. 239–244. [Google Scholar] [CrossRef]
- Simonyan, K.; Zisserman, A. Very deep convolutional networks for large-scale image recognition. In Proceedings of the 2015 International Conference on Learning Representations, San Diego, CA, USA, 7–9 May 2015; pp. 1–14. [Google Scholar]


| Gaofen-2 Image of Qingdao | Worldview-2 Image of Hong Kong | ||||||
|---|---|---|---|---|---|---|---|
| Classes | Training | Testing | Total | Classes | Training | Testing | Total |
| Building | 54,704 | 13,676 | 68,380 | Building | 18,272 | 4568 | 22,840 |
| Open space | 8680 | 2170 | 10,850 | Shadow | 8552 | 2138 | 10,690 |
| Road | 28,812 | 7203 | 36,015 | Open space | 8220 | 2055 | 10,275 |
| Vegetation | 13,004 | 3251 | 16,255 | River | 6548 | 1637 | 8185 |
| Shadow | 22,128 | 5532 | 27,660 | Inland water | 9748 | 2437 | 12,185 |
| Rock | 3728 | 932 | 4660 | Aquafarm | 6660 | 1665 | 8325 |
| Bare soil | 964 | 241 | 1205 | Road | 8096 | 2024 | 10,120 |
| Beach | 968 | 242 | 1210 | Vegetation | 12,992 | 3248 | 16,240 |
| Red sport ground | 884 | 221 | 1105 | Mudflat | 1480 | 370 | 1850 |
| Green sport ground | 1628 | 407 | 2035 | ||||
| Sand | 2084 | 521 | 2605 | ||||
| Vacant | 1096 | 274 | 1370 | ||||
| Image | Level | Target Objects for Segmentation | Scale | Shape | Smoothness |
|---|---|---|---|---|---|
| Qingdao | 1 | vegetation and their shadow | 10 | 0.2 | 0.8 |
| 2 | others | 20 | 0.5 | 0.7 | |
| 3 | road | 30 | 0.7 | 0.7 | |
| Hong Kong | 1 | building and their shadow | 10 | 0.7 | 0.8 |
| 2 | vegetation and others | 15 | 0.2 | 0.5 | |
| 3 | river, inland water, and aquafarm | 20 | 0.5 | 0.5 |
| Image | Multi-Spectral | NDVI | Area | Standard Deviation | Moment of Inertia | |||
|---|---|---|---|---|---|---|---|---|
| Qingdao | 4 (4) | 1 (1) | 19 (44) | 100/φ × 1 (4) | 18 (88) | μ × 2.5 (6) | 0.1 (4) | |
| 100/φ × 3 (4) | μ × 5 (4) | 0.3 (5) | ||||||
| 100/φ × 5 (4) | μ × 7.5 (2) | 13 (32) | 0.5 (3) | |||||
| 100/φ × 7 (3) | μ × 10 (3) | 0.7 (1) | ||||||
| 100/φ × 9 (4) | μ × 17.5 (1) | |||||||
| μ × 20 (2) | ||||||||
| Hong Kong | 8 (8) | 1 (1) | 32 (88) | 100/φ × 1 (8) | 29 (176) | μ × 2.5 (6) | 32 (64) | 0.1 (6) |
| 100/φ × 3 (4) | μ × 5 (6) | 0.3 (12) | ||||||
| 100/φ × 5 (4) | μ × 7.5 (8) | 0.5 (10) | ||||||
| 100/φ × 7 (4) | μ × 10 (4) | 0.7 (4) | ||||||
| 100/φ × 9 (12) | μ × 15 (5) | |||||||
| Image | Raw | SS | OSS | OSS-MSSC | VGG | VGG-MSSC | |
|---|---|---|---|---|---|---|---|
| Qingdao | OA | 81.34 | 95.19 | 94.55 | 97.25 | 86.52 | 86.89 |
| Kappa | 0.75 | 0.93 | 0.92 | 0.96 | 0.82 | 0.83 | |
| Hong Kong | OA | 82.50 | 93.00 | 93.27 | 95.40 | 89.24 | 89.95 |
| Kappa | 0.79 | 0.91 | 0.92 | 0.95 | 0.87 | 0.89 |
© 2019 by the authors. Licensee MDPI, Basel, Switzerland. This article is an open access article distributed under the terms and conditions of the Creative Commons Attribution (CC BY) license (http://creativecommons.org/licenses/by/4.0/).
Share and Cite
Zhang, A.; Zhang, S.; Sun, G.; Li, F.; Fu, H.; Zhao, Y.; Huang, H.; Cheng, J.; Wang, Z. Mapping of Coastal Cities Using Optimized Spectral–Spatial Features Based Multi-Scale Superpixel Classification. Remote Sens. 2019, 11, 998. https://doi.org/10.3390/rs11090998
Zhang A, Zhang S, Sun G, Li F, Fu H, Zhao Y, Huang H, Cheng J, Wang Z. Mapping of Coastal Cities Using Optimized Spectral–Spatial Features Based Multi-Scale Superpixel Classification. Remote Sensing. 2019; 11(9):998. https://doi.org/10.3390/rs11090998
Chicago/Turabian StyleZhang, Aizhu, Shuang Zhang, Genyun Sun, Feng Li, Hang Fu, Yunhua Zhao, Hui Huang, Ji Cheng, and Zhenjie Wang. 2019. "Mapping of Coastal Cities Using Optimized Spectral–Spatial Features Based Multi-Scale Superpixel Classification" Remote Sensing 11, no. 9: 998. https://doi.org/10.3390/rs11090998