Wetland Monitoring Using SAR Data: A Meta-Analysis and Comprehensive Review
by
 , , ,
, , ,
Sarina Adeli
1, 
Bahram Salehi
1 ,
,
Masoud Mahdianpari
2,* ,
,
Lindi J. Quackenbush
1, 
Brian Brisco
3 ,
,
Haifa Tamiminia
1 and
Stephen Shaw
1 1
Department of Environmental Resources Engineering, State University of New York College of Environmental Science and Forestry (ESF), New York, NY 13210, USA
2
C-CORE and Department of Electrical and Computer Engineering, Memorial University of Newfoundland, St. John’s, NL A1C 5S7, Canada
3
The Canada Centre for Mapping and Earth Observation, Ottawa, ON K1S 5K, Canada
*
Author to whom correspondence should be addressed.
Remote Sens. 2020, 12(14), 2190; https://doi.org/10.3390/rs12142190
Submission received: 13 May 2020
/
Revised: 4 July 2020
/
Accepted: 6 July 2020
/
Published: 9 July 2020
(This article belongs to the Special Issue Wetland Mapping and Monitoring Using Advanced Synthetic Aperture RADAR (SAR) Data and Techniques)
Abstract
:Despite providing vital ecosystem services, wetlands are increasingly threatened across the globe by both anthropogenic activities and natural processes. Synthetic aperture radar (SAR) has emerged as a promising tool for rapid and accurate monitoring of wetland extent and type. By acquiring information on the roughness and moisture content of the surface, SAR offers unique potential for wetland monitoring. However, there are still challenges in applying SAR for mapping complex wetland environments. The backscattering similarity of different wetland classes is one of the challenges. Choosing the appropriate SAR specifications (incidence angle, frequency and polarization), based on the wetland type, is also a subject of debate and should be investigated more thoroughly. The geometric distortion of SAR imagery and loss of coherency are other remaining challenges in applying SAR and its processing techniques for wetland studies. Hence, this study provides a systematic meta-analysis based on compilation and analysis of indexed research studies that used SAR for wetland monitoring. This meta-analysis reviewed 172 papers and documented an upward trend in usage of SAR data, increasing usage of multi-sensor data, increasing integration of C- and L- bands over other configurations and higher classification accuracy with multi-frequency and multi-polarized SAR data. The highest number of wetland research studies using SAR data came from the USA, Canada and China. This meta-analysis highlighted the current challenges and solutions for wetland monitoring using SAR sensors.

1. Introduction
Wetlands are often located adjacent to fresh or salt water and are generally characterized by hydric soils that experience wet conditions either periodically during the growing season or permanently in all seasons. The global extent of wetlands is estimated to be around 1.2 million square km, although this is likely an underestimate [1]. Wetlands play an irreplaceable role in both regional and global scales due to their controls on biologic, ecological and hydrological processes [2,3,4]. Costanza et al. (1997) estimated the dollar value for worldwide wetland services to be $14.9 trillion [5]. From a regional scale perspective, they purify water resources, control floods, provide critical habitat and support recreational activities. At a global scale, wetlands play a key role in determining greenhouse gas emissions. Wetlands are an integral part of the global carbon cycle and also generate a sizable fraction of global methane emissions [6,7].
Despite the significance of wetlands, they are currently threatened by intensive water extraction for irrigation, industrial development, deforestation, reservoir construction, rising sea levels, thawing of permafrost [8] and changing precipitation patterns [9]. Slight shifts in weather patterns and global warming affect wetland environments substantially. The United Nations World Water Development reported that about two-thirds of wetlands have been lost since the beginning of the 20th century [9]. Dahl et al. (1991) reported that an average of 290,000 hectares of wetlands were degraded from 1970 to the 1980 and interestingly, 87% of the degradation stimulated by agricultural activities. Subsequent decades continued to show significant wetland loss in the US [10]. Likewise, 54% of the world’s mangrove forest has been degraded in the past two decades [1]. Due to the dramatic decline in the extent of wetlands, monitoring their condition is an essential issue in the current era.
Field measurement techniques provide valuable reference data for evaluating wetlands, albeit in localized scales; however, such techniques are impractical for frequent monitoring of wetlands [11]. Field measurement techniques for wetland mapping are often labor-intensive, time-consuming and costly given the extent of wetlands. Furthermore, wetlands are often located in inaccessible areas, making ground surveys impractical. Wetlands are subject to change due to their dynamic nature annually or interannually in terms of the water area, water level or vegetation presence and growth. The evaluation and mapping of wetlands demands a reliable tool able to monitor the vast majority of wetlands even in inaccessible areas.
Remote sensing technology is particular valuable for mapping wetlands where remoteness, vastness or the highly dynamic nature of wetlands make field measurements impractical [12]. Specifically, airborne or satellite sensors can capture synoptic views of the landscape with a high temporal resolution and thus are efficient for mapping wetland complexes [13,14,15,16]. Optical sensors, such as the Landsat series, Worldview-2 and Rapid-Eye, are among the more common sensors for wetland mapping [17,18,19,20,21,22,23]. Several studies reported success of wetland mapping using optical sensors [24]. High spatial and temporal resolution of optical sensors along with their high coverage provide good estimation of wetland extent in broad scales. Multispectral optical sensors allow for molecular level information retrieval, yet cloud cover and night conditions limit their data acquisition capability. Moreover, due to their short wavelength, the ability of optical sensors to penetrate vegetation is relatively low.
In contrast to optical systems, longer wavelength synthetic aperture radar (SAR) sensors are able to collect data independent of weather condition and solar illumination, thus making them more suitable for monitoring wetlands, particularly in the northern latitudes. Compared to optical sensors that interact with a target at the molecular level, SAR sensors interact with targets at the macroscopic level and thus collect valuable information from macroscale features such as structure, surface roughness and moisture content [25]. In particular, SAR systems can provide unique information on surface hydrology and the geometry of vegetation in herbaceous wetlands [26,27]. SAR signals have a deeper penetration capability through vegetation canopies, which make them advantageous compared to optical sensors. Furthermore, advanced SAR missions (e.g., RADARSAT-2, RADARSAT constellation mission (RCM)) have the ability to transmit linear or circular polarization and receive the horizontal or vertical polarized wave, which is useful for discrimination of different wetland classes [28].
The application of satellite SAR sensors for monitoring vegetation dates back to 1980 following the launch of the first SAR spaceborne satellite (L-band Seasat) in 1978 [29]. Investigations in monitoring coastal and inland wetlands that exploited C and L band data from Shuttle Imaging Radar missions (SIR-A, SIR-B and SIR-C), ERS-1 [30] and ERS-2, JERS [31,32,33,34] and RADARSAT [35,36,37,38] expanded during the next decades. RADARSAT-2, launched in 2007, was the first satellite that carried a full polarimetric C-band SAR sensor, which is of particular interest for physical characterization of flooded wetland vegetation [39,40,41,42]. Capacity was further expanded by the launches of the TerraSAR-X and COSMO-SkyMed constellations [43], which offered relatively short revisit cycles and very high spatial resolution (up to one meter). These two systems operate in X-band, enabling them to deliver complementary information for monitoring wetlands [44]. More recently, compact polarimetric SAR (PolSAR) data have drawn attention among the remote sensing community, given a unique configuration that is advantageous compared to conventional polarimetric sensors for many applications. For example, the currently operating RADARSAT constellation mission (RCM) with a wider swath width and capability to collect a variety of polarimetric configurations offers a significant improvement in terms of temporal resolution, thus making it superior compared to its predecessor, RADARSAT-2, for operational remote sensing applications demanding frequent data at a large scale [45,46,47,48].
SAR data have shown to be useful for wetland studies in a variety of applications. Wetland mapping and classification using SAR data have been one of the most investigated application to date [47,49,50,51,52,53,54,55,56,57,58,59,60,61,62,63,64,65], yet the backscattering similarity of wetland classes presents challenges. Another application of SAR data for wetland studies is inundation water extraction mapping [66]. Different backscattering mechanisms from water and flooded vegetation allow the delineation of water from surrounding vegetation. In addition, spatiotemporal change detection is another application of SAR wetland monitoring. This is of great value because dynamic nature of wetlands requires techniques that can track changes [67]. Water level monitoring using Interferometric SAR (InSAR) techniques is another, less developed technique of wetland monitoring [37,68,69]. Lastly, due to the high contribution of wetlands in methane emission and consequently the carbon cycle, biomass estimation in wetlands using SAR data are also becoming increasingly important [70,71,72,73,74].
Despite the increasing use of SAR to monitor wetlands, the backscattering similarity of wetland classes presents challenges and there has not been a comprehensive assessment that quantifies trends in SAR usage. There have been several review articles related to SAR [9,26,27,28], but these focus on narrow questions. Thus, this study aims to provide a comprehensive statistical meta-analysis focused on the use of SAR data for monitoring wetlands through investigation of 172 articles. We aim to use the meta-analysis to present the importance of SAR in wetland monitoring studies, illustrate trends in wetland monitoring studies and explore challenges, gaps and restrictions in order to reveal effective techniques for manipulating and analyzing SAR data. This review also aims to illustrate the general trend of wetland monitoring using SAR data in remote sensing studies, which is followed by an overview of future trends on wetland monitoring using SAR.
2. Methodology
Bibliographic resources for this review were obtained by a systematic literature search of two well-known scientific databases: “Web of Science” and “Google Scholar.” We followed preferred reporting items for systematic reviews and meta-analyses (PRISMA) for selection and documentation of published peer-reviewed articles [75]. Seven major remote sensing journals were included in the search: Remote Sensing MDPI, Remote Sensing of Environment, International Society for Photogrammetry and Remote Sensing (ISPRS) Journal of Photogrammetry and Remote Sensing, Institute of Electrical and Electronics engineers (IEEE) Transactions on Geoscience and Remote Sensing, International Journal of Remote Sensing, Canadian Journal of Remote Sensing and Journal of Applied Remote Sensing. The search focused on articles published from 1991 to 2019 based on English keywords related to wetland monitoring using SAR data. Figure 1 shows the tag cloud of terms used for wetland monitoring studies using SAR data; the text size indicates the frequency of term usage. Key terms linked to wetland SAR monitoring and their synonyms were also included (Figure 2). A search query was designed that would encompass all the articles with fundamental keywords in wetland studies using SAR data. This search query involved three separate categories of keywords: wetland types, SAR sensors and applications (Figure 2). In order to obtain an inclusive collection of related articles, “or” was set within the keywords from the same category and “and” was set between different categories. The search on wetland types and SAR sensors was performed based on the article’s topic. The search on keywords that covered different applications was performed based on the article’s title. Figure 3 depicts the process of selecting relevant application based on PRISMA flow diagram. The initial query led to 338 articles. After cataloging the parameters for each study, we screened nominated articles and adopted an exclusion query to eliminate papers that integrated SAR data with other available remote sensing datasets (e.g., optical). We omitted the studies that used an integration of SAR and optical data in order to focus this study on investigating the capability of SAR sensors solely. This led to 172 publications containing the relevant studies on wetland monitoring using SAR data that were selected for meta-analysis.
Attributes extracted from the research papers are shown in Table 1. These attributes are summarized in the meta-analysis to provide an overview of how SAR data have been used across studies. One of the important attributes explored was the sensor type, which directly impacts the SAR specifications of frequency, incidence angle, polarization and spatial resolution. Frequency encompasses the different microwave bands used in acquiring SAR data, including P, L, C and X-bands. Depending on the wavelength, the penetration of signal fluctuates considerably. Moreover, the selection of frequency bands can directly affect the observed roughness of the target. Another important attribute is the type of platform: spaceborne or airborne. Airborne platforms, such as UAVSAR, have a lower spatial coverage compared to spaceborne sensors, making them ideal for close examination of relatively small study sites, such as oil spill detection in wetlands. Attributes investigated are summarized in Table 1.
3. Results
3.1. General Characteristics of Wetland Studies Using SAR Data
Figure 4 illustrates the number of published articles in each year, with the total number of studies published in each journal shown in the last column. Years without any published papers in these journals were excluded from this figure. Based on our database, the first wetland SAR article was published in the IEEE journal in 1993. The greatest number of wetland SAR papers were published in the Remote Sensing MDPI journal (41 studies), followed by Remote Sensing of Environment (32 studies) and IEEE (31 studies). As illustrated in Figure 4, the number of published articles in Remote Sensing MDPI journal has increased since 2013, with a single year publication peak in 2016.
Figure 5 illustrates how wetland studies using SAR data have increased over the last three decades, with an annual trend that is approximately exponential. This upward trend could be due to an increased availability of SAR sensors in recent years. An increase in wetland loss could also be an important factor contributing to the increased in the number of publications. Figure 5 also demonstrates that there has been a growing interest in using multi frequency data since 2012. Notably, the reason for decreasing trend in the last bar is that it only covers three years period. Of 172 articles, 35 used multi-frequency datasets. It is reasonable to anticipate this trend will continue due to the anticipated availability of upcoming multi-frequency SAR sensors.
We tabulated the number of wetland studies that used SAR for each country to illustrate how the studies are distributed globally. The collected geographic locations are based on the case studies reported in each study (Figure 6). According to Martinez et al. (2007), wetlands cover approximately 4% of the global land area [76]. Most large wetlands are being assessed and evaluated globally using state-of-the-art remote sensing techniques. The greatest number of articles in any country are based on the case studies in the USA (41 studies), which are mostly located in southern Florida (18 studies), Louisiana (5 studies), Alaska (4 studies), North Carolina (4 studies) and Minnesota (3 studies). Canada is home to 25% of wetlands in the world [77], and we identified thirty-three studies including those in Newfoundland (11 studies), Ontario (10 studies), Alberta (4 studies) and Quebec (3 studies). Fifteen studies were reported in China, which has 10% of global wetlands and 5.58% of its territorial area in wetlands. The Ramsar classification system is predominantly used for wetland classification in China [9,19,71,73,78,79,80,81]. Eleven studies were conducted in the Amazonian flood plain [76,82,83,84,85,86,87], which extends over 300,000 km2 and mostly consists of flooded vegetation [76]. As shown in Figure 6, wetland studies are generally distributed globally, with exceptions in the Middle East and some parts of Africa.
3.2. SAR Specifications and Wetland Monitoring
As outlined earlier, incidence angle and spatial resolution are essential SAR specifications for wetland studies. Following Wohlfart et al. (2018), in this study, we categorized incidence angle in three different ranges: steep (<28°), medium (28–38°) and shallow (>38°) [17]. As Figure 7 demonstrates, medium incidence angles are the most used for wetland monitoring (65 studies), but the number of studies using shallow (56 studies) and steep (51 studies) incidence angles are only slightly less. Figure 7 also illustrates the number of studies in each of three spatial resolution groups: high (<4 m), medium (4–30 m) and low (>30 m). As shown in Figure 7, the largest number of studies used medium (71 studies) or low (69 studies) resolution data whereas studies using high spatial resolution data reported least (30 studies).
Figure 8 indicates the launch and end mission dates of the major SAR sensors from 1990 until present. The steps for the years are two and the odd years are in the middle.
Figure 9 and Figure 10 demonstrate that C-band is most frequently used (82 studies) in wetland studies, potentially due to the availability of a greater number of satellites operating at C-band [55,85,88,89]. Moreover, Figure 9 also shows that of these 82 C-band studies, 32 studies applied RADARSAT-2 and 11 used RADARSAT-1 data. Other C-band studies used Envisat-ASAR (16 studies), ERS-1 and 2 (7 studies) and Sentinel-1 (5 studies) data. The lower usage of the Sentinel-1 (a and b) data are likely related to the more recent launch date (2014). L-band is the second most used frequency band, with 39 studies employing L-band in their analysis, which is approximately half the use of the C-band [90]. Among the current sensors operating in L-band, ALOS-PALSAR (24 studies) and JESR (6 studies) were the most applied in wetland studies [56,58,70,91,92,93,94,95,96,97,98,99]. Data from TerraSAR-X was applied in the 11 X-band studies. Due to low penetration in vegetation, X-band is used less than other frequency bands [100]. However, due to the 11 day revisit cycle and unprecedented resolution (up to 1 m) of TerraSAR-X it can be a valuable complementary data [17]. As outlined earlier, the trend of using multi frequency SAR datasets is spiraling upwards. Among them, a combination of L and C bands (19 studies) is the most common, as this combination provides a well-balanced compromise of penetration and unambiguous scattering mechanisms. There were five studies in the literature that combined all three bands (X + L + C) bands. Two studies used the integration of X and C and three studies used the integration of X and L bands. Finally, 11 studies used a combination of different C-band SAR sensors, such as the integration of RADARSAT-2 and Sentinel-1.
Figure 11 quantitatively illustrates the different information extracted from SAR data, namely backscattering intensity [101], interferometric phase (InSAR) and PolSAR information. Intensity (in dB) is the most common measurement directly acquired from the SAR data. A total of 94 studies (55%) used intensity for their analysis. One of the applications of using intensity is landcover type identification using a conventional gray level thresholding [102]. The availability of advanced polarimetric SAR sensors has also led to growing interest in using polarimetric data for wetland mapping [103]. From all screened studies, 49 articles used single polarization, of which 31 of them were horizontally transmitted and horizontally received (HH) polarization and 18 were vertically transmitted and vertically received (VV) polarization. A total of 42 and 73 articles, utilized dual or quad polarizations, respectively. By narrowing our focus to 52 studies (30%) that used polarimetric information, our analysis showed that these studies either used quad—(34 studies) or dual—(18 studies) polarization. Twenty-six InSAR studies applied these data for wetland water level monitoring. Notably, there were only 3 studies that used the compact polarimetry configuration.
We divided applications of SAR wetland mapping into six groups (Figure 12). Most studies were conducted for wetland mapping (84 studies), water level monitoring (27 studies) or change detection (25 studies). Wetland mapping includes classification and monitoring of wetlands, where the main goal is to produce a wetland map [91]. The water-level monitoring studies were mostly conducted in coastal wetlands, where the InSAR technique was particularly used. In change detection studies, spatiotemporal changes of wetland dynamics can be monitored using annual or seasonal time–series analysis. We identified 18 studies that used SAR data for inundation mapping (water extraction) within wetlands, wherein a threshold on radar backscatter was used to extract water bodies [104]. SAR data were also found to be useful for biomass estimation of wetlands in 12 studies, indicating the sensitivity of the SAR signal to vegetation canopy biomass. The smallest focus area were studies that used SAR data for soil moisture within wetland ecosystems (six studies). In these studies, the dielectric properties of backscatter and polarimetric information are used to estimate water content [105].
We summarized overall accuracy for the 42 articles that reported a classification scheme and investigated SAR specifications pertaining to the collected overall accuracies. In particular, to examine how the selection of different frequency bands may impact overall accuracy, the box-and-whisker plots were used to summarize difference in accuracy across different bands (Figure 13). In the single frequency studies, X-band had the highest overall accuracy. This may be due to the fact that most X-band sensors have relatively high spatial resolution. Notably, the highest median in the multi frequency studies was obtained when three SAR frequencies (i.e., X, C and L-bands) were combined.
The ability of SAR data collected from different sensors to classify wetland complexes is depicted using box-and-whisker plots in Figure 14. This figure contains the most frequent SAR sensors used for classifying wetlands and shows that data collected from Radarsat-2 and ERS have the highest and lowest variability in overall accuracy, respectively. Notably, the median value of the overall accuracy for TerraSAR-X/Tandem-X and Sentinel-1 is the highest among all sensors, while the median for the Envisat-ASAR is the lowest.
Figure 15 highlights the effect of the SAR configuration on wetland classification accuracy. The median overall accuracy value is slightly higher for multi-frequency SAR data compared to single frequency, but the differences are not large compared to the range in accuracy values. The median value of the overall accuracy for wetland classification is higher for multitemporal data compared to single date datasets. The variable incidence angle grouping shows studies with images acquired with different views from the same site at approximately the same date. As shown, the median value of the overall accuracy for variable incidence angle is slightly greater than single incidence angle data, though the range in values remains similar.
In Figure 16, we divided resolution into three categories—high, medium and low—to examine the correlation between resolution and overall accuracy obtained. This figure shows higher median overall accuracy for high resolution data compared to the other categories. The range of the medium resolution data are the greatest while the low-resolution has the least variability in overall accuracy. One reason for the high range in the medium resolution is likely the wider availability of medium resolution SAR datasets, which facilitates researchers developing methods with medium resolution data.
For water level monitoring the unit for accuracy assessment is root mean square in cm and it is different from classification (OA). For this reason, a separate boxplot was generated for this application (Figure 17). While some configurations did appear to impact accuracy—i.e., multiple vs. single frequency and multiple vs. single polarization—the use of multiple incidence angles did not seem to impact accuracy in water level monitoring. Since InSAR techniques do not use polarimetric information, the applicability of PolSAR data in this application is limited. Most water-level monitoring studies applied algorithms based on single polarization datasets, which leads to the observation noted above that single polarized datasets tend to have more accurate results than the less frequently applied multiple-polarization studies. Likewise, since there is less need for different penetration depth in monitoring coastal areas, the developed methods are mostly applied in the single frequency datasets, so multiple frequency studies are less developed. Based on our collected articles, more investigation is needed to understand the effect of multiple SAR configurations on accuracy of water level monitoring studies.
4. Discussion
4.1. SAR Incidence Angle and Wetland Monitoring
Generally, shallow incident angles produce more signal interaction and less penetration [106]. However, steep incidence angles are preferred to maximize penetration [107]. The complexity of the relationship between incidence angle and environmental conditions is considered a result of a change in the backscatter mechanism [102]. For mapping water bodies, a shallow incidence angle will better distinguish specular backscatter from double-bounce and volume scattering mechanisms. However, for discriminating between non-flooded and flooded vegetation, steep incidence angles are preferred [95]. This is because the interaction between surface water and tree trunks will be augmented due to the shorter path of radar signal in the steeper incidence angle. However, shallow incidence angles are more influenced by interaction with a crown layer [41,108]. For monitoring mangrove forests, Henderson and Lewis (2008) reported that steep incidence angles are more appropriate. For water level monitoring using InSAR, steep incidence angles are expected to be more applicable [93,109]. As such, depending on the selected incidence angle, different surface roughness should be expected. A surface can appear rough in a steep incidence angle and smooth in a shallow incidence angle. As a result, the smoother the surface the darker it appears in the SAR image. Dabboor and Brisco (2018) pointed out that there is a direct link between incidence angle and signal attenuation, with more signal attenuation expected at shallow incidence angles [102]. Moreover, according to Hess et al. (1990), data with multiple incidence angles can improve the discrimination of forest structure. In tropical forests where specular reflectors prevail, multiple incidence angles offer unique information for wetland monitoring [35]. Marti-Cardona et al. (2010) investigated the effect of using multi-incidence angle data for monitoring flood extent using ASAR/Envisat images at different incidence angles. Their results revealed that the integration of different incidence angles with a short temporal baseline provided optimum flood mapping [28].
4.2. SAR Wavelength and Wetland Monitoring
Among L, C and X-bands, L-band with the longest wavelength (23.5 cm) has the deepest penetration depth, enabling it to detect water beneath flooded trees and penetrate dense vegetation [110,111]. Ott et al. (1990) pointed out that L-band data are more sensitive to plant water content and biomass [112]. Although mapping mangrove forests reported to be challenging [92,113], several studies showed that L-band enhances the accuracy of mangrove forest mapping [13,56]. In addition, the L-band is able to improve the saturation point in biomass estimation of vegetation [114]. Saturation causes different levels of distortion in SAR imagery. Notably, due to the deeper penetration of L-band, the scatter phase centers are more stable, thus, better coherence is obtained [109]. In the study conducted in southern Florida, L-band data were used to monitor the water level changes. Despite the low temporal resolution of the dataset, water levels were monitored over a 4 year period with cm level accuracy [93]. Additionally, although C-band has shorter wavelength (5.66 cm) and less penetration, numerous studies have demonstrated an increase in backscatter in cases of flooded vegetation [41,111,115], C-band RADARSAT-2 data have proven to be highly sensitive to plant structural parameters [38,39,49,91,108,116,117,118]. In particular, in wetlands where the density of herbaceous vegetation is low, vertically polarized C-band data achieved good classification accuracy [119]. Notably, although C-band is less coherent for monitoring water level, it is less impacted by ionospheric effects and atmospheric artifacts [37]. Brisco et al. (2015) noted that C-band interferometric coherence was better preserved for images with high spatial resolution and small incidence angle [39]. X-band has some limitation that has restricted its application. To elaborate, X-band imagery cannot always reach the water surface in the case of salt marshes or flooded vegetation [120]. This is because X-band often interacts with the highest part of the vegetation canopy, which is more affected by wind, resulting in less coherent interferograms.
The integration of different SAR frequency bands is expected to enhance the accuracy of land cover classification [91]. According to Figure 10 the combination of L- and C-band had the largest number of studies [33,95,121]. Plank et al. (2017) fused C- and L-band data for mapping flooded vegetation [95]. Based on their study, C-band turned out to be better suited for mapping open water areas, while L-band provided more detailed information on flooded vegetation. In another study, Kim et al. (2009), integrated C- and L-band data to retrieve the absolute water level in Louisiana, USA. They integrated InSAR with Envisat altimeter data and validated the result with in situ gauge observation [37]. Mohammadimanesh et al. (2018) also combined L-, C- and X-bands for statistical analysis of SAR intensity and coherence variation in Newfoundland, Canada. They showed that temporal baseline is the most influential factor in maintaining coherence. Moreover, the X-band data had higher coherence than C-band in interferometric pairs with smaller temporal baselines [122].
4.3. SAR Polarization and Wetland Monitoring
HH polarized imagery is less attenuated by the vertical structure of wetland compared to VV polarized imagery. Due to the sensitivity of HH polarization to double-bounce scattering, it is more applicable for forested wetlands. Brisco et al. (2009) found that HH polarization generally yields the highest contrast between upland and open water [116]. One of the drawback of the VV polarization is that it may not reach the water surface beneath the vegetation cover because of its vertical orientation [123,124]. According to Zhang et al. (2016), VV polarization highlights water surface roughness effects through the interaction of the capillary waves which makes it less favorable for wetlands studies [119]. However, the full analytical power of SAR imagery is not achievable without full-polarimetric SAR images [28,45,50,95,125,126]. Full polarimetric SAR data maintains the phase and enables the detection of different backscattering mechanisms. Decompositions of full polarimetric SAR imagery divide the backscattered signal into different backscattering mechanisms. The main objective of polarimetric decomposition is to assign a physical scattering mechanism to each component. Generally, there are two types of decomposition: coherent and incoherent. The former is based on coherent decomposition of scattering matrix. Since this type of decomposition is vulnerable to high speckle noise, it is infrequently applied in wetlands. Incoherent decomposition is more applicable for distributed targets, such as vegetation in wetlands. There are several incoherent decompositions reported in the literature with freeman–Durden [127], Claude-Pottier [51], Yamaguchi [50] and Touzi [128,129], among the more frequently used. In these decompositions, the SAR data are classified in three classes: surface or Bragg scattering that corresponds to the water or bare surfaces; double bounce that corresponds to the tree trunk and adjacent water; and volume scattering that corresponds to dense vegetation such as swamp in wetlands [122]. In a study by Mahdianpari et al. (2017) Cloude–Pottier, Freeman–Durden and Yamaguchi decompositions were applied to RADARSAT-2 data. The extracted features from these decompositions were imported to a three-level object-based random forest classifier. Their results demonstrated that polarimetric features can significantly enhance the overall accuracy of the classification [96].
4.4. SAR and Wetland Monitoring Applications
Most of the wetland studies used SAR to classify and map wetlands [130]. Classification algorithms are generally divided into two groups: unsupervised and supervised. ISODATA and K-means [131] are examples of unsupervised classification methods, while maximum likelihood classification [44,110], support vector machine [132] and object-based random forest [45,52,96,122,133,134,135] are supervised techniques. Unsupervised classification techniques are mostly used for classification of land cover types using optical imagery [131,136,137]. In wetland studies, supervised classification techniques are preferred given the high similarity between different wetland’s classes. The availability of machine learning techniques has enabled analyzing of large-volume earth observation data [138,139]. One of the advantages of machine learning classifiers is that input data are not limited to a normal distribution [140]. SVM does use a large number of parameters and the appropriate selection of these parameters makes SVM more challenging to implement [140]. RF, on the other hand, has less parameters to be set which makes it more practical. Another advantage of RF is that it is insensitive to noise [96,133]. Deep learning techniques, such as convolutional neural network (CNN) are another example of supervised classification technique. This technique has the advantage of versatility and adaptability; deep learning classifiers can use the spectral and spatial information taken directly from an image as training [141,142]. Furthermore, due to increasing trend in loosing wetlands adopting different techniques to detect and interpret changes in wetland’s dynamic ecosystems is essential [143,144,145,146]. Changes in wetlands alter the surface being illuminated by the SAR signal and consequently change the image intensity or backscattering mechanism. The final outcome of intensity based change detection technique is calculated by differencing before and after phenomena image pixels [147]. As mentioned, a change in the backscattering mechanism can be considered as an indicator of change in the surface type. As a case in point, when a wet soil turns into an open water body the backscattering mechanism changes from surface scattering to specular scattering [30]. If the wetland surface is more complex, polarimetric features can be used as an input to object-based classification [8,111].
Hydrological dynamics refers to all the changes related to water level, soil moisture and above ground biomass [148]. Lang et al. (2008) used C-band single polarization to investigate the monitoring levels of inundation and soil moisture in the mid-Atlantic floodplain region. They concluded VV polarization data are better to use in the leaf-off season and HH is more efficient for forested hydrological application [41]. Eco-hydrology of inland wetlands in Africa was investigated using L-band SAR data by Rebelo et al. (2010). They used principal component analysis and decision tree classifier to monitor the temporal changes of hydrological dynamics. Their results provided some insight on the use of the high temporal resolution L-band SAR data for monitoring dynamic hydrologic of wetlands [27]. Notably, although wetland InSAR techniques are not limited to water level monitoring, these techniques are mostly used for this purpose in wetlands studies [149,150]. InSAR is able to measure water level changes at the cm level [69,109,151,152]. Hong et al. (2010) used L-band SAR data in the Amazon Basin for water level monitoring [68]. According to this study, due to the incoherent nature of water bodies the phase coherency cannot be retrieved using interferometric techniques. However, phase coherency is relatively higher in the inundated shrubs and flooded vegetation due to double bounce scattering [153]. One of the factors that affects the accuracy in water level monitoring is wavelength [37]. Using L-band SAR data, 3–5 cm accuracy is attainable [93,151]; however, the accuracy with C-band SAR data are about 6–7 cm. Although InSAR techniques are proven for water level monitoring, independent sources of auxiliary data are required to validate the InSAR results [151]. RADAR altimetry data are a good alternative for ground-based water level gauges as auxiliary data [151,154,155]. However, altimetry data are not always synchronized with the InSAR observations [156].
Biomass estimation can be considered as an excellent indicator of methane emission, biodiversity and Carbone stock [157,158]. Liao et al. (2013) estimated the biomass of the Poyang Lake using a neural network technique. They tested the ability of radiative transfer and Michigan Microwave Canopy Scattering model for estimating biomass [73]. In another study, mangrove biomass was estimated using a regression model and genetic algorithm [71]. Le et al. (2007) found that the side-looking geometry and high spatial resolution of RADARSAT-2 led to more accurate mangrove biomass estimation [71]. In another study, Lee et al. (2015) applied the combination of polarimetric and interferometric (PolInSAR) techniques to estimate mangrove canopy height using TanDEM-X data [72]. The inversion results in their study were validated against airborne LiDAR measurements. Different forms of radiative transfer models were developed to investigate sparse vegetation structure and canopy composition [159]. These models are initially designed to analyze the SAR backscatter sensitivity of the tree canopy composition and investigate the temporal variability of backscatter. In the study of Dobson et al. (1995) changes in the backscattering coefficients in forests were introduced as a function of structural properties of the canopy [160]. Townsend et al. (2002) used ERS-1, JERS and RADARSAT for estimating biophysical characteristics of wetlands. They demonstrated that forest structure can be more accurately estimated in flooded areas due to less variability of the underlying surface [121].
Soil moisture estimation is another application of SAR imagery for monitoring wetlands [161]. Water content of a target can be retrieved using SAR data due to the sensitivity of the SAR signal to dielectric properties of the target. There are three common inversion techniques for soil moisture estimation in wetland complexes: empirical, semi-empirical and physically based models [125,161]. Millard et al. (2018) developed an empirical model to estimate soil moisture in a peatland [125]. They used C-band SAR imagery along with LiDAR derived vegetation density. The LiDAR vegetation density explained the high degree of variance in the SAR data. According to Baghdadi et al. (2010, 2012), X-band data were better able to retrieve soil moisture than C-band in bare vegetated area [162,163]. Dabrowska-Zielinska et al. (2016) developed models for soil moisture assessment under different vegetation types with VH polarization of Sentinel-1 data [164]. Notably, SAR sensors also demonstrate potential for surface inundation mapping in different studies [34,165,166,167,168].
4.5. SAR Sensors and Wetland Monitoring
Figure 10 shows that TerraSAR-X can be consider as a useful tool for wetland monitoring [44,69,106]. The critical value of TerraSAR-X comes from the fact that this sensor is highly sensitive to soil moisture and surface roughness. In particular, it is more applicable for monitoring sparse marshes and bare vegetation [120]. Quad polarization data from this sensor has only recently been released and thus there has not been an opportunity to see this reported in previous research. Additionally, the high temporal (5 days revisit-cycle) and spatial resolution (10-m) of C-band Sentinel-1 data from the Copernicus mission (European Space Agency 2014) make it suitable for frequent monitoring of wetlands [24,95,133,164,169,170,171,172,173,174]. DeLancey et al. (2018) used multitemporal Sentinel-1 for surface inundation mapping and found that Sentinel-1 is an ideal sensor for tracking fluctuations in Alberta waterbody extent [170]. Moreover, the new compact polarization transmits a circularly polarized wave and receives on linear horizontal and vertical planes. The Canadian RADARSAT Constellation Mission (RCM) is equipped with this configuration [46]. Compared to the RADARSAT-2, compact polarimetric RCM data have a wider coverage, which decreases the revisit time (4 days) [175]. Both RADARSAT-2 and RCM offer a wide range of beam modes, which make them suitable for wetland monitoring [45]. In the study implemented by Mahdianpari et al. (2017) different polarization modes from RADARSAT-2 and simulated RCM were compared to assess their ability for wetland classification. Their results revealed that full polarimetric SAR data provided better classification accuracy than dual and compact polarimetry [45].
The recent partnership of National Aeronautics and Space Administration (NASA) and Indian Space Research Organization (ISRO) has led to the development of a multi-frequency SAR satellite called NISAR [176,177,178,179,180]. Operating in both L-band (NASA) and S-band (ISRO), NISAR is expected to provide information for biomass estimation. The L-band sensor with low temporal decorrelation and foliage penetration is an ideal tool for dense vegetation monitoring in wetlands, while the S-band is appropriate for sparse vegetation monitoring such as young salt marshes. The revisit-time for this satellite is 12 days; however, by considering both ascending and descending orbits the revisit-time reduces to six days.
5. Conclusions
The careful review of 172 indexed research papers published in the last three decades shows the upward trend of wetland mapping using SAR techniques. This meta-analysis gathered the most recent studies in wetland mapping to provide a statistical analysis of recent trends in SAR wetland monitoring. The unique capability and availability of SAR sensors combined with exploitation of advanced techniques, such as signal processing, advanced the monitoring of wetlands. Based on our founding, USA, Canada and China are countries with the largest number wetland monitoring studies using SAR data. In terms of wavelength, most studies have used C-band SAR imagery. Within multi-frequency studies, the combination of L- and C-band is most frequently applied, though fusion of all three bands provides the highest accuracy. From wetland’s application perspective, most of studies have focused on wetland mapping using SAR imagery. This can be due to the fact that SAR has promising capability for distinguishing different wetland types.
In the current era with the present of free and open-access SAR imagery, the number of wetlands studies has consistently increased. Our findings document a big jump in the number of studies between 2012 and 2013, which corresponds to both the availability of SAR datasets as well as the high demand for wetland evaluation. Additionally, the future availability of SAR imageries, such as multi-frequency NISAR and RCM data, would further increase the number of wetlands studies using SAR imagery. Recently, the trend of applying multitemporal, multi-frequency and multi-incidence angle SAR imagery illustrate a higher overall accuracy in classification compared to single channel configurations.
In near future, an increasing trend in using cloud computing platforms, such as Google Earth Engine, NASA Earth Exchange and Amazon’s Web Services, is anticipated for monitoring wetlands at a larger scale. These cloud computing platforms would facilitate analyzing and manipulating tremendous volume of earth observation data in national and regional scales. Machine-learning and deep learning techniques have already settled in wetland monitoring studies and may continue to be more present in the near future given their ability for analyzing diverse and high-dimensional SAR imagery.
Author Contributions
Conceptualization, B.S., M.M.; Supervision, B.S., M.M.; Formal Analysis, S.A., M.M.; Data Collection, S.A.; Visualization, S.A., M.M.; Writing—Original Draft Preparation, S.A., M.M.; Writing—Review & Editing, S.A., B.S., M.M., L.J.Q., B.B., H.T., and S.S.; All authors have read and agreed to the published version of the manuscript.
Funding
This research received no external funding.
Acknowledgments
The financial support was partly provided through the Environment Data Science Initiative of Discovery Challenge Seed Grant at SUNY-ESF. The authors gratefully acknowledge this support.
Conflicts of Interest
The authors declare no conflict of interest.
References
- Millennium Ecosystem Assessment (Program) (Ed.) Ecosystems and Human Well-Being: Wetlands and Water Synthesis: A Report of the Millennium Ecosystem Assessment; World Resources Institute: Washington, DC, USA, 2005; ISBN 978-1-56973-597-8. [Google Scholar]
- Bourgeau-Chavez, L.L.; Kasischke, E.S.; Brunzell, S.M.; Mudd, J.P.; Smith, K.B.; Frick, A.L. Analysis of space-borne SAR data for wetland mapping in Virginia riparian ecosystems. Int. J. Remote Sens. 2001, 22, 3665–3687. [Google Scholar] [CrossRef]
- Li, J.; Chen, W.; Touzi, R. Optimum RADARSAT-1 configurations for wetlands discrimination: A case study of the Mer Bleue peat bog. Can. J. Remote Sens. 2007, 33, S46–S55. [Google Scholar] [CrossRef]
- Jaramillo, F.; Brown, I.; Castellazzi, P.; Espinosa, L.; Guittard, A.; Hong, S.-H.; Rivera-Monroy, V.H.; Wdowinski, S. Assessment of hydrologic connectivity in an ungauged wetland with InSAR observations. Environ. Res. Lett. 2018, 13, 024003. [Google Scholar] [CrossRef]
- Costanza, R.; d’Arge, R.; de Groot, R.; Farber, S.; Grasso, M.; Hannon, B.; Limburg, K.; Naeem, S.; O’Neill, R.V.; Paruelo, J.; et al. The value of the world’s ecosystem services and natural capital. Nature 1997, 387, 253–260. [Google Scholar] [CrossRef]
- Riley, W.J.; Subin, Z.M.; Lawrence, D.M.; Swenson, S.C.; Torn, M.S.; Meng, L.; Mahowald, N.M.; Hess, P. Barriers to predicting changes in global terrestrial methane fluxes: Analyses using CLM4Me, a methane biogeochemistry model integrated in CESM. Biogeosciences 2011, 8. [Google Scholar] [CrossRef] [Green Version]
- Morrissey, L.A.; Livingston, G.P.; Durden, S.L. Use of SAR in regional methane exchange studies. Int. J. Remote Sens. 1994, 15, 1337–1342. [Google Scholar] [CrossRef] [Green Version]
- Schmitt, A.; Brisco, B. Wetland Monitoring Using the Curvelet-Based Change Detection Method on Polarimetric SAR Imagery. Water 2013, 5, 1036–1051. [Google Scholar] [CrossRef]
- Cowardin, L.M.; Carter, V.; Golet, F.C.; LaRoe, E.T. Classification of Wetlands and Deepwater Habitats of the United States; U.S. Department of the Interior, U.S. Fish and Wildlife Service: Hoboken, NJ, USA, 1979.
- Dahl, T.E.; Johnson, C.E. Wetlands, Status and Trends in the Conterminous United States, Mid-1970′s to Mid-1980′s: First Update of the National Wetlands Status Report; U.S. Department of the Interior, Fish and Wildlife Service: Washington, DC, USA, 1991; ISBN 978-0-16-035916-3.
- Adam, E.; Mutanga, O.; Rugege, D.; Ismail, R. Field Spectrometry of Papyrus Vegetation (Cyperus papyrus L.) in Swamp Wetlands of St Lucia, South Africa; IEEE: Piscataway, NJ, USA, 2009; Volume 4, pp. 260–263. [Google Scholar]
- Kaplan, G.; Avdan, U. Monthly Analysis of Wetlands Dynamics Using Remote Sensing Data. ISPRS Int. J. Geo-Inf. 2018, 7, 411. [Google Scholar] [CrossRef] [Green Version]
- Souza-Filho, P.W.M.; Paradella, W.R.; Rodrigues, S.W.P.; Costa, F.R.; Mura, J.C.; Gonçalves, F.D. Discrimination of coastal wetland environments in the Amazon region based on multi-polarized L-band airborne Synthetic Aperture Radar imagery. Estuar. Coast. Shelf Sci. 2011, 95, 88–98. [Google Scholar] [CrossRef]
- Mitchard, E.T.A.; Saatchi, S.S.; White, L.J.T.; Abernethy, K.A.; Jeffery, K.J.; Lewis, S.L.; Collins, M.; Lefsky, M.A.; Leal, M.E.; Woodhouse, I.H.; et al. Mapping tropical forest biomass with radar and spaceborne LiDAR in Lope National Park, Gabon: Overcoming problems of high biomass and persistent cloud. Biogeosciences 2012, 9, 179–191. [Google Scholar] [CrossRef] [Green Version]
- Zhao, J.; Niu, Y.; Lu, Z.; Yang, J.; Li, P.; Liu, W. Applicability Assessment of Uavsar Data in Wetland Monitoring: A Case Study of Louisiana Wetland. ISPRS Int. Arch. Photogramm. Remote Sens. Spat. Inf. Sci. 2018, XLII-3, 2375–2378. [Google Scholar] [CrossRef] [Green Version]
- Hensley, S.; Wheeler, K. The UAVSAR instrument: Description and first results. In Proceedings of the 2008 IEEE Radar Conference, Rome, Italy, 26–30 May 2008; pp. 1–6. [Google Scholar]
- Wohlfart, C.; Winkler, K.; Wendleder, A.; Roth, A. TerraSAR-X and Wetlands: A Review. Remote Sens. 2018, 10, 916. [Google Scholar] [CrossRef] [Green Version]
- Glenn, N.F.; Neuenschwander, A.; Vierling, L.A.; Spaete, L.; Li, A.; Shinneman, D.J.; Pilliod, D.S.; Arkle, R.S.; McIlroy, S.K. Landsat 8 and ICESat-2: Performance and potential synergies for quantifying dryland ecosystem vegetation cover and biomass. Remote Sens. Environ. 2016, 185, 233–242. [Google Scholar] [CrossRef]
- Xing, L.; Tang, X.; Wang, H.; Fan, W.; Gao, X. Mapping Wetlands of Dongting Lake in China Using Landsat and Sentinel-1 Time Series at 30M. ISPAr 2018, 42, 1971–1976. [Google Scholar] [CrossRef] [Green Version]
- Swatantran, A.; Tang, H.; Barrett, T.; DeCola, P.; Dubayah, R. Rapid, High-Resolution Forest Structure and Terrain Mapping over Large Areas using Single Photon Lidar. Sci. Rep. 2016, 6, 28277. [Google Scholar] [CrossRef] [Green Version]
- van Deventer, H.; Cho, M.A.; Mutanga, O. Multi-season RapidEye imagery improves the classification of wetland and dryland communities in a subtropical coastal region. ISPRS J. Photogramm. Remote Sens. 2019, 157, 171–187. [Google Scholar] [CrossRef]
- Ávila, D.M.; Barrera, V.C.S.; Lara, Z.M. Spatio-temporal modelling of wetland ecosystems using Landsat time series: Case of the Bajo Sinú Wetlands Complex (BSWC)– Córdoba– Colombia. Ann. GIS 2019, 25, 231–245. [Google Scholar] [CrossRef] [Green Version]
- Frohn, R.C.; Autrey, B.C.; Lane, C.R.; Reif, M. Segmentation and object-oriented classification of wetlands in a karst Florida landscape using multi-season Landsat-7 ETM+ imagery. Int. J. Remote Sens. 2011, 32, 1471–1489. [Google Scholar] [CrossRef]
- Kaplan, G.; Avdan, U. Evaluating the utilization of the red edge and radar bands from sentinel sensors for wetland classification. CATENA 2019, 178, 109–119. [Google Scholar] [CrossRef]
- Salvia, M.; Mariano, F.; Francisco, G.; Perna, P.; Martino, R.; Haydee, K.; Ferrazzoli, P. Estimating Flow Resistance of Wetlands Using SAR Images and Interaction Models. Remote Sens. 2009, 1, 992–1008. [Google Scholar] [CrossRef] [Green Version]
- Touzi, R.; Omari, K.; Sleep, B.; Jiao, X. Scattered and Received Wave Polarization Optimization for Enhanced Peatland Classification and Fire Damage Assessment Using Polarimetric PALSAR. IEEE J. Sel. Top. Appl. Earth Obs. Remote Sens. 2018, 11, 4452–4477. [Google Scholar] [CrossRef]
- Rebelo, L.-M. Eco-Hydrological Characterization of Inland Wetlands in Africa Using L-Band SAR. IEEE J. Sel. Top. Appl. Earth Obs. Remote Sens. 2010, 3, 554–559. [Google Scholar] [CrossRef]
- Marti-Cardona, B.; Lopez-Martinez, C.; Dolz-Ripolles, J.; Bladè-Castellet, E. ASAR polarimetric, multi-incidence angle and multitemporal characterization of Doñana wetlands for flood extent monitoring. Remote Sens. Environ. 2010, 114, 2802–2815. [Google Scholar] [CrossRef]
- Engheta, N.; Elachi, C. Radar Scattering from a Diffuse Vegetation Layer over a Smooth Surface. IEEE Trans. Geosci. Remote Sens. 1982, GE-20, 212–216. [Google Scholar] [CrossRef]
- Kwoun, O.-I.; Lu, Z. Multi-temporal RADARSAT-1 and ERS backscattering signatures of coastal wetlands in southeastern Louisiana. Photogramm. Eng. Remote Sens. 2009, 75, 11. [Google Scholar] [CrossRef]
- Yamagata, Y.; Yasuoka, Y. Classification of wetland vegetation by texture analysis methods using ERS-1 and JERS-1 images. In Proceedings of the IGARSS ’93—IEEE International Geoscience and Remote Sensing Symposium, Tokyo, Japan, 18–21 August 1993; Volume 4, pp. 1614–1616. [Google Scholar]
- Wang, Y.; Allen, T. Estuarine shoreline change detection using Japanese ALOS PALSAR HH and JERS-1 L-HH SAR data in the albemarle-pamlico sounds, north carolina, USA. Int. J. Remote Sens. 2008, 29, 4429–4442. [Google Scholar] [CrossRef]
- Costa, M.P.F.; Niemann, O.; Novo, E.; Ahern, F. Biophysical properties and mapping of aquatic vegetation during the hydrological cycle of the Amazon floodplain using JERS-1 and Radarsat. Int. J. Remote Sens. 2002, 23, 1401–1426. [Google Scholar] [CrossRef]
- Hess, L.L.; Melack, J.M.; Affonso, A.G.; Barbosa, C.; Gastil-Buhl, M.; Novo, E.M.L.M. Wetlands of the Lowland Amazon Basin: Extent, Vegetative Cover, and Dual-season Inundated Area as Mapped with JERS-1 Synthetic Aperture Radar. Wetlands 2015, 35, 745–756. [Google Scholar] [CrossRef]
- Hess, L.L.; Melack, J.M.; Simonett, D.S. Radar detection of flooding beneath the forest canopy: A review. Int. J. Remote Sens. 1990, 11, 1313–1325. [Google Scholar] [CrossRef]
- Wang, Y.; Hess, L.L.; Filoso, S.; Melack, J.M. Understanding the radar backscattering from flooded and nonflooded Amazonian forests: Results from canopy backscatter modeling. Remote Sens. Environ. 1995, 54, 324–332. [Google Scholar] [CrossRef]
- Kim, J.-W.; Lu, Z.; Lee, H.; Shum, C.K.; Swarzenski, C.M.; Doyle, T.W.; Baek, S.-H. Integrated analysis of PALSAR/Radarsat-1 InSAR and ENVISAT altimeter data for mapping of absolute water level changes in Louisiana wetlands. Remote Sens. Environ. 2009, 113, 10. [Google Scholar] [CrossRef]
- Arzandeh, S.; Wang, J. Texture evaluation of RADARSAT imagery for wetland mapping. Can. J. Remote Sens. 2002, 28, 653–666. [Google Scholar] [CrossRef]
- Brisco, B.; Murnaghan, K.; Wdowinski, S.; Hong, S.-H. Evaluation of RADARSAT-2 Acquisition Modes for Wetland Monitoring Applications. Can. J. Remote Sens. 2015, 41, 431–439. [Google Scholar] [CrossRef]
- Morandeira, N.S.; Grings, F.; Facchinetti, C.; Kandus, P. Mapping Plant Functional Types in Floodplain Wetlands: An Analysis of C-Band Polarimetric SAR Data from RADARSAT-2. Remote Sens. 2016, 8, 174. [Google Scholar] [CrossRef] [Green Version]
- Lang, M.W.; Kasischke, E.S. Using C-Band Synthetic Aperture Radar Data to Monitor Forested Wetland Hydrology in Maryland’s Coastal Plain, USA. IEEE Trans. Geosci. Remote Sens. 2008, 46, 535–546. [Google Scholar] [CrossRef]
- Widhalm, B.; Bartsch, A.; Heim, B. A novel approach for the characterization of tundra wetland regions with C-band SAR satellite data. Int. J. Remote Sens. 2015, 36, 5537–5556. [Google Scholar] [CrossRef] [PubMed] [Green Version]
- Pulvirenti, L.; Pierdicca, N.; Chini, M.; Guerriero, L. Monitoring Flood Evolution in Vegetated Areas Using COSMO-SkyMed Data: The Tuscany 2009 Case Study. IEEE J. Sel. Top. Appl. Earth Obs. Remote Sens. 2013, 6, 1807–1816. [Google Scholar] [CrossRef]
- Betbeder, J.; Rapinel, S.; Corgne, S.; Pottier, E.; Hubert-Moy, L. TerraSAR-X dual-pol time-series for mapping of wetland vegetation. ISPRS J. Photogramm. Remote Sens. 2015, 107, 90–98. [Google Scholar] [CrossRef] [Green Version]
- Mahdianpari, M.; Salehi, B.; Mohammadimanesh, F.; Brisco, B. An assessment of simulated compact polarimetric SAR data for wetland classification using random Forest algorithm. Can. J. Remote Sens. 2017, 43, 468–484. [Google Scholar] [CrossRef]
- Mahdianpari, M.; Mohammadimanesh, F.; McNairn, H.; Davidson, A.; Rezaee, M.; Salehi, B.; Homayouni, S. Mid-season Crop Classification Using Dual-, Compact-, and Full-Polarization in Preparation for the Radarsat Constellation Mission (RCM). Remote Sens. 2019, 11, 1582. [Google Scholar] [CrossRef] [Green Version]
- Mohammadimanesh, F.; Salehi, B.; Mahdianpari, M.; Brisco, B.; Gill, E. Full and simulated compact polarimetry sar responses to canadian wetlands: Separability analysis and classification. Remote Sens. 2019, 11, 516. [Google Scholar] [CrossRef] [Green Version]
- Bartsch, A.; Kidd, R.A.; Pathe, C.; Scipal, K.; Wagner, W. Satellite radar imagery for monitoring inland wetlands in boreal and sub-arctic environments. Aquat. Conserv. Mar. Freshw. Ecosyst. 2007, 17, 305–317. [Google Scholar] [CrossRef]
- Rio, J.N.R.; Lozano-Garcia, D.F. Spatial filtering of radar data (RADARSAT) for wetlands (brackish marshes) classification. Remote Sens. Environ. 2000, 73, 143–151. [Google Scholar] [CrossRef]
- Ainsworth, T.L.; Kelly, J.P.; Lee, J.-S. Classification comparisons between dual-pol, compact polarimetric and quad-pol SAR imagery. ISPRS J. Photogramm. Remote Sens. 2009, 64, 464–471. [Google Scholar] [CrossRef]
- Lee, J.S.; Grunes, M.R.; Ainsworth, T.L.; Du, L.J.; Schuler, D.L.; Cloude, S.R. Unsupervised classification using polarimetric decomposition and the complex Wishart classifier. IEEE Trans. Geosci. Remote Sens. 1999, 37, 2249–2258. [Google Scholar] [CrossRef]
- Zhang, M.; Chen, F.; Tian, B.; Liang, D. Multi-temporal SAR image classification of coastal plain wetlands using a new feature selection method and random forests. Remote Sens. Lett. 2019, 10, 312–321. [Google Scholar] [CrossRef]
- Pistolesi, L.I.; Ni-Meister, W.; McDonald, K.C. Mapping wetlands in the Hudson Highlands ecoregion with ALOS PALSAR: An effort to identify potential swamp forest habitat for golden-winged warblers. Wetl. Ecol. Manag. 2015, 23, 95–112. [Google Scholar] [CrossRef]
- Lönnqvist, A.; Rauste, Y.; Molinier, M.; Häme, T. Polarimetric SAR Data in Land Cover Mapping in Boreal Zone. IEEE Trans. Geosci. Remote Sens. 2010, 48, 3652–3662. [Google Scholar] [CrossRef]
- Koch, M.; Schmid, T.; Reyes, M.; Gumuzzio, J. Evaluating Full Polarimetric C- and L-Band Data for Mapping Wetland Conditions in a Semi-Arid Environment in Central Spain. IEEE J. Sel. Top. Appl. Earth Obs. Remote Sens. 2012, 5, 1033–1044. [Google Scholar] [CrossRef]
- de Souza Pereira, F.R.; Kampel, M.; Cunha-Lignon, M. Mapping of mangrove forests on the southern coast of São Paulo, Brazil, using synthetic aperture radar data from ALOS/PALSAR. Remote Sens. Lett. 2012, 3, 567–576. [Google Scholar] [CrossRef]
- Xie, C.; Xu, J.; Wan, Z.; Fang, L. Analysis of ALOS PALSAR InSAR data for mapping water level changes in Yellow River Delta wetlands. Int. J. Remote Sens. 2013, 34, 2047–2056. [Google Scholar] [CrossRef]
- Clewley, D.; Whitcomb, J.; Moghaddam, M.; McDonald, K.; Chapman, B.; Bunting, P. Evaluation of ALOS PALSAR Data for High-Resolution Mapping of Vegetated Wetlands in Alaska. Remote Sens. 2015, 7, 7272–7297. [Google Scholar] [CrossRef] [Green Version]
- Oliver-Cabrera, T.; Wdowinski, S. InSAR-Based Mapping of Tidal Inundation Extent and Amplitude in Louisiana Coastal Wetlands. Remote Sens. 2016, 8, 393. [Google Scholar] [CrossRef] [Green Version]
- Schlaffer, S.; Chini, M.; Dettmering, D.; Wagner, W. Mapping Wetlands in Zambia Using Seasonal Backscatter Signatures Derived from ENVISAT ASAR Time Series. Remote Sens. 2016, 8, 402. [Google Scholar] [CrossRef] [Green Version]
- Pierdicca, N.; Pulvirenti, L.; Boni, G.; Squicciarino, G.; Chini, M. Mapping Flooded Vegetation Using COSMO-SkyMed: Comparison With Polarimetric and Optical Data Over Rice Fields. IEEE J. Sel. Top. Appl. Earth Obs. Remote Sens. 2017, 10, 2650–2662. [Google Scholar] [CrossRef]
- Evans, T.L.; Costa, M.; Tomas, W.M.; Camilo, A.R. Large-scale habitat mapping of the Brazilian Pantanal wetland: A synthetic aperture radar approach. Remote Sens. Environ. 2014, 155, 89–108. [Google Scholar] [CrossRef]
- Mahdianpari, M.; Salehi, B.; Rezaee, M.; Mohammadimanesh, F.; Zhang, Y. Very deep convolutional neural networks for complex land cover mapping using multispectral remote sensing imagery. Remote Sens. 2018, 10, 1119. [Google Scholar] [CrossRef] [Green Version]
- Mohammadimanesh, F.; Salehi, B.; Mahdianpari, M.; Gill, E.; Molinier, M. A new fully convolutional neural network for semantic segmentation of polarimetric SAR imagery in complex land cover ecosystem. ISPRS J. Photogramm. Remote Sens. 2019, 151, 223–236. [Google Scholar] [CrossRef]
- Rezaee, M.; Mahdianpari, M.; Zhang, Y.; Salehi, B. Deep convolutional neural network for complex wetland classification using optical remote sensing imagery. IEEE J. Sel. Top. Appl. Earth Obs. Remote Sens. 2018, 11, 3030–3039. [Google Scholar] [CrossRef]
- Santoro, M.; Wegmüller, U. Multi-temporal Synthetic Aperture Radar Metrics Applied to Map Open Water Bodies. IEEE J. Sel. Top. Appl. Earth Obs. Remote Sens. 2014, 7, 3225–3238. [Google Scholar] [CrossRef]
- Zakharova, E.A.; Kouraev, A.V.; Rémy, F.; Zemtsov, V.A.; Kirpotin, S.N. Seasonal variability of the Western Siberia wetlands from satellite radar altimetry. J. Hydrol. 2014, 512, 366–378. [Google Scholar] [CrossRef]
- Alsdorf, D.E.; Smith, L.C.; Melack, J.M. Amazon floodplain water level changes measured with interferometric SIR-C radar. IEEE Trans. Geosci. Remote Sens. 2001, 39, 423–431. [Google Scholar] [CrossRef]
- Hong, S.-H.; Wdowinski, S.; Kim, S.-W. Evaluation of TerraSAR-X Observations for Wetland InSAR Application. IEEE Trans. Geosci. Remote Sens. 2010, 48, 864–873. [Google Scholar] [CrossRef]
- Hamdan, O.; Khali Aziz, H.; Mohd Hasmadi, I. L- band ALOS PALSAR for biomass estimation of Matang Mangroves, Malaysia. Remote Sens. Environ. 2014, 155, 69–78. [Google Scholar] [CrossRef]
- Li, X.; Yeh, A.G.-O.; Wang, S.; Liu, K.; Liu, X.; Qian, J.; Chen, X. Regression and analytical models for estimating mangrove wetland biomass in South China using Radarsat images. Int. J. Remote Sens. 2007, 28, 5567–5582. [Google Scholar] [CrossRef]
- Lee, S.-K.; Fatoyinbo, T.E. TanDEM-X Pol-InSAR Inversion for Mangrove Canopy Height Estimation. IEEE J. Sel. Top. Appl. Earth Obs. Remote Sens. 2015, 8, 3608–3618. [Google Scholar] [CrossRef]
- Liao, J.; Shen, G.; Dong, L. Biomass estimation of wetland vegetation in Poyang Lake area using ENVISAT advanced synthetic aperture radar data. J. Appl. Remote Sens. 2013, 7, 073579. [Google Scholar] [CrossRef] [Green Version]
- Bartsch, A.; Pathe, C.; Wagner, W.; Scipal, K. Detection of permanent open water surfaces in central Siberia with ENVISAT ASAR wide swath data with special emphasis on the estimation of methane fluxes from tundra wetlands. Hydrol. Res. 2008, 39, 89–100. [Google Scholar] [CrossRef]
- Moher, D.; Liberati, A.; Tetzlaff, J.; Altman, D.G.; Group, T.P. Preferred Reporting Items for Systematic Reviews and Meta-Analyses: The PRISMA Statement. PLoS Med. 2009, 6, e1000097. [Google Scholar] [CrossRef] [Green Version]
- Martinez, J.-M.; Le Toan, T. Mapping of flood dynamics and spatial distribution of vegetation in the Amazon floodplain using multitemporal SAR data. Remote Sens. Environ. 2007, 108, 209–223. [Google Scholar] [CrossRef]
- Natural Resources Canada (NR). Sensitivity of Peatlands to Climate Change. Available online: https://www.nrcan.gc.ca/environment/resources/maps/11019 (accessed on 20 November 2019).
- Ding, X.; Li, X. Shoreline movement monitoring based on SAR images in Shanghai, China. Int. J. Remote Sens. 2014, 35, 3994–4008. [Google Scholar] [CrossRef]
- Meng, W.; He, M.; Hu, B.; Mo, X.; Li, H.; Liu, B.; Wang, Z. Status of wetlands in China: A review of extent, degradation, issues and recommendations for improvement. Ocean Coast. Manag. 2017, 146, 50–59. [Google Scholar] [CrossRef]
- Sang, H.; Zhang, J.; Lin, H.; Zhai, L. Multi-Polarization ASAR Backscattering from Herbaceous Wetlands in Poyang Lake Region, China. Remote Sens. 2014, 6, 4621–4646. [Google Scholar] [CrossRef] [Green Version]
- Ni, X.; Cao, C.; Zhou, Y.; Ding, L.; Choi, S.; Shi, Y.; Park, T.; Fu, X.; Hu, H.; Wang, X. Estimation of Forest Biomass Patterns across Northeast China Based on Allometric Scale Relationship. Forests 2017, 8, 288. [Google Scholar] [CrossRef] [Green Version]
- Alsdorf, D.E.; Melack, J.M.; Dunne, T.; Mertes, L.A.K.; Hess, L.L.; Smith, L.C. Interferometric radar measurements of water level changes on the Amazon flood plain. Nature 2000, 404, 4. [Google Scholar] [CrossRef]
- Canisius, F.; Brisco, B.; Murnaghan, K.; Van Der Kooij, M.; Keizer, E. SAR Backscatter and InSAR Coherence for Monitoring Wetland Extent, Flood Pulse and Vegetation: A Study of the Amazon Lowland. Remote Sens. 2019, 11, 720. [Google Scholar] [CrossRef] [Green Version]
- Cao, N.; Lee, H.; Jung, H.C.; Yu, H. Estimation of Water Level Changes of Large-Scale Amazon Wetlands Using ALOS2 ScanSAR Differential Interferometry. Remote Sens. 2018, 10, 966. [Google Scholar] [CrossRef] [Green Version]
- de Almeida Furtado, L.F.; Silva, T.S.F.; de Moraes Novo, E.M.L. Dual-season and full-polarimetric C band SAR assessment for vegetation mapping in the Amazon várzea wetlands. Remote Sens. Environ. 2016, 174, 212–222. [Google Scholar] [CrossRef] [Green Version]
- Sartori, L.R.; Imai, N.N.; Mura, J.C.; de Moraes Novo, E.M.L.; Silva, T.S.F. Mapping Macrophyte Species in the Amazon Floodplain Wetlands Using Fully Polarimetric ALOS/PALSAR Data. IEEE Trans. Geosci. Remote Sens. 2011, 49, 4717–4728. [Google Scholar] [CrossRef]
- Silva, J.S.D.; Seyler, F.; Calmant, S.; Filho, O.C.R.; Roux, E.; Araújo, A.A.M.; Guyot, J.L. Water level dynamics of Amazon wetlands at the watershed scale by satellite altimetry. Int. J. Remote Sens. 2012, 33, 3323–3353. [Google Scholar] [CrossRef]
- Grings, F.M.; Ferrazzoli, P.; Karszenbaum, H.; Salvia, M.; Kandus, P.; Jacobo-Berlles, J.C.; Perna, P. Model investigation about the potential of C band SAR in herbaceous wetlands flood monitoring. Int. J. Remote Sens. 2008, 29, 5361–5372. [Google Scholar] [CrossRef]
- Merchant, M.A.; Adams, J.R.; Berg, A.A.; Baltzer, J.L.; Quinton, W.L.; Chasmer, L.E. Contributions of C-Band SAR Data and Polarimetric Decompositions to Subarctic Boreal Peatland Mapping. IEEE J. Sel. Top. Appl. Earth Obs. Remote Sens. 2017, 10, 1467–1482. [Google Scholar] [CrossRef]
- Mahdianpari, M.; Salehi, B.; Mohammadimanesh, F.; Brisco, B.; Homayouni, S.; Gill, E.; DeLancey, E.R.; Bourgeau-Chavez, L. Big Data for a Big Country: The First Generation of Canadian Wetland Inventory Map at a Spatial Resolution of 10-m Using Sentinel-1 and Sentinel-2 Data on the Google Earth Engine Cloud Computing Platform: Mégadonnées pour un grand pays: La première carte d’inventaire des zones humides du Canada à une résolution de 10 m à l’aide des données Sentinel-1 et Sentinel-2 sur la plate-forme informatique en nuage de Google Earth EngineTM. Can. J. Remote Sens. 2020, 1–19. [Google Scholar]
- Evans, T.L.; Costa, M. Landcover classification of the Lower Nhecolândia subregion of the Brazilian Pantanal Wetlands using ALOS/PALSAR, RADARSAT-2 and ENVISAT/ASAR imagery. Remote Sens. Environ. 2013, 128, 118–137. [Google Scholar] [CrossRef]
- Darmawan, S.; Takeuchi, W.; Vetrita, Y.; Wikantika, K.; Sari, D. Impact of Topography and Tidal Height on ALOS PALSAR Polarimetric Measurements to Estimate Aboveground Biomass of Mangrove Forest in Indonesia. J. Sens. 2015, 2015, 13. [Google Scholar] [CrossRef] [Green Version]
- Hong, S.-H.; Wdowinski, S. Multitemporal Multitrack Monitoring of Wetland Water Levels in the Florida Everglades Using ALOS PALSAR Data With Interferometric Processing. Ieee Geosci. Remote Sens. Lett. 2014, 11, 1355–1359. [Google Scholar] [CrossRef]
- Zhang, M.; Li, Z.; Tian, B.; Zhou, J.; Zeng, J. A method for monitoring hydrological conditions beneath herbaceous wetlands using multi-temporal ALOS PALSAR coherence data. Remote Sens. Lett. 2015, 6, 618–627. [Google Scholar] [CrossRef]
- Plank, S.; Jüssi, M.; Martinis, S.; Twele, A. Mapping of flooded vegetation by means of polarimetric Sentinel-1 and ALOS-2/PALSAR-2 imagery. Int. J. Remote Sens. 2017, 38, 3831–3850. [Google Scholar] [CrossRef]
- Mahdianpari, M.; Salehi, B.; Mohammadimanesh, F.; Motagh, M. Random forest wetland classification using ALOS-2 L-band, RADARSAT-2 C-band, and TerraSAR-X imagery. ISPRS J. Photogramm. Remote Sens. 2017, 130, 13–31. [Google Scholar] [CrossRef]
- Kovacs, J.M.; Lu, X.X.; Flores-Verdugo, F.; Zhang, C.; Flores de Santiago, F.; Jiao, X. Applications of ALOS PALSAR for monitoring biophysical parameters of a degraded black mangrove (Avicennia germinans) forest. ISPRS J. Photogramm. Remote Sens. 2013, 82, 102–111. [Google Scholar] [CrossRef]
- Pham, T.D.; Tien Bui, D.; Yoshino, K.; Le, N. Optimized Rule-Based Logistic Model Tree Algorithm for Mapping Mangrove Species Using ALOS PALSAR Imagery and GIS in the Tropical Region. Environ. Earth Sci. 2018, 77. [Google Scholar] [CrossRef]
- Melrose, R.T.; Kingsford, R.T.; Milne, A.K. Using radar to detect flooding in arid wetlands and rivers. In Proceedings of the 2012 IEEE International Geoscience and Remote Sensing Symposium, Munich, Germany, 22–27 July 2012; pp. 5242–5245. [Google Scholar]
- Heine, I.; Jagdhuber, T.; Itzerott, S. Classification and Monitoring of Reed Belts Using Dual-Polarimetric TerraSAR-X Time Series. Remote Sens. 2016, 8, 552. [Google Scholar] [CrossRef] [Green Version]
- Martí-Cardona, B.; López-Martínez, C.; Dolz-Ripollés, J. Local Isotropy Indicator for SAR Image Filtering: Application to Envisat/ASAR Images of the Doñana Wetland (November 2014). IEEE J. Sel. Top. Appl. Earth Obs. Remote Sens. 2015, 8, 1614–1622. [Google Scholar] [CrossRef] [Green Version]
- Dabboor, M.; Brisco, B. Wetland Monitoring and Mapping Using Synthetic Aperture Radar. In Wetlands Management-Assessing Risk and Sustainable Solutions; ResearchGate GmbH: Berlin, Germany, 2018. [Google Scholar] [CrossRef] [Green Version]
- Padalia, H.; Musthafa, M. Characterization and classification of freshwater marshy wetland using synthetic aperture radar polarimetry: A case study from Loktak wetland, Northeast India. J. Appl. Remote Sens. 2017, 11, 016029. [Google Scholar] [CrossRef]
- Grings, F.; Salvia, M.; Karszenbaum, H.; Ferrazzoli, P.; Kandus, P.; Perna, P. Exploring the capacity of radar remote sensing to estimate wetland marshes water storage. J. Environ. Manag. 2009, 90, 2189–2198. [Google Scholar] [CrossRef]
- Jacome, A.; Bernier, M.; Chokmani, K.; Gauthier, Y.; Poulin, J.; De Sève, D. Monitoring Volumetric Surface Soil Moisture Content at the La Grande Basin Boreal Wetland by Radar Multi Polarization Data. Remote Sens. 2013, 5, 4919–4941. [Google Scholar] [CrossRef] [Green Version]
- Martinis, S.; Kersten, J.; Twele, A. A fully automated TerraSAR-X based flood service. ISPRS J. Photogramm. Remote Sens. 2015, 104, 203–212. [Google Scholar] [CrossRef]
- Bourgeau-Chavez, L.L.; Riordan, K.; Powell, R.B.; Miller, N.; Nowels, M. Improving Wetland Characterization with Multi-Sensor, Multi-Temporal SAR and Optical/Infrared Data Fusion. Adv. Geosci. Remote Sens. 2009. [Google Scholar] [CrossRef] [Green Version]
- Townsend, P.A. Mapping Seasonal Flooding in Forested Wetlands Using Multi-Temporal Radarsat SAR. Photogramm. Eng. Remote Sens. 2001, 67, 857–864. [Google Scholar]
- Kim, S.-W.; Wdowinski, S.; Amelung, F.; Dixon, T.H.; Won, J.-S. Interferometric Coherence Analysis of the Everglades Wetlands, South Florida. IEEE Trans. Geosci. Remote Sens. 2013, 51, 5210–5224. [Google Scholar] [CrossRef]
- Betbeder, J.; Rapinel, S.; Corpetti, T.; Pottier, E.; Corgne, S.; Hubert-Moy, L. Multitemporal classification of TerraSAR-X data for wetland vegetation mapping. J. Appl. Remote Sens. 2014, 8, 083648. [Google Scholar] [CrossRef]
- Brisco, B.; Schmitt, A.; Murnaghan, K.; Kaya, S.; Roth, A. SAR polarimetric change detection for flooded vegetation. Int. J. Digit. Earth 2013, 6, 103–114. [Google Scholar] [CrossRef]
- Ott, J.S.; Kasischke, E.S.; French, N.H.; Gross, M.F.; Klemas, V. Preliminary Evaluation of A Multi-channel Sar Data Set For A Mid-atlantic Coastal Marsh. In Proceedings of the 10th Annual International Symposium on Geoscience and Remote Sensing, College Park, MD, USA, 20–24 May 1990; pp. 453–456. [Google Scholar]
- Kumar, T.; Patnaik, C. Discrimination of mangrove forests and characterization of adjoining land cover classes using temporal C-band Synthetic Aperture Radar data: A case study of Sundarbans. Int. J. Appl. Earth Obs. Geoinf. 2013, 23, 119–131. [Google Scholar] [CrossRef]
- Lucas, R.M.; Mitchell, A.L.; Rosenqvist, A.; Proisy, C.; Melius, A.; Ticehurst, C. The potential of L-band SAR for quantifying mangrove characteristics and change: Case studies from the tropics. Aquat. Conserv. Mar. Freshw. Ecosyst. 2007, 17, 245–264. [Google Scholar] [CrossRef]
- Solovey, T. Identification of the Rozwarowo marshes using radar remote sensing. Geogr. Pol. 2017. [Google Scholar] [CrossRef] [Green Version]
- Brisco, B.; Short, N.; van der Sanden, J.; Landry, R.; Raymond, D. A semi-automated tool for surface water mapping with RADARSAT-1. Can. J. Remote Sens. 2009, 35, 336–344. [Google Scholar] [CrossRef]
- Novo, E.M.L.M.; Costa, M.P.F.; Mantovani, J.E.; Lima, I.B.T. Relationship between macrophyte stand variables and radar backscatter at L and C band, Tucuruí reservoir, Brazil. Int. J. Remote Sens. 2002, 23, 1241–1260. [Google Scholar] [CrossRef]
- Shen, G.; Liao, J.; Guo, H.; Liu, J. Poyang Lake wetland vegetation biomass inversion using polarimetric RADARSAT-2 synthetic aperture radar data. J. Appl. Remote Sens. 2015, 9, 096077. [Google Scholar] [CrossRef] [Green Version]
- Zhang, M.; Li, Z.; Tian, B.; Zhou, J.; Tang, P. The backscattering characteristics of wetland vegetation and water-level changes detection using multi-mode SAR: A case study. Int. J. Appl. Earth Obs. Geoinf. 2016, 45, 1–13. [Google Scholar] [CrossRef]
- Lee, Y.-K.; Park, J.-W.; Choi, J.-K.; Oh, Y.; Won, J.-S. Potential uses of TerraSAR-X for mapping herbaceous halophytes over salt marsh and tidal flats. Estuar. Coast. Shelf Sci. 2012, 115, 366–376. [Google Scholar] [CrossRef]
- Townsend, P.A. Estimating forest structure in wetlands using multitemporal SAR. Remote Sens. Environ. 2002, 79, 288–304. [Google Scholar] [CrossRef]
- Mohammadimanesh, F.; Salehi, B.; Mahdianpari, M.; Brisco, B.; Motagh, M. Multi-temporal, multi-frequency, and multi-polarization coherence and SAR backscatter analysis of wetlands. ISPRS J. Photogramm. Remote Sens. 2018, 142, 78–93. [Google Scholar] [CrossRef]
- Yajima, Y.; Yamaguchi, Y.; Sato, R.; Yamada, H.; Boerner, W.-M. POLSAR Image Analysis of Wetlands Using a Modified Four-Component Scattering Power Decomposition. IEEE Trans. Geosci. Remote Sens. 2008, 46, 1667–1673. [Google Scholar] [CrossRef]
- Clint Slatton, K.; Crawford, M.M.; Chang, L.-D. Modeling temporal variations in multipolarized radar scattering from intertidal coastal wetlands. ISPRS J. Photogramm. Remote Sens. 2008, 63, 559–577. [Google Scholar] [CrossRef]
- Millard, K.; Richardson, M. Quantifying the relative contributions of vegetation and soil moisture conditions to polarimetric C-Band SAR response in a temperate peatland. Remote Sens. Environ. 2018, 206, 123–138. [Google Scholar] [CrossRef]
- Marechal, C.; Pottier, E.; Hubert-Moy, L.; Rapinel, S. One year wetland survey investigations from quad-pol RADARSAT-2 time-series SAR images. Can. J. Remote Sens. 2012, 38, 240–252. [Google Scholar] [CrossRef]
- Freeman, A.; Durden, S.L. A three-component scattering model for polarimetric SAR data. IEEE Trans. Geosci. Remote Sens. 1998, 36, 963–973. [Google Scholar] [CrossRef] [Green Version]
- Touzi, R. Target Scattering Decomposition in Terms of Roll-Invariant Target Parameters. IEEE Trans. Geosci. Remote Sens. 2007, 45, 73–84. [Google Scholar] [CrossRef]
- Gosselin, G.; Touzi, R.; Cavayas, F. Polarimetric Radarsat-2 wetland classification using the Touzi decomposition: Case of the Lac Saint-Pierre Ramsar wetland. Can. J. Remote Sens. 2014, 39, 491–506. [Google Scholar] [CrossRef]
- Bartsch, A.; Wagner, W.; Scipal, K.; Pathe, C.; Sabel, D.; Wolski, P. Global monitoring of wetlands – the value of ENVISAT ASAR Global mode. J. Environ. Manag. 2009, 90, 2226–2233. [Google Scholar] [CrossRef] [PubMed]
- Melendez-Pastor, I.; Navarro-Pedreno, J.; Koch, M.; Gomez, I. Multi-resolution and temporal characterization of land-use classes in a Mediterranean wetland with land-cover fractions. Int. J. Remote Sens. 2010, 31, 5365–5389. [Google Scholar] [CrossRef]
- Bourgeau-Chavez, L.L.; Lee, Y.M.; Battaglia, M.; Endres, S.L.; Laubach, Z.M.; Scarbrough, K. Identification of Woodland Vernal Pools with Seasonal Change PALSAR Data for Habitat Conservation. Remote Sens. 2016, 8, 490. [Google Scholar] [CrossRef] [Green Version]
- Thanh Noi, P.; Kappas, M. Comparison of Random Forest, k-Nearest Neighbor, and Support Vector Machine Classifiers for Land Cover Classification Using Sentinel-2 Imagery. Sensors 2018, 18, 18. [Google Scholar] [CrossRef] [Green Version]
- Banks, S.; White, L.; Behnamian, A.; Chen, Z.; Montpetit, B.; Brisco, B.; Pasher, J.; Duffe, J. Wetland Classification with Multi-Angle/Temporal SAR Using Random Forests. Remote Sens. 2019, 11, 670. [Google Scholar] [CrossRef] [Green Version]
- Corcoran, J.M.; Knight, J.F.; Gallant, A.L. Influence of Multi-Source and Multi-Temporal Remotely Sensed and Ancillary Data on the Accuracy of Random Forest Classification of Wetlands in Northern Minnesota. Remote Sens. 2013, 5, 3212–3238. [Google Scholar] [CrossRef] [Green Version]
- Li, H.; Zhang, S.; Ding, X.; Zhang, C.; Cropp, R. A novel unsupervised bee colony optimization (UBCO) method for remote-sensing image classification: A case study in a heterogeneous marsh area. Int. J. Remote Sens. 2016, 37, 5726–5748. [Google Scholar] [CrossRef] [Green Version]
- Jimenez, M.; Castanedo, S.; Medina, R.; Camus, P. A methodology for the classification of estuary restoration areas: A management tool. Ocean Coast. Manag. 2012, 69, 231–242. [Google Scholar] [CrossRef]
- Tamiminia, H.; Salehi, B.; Mahdianpari, M.; Quackenbush, L.; Adeli, S.; Brisco, B. Google Earth Engine for geo-big data applications: A meta-analysis and systematic review. ISPRS J. Photogramm. Remote Sens. 2020, 164, 152–170. [Google Scholar] [CrossRef]
- Mahdianpari, M.; Salehi, B.; Mohammadimanesh, F.; Homayouni, S.; Gill, E. The first wetland inventory map of newfoundland at a spatial resolution of 10 m using sentinel-1 and sentinel-2 data on the google earth engine cloud computing platform. Remote Sens. 2019, 11, 43. [Google Scholar] [CrossRef] [Green Version]
- Huang, C.; Davis, L.S.; Townshend, J.R.G. An assessment of support vector machines for land cover classification. Int. J. Remote Sens. 2002, 23, 725–749. [Google Scholar] [CrossRef]
- Heydari, S.S.; Mountrakis, G. Meta-analysis of deep neural networks in remote sensing: A comparative study of mono-temporal classification to support vector machines. ISPRS J. Photogramm. Remote Sens. 2019, 152, 192–210. [Google Scholar] [CrossRef]
- Meng, X.; Zhang, S.; Zang, S. Lake Wetland Classification Based on an SVM-CNN Composite Classifier and High-resolution Images Using Wudalianchi as an Example. J. Coast. Res. 2019, 93, 153–162. [Google Scholar] [CrossRef]
- Sato, R.; Yamaguchi, Y.; Yamada, H.; Boerner, W.-M. Seasonal Change Monitoring of Wetlands by Using Airborne and Satellite Polsar Sensing. In Proceedings of the IGARSS 2008-2008 IEEE International Geoscience and Remote Sensing Symposium, Boston, MA, USA, 7–11 July 2008; Volume 2, pp. 289–292. [Google Scholar]
- Gallant, A.L.; Kaya, S.G.; White, L.; Brisco, B.; Roth, M.F.; Sadinski, W.J.; Rover, J. Detecting emergence, growth, and senescence of wetland vegetation with polarimetric synthetic aperture radar (SAR) data. Water 2014, 6, 694–722. [Google Scholar] [CrossRef] [Green Version]
- Kasischke, E.; Morrissey, L.; Way, J.; French, N.; Bourgeau-Chavez, L.; Rignot, E.; Stearn, J.; Livingston, G. Monitoring Seasonal Variations in Boreal Ecosystems Using Multi-Temporal Spaceborne SAR Data. Can. J. Remote Sens. 2014, 21, 96–109. [Google Scholar] [CrossRef]
- Yuan, T.; Lee, H.; Jung, H.C. Toward Estimating Wetland Water Level Changes Based on Hydrological Sensitivity Analysis of PALSAR Backscattering Coefficients over Different Vegetation Fields. Remote Sens. 2015, 7, 3153–3183. [Google Scholar] [CrossRef] [Green Version]
- Bouvet, A.; Le Toan, T. Use of ENVISAT/ASAR wide-swath data for timely rice fields mapping in the Mekong River Delta. Remote Sens. Environ. 2011, 115, 1090–1101. [Google Scholar] [CrossRef] [Green Version]
- Kasischke, E.S.; Smith, K.B.; Bourgeau-Chavez, L.L.; Romanowicz, E.A.; Brunzell, S.; Richardson, C.J. Effects of seasonal hydrologic patterns in south Florida wetlands on radar backscatter measured from ERS-2 SAR imagery. Remote Sens. Environ. 2003, 88, 423–441. [Google Scholar] [CrossRef]
- Lu, Z.; Kwoun, O. Radarsat-1 and ERS InSAR Analysis Over Southeastern Coastal Louisiana: Implications for Mapping Water-Level Changes Beneath Swamp Forests. IEEE Trans. Geosci. Remote Sens. 2008, 46, 2167–2184. [Google Scholar] [CrossRef]
- Chimitdorzhiev, T.N.; Dagurov, P.N.; Bykov, M.E.; Dmitriev, A.V.; Kirbizhekova, I.I. Comparison of ALOS PALSAR interferometry and field geodetic leveling for marshy soil thaw/freeze monitoring, case study from the Baikal lake region, Russia. J. Appl. Remote Sens. 2016, 10, 016006. [Google Scholar] [CrossRef]
- Wdowinski, S.; Kim, S.-W.; Amelung, F.; Dixon, T.H.; Miralles-Wilhelm, F.; Sonenshein, R. Space-based detection of wetlands’ surface water level changes from L-band SAR interferometry. Remote Sens. Environ. 2008, 112, 681–696. [Google Scholar] [CrossRef]
- Ramos-Fuertes, A.; Marti-Cardona, B.; Bladé, E.; Dolz, J. Envisat/ASAR Images for the Calibration of Wind Drag Action in the Doñana Wetlands 2D Hydrodynamic Model. Remote Sens. 2014, 6, 379–406. [Google Scholar] [CrossRef] [Green Version]
- Wilusz, D.C.; Zaitchik, B.F.; Anderson, M.C.; Hain, C.R.; Yilmaz, M.T.; Mladenova, I.E. Monthly flooded area classification using low resolution SAR imagery in the Sudd wetland from 2007 to 2011. Remote Sens. Environ. 2017, 194, 205–218. [Google Scholar] [CrossRef]
- Birkett, C.M. Contribution of the TOPEX NASA Radar Altimeter to the global monitoring of large rivers and wetlands. Water Resour. Res. 1998, 34, 1223–1239. [Google Scholar] [CrossRef]
- Dettmering, D.; Schwatke, C.; Boergens, E.; Seitz, F. Potential of ENVISAT Radar Altimetry for Water Level Monitoring in the Pantanal Wetland. Remote Sens. 2016, 8, 596. [Google Scholar] [CrossRef] [Green Version]
- Kasischke, E.; Bourgeau-Chavez, L. Monitoring South Florida wetlands using ERS-1 SAR imagery. Photogramm. Eng. Remote Sens. 1997, 63. [Google Scholar]
- Takada, M.; Mishima, Y.; Natsume, S. Estimation of surface soil properties in peatland using ALOS/PALSAR. Landsc. Ecol. Eng. 2009, 5, 45–58. [Google Scholar] [CrossRef]
- Lucas, R.; Rebelo, L.-M.; Fatoyinbo, L.; Rosenqvist, A.; Itoh, T.; Shimada, M.; Simard, M.; Souza-Filho, P.W.; Thomas, N.; Trettin, C.; et al. Contribution of L-band SAR to systematic global mangrove monitoring. Mar. Freshw. Res. 2014, 65, 589–603. [Google Scholar] [CrossRef]
- Magagi, R.; Bernier, M.; Ung, C.H. Quantitative analysis of RADARSAT SAR data over a sparse forest canopy. IEEE Trans. Geosci. Remote Sens. 2002, 40, 1301–1313. [Google Scholar] [CrossRef]
- Dobson, M.C.; Ulaby, F.T.; Pierce, L.E.; Sharik, T.L.; Bergen, K.M.; Kellndorfer, J.; Kendra, J.R.; Li, E.; Lin, Y.C.; Nashashibi, A.; et al. Estimation of forest biophysical characteristics in Northern Michigan with SIR-C/X-SAR. IEEE Trans. Geosci. Remote Sens. 1995, 33, 877–895. [Google Scholar] [CrossRef]
- Kasischke, E.S.; Bourgeau-Chavez, L.L.; Rober, A.R.; Wyatt, K.H.; Waddington, J.M.; Turetsky, M.R. Effects of soil moisture and water depth on ERS SAR backscatter measurements from an Alaskan wetland complex. Remote Sens. Environ. 2009, 113, 1868–1873. [Google Scholar] [CrossRef]
- Baghdadi, N.; Bernier, M.; Gauthier, R.; Neeson, I. Evaluation of C-band SAR data for wetlands mapping. Int. J. Remote Sens. 2010, 22, 71–88. [Google Scholar] [CrossRef]
- Baghdadi, N.; Cresson, R.; Hajj, M.E.; Ludwig, R.; Jeunesse, I.L. Estimation of soil parameters over bare agriculture areas from C-band polarimetric SAR data using neural networks. Hydrol. Earth Syst. Sci. 2012, 16, 1607–1621. [Google Scholar] [CrossRef] [Green Version]
- Dabrowska-Zielinska, K.; Budzynska, M.; Tomaszewska, M.; Malinska, A.; Gatkowska, M.; Bartold, M.; Malek, I. Assessment of Carbon Flux and Soil Moisture in Wetlands Applying Sentinel-1 Data. Remote Sens. 2016, 8, 756. [Google Scholar] [CrossRef] [Green Version]
- Jensen, K.; McDonald, K.; Podest, E.; Rodriguez-Alvarez, N.; Horna, V.; Steiner, N. Assessing L-Band GNSS-Reflectometry and Imaging Radar for Detecting Sub-Canopy Inundation Dynamics in a Tropical Wetlands Complex. Remote Sens. 2018, 10, 1431. [Google Scholar] [CrossRef] [Green Version]
- Townsend, P.A. Relationships between forest structure and the detection of flood inundation in forested wetlands using C-band SAR. Int. J. Remote Sens. 2002, 23, 443–460. [Google Scholar] [CrossRef]
- Bourgeau-Chavez, L.L.; Smith, K.B.; Brunzell, S.M.; Kasischke, E.S.; Romanowicz, E.A.; Richardson, C.J. Remote monitoring of regional inundation patterns and hydroperiod in the Greater Everglades using Synthetic Aperture Radar. Wetlands 2005, 25, 176. [Google Scholar] [CrossRef]
- Bian, H.; Yan, T.; Zhang, Z.; He, C.; Sheng, L. Mapping deciduous broad-leaved forested swamps using ALOS/Palsar data. Chin. Geogr. Sci. 2016, 26, 352–365. [Google Scholar] [CrossRef] [Green Version]
- Cazals, C.; Rapinel, S.; Frison, P.-L.; Bonis, A.; Mercier, G.; Mallet, C.; Corgne, S.; Rudant, J.-P. Mapping and Characterization of Hydrological Dynamics in a Coastal Marsh Using High Temporal Resolution Sentinel-1A Images. Remote Sens. 2016, 8, 570. [Google Scholar] [CrossRef] [Green Version]
- DeLancey, E.R.; Kariyeva, J.; Cranston, J.; Brisco, B. Monitoring Hydro Temporal Variability in Alberta, Canada with Multi-Temporal Sentinel-1 SAR Data. Can. J. Remote Sens. 2018, 44, 1–10. [Google Scholar] [CrossRef]
- Muro, J.; Canty, M.; Conradsen, K.; Hüttich, C.; Nielsen, A.A.; Skriver, H.; Remy, F.; Strauch, A.; Thonfeld, F.; Menz, G. Short-Term Change Detection in Wetlands Using Sentinel-1 Time Series. Remote Sens. 2016, 8, 795. [Google Scholar] [CrossRef] [Green Version]
- Mleczko, M.; Mróz, M. Wetland Mapping Using SAR Data from the Sentinel-1A and TanDEM-X Missions: A Comparative Study in the Biebrza Floodplain (Poland). Remote Sens. 2018, 10, 78. [Google Scholar] [CrossRef] [Green Version]
- Parker, A.L.; Filmer, M.S.; Featherstone, W.E. First Results from Sentinel-1A InSAR over Australia: Application to the Perth Basin. Remote Sens. 2017, 9, 299. [Google Scholar] [CrossRef] [Green Version]
- Dabrowska-Zielinska, K.; Musial, J.; Malinska, A.; Budzynska, M.; Gurdak, R.; Kiryla, W.; Bartold, M.; Grzybowski, P. Soil Moisture in the Biebrza Wetlands Retrieved from Sentinel-1 Imagery. Remote Sens. 2018, 10, 1979. [Google Scholar] [CrossRef] [Green Version]
- Dabboor, M.; White, L.; Brisco, B.; Charbonneau, F. Change Detection with Compact Polarimetric SAR for Monitoring Wetlands. Can. J. Remote Sens. 2015, 41, 408–417. [Google Scholar] [CrossRef]
- Chuang, C.-L.; Shaffer, S.; Niamsuwan, N.; Li, S.; Vines, K.; Yang, M.-W. NISAR L-band digital electronics subsystem: A multichannel system with distributed processors for digital beam forming and mode dependent filtering. In Proceedings of the 2016 IEEE Radar Conference (RadarConf), Philadelphia, PA, USA, 2–6 May 2016; pp. 1–5. [Google Scholar]
- Duncanson, L.; Neuenschwander, A.; Hancock, S.; Thomas, N.; Fatoyinbo, T.; Simard, M.; Silva, C.A.; Armston, J.; Luthcke, S.B.; Hofton, M.; et al. Biomass estimation from simulated GEDI, ICESat-2 and NISAR across environmental gradients in Sonoma County, California. Remote Sens. Environ. 2020, 242, 111779. [Google Scholar] [CrossRef]
- Hoffman, J.P.; Horst, S.; Ghaemi, H. Digital calibration system for the proposed NISAR (NASA/ISRO) mission. In Proceedings of the 2015 IEEE Aerospace Conference, Big Sky, MT, USA, 7–14 March 2015; pp. 1–7. [Google Scholar]
- Rosen, P.; Hensley, S.; Shaffer, S.; Edelstein, W.; Kim, Y.; Kumar, R. The NASA-ISRO SAR (NISAR) mission dual-band radar instrument preliminary design. In Proceedings of the 2017 IEEE International Geoscience and Remote Sensing Symposium (IGARSS), Fort Worth, TX, USA, 23–28 July 2017; pp. 3832–3835. [Google Scholar]
- Rosen, P.; Hensley, S.; Shaffer, S.; Edelstein, W. An update on the NASA-ISRO dual-frequency DBF SAR (NISAR) mission. In Proceedings of the 2016 IEEE International Geoscience and Remote Sensing Symposium (IGARSS), Beijing, China, 10–15 July 2016; pp. 2106–2108. [Google Scholar]
Figure 1.
Tag cloud of frequent terms in wetlands monitoring studies using synthetic aperture radar (SAR) data. The size of the text shows the frequency of that specific term.
Figure 1.
Tag cloud of frequent terms in wetlands monitoring studies using synthetic aperture radar (SAR) data. The size of the text shows the frequency of that specific term.

Figure 2.
Designated search query and corresponding search phrases for wetland mapping review using SAR data. Key terms in the first and second columns were imported as an input in the topic section and the last column in the title.
Figure 2.
Designated search query and corresponding search phrases for wetland mapping review using SAR data. Key terms in the first and second columns were imported as an input in the topic section and the last column in the title.
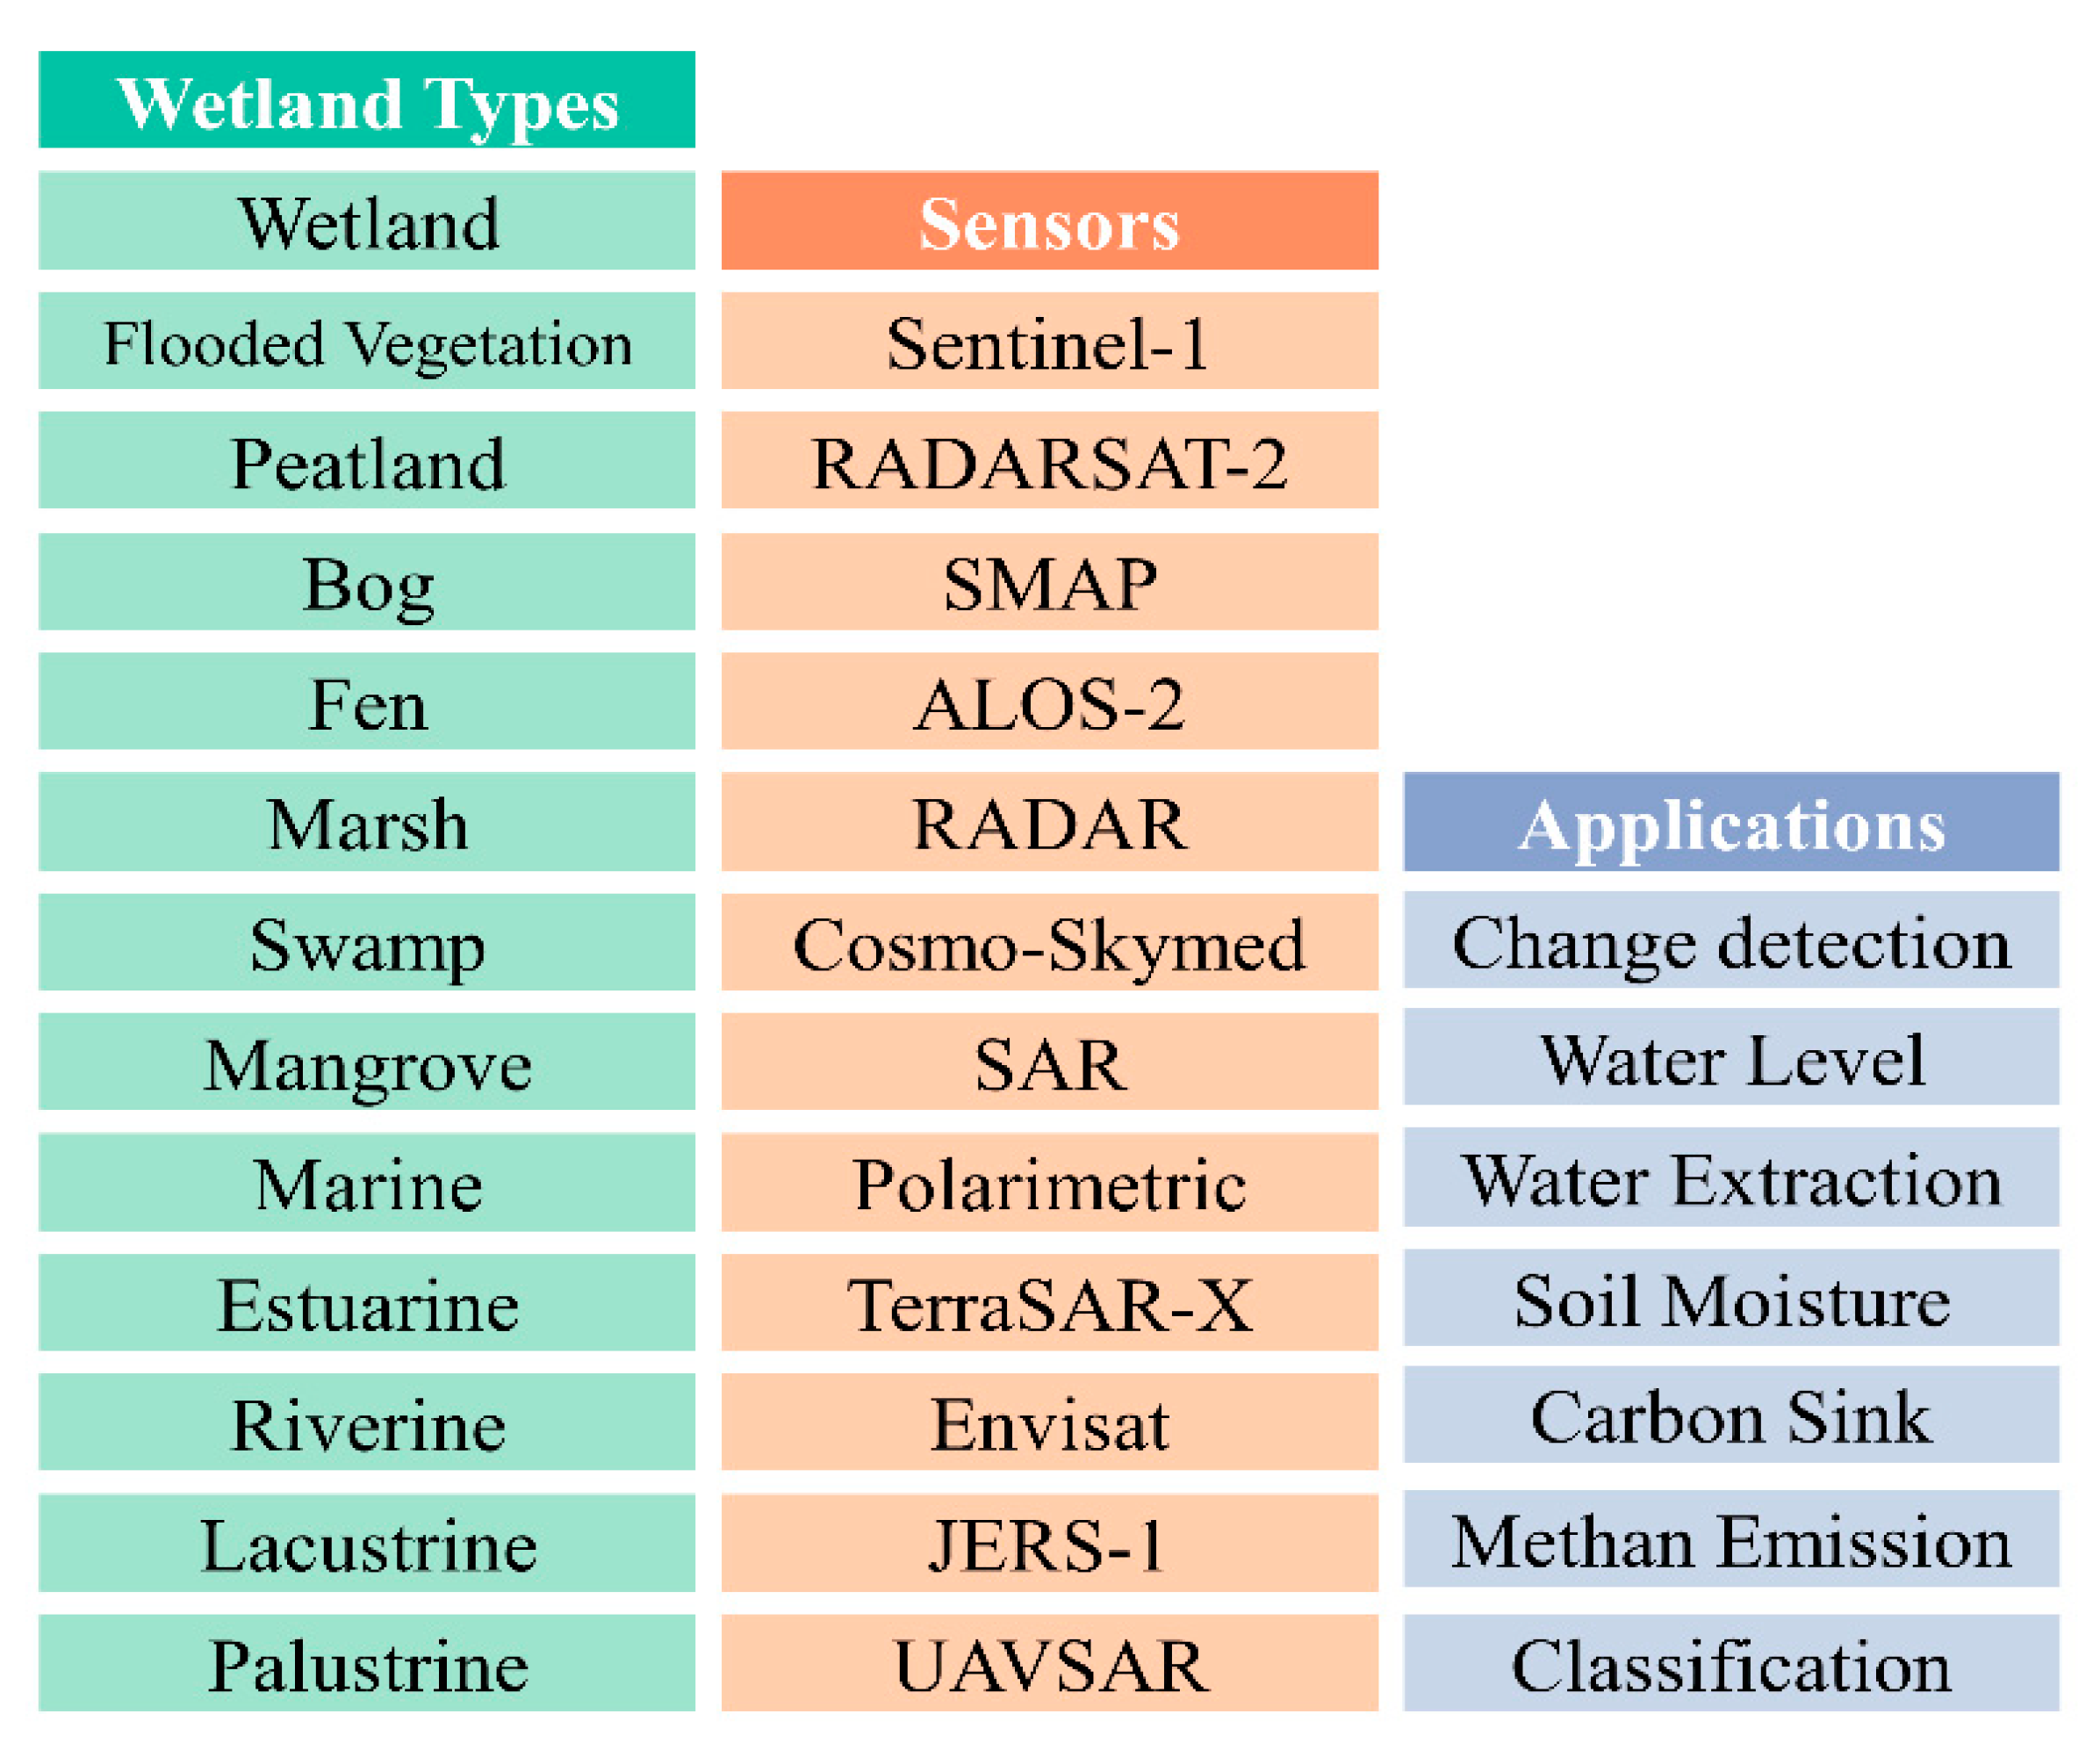
Figure 3.
PRISMA flow diagram for selecting relevant articles. Initially 338 articles were found through the designed search criteria, with nine duplicates removed. We removed articles that integrated SAR and optical data, leaving 217 studies. After screening the 217 articles, 172 of them were chosen for analysis.

Figure 4.
Count of papers published in seven leading remote sensing journals from 1993 to 2019: Remote Sensing MDPI, Remote Sensing of Environment (RSE), IEEE Transactions on Geoscience and Remote Sensing, Canadian Journal of Remote Sensing (CJRS), International Journal of Remote Sensing (IJRS), International Society for Photogrammetry and Remote Sensing (ISPRS) Journal and Journal of Applied Remote Sensing (JARS).

Figure 5.
Trend of published articles in the past three decades highlighting the number of studies that used single and multi-frequency data. Each bar covers a four-year period with the exception of the last bar that includes articles covering only three years.
Figure 5.
Trend of published articles in the past three decades highlighting the number of studies that used single and multi-frequency data. Each bar covers a four-year period with the exception of the last bar that includes articles covering only three years.

Figure 6.
World map illustrating frequency of published articles per country.

Figure 7.
Number of studies on SAR and wetland monitoring versus incidence angle and resolution.

Figure 8.
The launch and end mission dates of the major SAR sensors. The last column represents the present time.
Figure 8.
The launch and end mission dates of the major SAR sensors. The last column represents the present time.

Figure 9.
Number of studies in each frequency bands. The other bands group corresponds to less used bands such as Ka, S and P bands, with which some airborne SAR sensors are equipped.
Figure 9.
Number of studies in each frequency bands. The other bands group corresponds to less used bands such as Ka, S and P bands, with which some airborne SAR sensors are equipped.

Figure 10.
Number of studies for different SAR sensors. Airborne sensors (e.g., UAVSAR) and sensors with less than five studies are clustered as “other-sensors” in this figure. The multi-SAR sensors group includes all the studies that used more than one SAR sensor.
Figure 10.
Number of studies for different SAR sensors. Airborne sensors (e.g., UAVSAR) and sensors with less than five studies are clustered as “other-sensors” in this figure. The multi-SAR sensors group includes all the studies that used more than one SAR sensor.

Figure 11.
Summary of SAR information used by each study in the meta-analysis into three groups: backscattering intensity, polarimetry and interferometry. Studies using the polarimetric SAR information are further subcategorized into quad and dual polarizations.
Figure 11.
Summary of SAR information used by each study in the meta-analysis into three groups: backscattering intensity, polarimetry and interferometry. Studies using the polarimetric SAR information are further subcategorized into quad and dual polarizations.

Figure 12.
Number of studies for wetland mapping, change detection, water level monitoring, inundation mapping (water extraction), biomass and soil moisture application are shown.
Figure 12.
Number of studies for wetland mapping, change detection, water level monitoring, inundation mapping (water extraction), biomass and soil moisture application are shown.

Figure 13.
Box-and-whisker plots illustrating the effect of frequency bands on overall accuracy. Box limits show the 25 and 75 percentiles; whiskers demonstrate the maximum and minimum values (except for outlier dots in C and L bands); red lines within the boxes indicate the median.
Figure 13.
Box-and-whisker plots illustrating the effect of frequency bands on overall accuracy. Box limits show the 25 and 75 percentiles; whiskers demonstrate the maximum and minimum values (except for outlier dots in C and L bands); red lines within the boxes indicate the median.

Figure 14.
Box-and-whisker plots illustrating the overall accuracy of classification result attained based on the SAR sensors applied. Articles that used multiple SAR sensors are excluded from this analysis.
Figure 14.
Box-and-whisker plots illustrating the overall accuracy of classification result attained based on the SAR sensors applied. Articles that used multiple SAR sensors are excluded from this analysis.

Figure 15.
Box-and-whisker plots illustrating the effect of applying different SAR configurations on overall accuracy.
Figure 15.
Box-and-whisker plots illustrating the effect of applying different SAR configurations on overall accuracy.

Figure 16.
Comparison of used resolution impact on overall accuracies. High resolution refers to resolution lower than 4 m. Medium resolution corresponds to resolution between 4 and 30 m, and low resolution is more than 30 m.
Figure 16.
Comparison of used resolution impact on overall accuracies. High resolution refers to resolution lower than 4 m. Medium resolution corresponds to resolution between 4 and 30 m, and low resolution is more than 30 m.

Figure 17.
Effect of different SAR configuration on obtained accuracies in water level monitoring studies.
Figure 17.
Effect of different SAR configuration on obtained accuracies in water level monitoring studies.


Table 1.
Attributes extracted from screened articles in database for systematic meta-analysis. These attributes were imported into an excel sheet for further analysis.
Table 1.
Attributes extracted from screened articles in database for systematic meta-analysis. These attributes were imported into an excel sheet for further analysis.
| # | Attribute | Description |
|---|---|---|
| 1 | Title | – |
| 2 | Year | – |
| 3 | Citation | – |
| 4 | Publisher | Journal name |
| 5 | Author(s) | – |
| 6 | Affiliation | – |
| 7 | Geographic location | Countries |
| 8 | Study site size | Km2 |
| 9 | Wetland type | Marine, estuarine, lacustrine, riverine, palustrine |
| 10 | Sensor | Available SAR sensors |
| 11 | Platform | Spaceborne or airborne |
| 12 | Single or multi frequency | – |
| 13 | Used frequency | P, C, L, X bands |
| 14 | Polarization | Single, dual or quad polarization |
| 15 | Incident angle | Range of incidence angles |
| 16 | Usage | Intensity, PolSAR, InSAR |
| 17 | Spatial resolution | Meters |
| 18 | Research objective | Wetland mapping, classification, change detection, water level monitoring, biomass estimation, soil moisture |
| 19 | Single or multidate | Multitemporal or single date |
| 20 | Accuracy Assessment | In percent |
© 2020 by the authors. Licensee MDPI, Basel, Switzerland. This article is an open access article distributed under the terms and conditions of the Creative Commons Attribution (CC BY) license (http://creativecommons.org/licenses/by/4.0/).
Share and Cite
MDPI and ACS Style
Adeli, S.; Salehi, B.; Mahdianpari, M.; Quackenbush, L.J.; Brisco, B.; Tamiminia, H.; Shaw, S. Wetland Monitoring Using SAR Data: A Meta-Analysis and Comprehensive Review. Remote Sens. 2020, 12, 2190. https://doi.org/10.3390/rs12142190
AMA Style
Adeli S, Salehi B, Mahdianpari M, Quackenbush LJ, Brisco B, Tamiminia H, Shaw S. Wetland Monitoring Using SAR Data: A Meta-Analysis and Comprehensive Review. Remote Sensing. 2020; 12(14):2190. https://doi.org/10.3390/rs12142190
Chicago/Turabian StyleAdeli, Sarina, Bahram Salehi, Masoud Mahdianpari, Lindi J. Quackenbush, Brian Brisco, Haifa Tamiminia, and Stephen Shaw. 2020. "Wetland Monitoring Using SAR Data: A Meta-Analysis and Comprehensive Review" Remote Sensing 12, no. 14: 2190. https://doi.org/10.3390/rs12142190
Note that from the first issue of 2016, this journal uses article numbers instead of page numbers. See further details here.