Pre-Emptive Detection of Mature Pine Drought Stress Using Multispectral Aerial Imagery

1
Pacific Northwest Research Station, USDA Forest Service, Bend, OR 97701, USA
2
Biology Department, Portland State University, Portland, OR 97201, USA
3
Pacific Southwest Research Station, USDA Forest Service, Riverside, CA 92507, USA
4
Western Wildlands Environmental Threats Assessment Center, USDA Forest Service, Bend, OR 97701, USA
*
Author to whom correspondence should be addressed.
Remote Sens. 2020, 12(14), 2338; https://doi.org/10.3390/rs12142338
Submission received: 19 June 2020
/
Revised: 16 July 2020
/
Accepted: 16 July 2020
/
Published: 21 July 2020
(This article belongs to the Special Issue Monitoring Forest Change with Remote Sensing)
Abstract
:Drought, ozone (O3), and nitrogen deposition (N) alter foliar pigments and tree crown structure that may be remotely detectable. Remote sensing tools are needed that pre-emptively identify trees susceptible to environmental stresses could inform forest managers in advance of tree mortality risk. Jeffrey pine, a component of the economically important and widespread western yellow pine in North America was investigated in the southern Sierra Nevada. Transpiration of mature trees differed by 20% between microsites with adequate (mesic (M)) vs. limited (xeric (X)) water availability as described in a previous study. In this study, in-the-crown morphological traits (needle chlorosis, branchlet diameter, and frequency of needle defoliators and dwarf mistletoe) were significantly correlated with aerially detected, sub-crown spectral traits (upper crown NDVI, high resolution (R), near-infrared (NIR) Scalar (inverse of NDVI) and THERM Δ, and the difference between upper and mid crown temperature). A classification tree model sorted trees into X and M microsites with THERM Δ alone (20% error), which was partially validated at a second site with only mesic trees (2% error). Random forest separated M and X site trees with additional spectra (17% error). Imagery taken once, from an aerial platform with sub-crown resolution, under the challenge of drought stress, was effective in identifying droughted trees within the context of other environmental stresses.
1. Introduction
Recent, massive tree die-offs have drawn world-wide attention. Unanticipated, large-scale, climate- and insect outbreak-induced forest mortality has been reported on most continents since the mid-20th century, increasing in frequency after the late 20th century to present [1]. Water deficits alone can drive the combined drought and insect outbreak-induced mortality, and “hot droughts” exacerbate it [2]. A plethora of studies link increased insect and pathogen outbreaks and tree mortality with drought [3].
Remote sensing tools that are low in data latency and of sufficient resolution to discern individual tree vigor and/or stress could support forest management, especially as unanticipated environmental events and biotic pressures evolve. Identifying trees “at risk” and patches of stressed trees needs to be pre-emptive [4,5,6]: Identified and located at least a year in advance of decline to benefit forest planning, prioritization, and treatment. Trees need to be under stress at the time of imaging: Trees that demonstrate high vigor under environmental stress are resilient to that challenge and could be selectively retained to meet management objectives. Tree mortality can take 5 months with acute drought stress (Pinus halepensis forests [7]), or up to 8 years with chronic drought (inferred for pinyon pine [8]) or multiple biotic and environmental stresses. Assessment of tree status at the seasonal maximum of ground water extraction late in the growing season, in a “drought” year could inform managers of location and level of risk.
The requirements for detecting tree mortality are well defined: Distinguish dead, scorched, and/or red crowns from live green crowns. Detection of mature trees that are low vigor, stressed, or otherwise pre-disposed to poor outcomes under environmental stress is more difficult. At the leaf level, subtle changes in leaf water potential have been spectrally detected [8], as have changes in water status of canopies [9,10,11]. Mild drought stress has been detected in a conifer provenance study [12], but not in individual mature pine crowns, likely, due to the refractive complexities of needles, angles, branch exposure, and bleed through of ground cover in feathery crown margins. Individual conifer crowns in severe drought stress can be detected with high resolution spectrometers [13] and similar sensors mounted on unmanned aerial systems (UAS) in crops with relatively uniform canopies [14]. Coarse resolution imagery (e.g., 30 m and greater) can identify patches of “at risk” trees in decline [15], but in western U.S. landscapes where woodlands and open forests are common, ground cover can contaminate the spectral signature of a tree. Imagery from sensors that can resolve individual tree crowns with sufficient spatial and spectral detail to detect drought stress may be a useful forest management tool.
Change detection is a well-established remote sensing technique where multiple images of the same extent are processed to highlight differences between time periods. Remote sensing tools have been used to detect various aspects of plant physiological status including drought stress, insect or pathogen damage, or nutrition concentration/status at multiple scales (in order of increasing scale, [15,16,17,18,19,20,21,22,23]). Hyperspectral imagery is one of the most definitive techniques to identify drought stress, whether a lethal threshold (~50% canopy water content (CWC)) [24] or a temporal change in CWC is used [25,26,27]. Changes in CWC by tree species within the context of biotic and environmental stresses has also been reported [22]. However, each of the above approaches has drawbacks in terms of calibration, imagery processing loads, resolution, cost, both up-scaling spatially or temporally, and down-scaling for mechanistic interpretations. One of our primary objectives in this study was to determine if the more limited, remotely sensed spectra that are commonly available to U.S. natural resource agencies could be used to identify physiological tree drought stress.
Physiological drought stress [28], ozone (O3) uptake, and nitrogen (N) deposition are persistent stresses in the Sierra Nevada, California. Both drought stress and O3 exposure cause oxidation of foliar pigments which can be seen macroscopically as chlorosis and chlorotic mottling, respectively [29,30]. Excess N deposition can aid repair of oxidized pigments, if sufficient soil water is available to permit nutrient uptake. All three stresses affect within-branch foliar retention, whole tree canopy structure, and the likelihood that a greater proportion of branch vs. foliage may be visible. These stresses also influence the incidence of insects [31], fungi [32,33], and parasites [34] with the potential to alter crown spectral reflectance.
The development of tree drought stress is well understood physiologically. Sequentially, a tree may be limited by water availability [35], evaporative demand exceeds conduction capacity resulting in cavitation [36], timing of guard cell response to other environmental changes [37], and both water and carbon balance are challenged [7,36,38]. Stomata close partially or wholly with moderate drought stress and foliage warms during the day due to reduced or lack of evaporative cooling. While leaves are retained, photosynthetic pigments are oxidized [39,40], cellular elasticity and light reflection is altered [9], and the proportion of foliage to branch temporally or spatially differ in comparison with trees less drought stressed. In its extreme, foliage dries out to the extent that water content significantly decreases, enzymes are denatured, and necrosis develops (tips die back, whole leaves, and whole growing points; [28]). At the whole tree level, leaf area is lost to balance drought-induced loss of fine root mass [41] and sapwood [42]. All of the above responses have the potential to change foliar temperature and its timing, and the intensity and hue of the reflected light: Changes that should be detectable using remote sensing tools at the appropriate scale.
Models that project forest growth through time are spatially and ecologically explicit [43] but are not currently parameterized for exceptional hot droughts. Dynamic vegetation models (DGVMs) accommodate environmental extremes but are not specific to year, place, or stand type [44]. Another approach designed to forecast forest susceptibility to insects and diseases combined history of observed attacks and tree mortality, with interpolated vegetative cover, but without the capacity to anticipate the impact of exceptional environmental stress [23]. A statistical forecast also used historical and observed annual attacks and tree mortality and quantified, multiple environmental stresses (some with time lags; [45]). Their approach, “re-trained” every year with new data, forecasts tree mortality at a surprising level of accuracy for an entire state (<2%; California), but only one year in advance at low resolution. Identifying trees at risk, in dry forests that range from woodlands to near-closed canopies requires delineating individual tree crowns with high resolution, multispectral imagery, measuring spectral signatures under both non-stressed and stressed conditions (two points in time or space), and correlating these signatures to on-the-ground, in-the crown tree health status. Here we develop and test a single point-in-time, sub-crown canopy detection of physiological tree drought stress within the context of concurrent environmental stresses—moderate O3 exposure and excess N.
The setting for this study has been previously described [28,46], as has the level of physiological drought stress of Jeffrey pine trees in xeric (X) and mesic (M) microsites and accompanying estimated O3 uptake. Half of the trees in each microsite received N amendment annually (background N, BN; background plus annual N amendments, +N). A strong correlation between crown morphology (foliar retention, needle and branch growth, and foliar discoloration) on one hand, and foliar antioxidants (chlorophyll, α-, β-carotene, lutein, neoxanthin, glutathione, and α-tocopherol), on the other hand, was reported [28]. In the latter publication, crown morphological and foliar antioxidants differed significantly with water availability and crown position. Because some antioxidants are foliar pigments detectable in the visible spectrum, and the effects of differences in transpiration may be detectable with the near-infrared (NIR) and thermal parts of the spectrum, we tested whether high resolution (R, NIR: 0.44; THERM: 2.2 m) imagery could differentiate trees with differing water and N availability. Two sites were used in this analysis, one to test for correlation between canopy morphological and spectral traits, and one to validate the approach.
2. Methods
2.1. Site Description
Intensively monitored, mature Jeffrey pines were distributed across a pine-dominated, all aged, mixed-conifer woodland with minor cover of Abies concolor, Quercus kelloggii, Pinus contorta, and rarely Pinus ponderosa and Juniper occidentalis. The understory ranged from absent (bare rock, soil, or litter) to sparse cover of Arctostaphylos patula or Chrysolepis chrysophila, to a nearly continuous cover of Salix, spp. near seeps, streams, and a river margin (Figure 1).
From 1998 to 2012, annual total precipitation averaged 106% of a 28-year record near the site [47]. Low precipitation in 1999 (73% of average) resulted in moderate physiological tree drought stress. Precipitation in 2004 and 2007 was low enough to cause severe physiological tree drought stress (57% and 60% of average, respectively) based on measurements of a closely related species, ponderosa pine [48] under similar precipitation patterns and substrate. The imagery was acquired in 8 August 2012, and crown measurements were made 7–10 August 2013, the 16th year of the long-term study and the second year of an exceptional drought in the south-central Sierra Nevada [2,49]. Ozone concentrations were high (averaging 59–75 ppb during the 12 h day over the growing seasons) [47]. Background N was relatively low, ~8 kg N/ ha−1yr−1 [50,51]. The calibration site was unmanaged, and the validation site was largely undisturbed.
2.2. Study Overview
In 1998, we initiated a study to test whether amended N mitigated O3 symptoms in mature Jeffrey pine (Pinus jeffreyii) on the west slope of the southern Sierra Nevada. Mature trees in M and X microsites (n = 64 in each) were intermingled across a south-facing slope (28 ha; 36°36′22.14″N, 118° 44′47.36″W; 2070 m), bounded by the Marble Fork of the Kaweah River on the south, Clover Creek on the west, and General’s Highway on the north, 2 km west of Lodgepole, California. M trees were acclimated to reliable water sources trapped in bedrock interstices or provided by underground springs [35]. X trees experienced less reliable pockets of water trapped in bedrock interstices. O3 exposure was assumed to be similar across the open stand, and O3 uptake was estimated to be 20% greater in M trees [46]. Half of the trees in each microsite were amended (+N) with ammonium nitrate each autumn (50 kg/ha−1yr−1) to simulate bulk input of N after the first several precipitation events [50], and half remained at background N levels (BN). This site was the calibration site used in the current study. An additional site for classification model validation was selected 45 km north (21 ha, 36°39′64.08″N, 118° 50′08.82″W; 1975 m) just west of Stoney Creek campground in Sequoia National Monument, where all trees were in M (n = 64), half BN and half +N. Mature Jeffrey pine averaged 32 ± 7 cm in bole diameter at 1.37 m, 104 ± 36 years old, and was 17 ± 5 m in height. Of the 128 trees in the calibration site, 79 survived to 2013. Of the 64 trees in the validation site, 61 survived to 2013. All trees were last observed in 2017.
2.3. Crown Morphological Traits
Crown morphological traits were chosen and assessed using an approach developed for ponderosa pine [30,52,53], and modified for use in Jeffrey pine [29,54]. Three to five branchlets per tree were pruned from the third or fourth secondary branch from the distal end of primary branches within the upper part of the lower crown, or the lower part of the mid crown (ca. 11–13 m). In some trees, the lower crown had self-pruned due to shading by adjacent trees, and previously “mid-crown” branches inadvertently became lower crown; these were pruned. Branchlets were pruned on the southern aspect, or if trees were crowded, on most exposed aspect, as exposed branches had greater vigor than those shaded and represented the maximum capacity of the tree within that microsite.
Pruned branches were assessed and the following traits related to tree carbon-balance were recorded, as illustrated in Appendix A, and briefly described in Appendix B: The number of needle ages retained (WHL), level of needle chlorosis [29] or chlorotic mottle [30] expressed in per cent from ocular estimate relative to bright green healthy needles by year up to 6 years (e.g., CHL4 for four year old needles), and branchlet diameter at the base of prior year growth (BRDIA2). Similarly, traits related to tree water balance were measured: Current year needle elongation growth relative to longest needles retained on the branchlet (%MxNL; see 53), branchlet length (BRLN), proportion of branchlet with attached needles (%FOLLN), frequency of male strobili (drought may impact frequency: Loblolly pine [55]; pinyon pine [56]), and whole-tree evidence of early loss of needles (early senescence (ES)). Needle loss of older needles throughout the canopy, occurring in July instead of September, is drought related, and not necessarily accounted for by WHL. Recorded traits associated with tree susceptibility to pests included: Leaf defoliators (LF DF, frequency of scale (Chionaspis, spp.) plus frequency of weevil (Scythropus, spp.), presence/absence of needle cast fungus (Elytroderma deforma), and dwarf mistletoe rank (DMR) (whole tree ranks of dwarf mistletoe; Arceuthobium campylopodum); 0 to 6, [57]. Although bark beetle resulted in some tree mortality early in the study (1999–2003), few trees succumbed in subsequent droughts (2004, 2007, 2012–2016) at these two sites and occurrence was not frequent enough to permit statistical analysis.
2.4. Remote Sensing and Imagery Processing
Remote-sensing measurements employed FireMapperTM 2.0, a thermal-imaging radiometer and two Kodak MegaPlus 1.6i digital cameras mounted for nadir viewing aboard a King Air A100 aircraft. The FireMapperTM, designed and constructed by Space Instruments, Inc., incorporates two narrow-band channels for imaging the intense thermal radiation associated with wildland fires and an 8- to 12.5-micrometer broadband channel useful for measuring upwelling radiation typically associated with earth resources [58,59]. The linear functional response of the FireMapperTM 2.0 to the radiance of a reference-standard, high-temperature cavity blackbody (Electro Optical Industries) was determined in the laboratory, and a through-the-lens offset calibration with a passive blackbody was made immediately before image collection in flight to determine the y-intercept of that function. During image processing, 14-bit digital numbers from the microbolometer focal-plane array on the FireMapperTM were converted to radiance with the composite calibration function and an equivalent blackbody temperature (THERM) was calculated from the Planck function. Monochrome Kodak 1.6i cameras were filtered to allow measurement of reflected red light at 650 nm (R) and near-infrared light at 860 nm (NIR) wavelengths. Imagery was collected 1:21 to 1:26 PDT, 0.38 h after solar noon, 8 August 2012 from an altitude of ca. 1160 m, providing ground resolution of 2.2 m in the THERM band and 0.44 m in both R and NIR. An example of the composite R, NIR, and THERM imagery (in RGB) of our field calibration site is given in Figure 1.
A temporal sequence of increasing foliar temperature (THERM) of two mature Jeffrey pines from 10:30 to 12:00 under physiological drought stress and sequential stomatal closure, lower to upper crown, is shown in Figure 2, at a lateral distance of 2.5 km (similar to [60]). The imagery was printed and the location of each intensively studied tree was verified in the field across the calibration site (Figure 1). The imagery was displayed in ArcGIS software [61], with the shaded portion of each tree excluded (Figure 2, right). The upper crown (top of the tree to ½ the radius of the sunlit portion) and upper part of the mid-crown (the exterior ½ radius of the sunlit portion) was segmented. A 2.2 m buffer (1 thermal pixel) was eliminated around the exterior edge of the mid-crown to reduce potential contamination by ground cover. Within each segment, x:y coordinates of sample points were selected using “create random points”, and the intensities of the R, NIR, and THERM were extracted. A subsample of 30 points per crown portion was sufficiently representative, as the mean of 30 points did not statistically differ from that of 130 points (p < 0.05). The crown spectral traits were the reflective intensities of R, NIR, THERM, and two indices, (NDVI), and its inverse, NIR scalar (NIR SC, (R − NIR)/(NIR + R)). The intensity of the wavelengths and indices were reported for the upper crown (e.g., R TOP), the upper surface of mid crown (e.g., R MID), and their difference (e.g., R TOP − R MID, R Δ). There was a discrepancy in sampling morphological traits in the lower portion of the mid crown (11–13 m) and in the spectral traits in the upper portion of the mid crown (14–15 m). For the purposes of this study, we assumed that the health of the mid crown was similar from lower to upper mid crown [62].
2.5. Analysis Approach
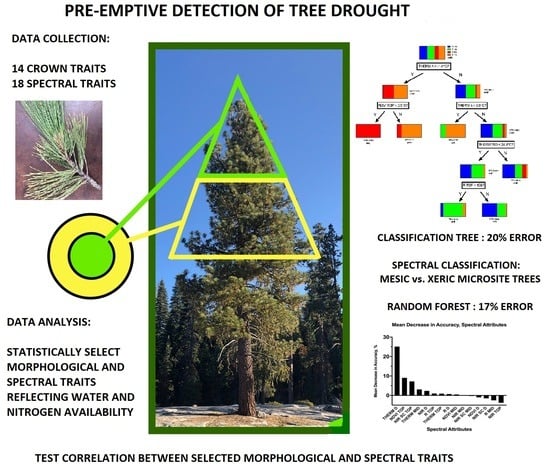
A graphical presentation of the data analyses is given in Figure 3. The overall objective of this study was to identify thresholds of spectral traits to differentiate Jeffrey pine with or without adequate soil water availability, and with or without N amendment. Because of our relatively small sample size, the multivariate analysis approaches used here are vulnerable to the effects of outlier data points, which may artificially distort correlations. To minimize this issue, we took a liberal approach to identifying and replacing outliers. For each of the traits, we eliminated any data point with a |Z score| > 2. Among the entire data set (32 traits, 79 trees ~2500 total observations) we identified 105 outlier values. For trees with one or two outlier trait observations, the outlier values were replaced with the mean value for its treatment group (M BN, M+N, X BN, X+N). However, 35 of the outlier observations, mostly concentrated within spectral traits, were found in seven trees. Because these trees were highly anomalous, substituting several outlier values would result in substantial, artificial reduction of within-group variance. These seven trees were removed from all multivariate analyses.
At the calibration site, 66 trees with both morphological and spectral traits remained for classification and analysis after outliers and those that could not be resolved in the imagery were removed. Following similar filtering, 45 trees at the validation site remained. A systematic multivariate approach [63] is described below. We also used random forest (RF; [64,65]) to model the dependent variable (water availability, with N added or no) with the suite of morphological and spectral predictors.
In order to explore relationships among and between morphological and spectral traits, the following systematic multivariate data analysis approach was conducted: All morphological and spectral traits were evaluated for significant differences at the p < 0.05 level with 2-way ANOVAs (N level nested under water availability). Traits with significant differences were explored with principal components analysis (PCA; [66,67]) conducted separately on morphological and spectral traits, to identify groups of traits that captured a substantial amount of the multivariate data structure. Then tests for significant correlation between the selected groups of morphological and spectral traits were conducted using canonical correlation analysis (CCorA, [66]), a critical step for remote sensing interpretation and validation.
Spectral traits selected by this approach and supported by the CCorA were submitted to a classification tree routine (“classification tree model” (CTM) [68]), an analysis equivalent to a classification and regression tree (CART, [69]). The recursive data partitioning technique which optimizes classification decisions was applied to the spectral traits to define the sequence of thresholds to sort trees into M or X and BN vs. +N. The CTM developed at the calibration site was then applied to spectral data from a second site as a partial validation. As described above, all trees at the second site were in mesic microsites, with BN or +N.
Random forest is an ensemble machine-learning approach that consists of many classification trees constructed with random permutations of both the predictors and the input data points. RF classifications are independent of data assumptions, can handle missing values and data types (categorial, ordinal, continuous), and resist overfitting [65]. Each tree is built with a randomly selected sub-set of predictor variables and a randomly selected (with replacement) subset of 2/3 of the training data points (bootstrap sample). This is called “bagging”, short for bootstrap aggregating. Error is estimated by running each of the withheld data points through the tree and if the point is classified correctly, that tree is considered a correct classification. The prediction error of the forest is estimated as the number of times withheld points are run through the tree and classified incorrectly; this is the out-of-bag (OOB) error estimate we report. An error matrix is produced by comparing the predictions with the actual classes for the input data points. The importance of a variable is estimated by shuffling the predictor while keeping the order of the other predictors the same. The importance is expressed as the mean decrease in accuracy (MDA) of the model if the predictor is removed. The correctly classified OOB points are then run through this tree and the MDA that results from shuffling the predictor is calculated. In contrast to the systematic analysis approach described above (ANOVA, PCA, CCorA, CTM), all morphological and spectral crown traits were submitted to RF.
3. Results
3.1. Crown Morphology
The means for normally distributed traits, and medians for nominal traits (e.g., Elytroderma, DMR, ES) are reported in Appendix B. Significant differences of a two-way analysis of variance (ANOVA) for N level nested within microsite water availability is reported in Table 1a. Only four crown morphological traits significantly differed between water availability levels (M, X). Two were related to carbon balance (CHL4, BRDIA2), and two were related to tree susceptibility to insects and a parasite (the LF DF and DMR). Only one trait, LF DF, differed significantly in background vs. N amended trees (BN vs. +N), as well as for the interaction term between water and N availability (H2O * N).
Two insect defoliators (needle scale, a phloem feeder; and weevil, a leaf eater), a needle fungus (needle blight), and dwarf mistletoe were common in Jeffrey pine at our field sites. The combined frequency of the two needle defoliators (LF DF) was greater in M trees but was ameliorated in both microsites by +N. DMR was mostly absent in M trees, and +N ameliorated dwarf mistletoe in X trees by 40%. Dwarf mistletoe infection causes structural changes in infected branches (not captured in other metrics), as well as foliar retention and color changes in uninfected branches throughout the crown [34].
It is likely that drought, O3 exposure, and N deposition altered plant resources and defenses (e.g., foliar chemistry and palatability) uniquely [3]. The frequency of weevils was greater in M vs. X trees, and in BN vs. +N trees in each of the two water availability levels (individual leaf defoliator data not presented). Needle scale responded to N availability (greater in BN than +N) but not to water availability itself. Needle blight was more frequent in X than M trees, as was dwarf mistletoe (DMR). +N reduced needle blight frequency in X trees by 28%. Needle blight primarily infects the lower crown and it was unlikely that blight-affected branches would have been detected in the imagery. However, differences in tree physiological status that increase susceptibility to needle blight in the lower crown may be present higher up in the crown.
3.2. Multivariate Analysis of Morphological Traits
Principal component analysis was used to explore how crown traits with significant differences in the two-way ANOVA (CHL4, BRDIA2, LF DF, DMR) were related in multivariate space. Trait loading for the first four principal components are presented in Figure 4. BRDIA2 and DMR were similar in the multivariate space, but they are completely different types of traits (C-balance based vs. pest susceptibility), and, so, both were included. The cumulative variation explained by the first two axes was 63% indicating a moderate level of multivariate correlation between them. Although many combinations of traits were additionally tested (similar to [25]), the initial traits identified in the two-way ANOVA explained the greatest variance in the crown morphological data.
RF was also used to sort the relative importance (MDA) of morphological traits in predicting water and N availability to trees. Five traits significantly contributed to the model: DMR, LF DF, BRDIA2, % MxNL1, and Elytrodermis frequency (Figure 5). The full RF model (e.g., H2O * N) was poor with a high OOB error rate of 46%. The model for predicting M vs. X trees was equally poor, with an OOB error rate of 40%. Prediction of “not mesic” microsite trees was poor, similar to classification of “low vigor” vs. “not low vigor” ponderosa pine using RF [70]. The test for N availability was successful, with an OOB error rate of 6%.
3.3. Crown Spectral Traits
Four crown spectral traits significantly differed in M vs. X trees: R TOP, NDVI TOP, NIR SC TOP, and THERM Δ (Table 1b). Spectral traits did not differ significantly with N availability, nor was the interaction term (H2O * N) significant. Three of the selected traits were related to high upper crown productivity (R TOP, NDVI TOP) and concomitantly, transpiration (NIR SC TOP). The common index of productivity, NDVI, as well as NIR SC TOP was greater in M than in X trees (Appendix B). R reflectance was greater in X trees (e.g., less R absorbed in photosynthesis). The difference in temperature between upper and mid crown was much greater in X than M trees. The sign of THERM Δ was negative: The upper crown was cooler than mid crown in X trees by ~1.4 °C, suggesting that mid crown transpiration was lower (see Figure 2). The vigor of the upper crown has the highest priority for resources. The upper crown has a higher concentration of the hormone auxin, attracts more sugars, which in turn decreases osmotic potential, increasing its ability to draw and retain water. Mesic trees had little difference between upper and mid crown foliar temperature.
3.4. Multivariate Analysis of Spectral Traits
The four spectral traits identified as significantly different between treatment group by the two-way ANOVA were further analyzed with PCA, but the principal components did not capture a significant amount of variance. Subsequently, through an iterative process, various combinations of all available spectral traits were submitted to PCA. Although many results were similarly significant, a group of five traits was selected, which resulted in a highly coherent multivariate data structure that was well captured by the reduced dimensionality of PCA. Three of the traits used in the final spectral PCA were identified in the ANOVA (R TOP, NDVI TOP, THERM Δ), and two were added (NDVI Δ and THERM MID). The first two principal components captured 71% of the total crown spectral variance for those five traits. All five traits were well separated in the PCA space, indicating distinct individual contributions to the data structure. Spectral trait loading on the first four principal components are presented in Figure 4.
All 18 spectral traits were used to model site (X or M) and N addition with RF. Nine of the 18 traits were above 0% MDA, with THERM Δ, NDVI TOP, NIR SC TOP, THERM MID, NIR Δ, and R TOP contributing the most to model accuracy (in order; Figure 5). The full model (H2O * N), and the BN vs. +N model were poor (both with an OOB error rate of 54%). Despite the lack of separation based on morphological traits with RF, spectral separation of M and X trees had an OOB error rate of 17%.
In a similar analysis of differing levels of tree vigor in ponderosa pine [70], the top four spectral explanatories were bands B and NIR, and standard deviations of indices NDVI and EVI, also derived from fixed-wing imagery (R, G, B, and NIR). The next two best explanatories were the standard deviation of RCC (RCC SD) and NDVI mean, suggesting that variability in crown structure was a definitive trait. In this study, M BN trees had lower within-tree standard deviation than X BN trees in all bands (R, NIR, THERM), in both mid and upper crown, except for NIR TOP, which had greater variability (data not presented).
3.5. Correlation of Morphological and Spectral Traits
A canonical correlation analysis was performed to evaluate multivariate correlation between the set of morphological and spectral traits suggested by the best fit PCAs. We found a highly significant correlation among the tested groups of traits, according to all four tests of CCorA (Table 2). Correlating in-the-crown morphological traits, to remotely sensed spectral characteristics is a critical step in calibration because it demonstrates the mathematical relationship between the observed spectral radiance and well-validated traits of the underlying tree physiology. The separation of the four groups of trees (M BN, M+N, X BN, and X+N) using morphological and foliar antioxidants in a CCorA for the same trees (under little or no physiological drought) was previously described [29].
3.6. Classification Tree Model Outcome
To develop a tool for managers to use remotely sensed crown traits to detect tree drought stress and/or N availability, a classification tree model was constructed using the spectral traits selected by both ANOVAs (Table 1) and PCA (Figure 4), and also strongly correlated to crown morphological traits (Table 2). We used an automated, recursive partitioning method to optimize tree classification by treatment group. The resulting classification was achieved by a four-trait model, which included THERM Δ, THERM mid, NDVI top, and R top (Figure 6).
Trees with differing water availability (M and X) were successfully sorted, generating a pure X tree branch of the CTM with THERM Δ < −1.4 °C, and with THERM Δ > −1.4 °C selecting a group of trees that was 80% mesic. The pure X branch was further separated into X BN with no error by NDVI top < 0.515 (lower upper crown productivity), and X+N with 18% error. An additional separation using THERM Δ > 0.9 °C identified X+N trees (80% correct) from a mixed mesic group (M BN and M+N, combined 87%). THERM mid < 24.8 °C and R top < 108 (included one tree that had missing R) identified a terminal tree branch of 78% M+N, but all other classification tree branches were termini of mixed M trees (M BN, M+N). Xeric trees could be separated into X BN and X+N with NDVI top, THERM mid, and R top.
Applying RF to the spectral data set, THERM Δ, NDVI top, NIR SC top, THERM mid, and NIR Δ were selected (in decreasing importance; Figure 5), before additional traits did not add to model accuracy. Similar to the CTM, RF was also effective in spectrally separating M vs. X trees, with an overall OOB error rate of 17%. RF was poor at separating BN from +N trees in either microsite (OOB error, 42%), and the overall accuracy of the full model (H2O * N) was poor (OOB error, 55%).
The spectral CTM developed at the calibration site was then used to classify an additional set of trees at the validation site. The validation was considered partial, as only M BN and M+N trees were intensively studied at this site. The CTM developed for the calibration site was able to sort the trees as all M using only THERM Δ as the primary selection, with 98% accuracy. In the first division (THERM Δ < −1.4 °C), one M+N tree was misclassified as X (2% error), and 47/48 trees were placed in the three right hand termini of the calibration CTM (Figure 6; validation CTM not shown): Mixed groups of M BN and M+N trees. N levels in M trees at the validation site were unable to be differentiated with either model. The one tree erroneously classified as X had been attacked by flat headed wood borer (Buprestidae) but did not succumb as last observed in 2017. Both the calibration and the validation trees seemed to follow a similar clustering pattern, with each terminal cluster showing the same bias for either M BN or M+N trees.
4. Discussion
The roles of water- and N-availability on carbon-related, water-related, and insect, pathogen, and parasite frequency in mature Jeffrey pine crowns were investigated within the context of concurrent stresses (O3, background N deposition). Selected trees in mesic and xeric microsites were often adjacent due to underground disparities in access to reliable water resources. Described for these trees previously, X trees experienced earlier onset, more severe, and longer duration of physiological drought stress over a growing season than M trees [46]. O3 exposure was assumed to be similar across microsites due to openness of the forest. M trees experienced an estimated 20% greater O3 uptake over the growing season, which could decrease tree carbon acquisition and allocation to roots [71,72], with the latter increasing the likelihood of tree drought stress [48]. O3 concentrations recorded near this site were likely to impair photosynthetic capacity and, thus, decrease stomatal conductance [73], but were not high enough to increase nocturnal water loss due to incomplete or sluggish stomatal closure [74]. The level of N amendment was chosen to be comparable to that associated with a similar level of O3 exposure east of Los Angeles, but accumulated over a longer period (50 years, transverse range [51,72] vs. 30 years, this area [54]).
The statistically significant responses of crown morphology to these stresses included degradation of photosynthetic pigments (needle chlorotic mottle or chlorosis), and increases in branchlet diameter, needle defoliators, and dwarf mistletoe of X trees as tested under the challenge of the onset of a severe drought. Prior analyses of crown morphological traits of the same trees in an above-average precipitation year [29] supported the choice of chlorotic mottle and branchlet diameter, but also included two traits of foliar retention (years of foliage retention; proportion of the branchlet with live needles). In a similar analysis to identify crown morphological traits associated with tree vigor in a closely related species, ponderosa pine [53], three of the traits were shared with the present study (BRDIA2, CHL4, DMR). In this study differentiating X and M trees, statistically selected Jeffrey pine crown traits were those associated with carbon balance (branchlet diameter growth), water balance (drought-induced foliar pigment oxidation), and susceptibility to insects and parasites (frequency of leaf defoliators, DMR), but not elongation growth (branchlet, needle) which is commonly associated with water balance.
4.1. Effects of Environmental Stresses on Crown Morphology
Chlorosis and/or chlorotic mottle in 4-yr old needles (CHL4) was significantly greater in X vs. M trees. Chlorotic mottle due to O3 exposure [75] and uptake [76], and chlorosis due to physiological drought stress, both oxidative stresses, are difficult to separate visually but not biochemically [29]. Although M trees had greater estimated O3 uptake, they may have had greater access to resources and capacity for repair. Conversely, drought stress may have exacerbated CHL4 in X trees with less access to resources and lower capacity for repair.
Diameter at breast height (DBH) and basal area increment (BAI) (relative to crown leaf area) are primary metrics for assessing tree vigor [77,78]. In ponderosa pine, branchlet diameter was highly correlated with BAI in a heavily polluted site [54]. In this study with moderately high air pollution, BAI was always lower in X than M trees [46]. Branchlet diameter of prior year growth was lower in X than M in an average precipitation year [28] but was significantly greater in X trees with the onset of severe drought year in the same trees. Extreme drought stress may restrict carbon allocation to needle and branchlet growth sinks. Similarly, O3 uptake differences in the two years (less uptake in drought years) may have influenced flexibility of this trait, as it decreases branch diameter and BAI in Norway spruce [79] and loblolly pine [80].
In this study, needle defoliators (LF DF) were less frequent in X trees; N amendment further decreased their frequency to near zero in both microsites. Incidence of dwarf mistletoe was much greater in X trees, which causes increased patchiness [34] of foliage quality and density as well as changes in branch structure. The presence or absence of these pests suggest changes in foliar chemistry, tree water status, and resource availability. Moderate drought stress is associated with greater insect frequency due to (slight) increases in concentrations of N, amino acids, and/or carbohydrates [81], likely also affecting resin quality [82]. Severe physiological drought stress affects foliar palatability (tissue toughness, amino acid chelators), and nutritional content (decreased protein and carbohydrates) [3,81]. Severe drought stress can also deleteriously alter life cycles of feeding insects, as foliar N concentration can become toxic for growth and fecundity (see LF DF, Appendix B; [83]). O3 can affect defoliators (Scots pine, [84]), and frequency of foliar fungi [85], although effects varies with concentration, plant vigor, and nutrient status. O3 can increase, decrease, or have no effect on insect fecundity or other insect life stages; it may alter the degree of predation and “tri-trophic” interactions (host, insect, and insect predation) [86].
A study of foliar insect abundance and richness in ponderosa pine was conducted across a well-studied air pollution gradient of O3 concentration and N deposition during a severe drought in the Transverse Range [87]. Species abundance and richness was highly variable and declined only in the fourth year of drought. N amendment significantly increased the proportion of trees affected by beetles at the low pollution site, but at the high pollution site, additional N decreased the proportion of trees affected [87] possibly demonstrating N toxicity to the beetles [83]. In our study, successful bark beetle attacks had already caused mortality during the 1999–2002 drought, and subsequent kills did not occur in sufficient numbers from the more recent, extreme drought (2012–2016) to statistically assess in this analysis. All trees in our analysis had survived to 2017 as last observed.
4.2. Spectral Delineation of Environmental Stresses
This study was focused on utilizing the relatively few bands commonly available to land managers in order to identify trees “at risk” of drought stress and more likely to be susceptible to extreme drought events or multiple years of chronic stress, and successful bark beetle attack. Considerable effort was made to link crown morphological traits relevant to tree physiological status, to crown spectral features detected aerially. The temperature difference between upper and mid crown (THERM Δ) was effective in differentiating M and X trees with a classification tree model in an unmanaged stand. THERM Δ accounted for most of the accuracy in random forest, a commonly used model in object classification, but upper and mid crown R and NDVI also contributed to the significance of the model. A relatively small difference in upper vs. mid crown temperature (1.4 °C) was detectable at ~1200 m altitude and was successful in classifying complex mature pine crowns into those with adequate vs. limited water resources.
Trees with greater resource availability maintain higher photosynthetic pigment concentrations (greater absorption of R, greater NDVI), greater stomatal conductance with concomitant evaporative cooling (THERM, THERM Δ), and more favorable foliar water status (lower reflectance of NIR; greater NIR SC). The spectral reflectance of the upper crown was prioritized in both the CTM and RF. Interestingly, LIDAR-derived, upper crown structural features were definitive of root disease and individual tree decline as well [88]. Trees responded differently to N availability in the two water availability levels, which likely reduced the significance of the full statistical model (H2O * N) in both CTM and RF.
The selection of traits in both crown positions is relevant: Remotely sensed foliar temperature as well as the difference between crown positions elucidate underlying tree physiological status. If the top crown temperatures were similar to mid crown, and the temperature suggests “cooling” (transpiring) relative to other trees, the tree is likely not drought stressed. If the upper crown is cooler than mid crown (at midday; see Figure 2), it suggests that the tree is more drought stressed: Stomatal conductance in lower and mid crown is reducing transpiration and, thus, needle temperatures are increasing due to insufficient water availability and/or transport. If the upper crown temperature is similar to mid crown, and leaf temperatures are elevated relative to M trees, or to the same tree in early morning or earlier in the growing season, the tree is drought stressed. THERM MID or THERM TOP, in addition to THERM Δ permits remote detection of the physiological drought status of the tree. Within-crown differences or lack thereof, and absolute foliar temperature support the interpretation and could be utilized in remote sensing applications. In order to accomplish this, imagery should be collected around the time of maximum seasonal and daily evaporative demand. THERM Δ alone is not sensitive to differences in foliar temperature between sites and ultimately using this trait will require less calibration or relevance to air temperature.
The detection of tree mortality has been actively and successfully pursued by the remote sensing community. Canopy decline and mortality can be captured using visible and NIR bands and related indices at several scales from leaf (spectrophotometer, drone-mounted imagers) to landscape scales (AVIRIS, LandSat, MODIS) usually with repeat measures, but also with point-in-time imagery [21,89]. “Early decline” in hemlock from hemlock woolly adelgid was detected with two collection dates, a decade apart (with AVIRIS [90]). Many visible and NIR band imagery sources at leaf to landscape scales can differentiate live green leaves [91] or stands comprised of primarily live trees (Landsat [18]; MODIS [19,92,93]) from dead ones. Subtle changes in crown color such as green to yellow were detected with a single collection date (crown level resolution with AVIRIS [94]). Subtle foliar changes due to mild infections of leaf blotch were detected with hyperspectral imaging in a tree crop [32] primarily through bands associated with drought stress (thermal) and photosynthetic impairment (R, NDVI).
Other than hyperspectral imagery, there are relatively few remote sensing studies that detected subtle differences in tree physiological status. Weeks before it could be seen, mild infections of pathogens were detected spectrally (reviewed in [95]). Subtle and severe crown discoloration were also differentiated in Jack pine with budworm infestation using only a few wavelength bands [96]. In this study, an estimated 20% difference in transpiration between trees in M vs. X microsites was detected by a small difference (<1.4 °C) in upper to mid-crown temperature. The difference in needle defoliators between the two N levels in X trees (Appendix B; Figure 6) may have been spectrally detected via tissue quality (such as for tropical tree species [22]).
Crown moisture content has been correlated with physiological drought stress [26], but frequently, physiological drought stress is only inferred. Lower leaf water content identified spectrally by an increase in NIR reflectance is not necessarily definitive for physiological tree drought stress [38,97,98]. In degrees, physiological drought stress is defined by reductions in stomatal aperture for part or most of the day, decrease in cellular osmotic potential to control loss of cellular water, reduced or loss of cell turgor, decreased cell elongation, drop in relative water content, and in severity, the above plus a change in enzymatic function and necrosis [28]. Of these components, reduced stomatal aperture, decreased transpiration, and a concomitant increase in foliar temperature is definitive alone, but also when compared spatially (within-crown differences with mid crown more stressed than upper crown, or in X vs. M trees) or temporally (early vs. late season, or morning vs. noon).
Our reported differences in crown morphology were highly correlated to R, NDVI, and NIR SC (the inverse of NDVI) of the upper crown. Mesic and xeric trees could be differentiated based on the difference in upper vs. mid crown needle temperature (Δ < −1.4 °C) with both CTM and RF. The ability to use within-crown differences in temperature is an effective way to avoid the need for repeat measures, or absolute crown or air temperatures [99], although the latter provides additional information on physiological status. The difference in needle temperature between the upper and mid crown was significantly greater in X trees and increased with N amendment. In contrast, there was little difference between upper and mid crown in M trees (<0.9 °C), with or without N amendment. Perhaps with more available water, M trees also have greater access to other resources and/or through-put of mineral-rich water. The effects of N amendment could be detected only in X trees with NDVI Δ, suggesting mitigation of O3 injury with N amendment (NDVI TOP greater in +N trees). This subtlety could be useful in detecting excess N deposition of Jeffrey pine in dry sites and/or at lower elevations. THERM Δ satisfactorily differentiates trees in M vs. X microsites and could be used by managers as a single metric for identifying trees “at risk”.
LIDAR is readily, extensively available to public land managers, and the relationship between structural changes in the upper crown, and tree vigor and physiological drought stress should be further investigated. Thermal imagery is becoming more readily available on some US agency aerial platforms (FIA). Thermal imagery can also be requested for concurrency with USDA Forest Service biannual flights, useful for landscape-level surveys at a sub-crown resolution. Although multispectral imagery is frequently obtained with drones to inform forest management, and may include thermal imagery, the imagery is inherently more susceptible to wind during flights, takes more time and cost per acre to obtain and process, but is appropriate for sub-landscape, high value, stand management. For assessing quality of natural resources at the landscape level, relatively few bands are preferable due to less data management.
The approach described here was calibrated at one location and applied to another location 45 km distant for a partial validation. More than half of the morphological and spectral traits statistically selected were shared between two closely related pine species, in this study and another study [53,70] separated by 1000 km. The physiological response of temperate conifers to hydrologic deficits should be consistent: Transpiration, and maintenance of photosynthetic capacity of the crown should decline acropetally, with the upper crown the last to decline. Thus, sub-crown resolution of the imagery under the challenge of drought stress contributed to the success of our approach. Additional studies of high value, coniferous species under the challenge of physiological drought stress (spatial or temporal) is needed to confirm that the results reported here can be applied more broadly.
5. Conclusions
The overall objective of this study was to identify thresholds of spectral traits to differentiate mature Jeffrey pine with differing access to soil water and N availability, within the context of moderately high O3 exposure and low N deposition. In xeric microsites, Jeffrey pine had degraded photosynthetic pigments (needle chlorotic mottle or chlorosis), greater branchlet diameter, and high frequency of needle defoliators and dwarf mistletoe. N amendment decreased the frequency of needle defoliators of trees in both mesic and xeric microsites. The impact of these changes in crown morphology were highly correlated to the difference in temperature between the upper and mid crown, which was greater in xeric microsite trees. Upper crown NDVI and R could be used to detect greater N availability of trees in xeric sites. In contrast, there was little difference between upper and mid crown in mesic microsite trees. Trees in mesic and xeric microsites could be adequately differentiated (80% accuracy) based solely on the difference in upper vs. mid crown temperature using a classification tree model, or with additional spectral traits with random forest (83% accuracy). More than half of the morphological and spectral traits statistically selected for Jeffrey pine in this study were shared with those of ponderosa pine, a closely related pine species, in another study 1000 km to the north. Remote detection of physiological drought stress in mature Jeffrey pine, using a few wavelengths available to federal and state agencies, could be used to identify “at risk” Jeffrey pine: Those more likely to be susceptible to extreme drought events or multiple ears of chronic stress. Sub-crown resolution, and imagery acquisition at the time of maximum diurnal and seasonal drought stress contributed to the success of our approach.
Author Contributions
Conceptualization, N.G. and P.R.; Data curation, N.G. and J.M.; Formal analysis, J.M. and C.S.-P.; Funding acquisition, N.G.; Investigation, N.G. and P.R.; Methodology, N.G., J.M., P.R. and C.S.-P.; Project administration, N.G.; Resources, N.G.; Software, P.R.; Supervision, N.G.; Validation, N.G. and J.M.; Visualization, N.G., J.M., P.R. and C.S.-P.; Writing—original draft, N.G. and C.S.-P.; Writing—review & editing, N.G., J.M., P.R. and C.S.-P. All authors have read and agreed to the published version of the manuscript.
Funding
This project was supported in part by DISPRO (PMIS # 119202), a joint U.S. Environmental Protection Agency and National Park Service funding from 1998 to 2002, and NIFA 2007-35101-18144 from 2007 to 2009 awarded to the senior author. From 2011–2017, funding was provided by the Western Wildlands Environmental Threats Assessment Center, of the USDA Forest Service.
Acknowledgments
We thank Annie Esperanza for support of all phases of this investigation. Elizabeth Ballenger selected all of the trees for this study based on BAI patterns, age, and size criteria. Lisa Balduman and Mac Goelst graciously assisted in assessing crown morphology. This information is distributed solely for the purpose of pre-dissemination peer review under applicable information quality guidelines. It has not been formally disseminated by the Forest service. It does not represent and should not be construed to represent any agency determination or policy.
Conflicts of Interest
The authors declare no conflict of interest.
Appendix A. Crown Morphological, and Insect and Disease Traits on Branchlets
Figure A1.
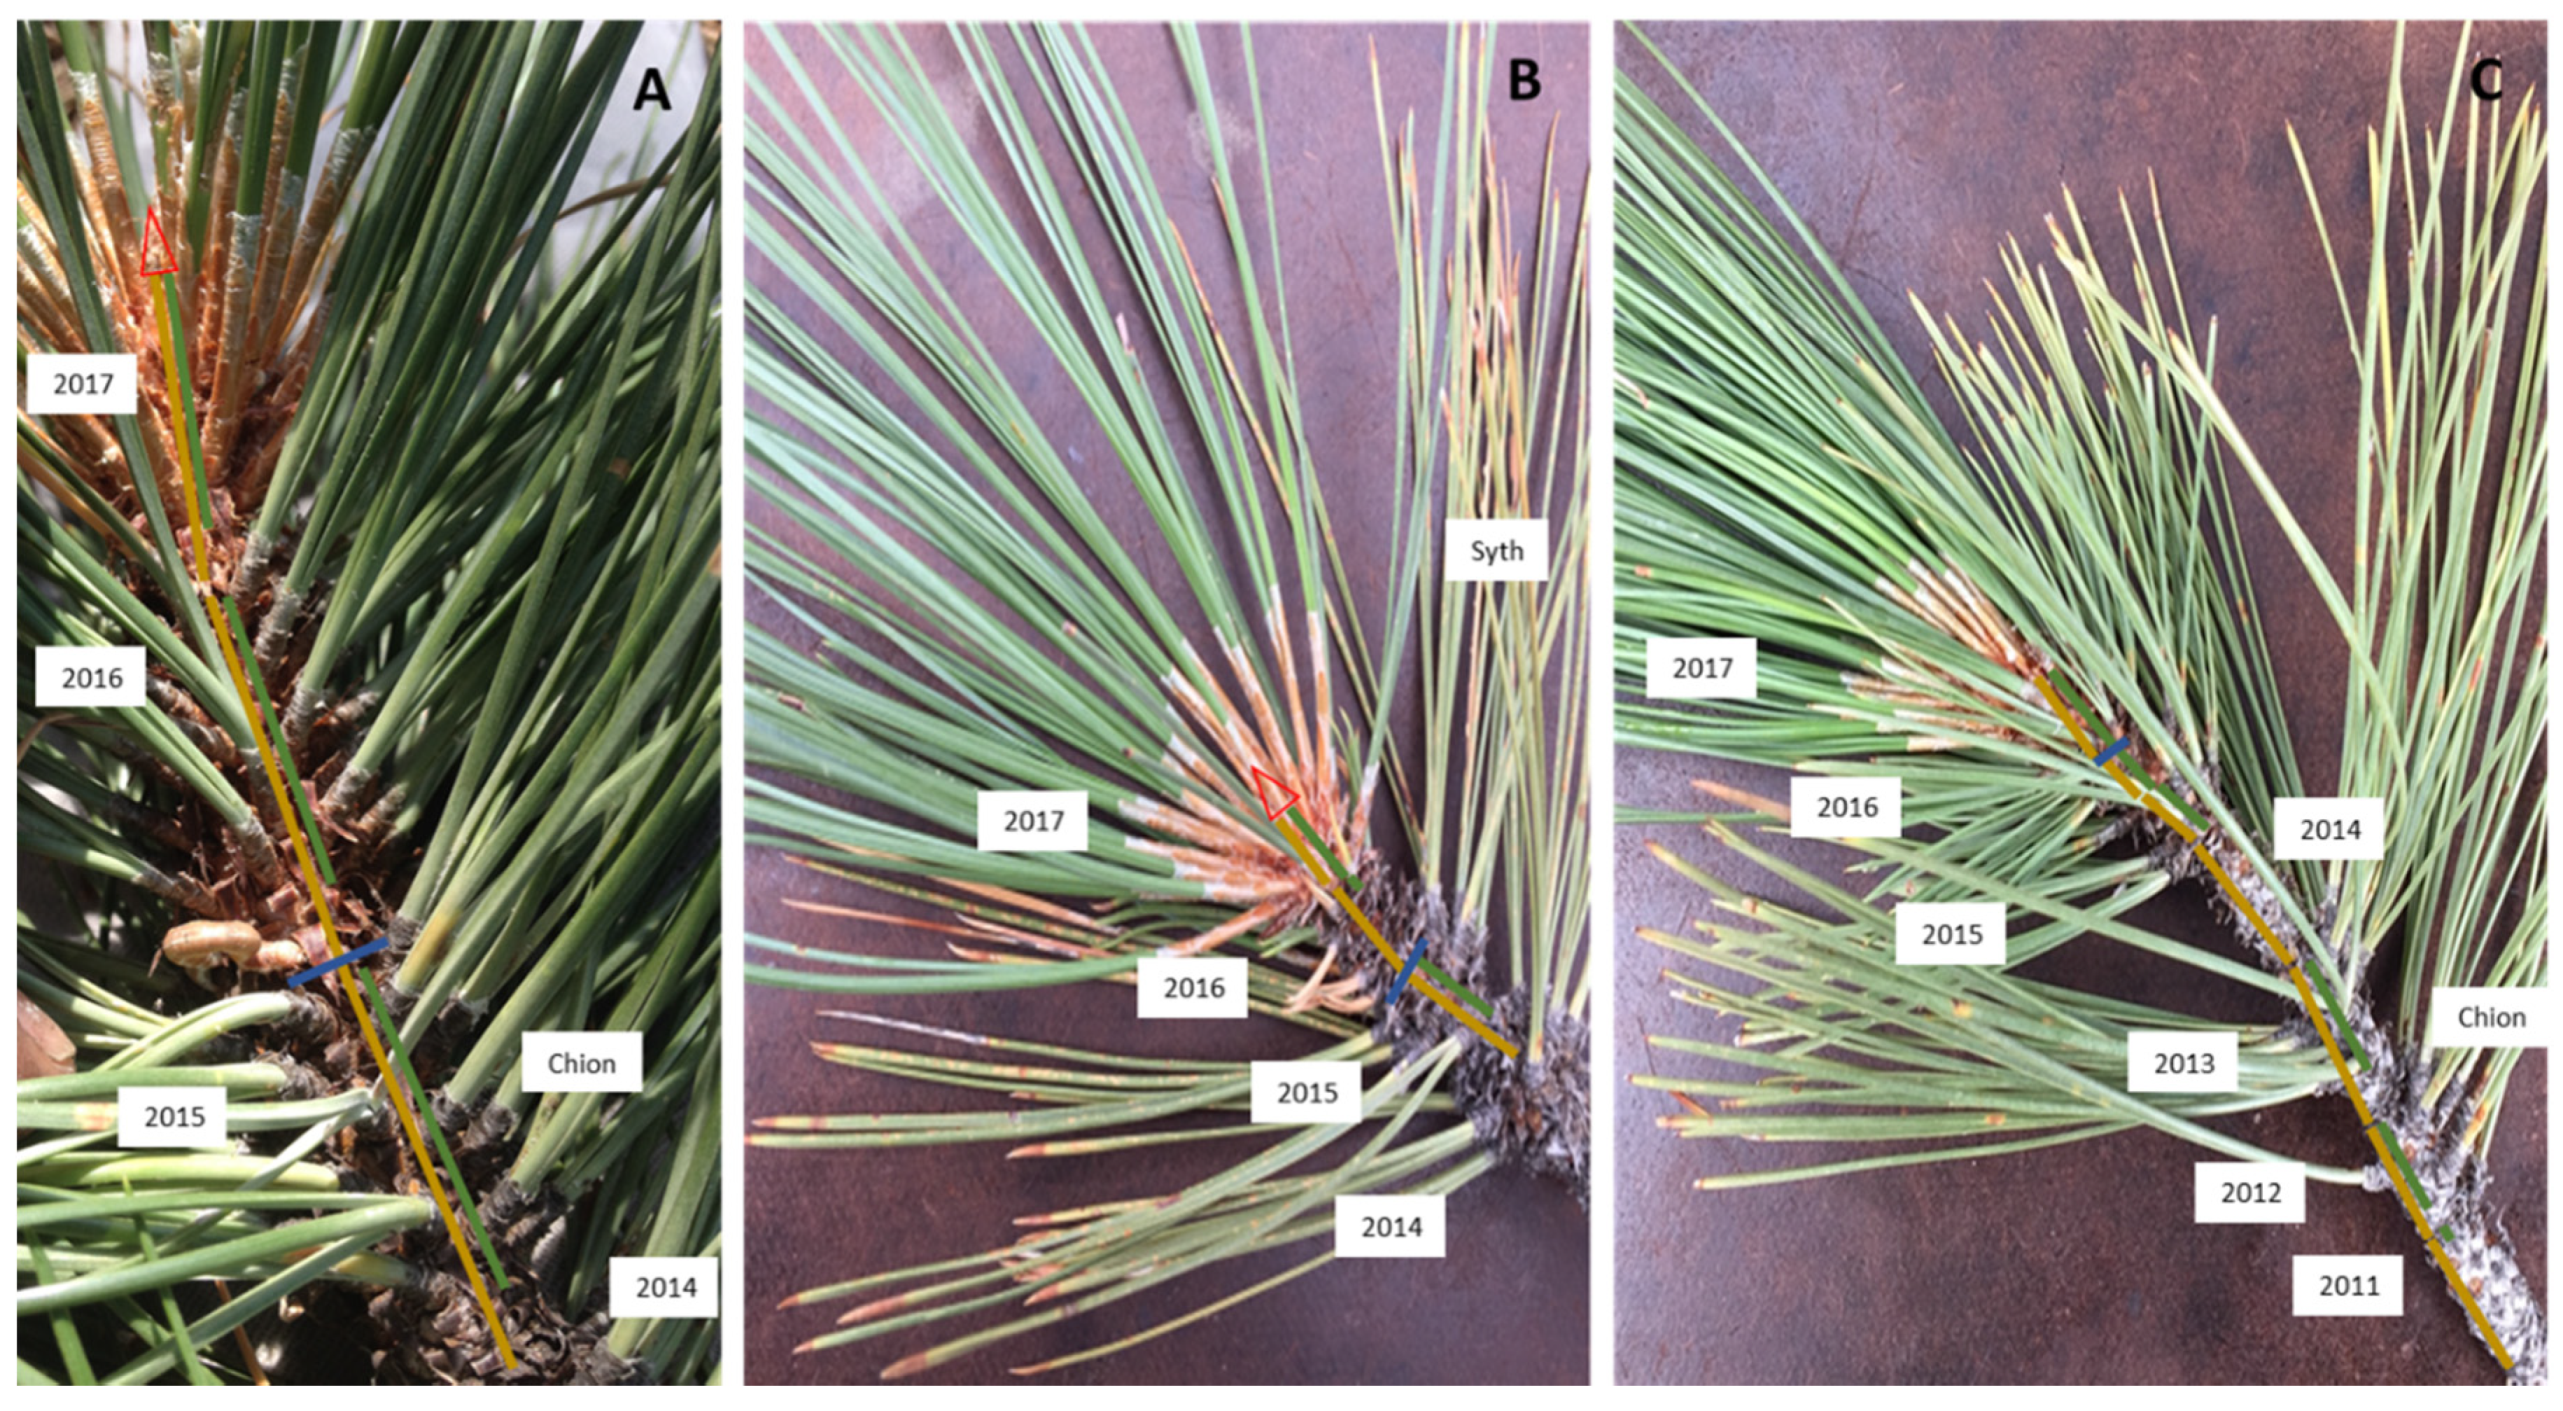
Examples of branchlets illustrating variability of different crown trait measurements. (A) Branchlet was clipped from a tree in a mesic (M) microsite. Four needle ages (WHL) are labeled by year, with CHL1 and CHL2 with 0% chlorosis for the first two years of needles (CHL1, CHL2), and CHL3 with 15% chlorosis. A needle defoliator, scale (Chionaspis, spp.; Chion), is present on the 2015 needles. Branch length (BRLNx) by year (x) is indicated by a dark mustard bar, with the foliated portion (%FOLLNx) of each year indicated by a dark green bar. An open red triangle indicates the position of the preformed 2018 terminal bud. The blue bar perpendicular to the branchlet axis indicates measurement point of prior year branchlet diameter (BRDIA2). (B) Branchlet was clipped from a tree in a xeric (X) microsite. Four needle ages were retained, with 40% and 60% chlorosis for CHL3 and CHL4, respectively. Needle length measured after elongation growth has ceased is presented relative to the average length of needles, of the whorl with the longest needles retained on the branchlet (%MxNLx): 100% for 2017 (total length not apparent in the photo); 5% for 2016; 60% for 2015, and 45% for 2014. The effects of a needle defoliator, Scythropus, spp. (Scyth) is present on the 4th year needles. (C) Branchlet from another X tree. The oldest needles are seven years old, but the 2014 needles were excised. Because the 2014 branchlet elongated, and the bracts for each needle fascicle (cluster of three needles bundled by a paper sheath) are widely spaced, it is likely that the needles elongated but were lost to reduce leaf area with increasing drought through 2016. The oldest WHL retained only one fascicle. % MxNL2 is 20% (compare to 5% in Panel (B)), 40% for MxNL3, and 60% for MxNL4. Trees differ in their respond to hydrologic deficits, especially in xeric microsites likely due to differences in the amount of trapped water in bedrock interstices. Whole tree examples of early senescence (ES) can be found in [53] and DMR in [57].
Figure A1.
Examples of branchlets illustrating variability of different crown trait measurements. (A) Branchlet was clipped from a tree in a mesic (M) microsite. Four needle ages (WHL) are labeled by year, with CHL1 and CHL2 with 0% chlorosis for the first two years of needles (CHL1, CHL2), and CHL3 with 15% chlorosis. A needle defoliator, scale (Chionaspis, spp.; Chion), is present on the 2015 needles. Branch length (BRLNx) by year (x) is indicated by a dark mustard bar, with the foliated portion (%FOLLNx) of each year indicated by a dark green bar. An open red triangle indicates the position of the preformed 2018 terminal bud. The blue bar perpendicular to the branchlet axis indicates measurement point of prior year branchlet diameter (BRDIA2). (B) Branchlet was clipped from a tree in a xeric (X) microsite. Four needle ages were retained, with 40% and 60% chlorosis for CHL3 and CHL4, respectively. Needle length measured after elongation growth has ceased is presented relative to the average length of needles, of the whorl with the longest needles retained on the branchlet (%MxNLx): 100% for 2017 (total length not apparent in the photo); 5% for 2016; 60% for 2015, and 45% for 2014. The effects of a needle defoliator, Scythropus, spp. (Scyth) is present on the 4th year needles. (C) Branchlet from another X tree. The oldest needles are seven years old, but the 2014 needles were excised. Because the 2014 branchlet elongated, and the bracts for each needle fascicle (cluster of three needles bundled by a paper sheath) are widely spaced, it is likely that the needles elongated but were lost to reduce leaf area with increasing drought through 2016. The oldest WHL retained only one fascicle. % MxNL2 is 20% (compare to 5% in Panel (B)), 40% for MxNL3, and 60% for MxNL4. Trees differ in their respond to hydrologic deficits, especially in xeric microsites likely due to differences in the amount of trapped water in bedrock interstices. Whole tree examples of early senescence (ES) can be found in [53] and DMR in [57].
Appendix B. List of All Whole Tree, Crown Morphological, and Spectral Traits

Table A1.
List of all whole tree, crown morphological, and spectral traits, their mean or median in each tree group and a brief description of trait. References for trait selection are given in Methods. Column legends: trees in mesic microsites with background N microsites (M BN), mesic plus amended N (M+N), trees in xeric microsites with background N (X BN) and xeric plus amended N (X+N). Significant differences between groups are presented in Table 1 in the main text.
| TRAIT | M BN | M+N | X BN | X+N | DESCRIPTION |
|---|---|---|---|---|---|
| WHL | 5.2 | 5.4 | 5.1 | 5.4 | number of retained needle ages on branchlets |
| CHL1 | 0 | 1 | 0 | 0.4 | % chlorosis or chlorotic mottle on 1-year needles |
| CHL2 | 2 | 3 | 3 | 3 | % chlorosis or chlorotic mottle on 2-year needles |
| CHL4 | 12 | 14 | 16 | 15 | % chlorosis or chlorotic mottle on 4-year needles |
| CHL6 | 48 | 52 | 44 | 49 | % chlorosis or chlorotic mottle on 6-year needles |
| %MxNL1 | 81 | 80 | 77 | 79 | Relative current year needle length |
| %FOLLN | 59 | 57 | 61 | 59 | proportion of branchlet length with retained needles |
| BRDIA2 | 10.7 | 10.8 | 11.4 | 11.7 | prior year branchlet diameter at its base |
| ES | 1.2 | 0.9 | 1.2 | 0.9 | early senescence of needles, whole tree |
| Strobili ♂ | 0.02 | 0.02 | 0.02 | 0.00 | frequency of male strobili |
| LF DF | 1.72 | 0.01 | 1.34 | 0.00 | additive frequency of both needle defoliators |
| Elytroderma | 0.19 | 0.25 | 0.60 | 0.43 | needle cast fungi, presence/absence, whole tree |
| DMR | 0.07 | 0.00 | 0.50 | 0.31 | dwarf mistletoe rank |
| R TOP | 125.7 | 121.0 | 136.6 | 136.3 | intensity of R wavelength, tree-top |
| NDVI TOP | 0.57 | 0.57 | 0.53 | 0.54 | index of productivity, tree-top |
| NIR TOP | 475.0 | 459.2 | 444.4 | 452.9 | intensity of NIR wavelength, tree-top |
| NIR SC TOP | 0.79 | 0.79 | 0.76 | 0.77 | inverse of NDVI, indexed water content, tree-top |
| THERM TOP | 24.6 | 24.2 | 26.3 | 25.8 | needle temperature, tree-top |
| R MID | 129.1 | 124.6 | 138.2 | 135.1 | intensity of R wavelength, upper mid crown |
| NDVI MID | 0.58 | 0.58 | 0.54 | 0.55 | index of productivity, upper mid crown |
| NIR MID | 491.3 | 482 | 459.2 | 479.8 | intensity of NIR wavelength, upper mid crown |
| NIR SC MID | 0.79 | 0.79 | 0.77 | 0.78 | indexed water content, upper mid crown |
| THERM MID | 24.7 | 24.3 | 27.7 | 27.3 | needle temperature, upper mid crown |
| R Δ | −3.46 | −3.58 | −1.56 | −6.64 | [tree-top] − [upper mid crown] R |
| NDVI Δ | 0.00 | −0.01 | −0.01 | 0.00 | [tree-top] − [upper mid crown] NDVI |
| NIR Δ | −16.31 | −22.90 | −14.94 | −26.88 | [tree-top] − [upper mid crown] NIR |
| NIR SC Δ | 0.00 | 0.00 | 0.00 | 0.00 | [tree-top] − [upper mid crown] NIR SC |
| THERM Δ | −0.1 | −0.1 | −1.6 | −1.8 | [tree-top] − [upper mid crown] THERM |
References
- Allen, C.D.; Macalady, A.K.; Chenchouni, H.; Bachelet, D.; McDowell, N.; Vennetier, M.; Kitzberger, T.; Rigling, A.; Breshears, D.D.; Hogg, T.; et al. A global overview of drought and heat-induced tree mortality reveals emerging climate change risks for forests. For. Ecol. Manag. 2010, 259, 660–684. [Google Scholar] [CrossRef] [Green Version]
- Griffin, D.; Anchukaitis, K.J. How unusual is the 2012–2014 California drought? Geophys. Res. Lett. 2014, 41, 9017–9023. [Google Scholar] [CrossRef] [Green Version]
- Kolb, T.E.; Fettig, C.J.; Ayres, M.P.; Bentz, B.J.; Hicke, J.A.; Mathiasen, R.; Stewart, J.E.; Weed, A.S. Observed and anticipated impacts of drought on forest insects and diseases in the United States. For. Ecol. Manag. 2016, 380, 321–334. [Google Scholar] [CrossRef]
- Eitel, J.U.H.; Vierling, L.A.; Litvak, M.E.; Long, D.S.; Schulthess, U.; Ager, A.A.; Krofcheck, D.J.; Stoscheck, L. Broadband, red-edge information from satellites improves early stress detection in a New Mexico conifer woodland. Remote. Sens. Environ. 2011, 115, 3640–3646. [Google Scholar] [CrossRef]
- Pontius, J.; Hallett, R. Comprehensive Methods for Earlier Detection and Monitoring of Forest Decline. For. Sci. 2014, 60, 1156–1163. [Google Scholar] [CrossRef]
- Anderegg, W.R.; Anderegg, L.D.L.; Huang, C.-Y. Testing early warning metrics for drought-induced tree physiological stress and mortality. Glob. Chang. Boil. 2019, 25, 2459–2469. [Google Scholar] [CrossRef]
- De la Serrana, R.G.; Vilagrosa, A.; Alloza, J.A. Pine mortality in southeast Spain after an extreme dry and warm year: Interactions among drought stress, carbohydrates, and bark beetle attack. Trees 2015, 29, 1791–1804. [Google Scholar] [CrossRef]
- McDowell, N.G.; Pockman, W.; Allen, C.D.; Breshears, D.D.; Cobb, N.; Kolb, T.; Plaut, J.; Sperry, J.; West, A.; Williams, D.G.; et al. Mechanisms of plant survival and mortality during drought: Why do some plants survive while others succumb to drought? New Phytol. 2008, 178, 719–739. [Google Scholar] [CrossRef]
- Peñuelas, J.; Filella, I.; Biel, C.; Serrano, L.; Savé, R. The reflectance at the 950–970 nm region as an indicator of plant water status. Int. J. Remote. Sens. 1993, 14, 1887–1905. [Google Scholar] [CrossRef]
- Sims, D.A.; Gamon, J.A. Estimation of vegetation water content and photosynthetic tissue area from spectral reflectance: A comparison of indices based on liquid water and chlorophyll absorption features. Remote. Sens. Environ. 2003, 84, 526–537. [Google Scholar] [CrossRef]
- Marusig, D.; Petruzzellis, F.; Tomasella, M.; Napolitano, R.; Altobelli, A.; Nardini, A. Correlation of Field-Measured and Remotely Sensed Plant Water Status as a Tool to Monitor the Risk of Drought-Induced Forest Decline. Forests 2020, 11, 77. [Google Scholar] [CrossRef] [Green Version]
- Seidel, H.; Schunk, C.; Matiu, M.; Menzel, A. Diverging Drought Resistance of Scots Pine Provenances Revealed by Infrared Thermography. Front. Plant Sci. 2016, 7, 346. [Google Scholar] [CrossRef] [Green Version]
- Stimson, H.C.; Breshears, D.D.; Ustin, S.L.; Kefauver, S.C. Spectral sensing of foliar water conditions in two co-occurring conifer species: Pinus edulis and Juniperus monosperma. Remote. Sens. Environ. 2005, 96, 108–118. [Google Scholar] [CrossRef]
- Santesteban, L.G.; di Gennaro, S.F.; Herrero-Langreo, A.; Miranda, C.; Royo, J.; Matese, A. High-resolution UAV-based thermal imaging to estimate the instantaneous and seasonal variability of plant water status within a vineyard. Agric. Water Manag. 2017, 183, 49–59. [Google Scholar] [CrossRef]
- Bell, D.M.; Cohen, W.; Reilly, M.; Yang, Z. Visual interpretation and time series modeling of Landsat imagery highlight drought’s role in forest canopy declines. Ecosphere 2018, 9, e02195. [Google Scholar] [CrossRef]
- Peñuelas, J.; Savè, R.; Marfà, O.; Serrano, L. Remotely measured canopy temperature of greenhouse strawberries as an indicator of water status and yield under mild and very mild water stress conditions. Agric. For. Meteor. 1992, 58, 63–77. [Google Scholar] [CrossRef]
- Richardson, A.; Everitt, J.H. Monitoring water stress in buffelgrass using hand-held radiometers. Int. J. Remote. Sens. 1987, 8, 1797–1806. [Google Scholar] [CrossRef]
- Meddens, A.J.H.; Hicke, J.A.; Vierling, L.A. Evaluating the potential of multispectral imagery to map multiple stages of tree mortality. Remote. Sens. Environ. 2011, 115, 1632–1642. [Google Scholar] [CrossRef]
- Norman, S.P.; Hargrove, W.W.; Spruce, J.P.; Christie, W.M.; Schroeder, S.W. Highlights of Satellite-Based Forest Change Recognition and Tracking Using the ForWarn System; U.S. Department of Agriculture; Forest Service: Asheville, NC, USA, 2013; p. 30.
- Casas, A.; Riaño, D.; Ustin, S.; Dennison, P.E.; Salas, J. Estimation of water-related biochemical and biophysical vegetation properties using multitemporal airborne hyperspectral data and its comparison to MODIS spectral response. Remote. Sens. Environ. 2014, 148, 28–41. [Google Scholar] [CrossRef]
- Asner, G.P.; Brodrick, P.G.; Anderson, C.B.; Vaughn, N.; Knapp, D.E.; Martin, R.E. Progressive forest canopy water loss during the 2012–2015 California drought. Proc. Natl. Acad. Sci. USA 2015, 113, E249–E255. [Google Scholar] [CrossRef] [Green Version]
- Asner, G.P.; Martin, R.E. Spectral and chemical analysis of tropical forests: Scaling from leaf to canopy levels. Remote. Sens. Environ. 2008, 112, 3958–3970. [Google Scholar] [CrossRef]
- Housman, I.W.; Chastain, R.A.; Finco, M.V. An Evaluation of Forest Health Insect and Disease Survey Data and Satellite-Based Remote Sensing Forest Change Detection Methods: Case Studies in the United States. Remote. Sens. 2018, 10, 1184. [Google Scholar] [CrossRef] [Green Version]
- Slatyer, R.O. Plant-Water Relationships; Academic Press: London, UK, 1967; p. 366. [Google Scholar]
- Mirzaie, M.; Darvishzadeh, R.; Shakiba, A.; Matkan, A.; Atzberger, C.; Skidmore, A. Comparative analysis of different uni- and multi-variate methods for estimation of vegetation water content using hyper-spectral measurements. Int. J. Appl. Earth Obs. Geoinform. 2014, 26, 1–11. [Google Scholar] [CrossRef]
- Martin, R.E.; Asner, G.P.; Francis, E.; Ambrose, A.; Baxter, W.; Das, A.J.; Vaughn, N.R.; Paz-Kagan, T.; Dawson, T.; Nydick, K.; et al. Remote measurement of canopy water content in giant sequoias (Sequoiadendron giganteum) during drought. For. Ecol. Manag. 2018, 279–290. [Google Scholar] [CrossRef]
- Cook, B.D.; Corp, L.A.; Nelson, R.F.; Middleton, E.M.; Morton, D.C.; McCorkel, J.; Masek, J.G.; Ranson, K.J.; Ly, V.; Montesano, P.M. NASA Goddard’s LiDAR, Hyperspectral and Thermal (G-LiHT) Airborne Imager. Remote. Sens. 2013, 5, 4045–4066. [Google Scholar] [CrossRef] [Green Version]
- Levitt, J. Responses to Plants to Environmental Stresses; Academic Press: London, UK, 1980; p. 497. [Google Scholar]
- Grulke, N.E.; Johnson, R.; Jones, D.; Monschein, S.; Nikolova, P.; Tausz, M. Variation in morphological and biochemical O3 injury traits of Jeffrey pine within canopies and between microsites. Tree Phys. 2003, 23, 923–929. [Google Scholar] [CrossRef] [PubMed] [Green Version]
- Miller, P.R.; Stolte, K.W.; Duriscoe, D.; Pronos, J.; Tech, C. Monitoring Ozone Air Pollution Effects on Western Pine Forests; U.S. Department of Agriculture, Forest Service, Pacific Southwest Research Station: Albany, CA, USA, 1996; PSW-GTR-155; p. 79.
- Jones, M.E.; Paine, T.D. Detecting changes in insect herbivore communities along a pollution gradient. Environ. Pollut. 2006, 143, 377–387. [Google Scholar] [CrossRef] [PubMed]
- López, M.L.; Calderón, R.; Gonzalez-Dugo, V.; Zarco-Tejada, P.J.; Fereres, E. Early Detection and Quantification of Almond Red Leaf Blotch Using High-Resolution Hyperspectral and Thermal Imagery. Remote. Sens. 2016, 8, 276. [Google Scholar] [CrossRef] [Green Version]
- Mahlein, A.-K.; Rumpf, T.; Welke, P.; Dehne, H.-W.; Plümer, L.; Steiner, U.; Oerke, E.-C. Development of spectral indices for detecting and identifying plant diseases. Remote. Sens. Environ. 2013, 128, 21–30. [Google Scholar] [CrossRef]
- Maffei, H.M.; Filip, G.M.; Grulke, N.E.; Oblinger, B.W.; Margolis, E.Q.; Chadwick, K.L. Pruning high-value coastal Douglas-fir reduces dwarf mistletoe severity and increases longevity in Central Oregon. For. Ecol. Manag. 2016, 379, 11–19. [Google Scholar] [CrossRef]
- McLaughlin, B.C.; Blakey, R.; Weitz, A.P.; Feng, X.; Brown, B.J.; Ackerly, D.D.; Dawson, T.E.; Thompson, S. Weather underground: Subsurface hydrologic processes mediate tree vulnerability to extreme climatic drought. Glob. Chang. Boil. 2020, 26, 3091–3107. [Google Scholar] [CrossRef]
- Anderegg, W.R.L.; Hicke, J.A.; Fisher, R.A.; Allen, C.D.; Aukema, J.; Bentz, B.; Hood, S.M.; Lichstein, J.W.; Macalady, A.K.; McDowell, N.; et al. Tree mortality from drought, insects, and their interactions in a changing climate. New Phytol. 2015, 208, 674–683. [Google Scholar] [CrossRef]
- Cotrozzi, L.; Pellegrini, E.; Guidi, L.; Landi, M.; Lorenzini, G.; Massai, R.; Remorini, D.; Tonelli, M.; Trivellini, A.; Vernieri, P.; et al. Losing the Warning Signal: Drought Compromises the Cross-Talk of Signaling Molecules in Quercus ilex Exposed to Ozone. Front. Plant Sci. 2017, 8. [Google Scholar] [CrossRef] [Green Version]
- Sala, A.; Piper, F.I.; Hoch, G. Physiological mechanisms of drought-induced tree mortality are far from being resolved. New Phytol. 2010, 186, 274–281. [Google Scholar] [CrossRef]
- Grulke, N.E.; Heath, R.L. Ozone effects on plants in natural ecosystems. Plant Boil. 2019, 22, 12–37. [Google Scholar] [CrossRef]
- Adams, M.L.; Philpot, W.; Norvell, W.A. Yellowness index: An application of spectral second derivatives to estimate chlorosis of leaves in stressed vegetation. Int. J. Remote. Sens. 1999, 20, 3663–3675. [Google Scholar] [CrossRef]
- McMillin, J.D.; Wagner, M.R. Effects of water stress on biomass partitioning of ponderosa pine seedlings during primary root growth and shoot growth periods. Forest Sci. 1995, 41, 594–610. [Google Scholar]
- De Lucia, E.H.; Maherali, H.; Carey, E.V. Climate-driven changes in biomass allocation in pines. Glob. Chang. Boil. 2000, 6, 587–593. [Google Scholar] [CrossRef]
- Forest Vegetation Simulator; U.S. Department of Agriculture, Forest Service: Washington, DC, USA. Available online: https://www.fs.fed.us/fvs/ (accessed on 18 June 2020).
- Kim, J.B.; Monier, E.; Sohngen, B.; Pitts, G.S.; Drapek, R.; McFarland, J.; Ohrel, S.; Cole, J. Assessing climate change impacts, benefits of mitigation, and uncertainties on major global forest regions under multiple socioeconomic and emissions scenarios. Environ. Res. Lett. 2017, 12, 045001. [Google Scholar] [CrossRef]
- Preisler, H.K.; Grulke, N.E.; Heath, Z.; Smith, S.L. Analysis and out-year forecast of beetle, borer, and drought-induced tree mortality in California. For. Ecol. Manag. 2017, 399, 166–178. [Google Scholar] [CrossRef]
- Grulke, N.E.; Johnson, R.; Esperanza, A.; Jones, D.; Nguyen, T.; Posch, S.; Tausz, M. Canopy transpiration of Jeffrey pine in mesic and xeric microsites: O3 uptake and injury response. Trees 2003, 17, 292–298. [Google Scholar] [CrossRef]
- National Park Service. Air Resources Division, Sequoia National Park-Lodgepole. Available online: https://www.nps.gov/orgs/1971 (accessed on 18 June 2020).
- Grulke, N.E.; Minnich, R.A.; Paine, T.D.; Seybold, S.J.; Chavez, D.J.; Fenn, M.E.; Riggan, P.J.; Dunn, A. Chapter 17 Air Pollution Increases Forest Susceptibility to Wildfires: A Case Study in the San Bernardino Mountains in Southern California. Alta. Oil Sands 2008, 8, 365–403. [Google Scholar] [CrossRef]
- Belmecheri, S.; Babst, F.; Wahl, E.R.; Stahle, D.W.; Trouet, V. Multi-century evaluation of Sierra Nevada snowpack. Nat. Clim. Chang. 2015, 6, 2–3. [Google Scholar] [CrossRef]
- Fenn, M.E.; Baron, J.S.; Allen, E.; Rueth, H.M.; Nydick, K.R.; Geiser, L.; Bowman, W.D.; Sickman, J.O.; Meixner, T.; Johnson, D.W.; et al. Ecological Effects of Nitrogen Deposition in the Western United States. BioScience 2003, 53, 404. [Google Scholar] [CrossRef]
- Bytnerowicz, A.; Tausz, M.; Alonso, R.; Jones, D.; Johnson, R.; Grulke, N. Summer-time distribution of air pollutants in Sequoia National Park, California. Environ. Pollut. 2002, 118, 187–203. [Google Scholar] [CrossRef]
- Grulke, N.; Bienz, C.; Hrinkevich, K.; Maxfield, J.; Uyeda, K. Quantitative and qualitative approaches to assess tree vigor and stand health in dry pine forests. For. Ecol. Manag. 2020, 465, 118085. [Google Scholar] [CrossRef]
- Grulke, N.E.; Lee, E.H. Assessing ozone-induced foliar injury in ponderosa pine. Can. J. For. Res. 1997, 27, 1658–1668. [Google Scholar] [CrossRef]
- Staszak, J.; Grulke, N.E.; Marrett, M.; Prus-Glowacki, W. Isozyme markers associated with O3 tolerance indicate shift in genetic structure of ponderosa and Jeffrey pine in Sequoia National Park, California. Environ. Pollut. 2007, 149, 366–375. [Google Scholar] [CrossRef]
- Bridgwater, F.E.; Bramlett, D.L. Supplemental Mass Pollination to increase Seed Yields in Loblolly Pine Seed Orchards. South. J. Appl. For. 1982, 6, 100–104. [Google Scholar] [CrossRef]
- Whipple, A.V.; Cobb, N.S.; Gehring, C.A.; Mopper, S.; Flores-Rentería, L.; Whitham, T.G. Long-Term Studies Reveal Differential Responses to Climate Change for Trees Under Soil- or Herbivore-Related Stress. Front. Plant Sci. 2019, 10, 132. [Google Scholar] [CrossRef]
- Hawksworth, F.G.; Wiens, D. Dwarf Mistletoes: Biology, Pathology and Systematics; USDA Forest Service: Washington, DC, USA, 1996; Volume 709, p. 410. Available online: http://www.rms.nau.edu/publications/ah_709 (accessed on 18 June 2020).
- Riggan, P.; Hoffman, J.; Brass, J. Estimating fire properties by remote sensing. IEEE Aerosp. Electron. Syst. Mag. 2009, 24, 13–19. [Google Scholar] [CrossRef]
- Hoffman, J.W.; Coulter, L.L.; Riggan, P.J. Rapid turn-around mapping of wildfires and disasters with airborne infrared imagery from the new FireMapper 2.0 and Oilmapper systems. In Proceedings of the American Society Photogrammetry and Remote Sensing, Baltimore, MD, USA, 7–11 March 2005; p. 8. Available online: https://www.fs.fed.us/psw/publications/riggan/psw_2005_riggan001_hoffman.pdf (accessed on 18 June 2020).
- Immitzer, M.; Atzberger, C.; Koukal, T. Tree Species Classification with Random Forest Using Very High Spatial Resolution 8-Band WorldView-2 Satellite Data. Remote. Sens. 2012, 4, 2661–2693. [Google Scholar] [CrossRef] [Green Version]
- ESRI. ArcGIS 10.8. 2019. Available online: esri.com/en-us/arcgis/products/arcgis-desktop/ (accessed on 17 June 2020).
- Grulke, N.; Balduman, L. Deciduous Conifers: High N Deposition and O3 Exposure Effects on Growth and Biomass Allocation in Ponderosa Pine. Water Air Soil Pollut. 1999, 116, 235–248. [Google Scholar] [CrossRef]
- King, J.R.; Jackson, D.A. Variable selection in large environmental data sets using principal components analysis. Environmetrics 1999, 10, 67–77. [Google Scholar] [CrossRef]
- Cutler, D.R.; Edwards, T.C.; Beard, K.H.; Cutler, A.; Hess, K.T.; Gibson, J.; Lawler, J.J. Random Forests for classification in ecology. Ecology 2007, 88, 2783–2792. [Google Scholar] [CrossRef]
- Brieman, L.; Cutler, A. Random Forests, 201. Available online: https://www.stat.berkeley.edu/~breiman/RandomForests/cc_copyright.htm (accessed on 16 June 2020).
- Boehmke, B.; Greenwell, B.M. Hands-On Machine Learning With R; CRS Press: Boca Raton, FL, USA, 2019; p. 488. [Google Scholar]
- McCune, B.; Medford, M.J. Multivariate Analysis of Ecological Data; Version 6; MjM Software: Gleneden Beach, OR, USA, 2011. [Google Scholar]
- JMP 2020. Partition Platform. Available online: https://www.jmp.com/support/help/en/15.1/index.shtml#page/jmp/partition-models.shtml (accessed on 29 May 2020).
- Gordon, A.D.; Breiman, L.; Friedman, J.H.; Olshen, R.A.; Stone, C.J. Classification and Regression Trees; CRC Press: Boca Raton, FL, USA, 1984; Volume 40, p. 874. [Google Scholar] [CrossRef] [Green Version]
- Schrader-Patton, C.; Grulke, N.E.; Bienz, C. Assessments of ponderosa pine vigor using 4-Band aerial imagery in south central Oregon: Crown objects to landscapes. For. Ecol. Manag. 2004, 191–217. [Google Scholar]
- Andersen, C.P.; Wilson, R.; Plocher, M.; Hogsett, W.E. Carry-over effects of ozone on root growth and carbohydrate concentrations of ponderosa pine seedlings. Tree Physiol. 1997, 17, 805–811. [Google Scholar] [CrossRef] [Green Version]
- Grulke, N.E.; Andersen, C.P.; Fenn, M.P.; Miller, P.R. Ozone exposure and N deposition reduces root biomass in ponderosa pine across the San Bernardino Mountains, California. Environ. Poll. 1998, 103, 63–73. [Google Scholar] [CrossRef]
- Paoletti, E.; Grulke, N. Does living in elevated CO ameliorate tree response to ozone? A review on stomatal responses. Environ. Pollut. 2005, 137, 483–493. [Google Scholar] [CrossRef]
- Grulke, N.E.; Alonso, R.; Nguyen, T.; Cascio, C.; Dobrowolski, W. Stomata open at night in pole-sized and mature ponderosa pine: Implications for O3 exposure metrics. Tree Physiol. 2004, 24, 1001–1010. [Google Scholar] [CrossRef] [Green Version]
- Vanderheyden, D.; Skelly, J.; Innes, J.L.; Hug, C.; Zhang, J.; Landolt, W.; Bleuler, P. Ozone exposure thresholds and foliar injury on forest plants in Switzerland. Environ. Pollut. 2001, 111, 321–331. [Google Scholar] [CrossRef]
- Gerosa, G.; Marzuoli, R.; Desotgiu, R.; Bussotti, F.; Denti, A.B. Visible leaf injury in young trees of Fagus sylvatica L. and Quercus robur L. in relation to ozone uptake and ozone exposure. An Open-Top Chambers experiment in South Alpine environmental conditions. Environ. Pollut. 2008, 152, 274–284. [Google Scholar] [CrossRef]
- Mitchell, R.G.; Waring, R.H.; Pitman, G.B. Thinning lodgepole pine increases tree vigor and resistance to mountain pine beetle. Forest Sci. 1983, 29, 204–211. [Google Scholar]
- Keen, F.P. Ponderosa pine tree classes redefined. J. For. 1943, 41, 249–253. [Google Scholar]
- Karlsson, P.E.; Örlander, G.; Langvall, O.; Uddling, J.; Hjorth, U.; Wiklander, K.; Areskoug, B.; Grennfelt, P. Negative impact of ozone on the stem basal area increment of mature Norway spruce in south Sweden. For. Ecol. Manag. 2006, 232, 146–151. [Google Scholar] [CrossRef]
- Albaugh, T.J.; Allen, H.L.; Kress, L.W. Biomass-DBH relationship for young loblolly pine as affected by ozone. Biomass Bioenergy 1991, 1, 143–148. [Google Scholar] [CrossRef]
- Raffa, K.F.; Aukema, B.H.; Bentz, B.J.; Carroll, A.L.; Hicke, J.A.; Turner, M.G.; Romme, W.H. Cross-scale Drivers of Natural Disturbances Prone to Anthropogenic Amplification: The Dynamics of Bark Beetle Eruptions. BioScience 2008, 58, 501–517. [Google Scholar] [CrossRef] [Green Version]
- Mattson, W.J.; Haack, R.A. The Role of Drought in Outbreaks of Plant-Eating Insects. BioScience 1987, 37, 110–118. [Google Scholar] [CrossRef]
- Brewer, J.W.; O’Neill, K.M.; Deshon, R.E. Effects of artificially altered foliar nitrogen levels on development and survival of young instars of western spruce budworm, Choristoneura occidentalis Freeman. J. Appl. Èntomol. 1987, 104, 121–130. [Google Scholar] [CrossRef]
- Heliovaara, K. Insects and Pollution; Informa UK Limited: London, UK, 2018; p. 393. [Google Scholar]
- Manning, W.J.; Tiedemann, A.V. Climate change: Potential effects of increased atmospheric carbon dioxide (CO2), ozone (O3), and ultraviolet-B (UV-B) radiation on plant diseases. Environ. Poll. 1995, 88, 219–245. [Google Scholar] [CrossRef]
- Percy, K.E.; Awmack, C.S.; Lindroth, R.L.; Kubiske, M.E.; Kopper, B.J.; Isebrands, J.G.; Pregitzer, K.S.; Hendrey, G.R.; Dickson, R.E.; Zak, D.R.; et al. Altered performance of forest pests under atmospheres enriched by CO2 and O3. Nature 2002, 420, 403–407. [Google Scholar] [CrossRef] [PubMed]
- Jones, M.E.; Paine, T.D.; Fenn, M.E.; Poth, M.A. Influence of ozone and nitrogen deposition on bark beetle activity under drought conditions. For. Ecol. Manag. 2004, 200, 67–76. [Google Scholar] [CrossRef]
- Maffei, M.; Wing, B. How airborne lidar can help map root disease and individual tree decline. In Proceedings of the 64th Annulas Western International Forests Disease Work Conference, Sitka, AK, USA, 13 May 2016; p. 37. Available online: https://www.irp-cdn.multiscreensite.com/1463fd0a/files/uploaded/WIFDWC2016FFinal%20%281%29.pdf (accessed on 18 June 2020).
- Meddens, A.J.H.; Hicke, J.A.; Vierling, L.A.; Hudak, A.T. Evaluating methods to detect bark beetle-caused tree mortality using single-date and multi-date Landsat imagery. Remote. Sens. Environ. 2013, 132, 49–58. [Google Scholar] [CrossRef]
- Hanavan, R.; Pontius, J.; Hallett, R. A 10-Year Assessment of Hemlock Decline in the Catskill Mountain Region of New York State Using Hyperspectral Remote Sensing Techniques. J. Econ. Èntomol. 2015, 108, 339–349. [Google Scholar] [CrossRef] [PubMed] [Green Version]
- Cotrozzi, L.; Couture, J.J.; Cavender-Bares, J.; Kingdon, C.C.; Fallon, B.; Pilz, G.; Pellegrini, E.; Nali, C.; A Townsend, P. Using foliar spectral properties to assess the effects of drought on plant water potential. Tree Physiol. 2017, 37, 1582–1591. [Google Scholar] [CrossRef]
- Schrader-Patton, C.; Grulke, N.E.; Dressen, M. Rapid Reconnaissance of a Forest Insect Outbreak in Colorado Using MODIS Phenology Data; U.S. Department of Agriculture, Pacific Northwest Research Station: Portland, OR, USA, 2016; PNW-GTR-940e; p. 35.
- Spruce, J.P.; Hicke, J.A.; Hargrove, W.W.; Grulke, N.E.; Meddens, A.J.H. Use of MODIS NDVI Products to Map Tree Mortality Levels in Forests Affected by Mountain Pine Beetle Outbreaks. Forests 2019, 10, 811. [Google Scholar] [CrossRef] [Green Version]
- Kefauver, S.C.; Peñuelas, J.; Ustin, S. Using topographic and remotely sensed variables to assess ozone injury to conifers in the Sierra Nevada (USA) and Catalonia (Spain). Remote. Sens. Environ. 2013, 139, 138–148. [Google Scholar] [CrossRef]
- Martinelli, F.; Scalenghe, R.; Davino, S.; Panno, S.; Scuderi, G.; Ruisi, P.; Villa, P.; Stroppiana, D.; Boschetti, M.; Goulart, L.R.; et al. Advanced methods of plant disease detection. A review. Agron. Sustain. Dev. 2014, 35, 1–25. [Google Scholar] [CrossRef] [Green Version]
- Leckie, D.G.; Cloney, E.; Joyce, S.P. Automated detection, and mapping of crown discolouration caused by jack pine budworm with 2.5 m resolution multispectral imagery. Int. J. Appl. Earth Obs. Geoinform. 2005, 7, 61–77. [Google Scholar] [CrossRef]
- Yamasaki, S.; Dillenburg, L.R. Measurements of leaf relative water content in Araucaria angustifolia. Rev. Brasill. Fisil. Feget. 1999, 11, 69–75. [Google Scholar]
- Barrs, H.; Weatherley, P. A Re-Examination of the Relative Turgidity Technique for Estimating Water Deficits in Leaves. Aust. J. Boil. Sci. 1962, 15, 413. [Google Scholar] [CrossRef] [Green Version]
- Costa, J.M.; Grant, O.M.; Chaves, M.M. Thermography to explore plant–environment interactions. J. Exp. Bot. 2013, 64, 3937–3949. [Google Scholar] [CrossRef] [PubMed]
Figure 1.
Colorized composite of the intensities of high resolution (R), near-infrared (NIR), and thermal wavelengths of the calibration site on the western slope of south-central Sierra Nevada. The site is bounded by the Marble Fork of the Kaweah River (rusty brown) on the south, and General’s Highway on the north (fuchsia), just west of Lodgepole, California. The darker gray-green rounded trees (see cast shadow) are Jeffrey pine distributed in open rocky areas (xeric (X)), along the riparian corridor and ephemeral seeps (mesic (M)), as well as intermingled X and M trees.

Figure 2.
Thermal imagery of two Jeffrey pine trees taken at 0.5 h time steps, 1030 to 1200 (left) and true color (center right). Below imagery, a cartoon of an aerial view depicting the upper canopy (center circle) and the upper portion of the mid canopy (concentric circle), varying from cool (green, transpiring) to warm (yellow, stomata closed). On the right is a diagram of the masked shaded crown, and subsample points for R, NIR, and THERM of the top- and upper mid-crown. Points randomly occurring in the outer 2.2 m were rejected to avoid contamination by ground cover through the edge of the crown.
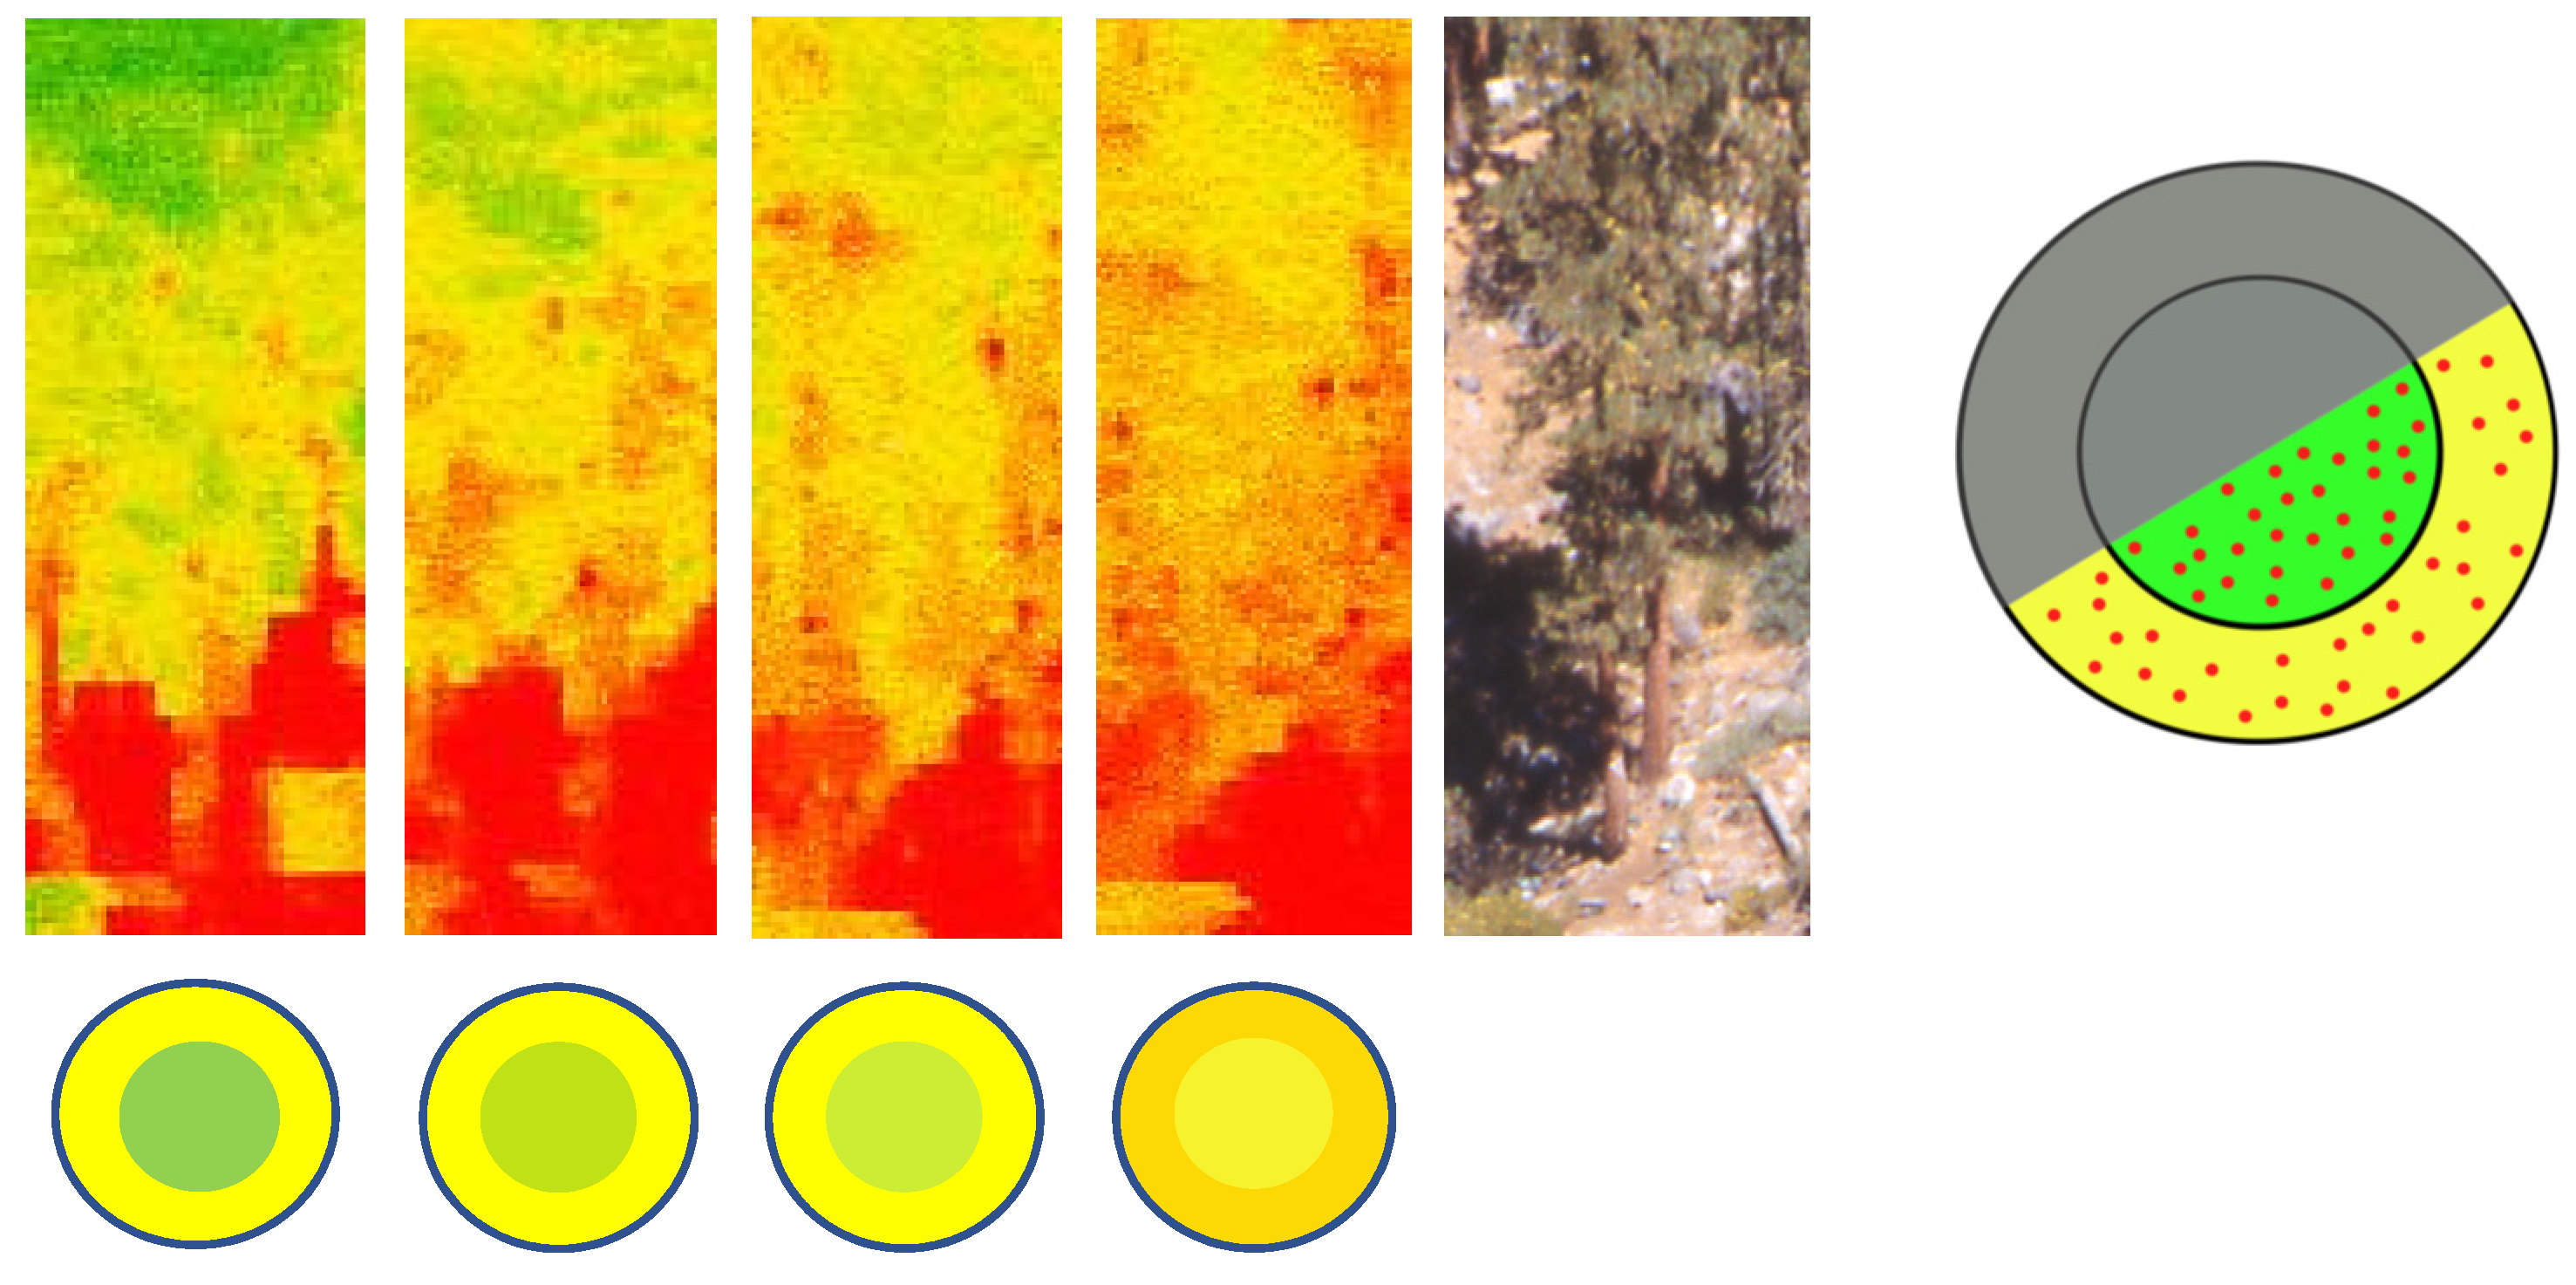
Figure 3.
Diagram of study design, data collection, approach to data analysis, and classification of trees based on selected spectral traits using classification tree and random forest models.
Figure 3.
Diagram of study design, data collection, approach to data analysis, and classification of trees based on selected spectral traits using classification tree and random forest models.

Figure 4.
Loading for the first four principal components for morphological traits (left) and spectral traits (right). Principal components analysis (PCA) cumulative variation explained for the first two axes was 63% for morphological, and 71% for spectral traits.
Figure 4.
Loading for the first four principal components for morphological traits (left) and spectral traits (right). Principal components analysis (PCA) cumulative variation explained for the first two axes was 63% for morphological, and 71% for spectral traits.
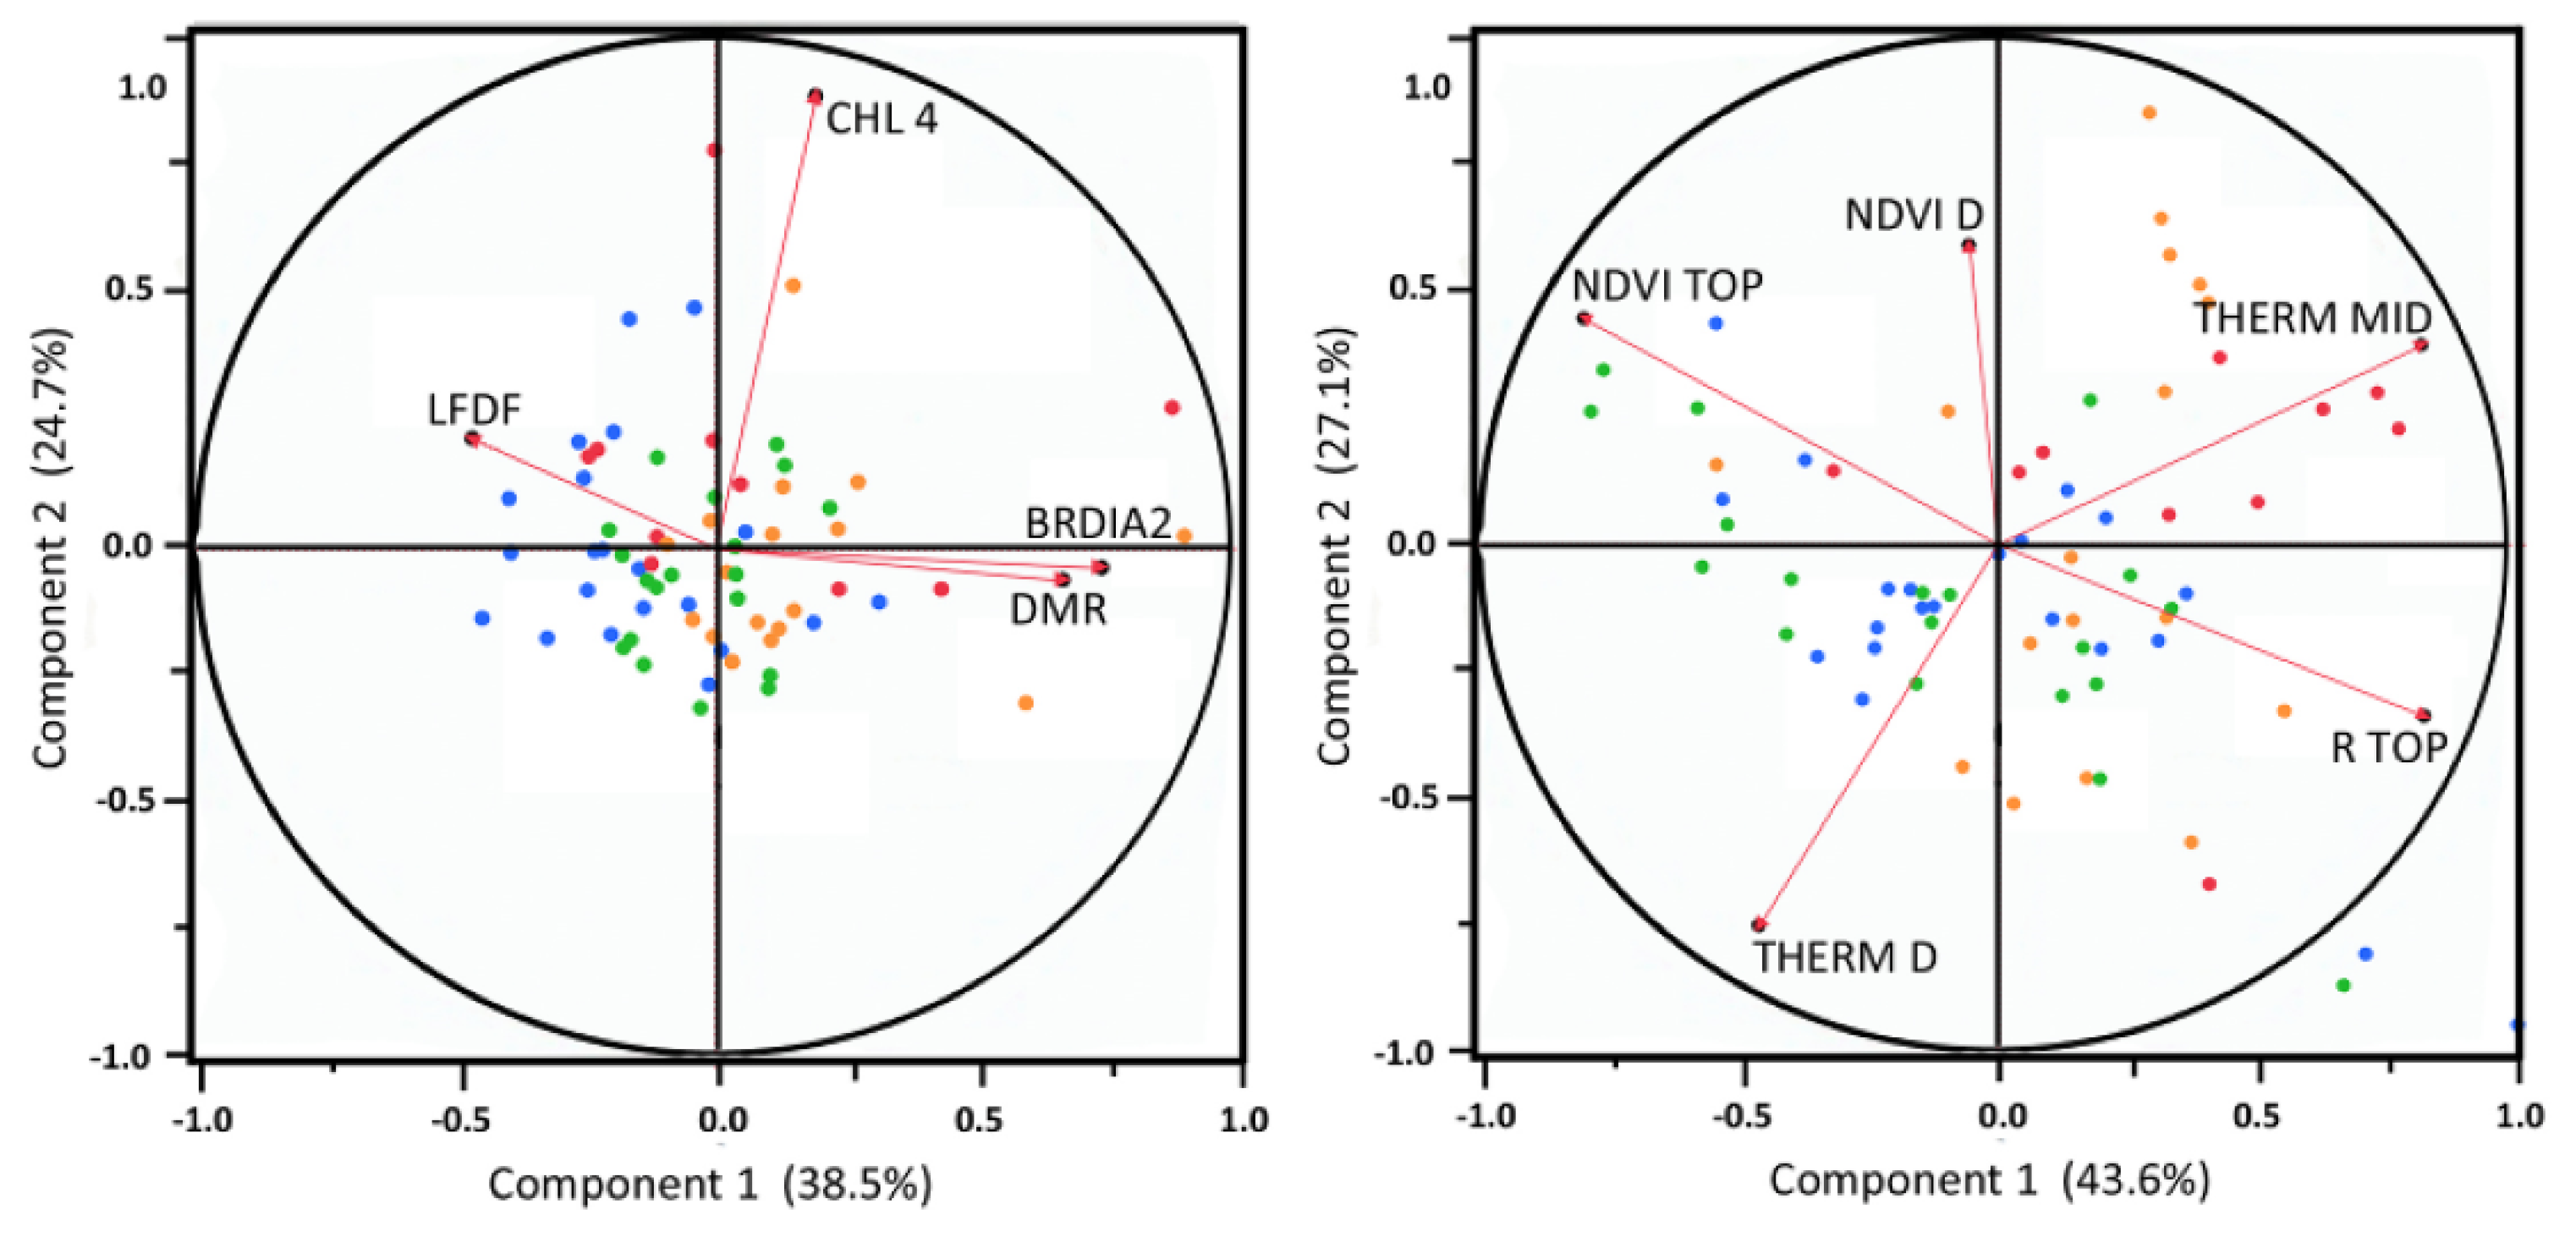
Figure 5.
Mean decrease accuracy (MDA) for morphological (left) and spectral (right) traits using random forest. Acronyms as in Appendix B, except “D” replaces “Δ“ here.
Figure 5.
Mean decrease accuracy (MDA) for morphological (left) and spectral (right) traits using random forest. Acronyms as in Appendix B, except “D” replaces “Δ“ here.

Figure 6.
Classification tree model (CTM) for spectral traits within Jeffrey pine crowns. The difference in crown temperature between upper and mid crown (THERM Δ, upper crown cooler), separated trees in mesic and xeric microsites with 20% error. Further separation of xeric trees was accomplished with NDVI TOP also with 20% error. Further separation of mesic microsite trees into N level (BN or +N) was unresolved.

Table 1.
Crown morphological (a) and spectral (b) traits with significant differences from 2-way ANOVAs: (N level (background (BN), and amended N (+N); nested within water availability level, mesic/xeric). H2O * N indicates the significance of the interaction term. p-values are listed in columns of comparisons. Acronyms for traits given in Appendix B.
| a. | Mesic/Xeric | BN/+N | H2O * N |
|---|---|---|---|
| CHL4 | 0.018 | 0.241 | 0.096 |
| BRDIA2 | 0.011 | 0.905 | 0.751 |
| LF DF | <0.0001 | <0.0001 | <0.0001 |
| DMR | 0.043 | 0.725 | 0.679 |
| b. | |||
| R TOP | 0.005 | 0.276 | 0.976 |
| NDVI TOP | 0.012 | 0.246 | 0.558 |
| NIR SC TOP | 0.005 | 0.274 | 0.590 |
| THERM Δ | <0.0001 | 0.348 | 0.327 |
Table 2.
Significance of canonical correlation analysis (CCorA) tests.
| Test | Value | Approx. F | # DF | DenDF | Prob > F |
|---|---|---|---|---|---|
| Wilks’ λ | 0.4341 | 1.93 | 16 | 98.40 | 0.0150 |
| Pillai’s Trace | 0.6450 | 1.68 | 16 | 140.00 | 0.0269 |
| Hotelling-Lawley | 1.1275 | 2.19 | 16 | 58.25 | 0.0103 |
| Roy’s Max Root | 0.9550 | 8.36 | 4 | 35.00 | <0.0001 |
© 2020 by the authors. Licensee MDPI, Basel, Switzerland. This article is an open access article distributed under the terms and conditions of the Creative Commons Attribution (CC BY) license (http://creativecommons.org/licenses/by/4.0/).
Share and Cite
MDPI and ACS Style
Grulke, N.; Maxfield, J.; Riggan, P.; Schrader-Patton, C. Pre-Emptive Detection of Mature Pine Drought Stress Using Multispectral Aerial Imagery. Remote Sens. 2020, 12, 2338. https://doi.org/10.3390/rs12142338
AMA Style
Grulke N, Maxfield J, Riggan P, Schrader-Patton C. Pre-Emptive Detection of Mature Pine Drought Stress Using Multispectral Aerial Imagery. Remote Sensing. 2020; 12(14):2338. https://doi.org/10.3390/rs12142338
Chicago/Turabian StyleGrulke, Nancy, Jason Maxfield, Phillip Riggan, and Charlie Schrader-Patton. 2020. "Pre-Emptive Detection of Mature Pine Drought Stress Using Multispectral Aerial Imagery" Remote Sensing 12, no. 14: 2338. https://doi.org/10.3390/rs12142338
Note that from the first issue of 2016, this journal uses article numbers instead of page numbers. See further details here.