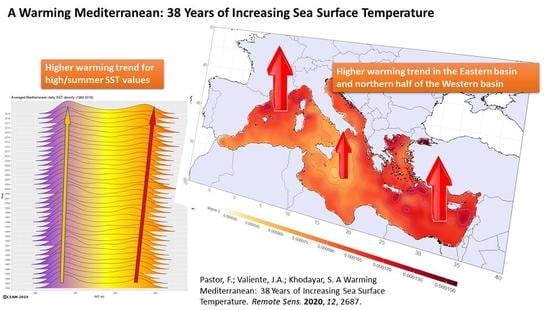
A Warming Mediterranean: 38 Years of Increasing Sea Surface Temperature


Meteorology and Pollutant Dynamics Area, Fundación CEAM, Paterna, 46980 Valencia, Spain
*
Author to whom correspondence should be addressed.
Remote Sens. 2020, 12(17), 2687; https://doi.org/10.3390/rs12172687
Submission received: 3 July 2020
/
Revised: 12 August 2020
/
Accepted: 18 August 2020
/
Published: 20 August 2020
(This article belongs to the Special Issue Sea Surface Temperature Retrievals from Remote Sensing)
Abstract
:The Mediterranean basin has been classified as a hot-spot for climate change. The Mediterranean Sea plays a fundamental regulatory role in the regional climate. We have analyzed the largest available and complete time series (1982–2019) of blended sea surface temperature (SST) data to study its seasonal cycle and look for a possible warming trend in the basin. From the analysis of the Mediterranean mean SST time series, a new temporal seasonal division is derived that differs from the one used in atmospheric climatology. Then, the SST time series were decomposed into their seasonal and trend components, and a consistent warming trend of 0.035 °C/year was obtained. The nature of this trend has been investigated, indicating a higher warming trend for both maximum and high/summer SST values than for the winter/colder ones. This reinforces the consistency of the SST increase since it is not only based on the presence of extreme values, but on a homogeneous basin global increase of high SST records as well. Although warming is found throughout the Mediterranean basin, the spatial variability found leads to the division of the basin into three distinct subareas regarding warming.
1. Introduction
The Mediterranean region’s geomorphology is mainly made up of a semi-enclosed sea, surrounded by relatively high mountain ranges in the western basin and mostly open to the southeast of the basin. A comprehensive description of the Mediterranean basin’s environment, from geology to physical geography and oceanic aspects, can be found in [1]. The Mediterranean Sea covers an area slightly over 2.5 million km2, with its own thermohaline circulation that has been defined as a miniature ocean [2], and it is connected to the Atlantic through the Gibraltar Strait and to the Black Sea through the Marmara Strait. The Mediterranean Sea presents a global negative water balance due to an excess of evaporation over precipitation and river runoff, barely compensated by the inflow of Atlantic water through the Gibraltar Strait [1]. This configuration favors a unique meteorological regime, in which the Mediterranean Sea plays a fundamental role as one of the main drivers of the climate system. Hence, the study of the Mediterranean Sea’s main parameters, such as the sea surface temperature (SST), is key to understanding the climate in the region. This knowledge is of great interest as the Mediterranean has been defined as a hot-spot for climate change [3], where recent accelerated climate change has worsened environmental risks that could increase in future climate scenarios [4]. Besides, the Mediterranean region is highly populated, which sustains persistent human activity and makes it highly vulnerable to any natural or human-driven change that may have a major impact on a regional scale [1]. This human–environment interaction has already had an impact on the Mediterranean environment [1,5,6], including SST, in a feedback mechanism, as changes in weather and climate will affect any human activity.
SST has been defined as one of the Essential Climate Variables (ECV) by the Global Observing Systems Information Center (GOSIC). SST plays an important role in the heat exchanges in the atmosphere–ocean system, as a possible proxy of the ocean’s aptitude to act as a huge heat storage facility through Ocean Heat Content (OHC) variation. Indeed, it has been shown that oceans acted as sinks for more than 90% of the extra energy balance associated with climate change between 1971 and 2010 [7], thus raising SST in the global oceans. Regarding the Mediterranean region, observations have permitted us to calculate an increasing trend in OHC of 0.8 ± 0.1 W/m2 in the 0–700 m layer [8], with an increasing trend after 2005 [9]. From a long SST series recorded at a measuring site in the western Mediterranean basin, [10] also found a warming trend for both SST and sea temperature at different depths. Besides, future climate projections point towards an increase in SST in the 21st century in the Mediterranean region [11,12] that will spread through the whole water column [10].
Especially in a heavy rain prone region such as the Mediterranean basin, the SST is a key factor in the development and/or intensification of torrential rain events [13] through the modification of atmospheric boundary layer processes or flow dynamics, which can affect the amount of precipitated water [14]. SST participates in the mechanisms that trigger extreme weather events, such as medicanes [15,16], which could increase their intensity because of the projected SST and latent heat flux increases resulting from climate simulations [11]. As such, knowledge of SST past trend behavior can act as a good indicator of actual climate change [17], but also of possible future climate scenarios, especially in the Mediterranean area. A side question that will benefit from the improved knowledge on SST climatology and trends concerns the study of Marine Heat Waves (MHW), a topic still under discussion. Changes and variability in SST climatological values will impact the definition and probability of occurrence of MHW, as described in [18,19]. Actual observed and projected changes in SST will also affect marine biodiversity [20,21,22], allowing non-native species to colonize new marine areas.
Although there are available SST measurements, mostly coming from ships, starting from 1850 [23], the best data sources for the study of SST are the measurements collected by sensors on board meteorological satellites that nowadays span almost 50 years [24]. SST satellite data now have a time series sufficiently long to offer statistical robustness to climatological studies, and provide high spatial resolution and global coverage that allows for the improved analysis of space–time trends. For the Mediterranean Sea, different authors have studied global or regional SST trends in the Mediterranean basin. A trend of 0.03 °C/year was found in the western basin and 0.05 °C/year for the eastern basin, from 1985 to 2006, in [25]. Similar trends were reported in [26], with an annual mean warming rate of about 0.037 °C/year for the whole Mediterranean basin, and 0.026 °C/year and 0.042 °C/year for the western and eastern sub-basins, respectively, for 1985–2008. Ref. [27] also found a 0.036 °C/year warming trend for a 25-year series spanning from 1993 to 2017, along with a correlated and positive sea level trend. Studies of longer time series, like [28], calculated a 0.36 °C/decade warming for the global Mediterranean basin for the thirty-year series 1982–2012. In [29], the annual warming trend was of 0.036 °C/year for the deseasonalized Mediterranean global averaged SST, from 1982 to 2016. In a recent paper, ref. [17] described similar values for SST trends, indicating 0.041 °C/year over the whole Mediterranean Sea from 1982 to 2018, with values from 0.036 °C/year in the western basin and 0.048 °C/year in the Levantine–Aegean basin, while a recent report from the Copernicus Marine Service [8] showed a warming trend of 0.04 °C/year for the whole Mediterranean basin. The results from all these studies agree with the consistent warming trend across the Mediterranean basin since the early 1980s, which leads us to think of anthropogenic warming in the context of global change. However, this 30–35 year warming trend could be part of natural multidecadal SST variability. This time span could be the ascending part of a larger 70-yr oscillation of the Mediterranean’s SST, as described in [30], probably or in part linked to the Atlantic Multidecadal Oscillation (AMO). However, this link is still under debate, as the Mediterranean’s SST has not followed the AMO since 2007, as pointed in [17]. Other authors, such as [26], also studied the relationship between Mediterranean SST and atmospheric indices or patterns by means of Empirical Orthogonal Functions analysis, finding that the SST warming trend for 1985–2008 is highly correlated with the Eastern Atlantic pattern and the AMO index, and that the interdecadal SST variability is linked to the North Atlantic Oscillation.
Some interesting questions arise from the aforementioned studies on the spatial distribution of SST warming trends. In some of these papers, a noticeable difference appears between the western and eastern basins. Furthermore, ref. [29] establishes a set of different regions in the Mediterranean basin and different times throughout the year, finding different trends in winter and summer for the different areas of the basin. It is clear, therefore, that the global warming trend is not uniform across the basin throughout the year, making it an interesting topic to be addressed. Another open question, to our knowledge not yet addressed in recent Mediterranean SST studies, is how this warming has been occurring. The observed SST warming trend could be a consequence of a higher frequency of extreme SST events, such as MHW, or it could be due to a generalized rise in the entire SST spectrum, or even just part of it, such as the upper part of the spectrum, with values corresponding to the summer season. If that latter question were to be confirmed, it could affect the seasonal SST cycle in the Mediterranean region, with different implications for human and biological activity.
In the following sections, we will use blended SST data sets, obtained by the optimum interpolation of different sources, including satellite and in situ data, to investigate the Mediterranean’s SST annual cycle and to determine SST possible warming trends. We will also try to understand if this possible warming comes from either a higher frequency of extreme SST events or a general and persistent growth of daily values. At first, we will update the assessment of SST climatology (Section 3.1) and the trend evaluation (Section 3.2) previously shown in [29] with the most recent available data, from 1982 until 2019. Section 3.2 also includes the analysis of trends for SST statistical percentiles, and extreme values that will be evaluated for global averaged series and for different areas in the Mediterranean. Finally, in Section 4 and Section 5 we will present our discussion and conclusions.
2. Materials and Methods
Following a previous study by the authors [29], the data set used in this study is from the Group for High Resolution Sea Surface Temperature (GHRSST) Level 4 AVHRR_OI Global Blended Sea Surface Temperature Analysis version 2.0 (AVHRR_OI hereafter, AVHRR_OI-NCEI-L4-GLOB-v2.0, doi:10.5067/GHAAO-4BC02), from the National Centers for Environmental Information (NCEI), available at the Physical Oceanography Distributed Active Archive Center (PODAAC) of the Jet Propulsion Laboratory at NASA. AVHRR_OI is a blended SST data set obtained via the optimum interpolation of different data sources, such as AVHRR satellite sensors (single sensors in this case), while other data sets use data from different sensors and in situ platforms, yielding a smoothed and complete global SST field with a 0.25 degree spatial resolution. Daily SST data are available from September 1, 1981, up to the present, and are updated in near-real-time in a preliminary version that was processed and revised to the final version after 2 weeks, which we have used in this paper. AVHRR_OI has been compiled and treated under the best practice agreements for data processing and sharing of the GHRSST, an open international science group promoting the application of satellites for monitoring SST. Extensive information, and descriptions of the data set processing and technical details, can be found in [31], wherein the authors indicate that it is suitable for climate monitoring, modeling and other applications. In a recent SST data set intercomparison analysis, ref. [32] studied the strengths and weaknesses of different data sets, including AVHRR_OI, by establishing a relative rank with values ranging from 1 to 3. AVHRR_OI was ranked as a moderate temporal and reduced spatial homogeneous data set. Although it could be understood as a bad result for AVHRR_OI, ref. [32] states that this rank is just an indication to look for the most suitable data set for the intended application, and that none of the data sets perform badly in the different performed analyses. AVHRR_OI has been used in a wide range of studies on ocean circulation [33], marine species distribution [34], physical-biogeochemical model validation [35] and SST trend analysis [29].
To run the different SST analyses, AVHRR_OI data for the Mediterranean region were extracted from the global data, yielding a 4248-point regularly gridded dataset for a total of 13,878 days from January 1982 to December 2019. First, an update of some of the results presented in [29] with the most recent SST data (2019) now included, was performed. A new time series was built to represent the behavior of the whole Mediterranean basin by globally averaging all the grid points’ time series, then decomposing it into its seasonal, trend and noise components via Seasonal and Trend decomposition using the Loess (stl hereafter) procedure [36]. Global monthly and daily climatologies were built for the original SST data and their trend component so that the annual cycle and trends could be investigated. Inside the annual cycle study, density plots for the mean annual time series were studied in order to determine the seasonal distribution of SST values. The trend component for the mean Mediterranean SST was then analyzed in detail by looking for its global tendency. After this global characterization, the SST trend and accumulated SST variation for the 1982–2019 period were computed for each grid point over the Mediterranean Sea to look for spatial variability in the trend. To discern if the SST annual behavior was uniform throughout the whole study period, the trends of statistical percentiles, maximum and minimum SSTs and annual SST amplitude, evaluated as the difference between annual SST extremes, were studied for the averaged Mediterranean SST time series. This analysis was accomplished by building yearly time series of the different SST values corresponding to the statistical percentiles, and the maximum, minimum and annual amplitudes from each year (38 annual values), and then looking for their respective trends across the 38-year study period by means of simple linear regression. Another analysis performed was the study of the yearly frequency of daily values of the global averaged SST, to try to determine changes in the most frequent values throughout the study period.
All statistical analyses in the following sections were run under the R Language and Environment for Statistical Computing [37], from base R functions and some dedicated R packages. For data subsetting, management and graphical output, we mostly used the tidyverse package [38]. For the evaluation of linear SST trends, daily data time series were analyzed by using methods and functions from the R forecast package [39]. At first, the ts function was used to convert the numeric SST vector into a new time series object for the Mediterranean region. Then, the stl procedure was used to split the time series into their components (trend, seasonal and remainder). Different methods can be used for the analysis of the SST time series, from simple linear regression [10] to Generalized Least Squares models [40]. In our analysis, the tslm function from the forecast package, which mimics a linear regression but retains the time attributes, was used to fit a linear model for the trend component of the time series, giving both the model slope and its error.
3. Results
3.1. Mediterranean SST Climatology
As stated in [29], the Mediterranean presents the typical behavior of a mid-latitude sea. A global mean SST time series was found by averaging daily SST data from the whole basin. This series shows a clear annual cycle, with lower values from February to the start of March and with the highest values in summer, mostly through August. Figure 1 shows this annual cycle for the global mean SST in the Mediterranean from January 1982 to December 2019. It must be noted that most of the years above the climatic mean (black line in Figure 1) were registered after 2000 (blue to pink tones).
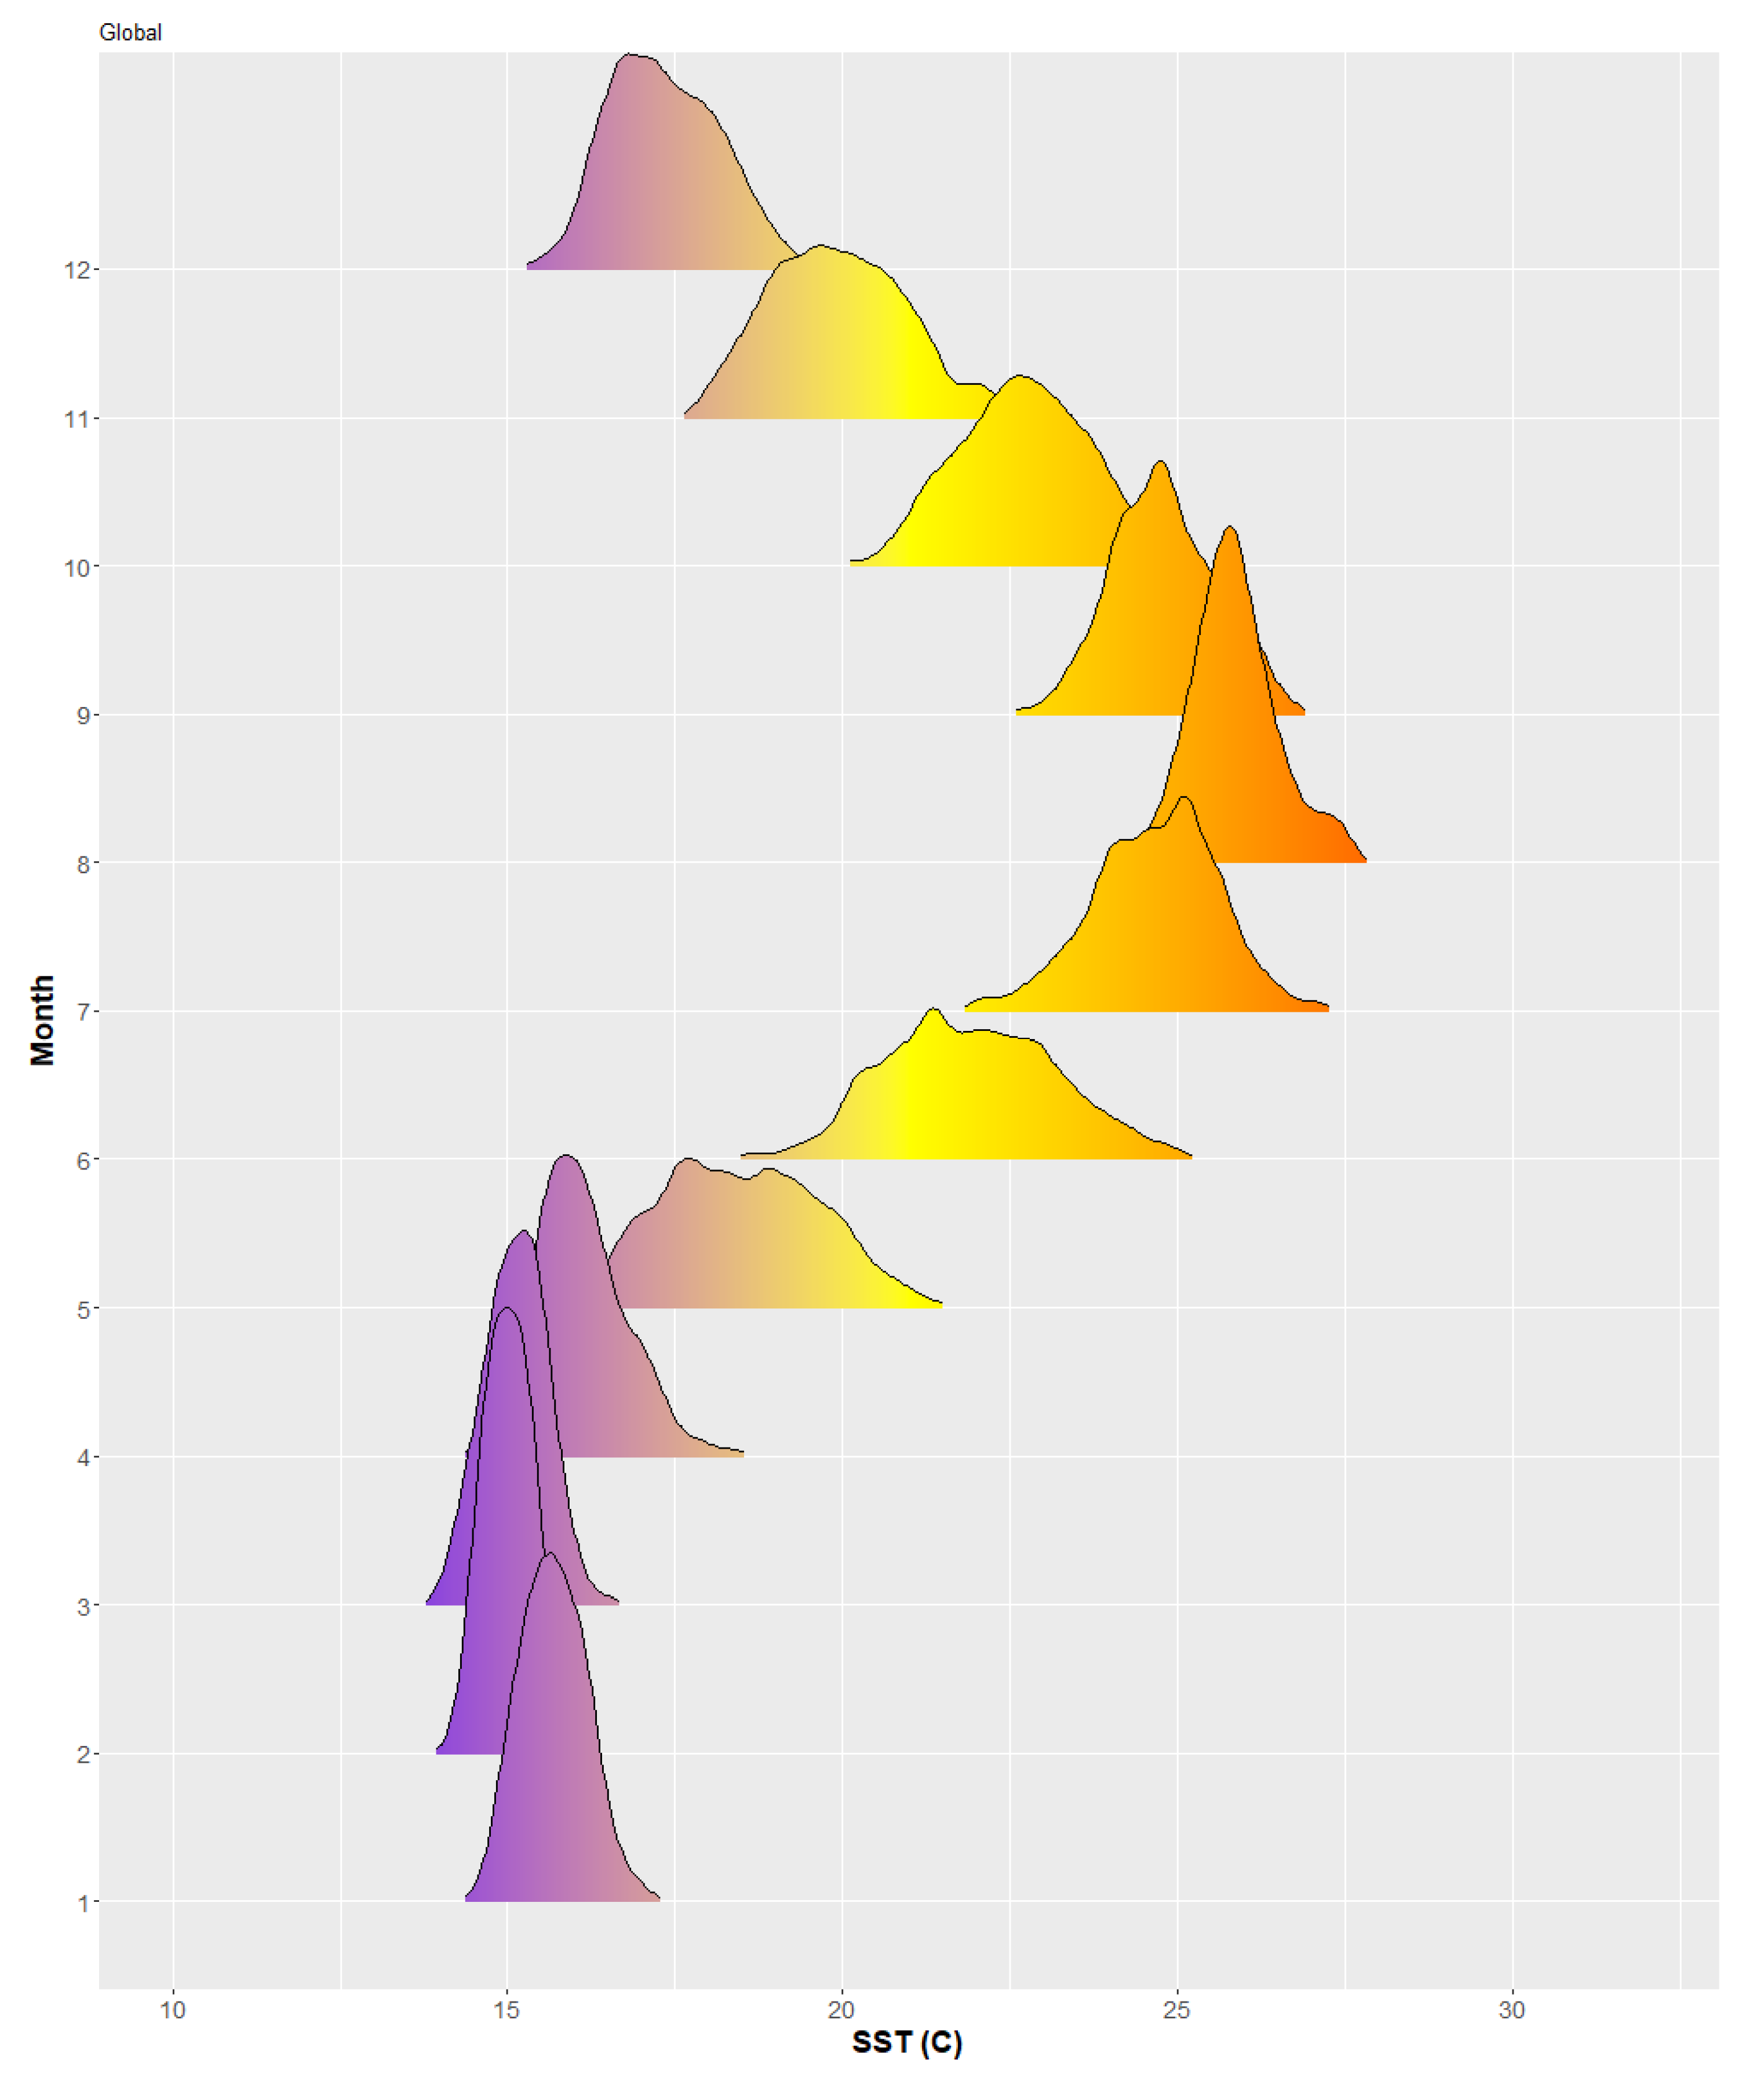
To determine how SST values are distributed across the year, a density analysis of daily mean Mediterranean SST was run and is shown in Figure 2, where daily values are grouped monthly. The highest SST density values were recorded in the first months of the year, from January to April. These months also present the smallest SST amplitude throughout the year except for April, whose density curve presents an SST range close to that of winter, but with an upper tail (higher SST). May and June show flatter density curves, and much broader SST amplitudes that start to shorten from July onwards, but remain clearly broader than those of the winter months. Besides that, the density curve sharpens again between July and September, with a high peak value in August, the month showing the highest SST values. From October to December, a similar behavior to that of the months of May and June was recorded, which results in the flattening of the curve and the expansion of the SST range, progressively running to lower SST values. Although some of the December values lie in the range of the other winter months, the density curve more closely resembles that of October and November. Similar behavior is found when the same analysis is run for different Mediterranean sub-basins, as shown in Supplementary Figure S1.
SST monthly mean maps are shown in Figure 3, which shows Mediterranean SST spatial distribution patterns. Globally, a positive north to south gradient can be seen, with higher temperatures to the south, especially in the western Mediterranean basin, and also to the east in the Levantine basin, as stated in [22,29], but some differences can be seen between the winter and summer SST spatial patterns. The north to south gradient is clear in winter for most of the Mediterranean basin, but in summer a set of differentiated areas appears without such a clear latitudinal gradient, depending mostly on oceanographic factors related to the Mediterranean thermohaline circulation, but also to some extent on meteorological factors [29].
3.2. SST Trend
To evaluate the temporal trends, a time series was built for all of the 4248 regularly distributed points forming the database across the Mediterranean Sea. Then a new globally averaged SST time series was calculated by deriving daily averages for all the available data. A decomposition of the time series was then run to look for their seasonal, trend and random components, for a proper evaluation of the actual SST tendency of both the individual grid points and the global mean series.
The first step was the evaluation of the deseasonalized trends for each of the Mediterranean grid points. The result of this analysis (Figure 4) of the daily trend shows a warming rate with a minimum value of 0.009 °C/year and a maximum of 0.06 °C/year. This yields a range of 0.05 °C/year, which indicates a noticeable spatial variability (Figure 4). Lower warming values are found in the area extending from the southern half of the Tyrrhenian sea and southern Italy towards the Libyan coast, while higher values are located in the northern half of the western basin and large parts of the Levantine basin. Transferring the SST daily increase to the 1982–2019 accumulated total values (shown as Supplementary Figure S2), the highest accumulated warming, over 1.5 °C, was found in the area from the Ligurian sea through the Lion Gulf and Catalonian coast in the western basin, and in broad areas in the Levantine basin. If the 1.25 °C isoline is chosen, most of the western Mediterranean basin and the Adriatic Sea are also included. From the spatial structure of SST trend and accumulated warming, we propose a non-statistically based division of the Mediterranean into three different areas, regarding warming trend: western, central and eastern basins (WMED, CMED and EMED hereafter), delimited by the Gibraltar strait and the 10°E meridian for the WMED, 10–22°E for the CMED and the 22°E meridian eastwards for the Levantine basin.
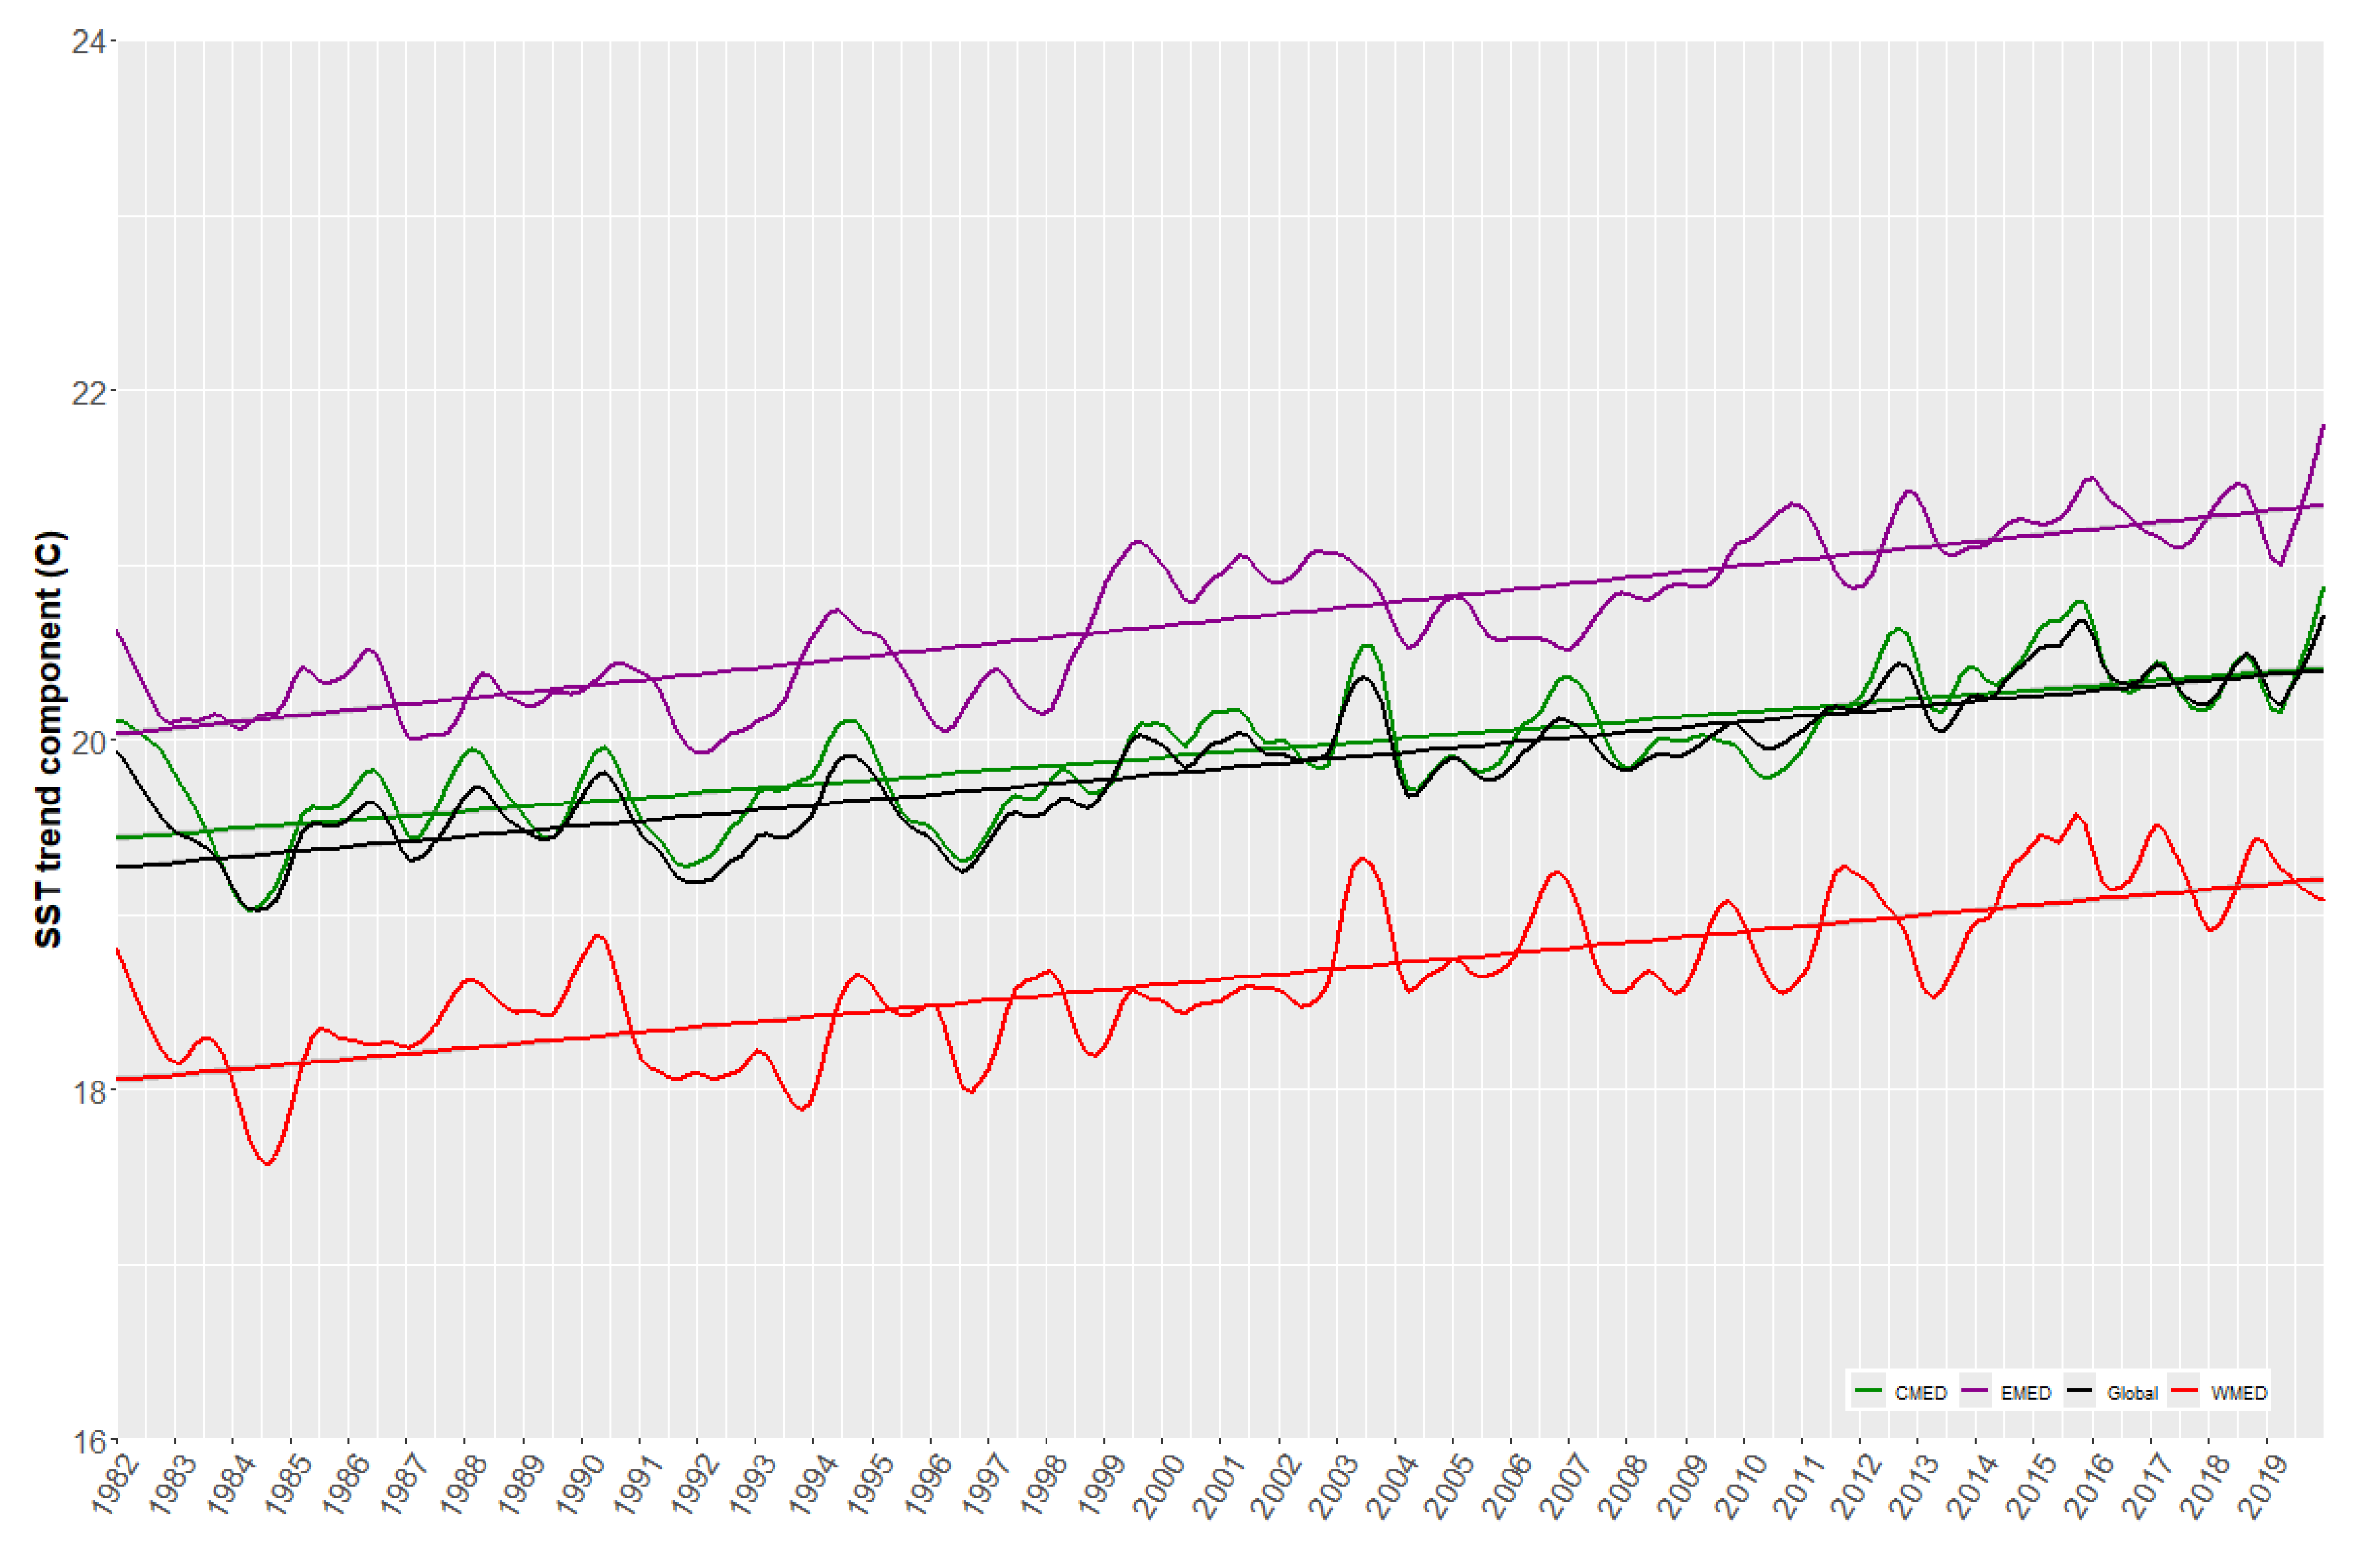
To assess the global basin’s SST warming, a mean SST time series was calculated by daily averaging all grid point values. Once this time series was decomposed into trend, seasonal and random components, its trend component was used to calculate a linear trend (black lines shown in Figure 5; full SST data series before deseasonalization shown in Supplementary Figure S3). A daily warming trend of 9.5 × 10⁻⁵ °C/day (0.035 °C/year) was calculated for the deseasonalized SST time series, which is in close agreement with the 9.9 × 10⁻⁵ °C/day (0.036 °C/year) value found in [29] for the 1982–2016 period, so no significant change has been found in the SST trend with the addition of the last three years. The daily trend calculated in this study yields an annual warming rate of 0.035 °C/year, which produces a mean accumulated warming of 1.3 °C for the whole study period (1982–2019) in Mediterranean SST. If we look at the deseasonalized mean SST component for the three beforementioned sub-basins (WMED, CMED and EMED), we can see warming trends of different intensities (Figure 5). The highest warming trend corresponds to EMED, with a value of about 0.040 °C/year, while the lowest one is found in CMED with 0.031 °C/year. WMED presents a warming rate of 0.035 °C/year, this being the closest to the global Mediterranean basin trend. It is worth noting the drop in deseasonalized SST in the first part of the 1990s when the Eastern Mediterranean Transient occurred [41].
Once the global and sub-basin warming trends were quantified, an analysis of different annual percentiles was run in order to characterize the warming tendency recorded in the last 38 years in the Mediterranean basin. Typical statistical percentiles were evaluated (Table 1) for the deseasonalized averaged SST time series from the global basin and the three sub-basins (WMED, CMED and EMED). New time series were built for the different percentiles by looking for SST values corresponding to every percentile every year, thus building time series with 38 SST values (one per year). Once these series were updated, a linear regression was calculated for each of them. Results for the slope of the linear regressions are shown in Table 1 and Figure 6.
Figure 6 shows a warming trend for all percentiles, this being apparently higher for the upper ones (percentiles 75, 90 and 95). From Table 1, we can see that the highest trend values are found for percentile 90 in the global, CMED and EMED basins, while percentile 75 is the highest for the WMED. The lowest trend value corresponds to colder/winter temperatures, namely percentile 10. In all cases, the higher trends are all computed in the EMED basin, with the exception of percentile 75, which reaches its maximum value in the WMED. Both the extreme values for percentile trends (minimum and maximum) are found in the WMED basin for percentiles 10 and 75, respectively. Additionally, the trend values were also computed for the yearly absolute maximum and minimum SSTs. In all cases (global Mediterranean and sub-basins), the trend of maximum SST is greater than the trend of minimum SST, with a value of 0.031 °C/year for maximum SST and 0.018 °C/year for the minimum in the case of the whole Mediterranean basin. The highest trend is found for the maximum SST in the EMED basin, with 0.037 °C/year, while the lowest, 0.012 °C/year, is found for the minimum SST in the CMED basin. The previous results suggest that most of the warming trend lies in the higher SSTs, especially from percentile 75 and up. In order to test this hypothesis, a yearly density analysis was run for the whole Mediterranean and sub-basins. Figure 7 shows the density for each SST value, splitting the whole series by year, for the global Mediterranean basin and the three sub-basins. Two different annual density peaks are found for the winter and summer SST values, with the highest density for winter values, as was determined by the monthly density analysis in Figure 2. To properly assess the yearly trend of these two density peaks, the SST time series were split into two different datasets using the SST yearly median as divider; then, the SST with the highest density (the most frequent) was found for each of the new time series.
Figure 8 shows the time series for maximum SSTs (upper panel) and the most frequent/higher density SSTs (bottom panel) that were obtained exclusively from the above-median SST time series. In this latter case, the highest trend is found for the WMED basin (0.069 °C/year), while the lower one is calculated in the EMED basin (0.038 °C/year), contrary to most of the previous trends that were higher in the EMED basin. This result reinforces the previous one, showing that percentile 75 also manifested its highest trend in the WMED, where the gap between the most frequent SST values for summer (Figure 8 bottom panel) has been reducing with respect to the other basins. The trends of the highest density SSTs in the below-median time series (not shown) are smaller than the corresponding ones in the above-median SSTs.
As the Mediterranean SST has been heating up for the past 38 years, the number of days that statistical percentiles, obtained from the complete mean SST series, are exceeded in a natural year should also be increasing. Figure 9 shows the number of days (and linear trend) exceeding the different statistical percentiles, where a positive trend can be seen for all percentiles, this being higher for the lower and upper ones.
4. Discussion
From our analysis of the SST climatology in this study (Figure 1, Figure 2 and Figure 3), some differences also arise with respect to the seasonal division used in atmospheric climatology. In our study we have found a slightly different temporal division for SST, changing both the onset and duration of the seasons for the whole Mediterranean Sea based on monthly SST values and density distribution (Figure 2). The analysis shows a displacement of the colder/winter months to January, February and March, and maybe part of April, instead of the usual winter definition (December to February), and the warmer/summer months to July, August and September instead of the usual June, July and August. Starting from the end of April and extending through the months of May and June, a transition from winter to summer regimes is observed, both in SST values and spatial distribution. From October to December, a less pronounced transition than in spring is observed towards the winter SST regime. In the case of the Adriatic sea, ref. [42] defines the “ocean” seasons based on the computation of heat storage, finding two “extreme” seasons running from January to April for winter and from July to October for summer, with two transition periods consisting of May–June for spring and November–December for autumn. The spatial analysis of SST monthly climatology (Figure 3) confirms the results presented by the authors in their previous work [29], wherein SST winter and summer distributions were described by clustering different SST areas and also identifying transition regimes in spring and autumn.
A noticeable spatial variability was found during the study of SST trends in the Mediterranean basin, as shown in Figure 4. Following the surface water thermohaline circulation in the Mediterranean, described in [43], it can be seen that most of the areas with lower warming rates in the WMED coincide with the first stages of surface Atlantic water mass that flow into the Mediterranean through the Strait of Gibraltar. This variability in SST warming trend also induces different accumulated warming values depending on the studied area (Figure S2). This leads us to a new division of the Mediterranean basin into the three beforementioned subbasins (WMED, CMED and EMED) based on the warming rate for the 1982–2019 period.
Once those three different areas were defined, an SST trend analysis was run for each of them and for the global Mediterranean basin. A decadal trend in the warming rate of 0.35 °C/decade was found, with an accumulated warming of 1.3 °C from 1982 to 2019 in Mediterranean SST. This trend value, 0.035 °C/year, is slightly lower than the 0.041 °C/year found by [17] for 1982–2018, and is in line with most of the warming trends found in the recent scientific literature for different periods and different SST databases during the satellite era, such as the 0.037 °C/year from [26]. Regarding the different subbasins, the WMED’s warming rate of 0.035 °C/year is similar to the 0.036 °C/year found by [17] and the 0.039 °C/year for the EMED in our case, which is lower than the 0.048 °C/year of [17] in the Levantine–Aegean basin, although the compared regions’ extents are not strictly the same. Comparable results were also obtained by [25] from 1985 to 2006, with values of 0.03 °C/year in the western basin and 0.05 °C/year for the eastern basin.
As shown in Figure 1, if the Mediterranean SST presents a clear annual cycle, then the percentile values of SST should present roughly constant/repetitive values every year in the absence of warming, so the tendency of those percentiles could explain how the Mediterranean has warmed up. An analysis of the trend of the annual percentile series shows positive values for all of them, but with higher warming rates for percentiles 75 (WMED) and 90 (global, CMED and EMED), which suggests that the warming in the Mediterranean is mainly due to an increase in the frequency of high SST values, not only extreme ones. To assess this hypothesis, an annual density plot analysis was performed yielding a bi-modal distribution with two SST density peaks in winter and summer. Hence, the SST series was divided into two new series accounting for SST values above and below the annual median SST. The trend values for the most frequent SSTs in both series show a higher warming rate in the case of the above-median series, which reinforces the previous hypothesis and is in accordance with the percentiles trend analyses. Additionally, the number of days per year in which the percentiles were exceeded was also increasing, with the highest values for the 10 and 90 percentiles.
5. Conclusions
The Mediterranean region has been defined as a hot-spot for climate change, and it is exposed to important impacts that will intensify environmental risks. In the Mediterranean geoclimatic context, the sea plays a fundamental role as a regulator of the climate system through sea–atmosphere interactions, such as energy and moisture exchanges. This fundamental role will gain importance in the context of global climate change, along with the observed increase in energy storage in the oceans. These exchange processes are correlated with the sea surface temperature, so it is of great interest to know its past and future evolution.
The results of this study let us conclude that a consistent warming trend has been present in the Mediterranean SST for almost 40 years, in the same line as the works of other authors in recent years. This warming rate presents a noticeable spatial variability, with the highest values in the eastern Mediterranean and the northern half of the western Mediterranean, and a lowest, but also positive, trend to the south of Italy. Regarding how this warming has occurred, the results show that it is not just an increase in extraordinary records, but mostly an increase in the frequency of high or relatively high SSTs. In the framework of climate change, these trends and their nature need to be periodically revised and analyzed for future scenario projections that could help stakeholders in the establishment of mitigation and adaptation policies. In this sense, further work is needed towards the identification of both atmospheric and oceanographic processes and interactions.
From the analyses of the density distribution of SST values, we have found a different seasonal distribution to that used in the atmospheric climatology associated with the seasons defined in [42]. A clear and strict definition of the seasons’ limits is not easy to achieve, especially relating to the start and end of the transitional regimes in spring and autumn that share SST values with the preceding/continuing seasons. From this analysis, a new climatological seasonal distribution, exclusive to the Mediterranean sea, is derived that extends the winter season from January to March–first half of April, spring from late April to June, summer to July–September and autumn October–December. Although this approach to a new seasonal distribution for SST deserves a deep and extensive discussion for different seas, this temporal density analysis should be considered in the future evaluation of seasonal SST trends in the Mediterranean and other sea areas in the world.
The progressive and accumulated heating that has been recorded in the Mediterranean Sea will have broad implications for the Mediterranean environment, effecting aspects from biodiversity to weather related risks, especially in this latter case wherein the growing energy available for the air–atmosphere interaction can exacerbate the intensity and impacts of extreme events such as torrential rains and medicanes. Future work is intended to look for the correlation between SSTs, especially marine heat waves, and extreme precipitation events in the Mediterranean area.
Supplementary Materials
The following are available online at https://www.mdpi.com/2072-4292/12/17/2687/s1, Figure S1: Monthly density plot for the mean Mediterranean SST in global, Western, Central and Eastern basins, Figure S2: Accumulated warming from the linear tendency of the SST trend component from January 1982 to December 2019, Figure S3: Mediterranean SST time series and linear regression (at 99% confidence level) for 1982–2019 for the global Mediterranean basin.
Author Contributions
Conceptualization, F.P.; Data curation, F.P.; Formal analysis, F.P.; Funding acquisition, J.A.V.; Investigation, F.P.; Methodology, F.P.; Writing—original draft, F.P.; Writing—review and editing, F.P., J.A.V. and S.K. All authors have read and agreed to the published version of the manuscript.
Funding
This research was funded by the research projects VERSUS CGL2015-67466-R (MICINN/FEDER), funded by the Spanish R&D&I national plan of Spanish Ministry of Science, Innovation and Universities and European Regional Development Fund and the IMAGINA-PROMETEO (PROMETEU/2019/110) funded by the Generalitat Valenciana.
Acknowledgments
SST daily data available from National Centers for Environmental Information. GHRSST Level 4 AVHRR_OI Global Blended Sea Surface Temperature Analysis (GDS version 2) from NCEI. Ver. 2.0. PO.DAAC, CA, USA. Dataset last accessed 2020-03-01 at http://dx.doi.org/10.5067/GHAAO-4BC02. “The Group for High Resolution Sea Surface Temperature (GHRSST) AVHRR_OI Global Blended Sea Surface Temperature Analysis (GDS version 2) data were obtained from the NASA EOSDIS Physical Oceanography Distributed Active Archive Center (PO.DAAC) at the Jet Propulsion Laboratory, Pasadena, CA (http://dx.doi.org/10.5067/GHGMR-4FJ01).”
Conflicts of Interest
The authors declare no conflict of interest.
References
- Poulos, S.E. The mediterranean and black sea marine system: An overview of its physico-geographic and oceanographic characteristics. Earth Sci. Rev. 2020, 200, 103004. [Google Scholar] [CrossRef]
- Bethoux, J.P.; Gentili, B.; Morin, P.; Nicolas, E.; Pierre, C.; Pino, D.R. The mediterranean sea: A miniature ocean for climatic and environmental studies and a key for the climatic functioning of the North Atlantic. Prog. Oceanogr. 1999, 44, 131–146. [Google Scholar] [CrossRef]
- Giorgi, F. Climate change hot-spots. Geophys. Res. Lett. 2006, 33, 1–4. [Google Scholar] [CrossRef]
- Cramer, W.; Guiot, J.; Fader, M.; Garrabou, J.; Gattuso, J.P.; Iglesias, A.; Lange, M.A.; Lionello, P.; Llasat, M.C.; Paz, S.; et al. Climate change and interconnected risks to sustainable development in the Mediterranean. Nat. Clim. Chang. 2018, 8, 972–980. [Google Scholar] [CrossRef] [Green Version]
- Millán, M.; Estrela, M.J.; Sanz, M.J.; Mantilla, E.; Martín, M.; Pastor, F.; Salvador, R.; Vallejo, R.; Alonso, L.; Gangoiti, G.; et al. Climatic feedbacks and desertification: The Mediterranean model. J. Clim. 2005, 18, 684–701. [Google Scholar] [CrossRef] [Green Version]
- Pausas, J.G.; Millán, M.M. Greening and browning in a climate change hotspot: The mediterranean basin. Bioscience 2019, 69, 143–151. [Google Scholar] [CrossRef] [Green Version]
- Pachauri, R.K.; Allen, M.R.; Barros, V.R.; Broome, J.; Cramer, W.; Christ, R.; Church, J.A.; Clarke, L.; Dahe, Q.; Dasgupta, P.; et al. Climate Change 2014 Synthesis Report Summary Change. Contribution of Working Groups I, II and III to the Fifth Assessment Report of the Intergovernmental Panel on Climate Change; IPCC: Geneva, Switzerland, 2014; ISBN 9789291691432. [Google Scholar]
- Schuckmann, K.V.; Traon, P.-Y.L.; Smith, N.; Pascual, A.; Djavidnia, S.; Gattuso, J.-P.; Grégoire, M.; Nolan, G.; Aaboe, S.; Aguiar, E.; et al. Copernicus marine service ocean state report, issue 3. J. Oper. Oceanogr. 2019, 12, S1–S123. [Google Scholar] [CrossRef]
- Iona, A.; Theodorou, A.; Sofianos, S.; Watelet, S.; Troupin, C.; Beckers, J.M. Mediterranean sea climatic indices: Monitoring long-term variability and climate changes. Earth Syst. Sci. Data 2018, 10, 1829–1842. [Google Scholar] [CrossRef] [Green Version]
- Salat, J.; Pascual, J.; Flexas, M.; Chin, T.M.; Cuervo, J.V. Forty-five years of oceanographic and meteorological observations at a coastal station in the NW Mediterranean: A ground truth for satellite observations. Ocean Dyn. 2019, 69, 1067–1084. [Google Scholar] [CrossRef] [Green Version]
- Romera, R.; Gaertner, M.Á.; Sánchez, E.; Domínguez, M.; Alemán, J.J.G.; Miglietta, M.M. Climate change projections of medicanes with a large multi-model ensemble of regional climate models. Glob. Planet. Chang. 2017, 151, 134–143. [Google Scholar] [CrossRef]
- Soto-Navarro, J.S.; Jordá, G.; Amores, A.; Cabos, W.; Somot, S.; Sevault, F.; Macías, D.; Djurdjevic, V.; Sannino, G.; Li, L.; et al. Evolution of Mediterranean Sea water properties under climate change scenarios in the Med-CORDEX ensemble. Clim. Dyn. 2020, 54, 2135–2165. [Google Scholar] [CrossRef] [Green Version]
- Pastor, F.; Valiente, J.A.; Estrela, M.J. Sea surface temperature and torrential rains in the Valencia region: Modelling the role of recharge areas. Nat. Hazards Earth Syst. Sci. 2015, 15, 1677–1693. [Google Scholar] [CrossRef] [Green Version]
- Senatore, A.; Furnari, L.; Mendicino, G. Impact of improved sea surface temperature representation on the forecast of small mediterranean catchments hydrological response to heavy precipitation. Hydrol. Earth Syst. Sci. Discuss. 2019, 24, 1–42. [Google Scholar] [CrossRef]
- Noyelle, R.; Ulbrich, U.; Becker, N.; Meredith, E.P. Assessing the impact of sea surface temperatures on a simulated medicane using ensemble simulations. Nat. Hazards Earth Syst. Sci. 2019, 19, 941–955. [Google Scholar] [CrossRef] [Green Version]
- Pytharoulis, I. Analysis of a Mediterranean tropical-like cyclone and its sensitivity to the sea surface temperatures. Atmos. Res. 2018, 208, 167–179. [Google Scholar] [CrossRef]
- Pisano, A.; Marullo, S.; Artale, V.; Falcini, F.; Yang, C.; Leonelli, F.E.; Santoleri, R.; Nardelli, B.B. New evidence of mediterranean climate change and variability from sea surface temperature observations. Remote Sens. 2020, 12, 132. [Google Scholar] [CrossRef] [Green Version]
- Holbrook, N.J.; Scannell, H.A.; Gupta, A.S.; Benthuysen, J.A.; Feng, M.; Oliver, E.C.J.; Alexander, L.V.; Burrows, M.T.; Donat, M.G.; Hobday, A.J.; et al. A global assessment of marine heatwaves and their drivers. Nat. Commun. 2019, 10, 1–13. [Google Scholar] [CrossRef]
- Jacox, M.G. Marine heatwaves in a changing climate. Nature 2019, 571, 485–487. [Google Scholar] [CrossRef] [Green Version]
- Guastella, R.; Marchini, A.; Caruso, A.; Cosentino, C.; Evans, J.; Weinmann, A.E.; Langer, M.R.; Mancin, N. “Hidden invaders” conquer the sicily channel and knock on the door of the western mediterranean sea. Estuar. Coast. Shelf Sci. 2019, 225, 106234. [Google Scholar] [CrossRef]
- Fourt, M.; Faget, D.; Dailianis, T.; Koutsoubas, D.; Pérez, T. Past and present of a Mediterranean small-scale fishery: The Greek sponge fishery—its resilience and sustainability. Reg. Environ. Chang. 2020, 20, 1. [Google Scholar] [CrossRef]
- Stramska, M.; Aniskiewicz, P. Recent large scale environmental changes in the Mediterranean sea and their potential impacts on Posidonia oceanica. Remote Sens. 2019, 11, 110. [Google Scholar] [CrossRef] [Green Version]
- Rayner, N.A.; Brohan, P.; Parker, D.E.; Folland, C.K.; Kenndy, J.J.; Vanicek, M.; Ansell, T.J.; Tett, S.F.B. Improved analysis of changes and uncertainties in sea surface temperature measured in situ since the mid-ninteenth century: The HadSST2 dataset. J. Clim. 2006, 19, 446–469. [Google Scholar] [CrossRef] [Green Version]
- Minnett, P.J.; Azcárate, A.A.; Chin, T.M.; Corlett, G.K.; Gentemann, C.L.; Karagali, I.; Li, X.; Marsouin, A.; Marullo, S.; Maturi, E.; et al. Half a century of satellite remote sensing of sea-surface temperature. Remote Sens. Environ. 2019, 233, 111366. [Google Scholar] [CrossRef]
- Nykjaer, L. Mediterranean sea surface warming 1985–2006. Clim. Res. 2009, 39, 11–17. [Google Scholar] [CrossRef]
- Skliris, N.; Sofianos, S.; Gkanasos, A.; Mantziafou, A.; Vervatis, V.; Axaopoulos, P.; Lascaratos, A. Decadal scale variability of sea surface temperature in the Mediterranean sea in relation to atmospheric variability. Ocean Dyn. 2012, 62, 13–30. [Google Scholar] [CrossRef]
- Mohamed, B.; Abdallah, A.M.; Din, K.A.E.; Nagyi, D.H.; Shaltout, M.; Mohamed, A. Inter-annual variability and trends of sea level and sea surface temperature in the mediterranean sea over the last 25 years. Pure Appl. Geophys. 2019, 176, 3787–3810. [Google Scholar] [CrossRef]
- Shaltout, M.; Omstedt, A. Recent sea surface temperature trends and future scenarios for the Mediterranean Sea. Oceanologia 2014, 56, 411–443. [Google Scholar] [CrossRef] [Green Version]
- Pastor, F.; Valiente, J.A.; Palau, J.L. Sea surface temperature in the mediterranean: Trends and spatial patterns (1982–2016). Pure Appl. Geophys. 2018, 175, 4017–4029. [Google Scholar] [CrossRef] [Green Version]
- Marullo, S.; Artale, V.; Santoleri, R. The SST multidecadal variability in the Atlantic-Mediterranean region and its relation to AMO. J. Clim. 2011, 24, 4385–4401. [Google Scholar] [CrossRef]
- Banzon, V.; Smith, T.M.; Chin, T.M.; Liu, C.; Hankins, W. A long-term record of blended satellite and in situ sea-surface temperature for climate monitoring, modeling and environmental studies. Earth Syst. Sci. Data 2016, 8, 165–176. [Google Scholar] [CrossRef] [Green Version]
- Fiedler, E.K.; McLaren, A.; Banzon, V.; Brasnett, B.; Ishizaki, S.; Kennedy, J.; Rayner, N.; Jones, J.R.; Corlett, G.; Merchant, C.J.; et al. Intercomparison of long-term sea surface temperature analyses using the GHRSST Multi-Product Ensemble (GMPE) system. Remote Sens. Environ. 2019, 222, 18–33. [Google Scholar] [CrossRef] [Green Version]
- Strub, P.T.; James, C.; Montecino, V.; Rutllant, J.A.; Blanco, J.L. Ocean circulation along the southern Chile transition region (38°–46° S): Mean, seasonal and interannual variability, with a focus on 2014–2016. Prog. Oceanogr. 2019, 172, 159–198. [Google Scholar] [CrossRef]
- Farchadi, N.; Hinton, M.G.; Thompson, A.R.; Yin, Z.Y. Modeling the dynamic habitats of mobile pelagic predators (Makaira nigricans and Istiompax indica) in the eastern Pacific Ocean. Mar. Ecol. Prog. Ser. 2019, 622, 157–176. [Google Scholar] [CrossRef]
- Ciavatta, S.; Kay, S.; Brewin, R.J.W.; Cox, R.; Cicco, A.D.; Nencioli, F.; Polimene, L.; Sammartino, M.; Santoleri, R.; Skákala, J.; et al. Ecoregions in the Mediterranean sea through the reanalysis of phytoplankton functional types and carbon fluxes. J. Geophys. Res. Ocean. 2019, 124, 6737–6759. [Google Scholar] [CrossRef] [Green Version]
- Cleveland, R.B.; Cleveland, W.; McRae, J.E.; Terpenning, I. STL: A seasonal-trend decomposition procedure based on loess. J. Stat. 1990, 6, 3–33. [Google Scholar]
- R Core Team. R: A Language and Environment for Statistical Computing; R Foundation for Statistical Computing: Vienna, Austria, 2020; Available online: https://www.R-projects.org/ (accessed on 1 July 2020).
- Wickham, H.; Averick, M.; Bryan, J.; Chang, W.; McGowan, L.D.; François, R.; Grolemund, G.; Hayes, A.; Henry, L.; Hester, J.; et al. Welcome to the tidyverse. J. Open Source Softw. 2019, 4, 1686. [Google Scholar] [CrossRef]
- Hyndman, R.J.; Khandakar, Y. Automatic time series forecasting: The forecast package for R. J. Stat. Softw. 2008, 27, 1–22. [Google Scholar] [CrossRef] [Green Version]
- Schlegel, R.W.; Smit, A.J. Climate change in coastal waters: Time series properties affecting trend estimation. J. Clim. 2016, 29, 9113–9124. [Google Scholar] [CrossRef]
- Incarbona, A.; Martrat, B.; Mortyn, P.G.; Sprovieri, M.; Ziveri, P.; Gogou, A.; Jordà, G.; Xoplaki, E.; Luterbacher, J.; Langone, L.; et al. Mediterranean circulation perturbations over the last five centuries: Relevance to past Eastern Mediterranean transient-type events. Sci. Rep. 2016, 6, 1–10. [Google Scholar] [CrossRef] [Green Version]
- Artegiani, A.; Bregant, D.; Paschini, E.; Pinardi, N.; Raicich, F.; Russo, A. The adriatic sea general circulation. Part I: Air-sea interactions and water mass structure. J. Phys. Oceanogr. 1997, 27, 1492–1514. [Google Scholar] [CrossRef]
- Geziry, T.M.E.; Bryden, I.G. The circulation pattern in the Mediterranean sea: Issues for modeller consideration. J. Oper. Oceanogr. 2010, 3, 39–46. [Google Scholar] [CrossRef] [Green Version]
Figure 1.
Annual cycle for the mean Mediterranean SST from 1982 to 2019. Each line represents a year in the study period, and the black solid line indicates the climatic mean.
Figure 1.
Annual cycle for the mean Mediterranean SST from 1982 to 2019. Each line represents a year in the study period, and the black solid line indicates the climatic mean.

Figure 2.
Monthly density plot for the mean Mediterranean SST.

Figure 3.
Monthly averaged SST for the global study period (1982–2019).

Figure 4.
Daily warming trend in the Mediterranean basin from 1982 to 2019. Each contour denotes a change of 1.5 × 10⁻⁵ °C/day.
Figure 4.
Daily warming trend in the Mediterranean basin from 1982 to 2019. Each contour denotes a change of 1.5 × 10⁻⁵ °C/day.

Figure 5.
Deseasonalized SST trend component and linear regression (at 99% confidence level) for 1982–2019 for the global Mediterranean basin (black), WMED (red), CMED (green) and EMED (magenta).
Figure 5.
Deseasonalized SST trend component and linear regression (at 99% confidence level) for 1982–2019 for the global Mediterranean basin (black), WMED (red), CMED (green) and EMED (magenta).

Figure 6.
Deseasonalized SST percentile annual time series for the period 1982–2019 in the global Mediterranean basin (black), WMED (red), CMED (green) and EMED (magenta).
Figure 6.
Deseasonalized SST percentile annual time series for the period 1982–2019 in the global Mediterranean basin (black), WMED (red), CMED (green) and EMED (magenta).

Figure 7.
Yearly density plot for Mediterranean SST in the whole basin and WMED, CMED and EMED sub-basins.
Figure 7.
Yearly density plot for Mediterranean SST in the whole basin and WMED, CMED and EMED sub-basins.

Figure 8.
Yearly time series of maximum SST (upper panel) and SST corresponding to the maximum density (bottom panel) for summer (SST higher than the yearly median) in the global Mediterranean basin and WMED, CMED and EMED sub-basins.
Figure 8.
Yearly time series of maximum SST (upper panel) and SST corresponding to the maximum density (bottom panel) for summer (SST higher than the yearly median) in the global Mediterranean basin and WMED, CMED and EMED sub-basins.

Figure 9.
Number of days exceeding the statistical percentiles in a natural year for the mean Mediterranean SST.
Figure 9.
Number of days exceeding the statistical percentiles in a natural year for the mean Mediterranean SST.


Table 1.
Trend (in °C/year) for different percentiles in the global, WMED, CMED and EMED basins. Blue/red values account for the lowest/highest tendency in every basin.
Table 1.
Trend (in °C/year) for different percentiles in the global, WMED, CMED and EMED basins. Blue/red values account for the lowest/highest tendency in every basin.
| q10 | q25 | q50 | q75 | q90 | q95 | q100 | |
|---|---|---|---|---|---|---|---|
| Global | 1.87 × 10⁻² | 2.09 × 10⁻² | 2.83 × 10⁻² | 3.34 × 10⁻² | 3.49 × 10⁻² | 3.19 × 10⁻² | 3.12 × 10⁻² |
| WMED | 1.23 × 10⁻² | 2.19 × 10⁻² | 2.78 × 10⁻² | 4.19 × 10⁻² | 3.27 × 10⁻² | 3.55 × 10⁻² | 3.30 × 10⁻² |
| CMED | 1.49 × 10⁻² | 1.76 × 10⁻² | 2.30 × 10⁻² | 2.74 × 10⁻² | 2.95 × 10⁻² | 2.43 × 10⁻² | 2.72 × 10⁻² |
| EMED | 2.95 × 10⁻² | 2.70 × 10⁻² | 3.76 × 10⁻² | 3.62 × 10⁻² | 3.96 × 10⁻² | 3.77 × 10⁻² | 3.75 × 10⁻² |
© 2020 by the authors. Licensee MDPI, Basel, Switzerland. This article is an open access article distributed under the terms and conditions of the Creative Commons Attribution (CC BY) license (http://creativecommons.org/licenses/by/4.0/).
Share and Cite
MDPI and ACS Style
Pastor, F.; Valiente, J.A.; Khodayar, S. A Warming Mediterranean: 38 Years of Increasing Sea Surface Temperature. Remote Sens. 2020, 12, 2687. https://doi.org/10.3390/rs12172687
AMA Style
Pastor F, Valiente JA, Khodayar S. A Warming Mediterranean: 38 Years of Increasing Sea Surface Temperature. Remote Sensing. 2020; 12(17):2687. https://doi.org/10.3390/rs12172687
Chicago/Turabian StylePastor, Francisco, Jose Antonio Valiente, and Samiro Khodayar. 2020. "A Warming Mediterranean: 38 Years of Increasing Sea Surface Temperature" Remote Sensing 12, no. 17: 2687. https://doi.org/10.3390/rs12172687
Note that from the first issue of 2016, this journal uses article numbers instead of page numbers. See further details here.