Oil Spill Mapping from Kompsat-2 High-Resolution Image Using Directional Median Filtering and Artificial Neural Network


1
Department of Geoinformatics, University of Seoul, 163 Seoulsirip-daero, Dongdaemun-gu, Seoul 02504, Korea
2
Center for Environment Assessment Monitoring, Korea Environment Institute, 370, Sicheong-daero, Sejong-si 30147, Korea
*
Author to whom correspondence should be addressed.
Remote Sens. 2020, 12(2), 253; https://doi.org/10.3390/rs12020253
Submission received: 18 November 2019
/
Revised: 18 December 2019
/
Accepted: 8 January 2020
/
Published: 10 January 2020
(This article belongs to the Special Issue Earth Observation from KOMPSAT Optical, Thermal and Radar Satellite Images)
Abstract
:Oil spill accidents in marine environments have a massive impact on ecosystems. Various methods have been developed to detect oil spills using high-resolution optical imagery. However, ocean waves caused by heavy winds occurring in the accident area cause sun glint in the image, and this severely impedes the ability to detect the oil spill area. The objective of this study was to detect oil spill areas from high-resolution optic images using the artificial neural network (ANN) through effective suppression of severe sun glint effects. To enable this, a directional median filter (DMF) was adapted, and its use was compared with that of a traditional low-pass filter. A performance test was conducted using a KOMPSAT-2 image acquired during oil spill accidents that occurred in the Gulf of Mexico in 2010. The proposed method involved two main steps: (i) The sun glint effects caused by the ocean waves were corrected using the DMF; and (ii) the ANN approach was used to detect the oil spill area. The results show the following: (i) The designed DMF, which considers the size and angle of ocean waves, was proficient in correcting the sun glint effect in a high-resolution optical image; and (ii) oil spill areas were efficiently detected using the ANN approach with the proposed filtering method. The oil spill area was classified with accuracies of approximately 98.12% and 89.56% using the receiver operating characteristic (ROC) curve and probability of detection (POD) measurements, respectively. These results show that the accuracy of the proposed method is improved by about 9% compared to the traditional detecting algorithm.
1. Introduction
Oil spill accidents caused by oil tanker accidents, drilling processes on the seabed, or natural oil leaks have a destructive effect on ocean ecosystems [1,2,3,4,5]. To minimize oil spill damage, it is very important to track the location and movement characteristics of the spilled oil [6], and to enable this, techniques used to detect oil spill areas from satellite images (which are repeatedly acquired in most parts of the Earth) are being continuously developed [7,8,9,10].
Most of the oil spill detection algorithms are applied to synthetic aperture radar (SAR) imagery because such images provide information about the sea surface, even at nighttime and in bad weather conditions [11,12,13]. In addition, the difference between the scattering characteristics of the oil and sea surfaces are very suitable for detecting oil spill areas from SAR images [14,15,16,17,18]. However, there are disadvantages in using SAR images in that “look-alikes” can be wrongly interpreted as oil spill areas [4,7]. In this respect, biogenic films are all look-alikes, because they have similar scattering characteristics to the surface of oil, which makes it difficult to detect oil spill areas using SAR images [19,20]. Therefore, one of the major problems in detecting oil spills from SAR images is that it is difficult to distinguish the oil spill area from look-alikes, both visually and algorithmically.
However, it is possible to classify oil spills and look-alikes and obtain oil thickness using spectral information when high-resolution optical images, which have a spatial resolution of 10 m or higher, are used [4,8,9,21,22,23,24,25,26,27,28]. The high-resolution optical satellite imagery has a disadvantage that the detection performance of oil spills is severely reduced by ocean waves. If ocean waves are present in an optical satellite image, a rapid gradient change causes a sun glint effect [29,30,31,32,33], where the reflectance on the sunlit slope is much higher than that on the shaded slope. Thus, it is well-known that the mis-detection rate of the oil spill increases when wind speeds are less than 3 m/s or more than 7 m/s, and this is known to increase false-positive results [34].
Studies have been conducted to reduce the wave effects in high-resolution images. For example, the methods proposed by Hochberg et al. [35], Hedley et al. [36] and Lyzenga et al. [37] corrected the sun glint effect due to ocean waves in different IKONOS images using the relation between near-infrared (NIR) and red-green-blue (RGB) images. This method involves three main assumptions: (i) The NIR reflectance value in the ocean converges to zero due to absorption; (ii) RGB and NIR images have a high correlation in oceans; and (iii) precise atmospheric correction needs to be performed during image pre-processing [32,35]. However, it is difficult to perform precise atmospheric correction in a marine environment where atmospheric water vapor is not uniform; therefore, there is virtually “residual” radiance in a NIR image after atmospheric correction. NIR can be significantly non-zero over areas with high NIR reflectance, such as shallow water, carbonate sand, and photosynthetic organisms, and calculations of glint intensity in such cases will overestimate the glint contribution and result in incomplete wave effects corrections [35].
Other studies have also been conducted to analyze ocean wave effect patterns using two-dimensional (2-D) wave spatial spectra [30,33,38]. The direction and intensity of ocean waves are similar to that of the 2-D wave spatial spectra. Notably, it was confirmed that the spectra pattern was changed according to the wind speed [30,33]. Use of a 2-D spectral analysis method had the advantage of effectively estimating the direction and intensity of ocean waves without requiring accurate atmospheric correction. However, the ability to analyze the physical mechanisms of ocean waves appearing within the remotely sensed image is limited. In other words, no studies have yet attempted to correct ocean wave effects using 2-D spectrum analysis, and studies are therefore required to achieve this to enable the ultimate aim of detecting oil spills after correcting for wave effects.
Recently, various deep learning models have been studied to detect objects or mapping specific regions [39,40,41]. However, the deep learning-based approaches to detect the oil spill area were also mainly used for SAR images [20,25,34,42,43,44,45]. The oil and sea areas of the SAR image are more clearly distinguished than the optical image, so utilizing the SAR image can further ensure deep learning performance. In the case of an optical image, the spectral information of the oil areas may vary depending on the oil thickness [24]. And if the sun glint effect caused by the above-mentioned ocean waves is present in the image, the affected areas have spectral information similar to noise, which may reduce the deep learning performance. Thus, deep learning-based oil spill area detection for optical image needs to be studied, and in particular, a study on the improvement of performance by reducing the sun glint effect is necessary.
This study proposes an efficient method for detecting oil spill areas from high-resolution optical satellite images using the ANN, where sun glint effects relating to severe ocean waves are effectively suppressed. In this respect, (i) the intensity and direction of the sun glint effect were estimated from the power spectrum in the wavenumber domain, and (ii) a directional median filter (DMF) was designed using the estimated intensity and direction. Following the suppression of the sun glint effect by the DMF, oil spill detection was performed using the ANN approach, and four channel images, including Blue to NIR, were used to generate an oil spill probability map. A Korea Multi-Purpose Satellite-2 (KOMPSAT-2) image acquired during the 2010 oil spill accident in the Gulf of Mexico was then used to test the performance of the method. The receiver operating characteristic (ROC) curve and the true oil spill map produced by the manual were subsequently employed to quantitatively validate the proposed method, and the performance of the method was compared with that of a traditional low-pass filter.
2. Study Area and Dataset
The KOMPSAT-2 satellite was launched in July 2006 and is currently in operation [46,47]. It provides four channel images, including blue, green, red, and NIR wavelength bands and has a spatial resolution of 4 m. The KOMPSAT-2 image used for this test was acquired on 2 May 2010 in the Northern part of the Gulf of Mexico at a latitude and longitude of 28°45′N to 28°50′N and 88°19′W to 88°25′W, respectively (Figure 1). The oil spill shown in the satellite image relates to an accident that occurred in the Gulf of Mexico from 20 April–15 July 2010, which was caused by an explosion on the Deepwater Horizon drilling rig and resulted in the subsequent loss of the drilling rig in the Gulf of Mexico [21,48].
Figure 1 shows the KOMPSAT-2 test image used in this study. Figure 1a is the true color composite image with 99% min-max histogram stretching. The image is evidently cloud-free and shows only oil and sea water. Oil covers the right half of the image, and the oil belt is visible at the midpoint. Oil has a lighter silver color than sea water (Figure 1c,d), and silver-emitting oil has a theoretical thickness of 0.05–0.20 μm [8,24]. Figure 1b shows a map of the oil area produced manually based on spectral information obtained from the RGB image. Figure 1b was used to verify the final forecasted oil map. It was provided by a specialist who has a certificate of craftsmanship for drawing technical illustration not related to this study.
The average and maximum wind speeds were approximately 9.1 m/s and 17.0 m/s, respectively, according to the World Climate Data Center (http://en.tutiempo.net). Therefore, strong winds were blowing during the time of the oil spill accident. We can see that the sun glint effects due ocean currents are severe in the area of oil and sea water, and these sun glint effects occur irrespective of the presence of oil and sea water (Figure 1c,d).
3. Method
Figure 2 shows the detailed workflow used in developing the proposed method for detecting oil spill areas from high-resolution optical images in consideration of sun glint effects. The method can be divided into two parts: (1) Mitigation of sun glint effects in the optical image using a DMF, and (2) detection of oil spill areas from the filtered image using an ANN approach. As shown in Figure 2, the image was converted into a frequency domain using 2-D fast Fourier transform (FFT). The zero-mean normalization and hamming window processing are applied to the test image prior to 2-D FFT processing. Following 2-D FFT, the log function is applied to convert the power spectrum image into decibel (dB) units, and the direction and intensity of the sun glint effect were then estimated. A DMF was designed by using the estimated direction and intensity and was then applied to all bands of the image. The directional median filtered image was used for the input neurons of the ANN method to detect oil spill areas.
The training samples for the learning steps of the neural network were selected from the sea water and oil area based on Figure 1b, and the numbers of training sample pixels were randomly selected for the oil region and sea region, respectively. The pixels were used in a training set to fit the initial model, and were used in a validation set to re-adjust the model’s hyperparameters repeatedly. The test set employed to evaluate the final model used all training sample pixels. An oil probability map was generated by the ANN method with the training samples, and it was expected to have a bimodal distribution (as it included both modes from the oil spill and sea water). Oil spill areas were then be detected by determining the threshold values from the bimodal distribution. A detailed description of the proposed method is provided in the following sections.
3.1. Sun Glint Effect Mitigation
To accurately detect oil spill areas, it is necessary to mitigate sun glint effects due to ocean waves (because these effects degrade the detection efficiency). Previous studies have analyzed the sun glint effect due to ocean wave patterns in optical images [30,31,38]. As sun glint effects are regular in size and direction, they can usually be reduced using the regularity of the wave pattern. To enable this in this study, a DMF is designed by estimating the following: (i) The direction and wavelength of the ocean waves; and (ii) the effective width of the wave propagation direction from the 2-D wave pattern in the frequency domain.
Figure 3a shows the 2-D power spectrum of an optical image in the frequency domain and Figure 3b shows how we can determine the window kernel of the DMF from the 2-D power spectrum. If an optical image has a dominant ocean wave, we can estimate (i) the dominant direction (α) and wavelength (λsw) of the ocean waves from the area of high power value in the 2-D power spectrum and (ii) the effective width (de) of the wave propagation direction from the dominant wavelength of the ocean waves and the maximum difference angle (θ) among effective ocean wave propagation directions, as seen in Figure 3a. The wavelength and the effective width can be defined as:
where fsw is the dominant frequency of the ocean waves.
The sun glint effects are then dramatically mitigated from optical images using the DMF. As the angle of the direction median filter is the same as that of the wave propagation direction, the kernel size of the filter is determined from the estimated wavelength and effective width. Once the angle and kernel size of the DMF are determined, the filter can be used to reduce the effect of ocean waves. If the kernel size of Wx and Wy are determined in the pixel and line directions from the estimated wavelength and effective width, the kernel size can then be changed to W’x and W’y after the window kernel has been rotated by the angle of the wave propagation direction (α), as given by [49]:
where Wx and Wy are defined as given by and . The median value in the DMF is calculated by using pixels inside the kernel of the directional filter W’x and W’y all the kernel elements are defined as 0 or 1. Only pixels inside the box with the width and height of Wx and Wy with the value 1 do contribute in the calculation of median; all the other elements outside the new kernel are set to 0.
3.2. Oil Spill Area Detection
The ANN approach is one of the most popular available machine learning methods, and it has already been applied by many researchers to detect oil spill areas in SAR and optical images [25,42,43,44,45]. In this study, the multi-layer perceptron (MLP) algorithm was used for learning. The MLP algorithm consists of three layers: Input layer, hidden layer, and output layer. The hidden layer of the MLP algorithm solves the limitations of the linear classification of the conventional perceptron. The MLP algorithm performs prediction and estimation by adjusting the connectivity between layers using an error backpropagation algorithm, which means repeating the way the signal is transmitted to the hidden layer to output the result. In other words, the error is evaluated by comparing the output value with the true value, and the weight obtained in the direction of reducing the error by backpropagation algorithm is corrected.
In this study, four directional median filtered channel images from Blue to NIR were used as input neurons. The sigmoid function was chosen as an activation function to adjust the predicted value to a value between 0–1, so the result can be expressed with a probability from 0–1. The neural network was iterated for 1000 cycles per one epoch, and a total of 1000 epochs were processed with a learning rate of 0.01. The hidden layer consisted of eight neurons, and one linear output layer was created. The neural network training was performed using randomly 70% as training and validation sample data from the true oil map shown in Figure 1b.
The MLP-ANN result is considered an oil probability map and has pixel values between 0 and 1. A value closer to 1 means a higher probability of oil, and a value closer to 0 means the opposite. Since the study image can be divided into oil and sea areas, the probability map must have a bimodal histogram if the ANN approach is properly performed. Once we determine an appropriate threshold value using the bimodal histogram, oil spill areas can be easily detected. The method of determining the threshold value is similar to the methods used by References [50,51,52,53,54]. This method involves finding the intersection of two probability density functions (PDF) of the oil and sea objects. The vertex of the fitted second-order function is considered as the threshold value.
3.3. Performance Validation
To validate the classification result, the test dataset was selected from the whole true oil regions shown in Figure 1b. Four indices were used to validate the performance of the proposed method: The probability of detection (POD), probability of false detection (POFD), false alarm ratio (FAR), and proportion correct (PC) indices. The POD (also called sensitivity, the true positive rate, or recall) assessed whether the true oil could be forecasted correctly as the oil. The POFD (also called 1-specificity) evaluates whether the true sea area was mistakenly forecasted as oil. The FAR is a similar concept to the POFD, the proportion of false forecasted oil among predicted oil area. The PC is total accuracy; it means the degree to which oil and sea surfaces can be detected accurately [44,45]. The value distribution of all indices ranges from 0–1. When the POD and PC are closer to 1, then FAR and POFD are closer to 0, which means that the forecasted oil spill area is similar to the actual oil spill area. These indices are the most commonly used methods to quantitatively compare processed results with validation data. The POD, POFD, FAR, and FAR indices are defined in [44,45] as:
where is the number of true positive pixels, is the number of false-positive pixels, is the number of false-negative pixels, and is the number of true negative pixels. The true positive means the oil area is well detected as oil (hit), false-positive means falsely detecting the true sea area as oil (false), the true negative means that the sea area is classified as a sea area, and false-negative means that the true oil area classified as sea (miss).
The oil spill probability map was also validated using a ROC curve, which consists of an x-axis, y-axis, and the area under the curve (AUC) and is used to indicate the accuracy of the classification. The x- and y-axes represent the false positive rate and true positive rate, respectively, which means that true sea area is forecasted to be sea area, and the true oil was forecasted as being oil spill area [42,53]. The AUC is calculated from the area under the ROC curve and has a value between 50–100%. In this study, the AUC was calculated from three MLP-ANN derived oil spill maps based on the no-filtered, low-pass filtered, and directional median filtered images. The highest AUC among the three oil spill maps produced in this study means that the result is most similar to the true oil map.
4. Results and Discussion
4.1. Sunglint Effect Mitigation
Figure 4 shows the pattern of the sun glint effects appearing in the 2-D power spectrum image of the KOMPSAT-2 test image and the direction and size of the DMF designed from the 2-D power spectrum. Three regions in the 2-D power spectrum have relatively large decibel intensity values, as is evident from Figure 4a. The red pixels (large decibel values) at the image center represent the overall image characteristics, while the red pixels in the upper left and lower right of the 2-D power spectrum image are the sun glint effects. The distance from the image center to the upper left or lower right large decibel areas represents the wavelength of oceans waves, and the angle represents their direction.
This 2-D power spectrum of the study image in the frequency domain has been used for constructing the DMF from the size and direction of ocean waves, according to Equation (1). Figure 4b shows only the pixels with large decibels in Figure 4a. As shown in Figure 4b, the estimated direction and wavelength of the ocean waves are approximately 43° and 65 pixels, respectively. The maximum difference angle among effective ocean wave propagation directions was approximately 40°, and hence the effective width was determined by approximately 23 pixels, respectively. The new kernel size was recalculated by using Equation (2). The new kernel with 63 × 61 pixels in x and y directions, includes inside exactly the initial kernel rotated by the angle of the wave direction 43°, but all the kernel elements in the new kernel are defined as 0 or 1. Only the elements with the value 1 are used for the calculation of median. So, in fact, the median value in the DMF is still calculated by using pixels inside the tilted box with a width of 23 and a height of 65 pixels.
Figure 5 shows a comparison between the traditional low-pass filtered image and the proposed directional median filtered image. The low-pass filter is a Gaussian averaging filter designed with a kernel size of 37 × 37 with the standard deviation of 1.0. The kernel size was determined by considering the number of pixels used for the median calculation in the directional filter. Figure 5a,b respectively show the images filtered by the Gaussian and DMF. The Gaussian filtered image was smoothed well, but the difference in the brightness value between sunlit and sunshade sides of the ocean waves still remained. However, the DMF was smoothed as well, as the difference in the brightness value between sunlit and sunshade sides of the ocean waves was well mitigated. This means that the sun glint effect was not successfully mitigated using the Gaussian filter, but well reduced by using the proposed DMF.
Figure 5c,d are magnifications of box A in Figure 5a,b. As evident from Figure 5, it is much easier to visually identify the oil spill area than from the original image in Figure 1, and the oil belt at the image center is particularly more visible. However, the results obtained from the low-pass filter and DMF differ. Figure 5a shows that the ocean wave effects appear to have been reduced in the whole region of the image, whereas the zoomed-in area shows that ocean wave effects remain (like noise) remain (see yellow arrows in Figure 5c). This is because the original image was acquired on a very windy day and the sun glint effects due to ocean waves were very strong. This characteristic greatly affects the digital number (DN) values of the image and makes DN values either very large or very small. Therefore, the distribution of the DN values do not follow the generally assumed Gaussian distribution, and the low-pass filter thus has a limited performance. However, the image corrected by the proposed direction median filter shows that sun glint effects are remarkably mitigated. This result confirms that the proposed DMF efficiently reduces the sun glint effects.
Table 1 lists the standard deviations calculated from oil pixels in the no-filtered, low-pass filtered, and directional median filtered images, where it is evident that the proposed filter had the lowest standard deviation, which thus shows that the proposed filter effectively reduces the sun glint effect due to ocean waves.
Most research conducted to correct sun glint effects has used images without oil spill areas, and the associated methods can therefore not be used effectively with images where oil spills and sea water area exist simultaneously. In particular, as the assumption of a correlation between NIR and the RGB images is based on sea water characteristics [32], it is thus further necessary to determine whether this assumption can be applied to oil spill areas that have different spectral characteristics. In this study, we used a different approach to those of previous NIR-based studies to successfully mitigate the sun glint effects in the test image where oil and sea water areas appear simultaneously. The proposed method can clearly be used to detect oil spill areas, even in images where it is impossible to detect the oil spill area due to severe sun glint effects.
4.2. Oil Spill Area Detection
Three oil probability maps were generated using the MLP-ANN approach based on the no-filtered, low-pass filtered, and directional median filtered images, and Figure 6 shows an associated comparison between these maps. The oil probability maps were given values between 0 and 1, where a value closer to 1 indicates the presence of the oil spill area, while 0 denotes sea water. The range of probabilities expressed in Figure 6a,b is between 0.2 and 1.0, and the probability value of the expected oil spill area in Figure 6a appear to have a visually lower value than what the other oil spill areas detected using the filtering methods (Figure 6c,e). In particular, the probability of oil area at zoomed in area (Figure 6b) varies widely and can be seen to be affected by the sun glint effect shown in Figure 1c. Thus, it is impossible to estimate the oil spill area using a particular threshold, even though the oil spill area can be visually identified. This shows how difficult it is to conduct image classification on images with severe ocean wave effects.
The oil spill area is clearly distinguished in Figure 6c–e. The probability of the oil region existing is 0.8 or more, and the probability of the sea water region existing has a low value of 0.2 or less. When comparing the results of applying the two filters, respectively, it can be confirmed that the MLP-ANN approach with the DMF is more useful to detect oil spill area visually (Figure 6e). In the MLP-ANN approach with low-pass filter (Figure 6c,d), it can be seen that the sun glint effects continue to appear in the probability map, even though there is a high overall probability of the oil spill area existing. The sun glint effects are also found (like noise) in the sea water area. However, it is still difficult to notice traces of sun glint effects after directional median filtering (see Figure 6d,e). The oil spill area has a higher probability value, and the sea area has a value that is lower than in Figure 6c. Some regions have an intermediate probability value of about 0.5, which are considered to be regions of mixed oil and sea water.
The characteristics of these probability maps can be confirmed in more detail in Figure 7, which shows histogram distributions for each probability map. Figure 7a shows the result of applying the ANN approach directly to the original image without any filter processing. As mentioned above, the severe sun glint effects affect the whole region of the original image. However, when ANN is applied to the image to which the filter is applied, the histograms show a bimodal distribution. We can see in Figure 7b,c, shown together with reducing sun glint effects, the distribution of oil and/or seawater values is more and more concentrated into two separate peaks. In general, the performance of image classification improves when the distance between two peaks is longer and the distribution of the values is more concentrated on the peaks [25,42,43,50]. Thus, Figure 7c is more appropriate than Figure 7b in this study.
The threshold values for detecting the oil spill area were determined by the probability distribution of Figure 7b,c, respectively. Second-order functions were fitted from the histograms, as seen in Figure 7b,c, and the inflection points of the fitted functions were then used to determine the threshold values. The red lines in Figure 7b,c show the fitted functions. The threshold values determined from the inflection points are approximately 0.57 and 0.58 in the probability maps based on the low-pass filter and DMF, respectively. The areas above the threshold value were then estimated as oil spill areas.
Figure 8 shows the ROC curves and AUC results that are generated by matching each probability map with the true oil spill map. The ROC curve can be used as an indicator of the most optimal model, and the AUC can be used as a quantitative measure [44,50]. The AUC values of the three probability maps are 77.70%, 95.41%, and 98.12%, respectively, as shown in Figure 8, which reflects the fact that most of the oil spill areas were detected in the two results (Figure 6c,e), and the number of pixels incorrectly detected was relatively low. In particular, the AUC of the proposed method was higher than that of the other methods, which means that sea water area is the least likely to be classified as an oil spill area.
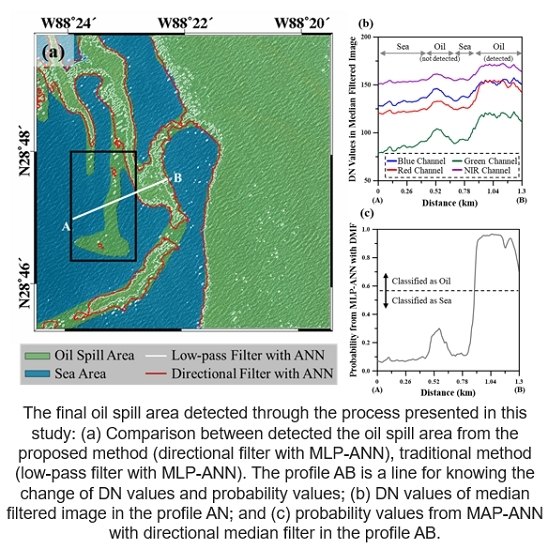
Figure 9a shows the final oil spill area detected through the process presented in this study. As shown in Figure 9a, it can be seen that the result using directional median filtering detects an oil spill area that is more similar to the true map than when using the traditional low-pass filter. With the method, using the low-pass filter, areas were undetected due to the remaining sun glint effect, and these were severe at the boundary regions between oil and sea water areas. However, some regions, including the black box in Figure 9a, could not be detected using either method. Figure 9b shows profiles shown in Figure 9a for analyzing characteristics of the undetected oil spill area. The profiles are divided into sea, undetected oil, and detected oil parts according to distance, and show the variation of DN value after applying directional median filtering in each VNIR channel image. The detected oil spill area has higher DN values in all channels than the undetected oil, and it can be seen that the difference from the sea water is larger than the undetected oil spill area. The DN values of the undetected oil spill area are slightly higher than that of sea water and, consequently, they fail to have a high probability. Figure 9c shows the probability variations produced by the proposed method in the same profile as Figure 9b. The probability value of the detected area is very high, above 0.8, while the probability value of the undetected area is distributed between 0.1 and 0.3. It is lower than the determined threshold (0.58), so it is classified as sea water, even though visual analysis showed that it was an oil spill.
Table 2 shows the error matrix expressed by the number of pixels calculated from the comparison between the oil spill area produced and the reference oil spill map, and Table 3 shows the quantitative indicators calculated from the error matrix. We can see that the result for all indices is higher when the proposed DMF is applied than the low-pass filtered result. It is also of note that the negative indices (POFD and FAR) have grown by within 0.2%, but the positive indices (POD and PC) have increased by more than 6%. Therefore, the ocean wave correction method proposed in this study is both quantitatively and visually proven to be useful for detecting oil spill area within an image that has very high sun glint effects.
Although the proposed method enables better detection of oil spill areas, we need to discuss (i) the limitations of this study and (ii) suggest further areas that need to be researched to perfect the use of the proposed method.
First, the oil spill area was detected from an image of only oil and sea water. However, when oil spill accidents occur, a large number of ships within the area will be dispatched to help clean up the contaminated area. It is thus necessary to consider the wave characteristics generated by the movement of these ships. These waves can produce other sun glint effects that do not have a constant direction or size [55].
Second, further studies are required for waves with different intensities, sizes, and angles. In general, the oil spill detection has a low accuracy on days with heavy winds [34], and it is thus necessary to study how capable the method is of detecting oil spill areas on such days.
Third, the oil spill area was detected by using the MLP-ANN approach. Recently, various algorithms, including the support vector machine (SVM) and convolutional neural network (CNN), have been successfully applied for oil spill detection. A further study for performance comparison among MLP-ANN, SVM and CNN is required.
Fourth, the reference oil map used for verification in this study was produced through visual analysis in an RGB image, and the reliability of the accuracy of the evaluation is therefore possibly limited. Since the area and distribution shape of oil spills differ depending on the time, SAR images or in-situ data obtained at a similar time should also be used for verification.
In summary, the results derived from this study are not yet sufficient to prove the robustness of the proposed method, and further studies and validation processes are required using various cases, images, and wind conditions.
5. Conclusions
Oil spill accidents damage the marine environment, and continuous monitoring of such occurrences is required using various methods based on the use of optical images. Although a number of methods have been developed to detect oil spill areas using high-resolution optical images, if severe ocean waves are generated from strong wind speeds in an accident area, the effect of the sun glint appears in the image. Such an effect makes it impossible to detect the oil spill area, and the image thus requires correction.
In this study, directional median filtering is applied to mitigate sun glint effects, and an object-based ANN approach is then applied to detect the oil spill area. The median filter is appropriate because pixel values do not follow a Gaussian distribution with respect to the severe sun glint effects, and the filter size is determined by considering the size and direction of ocean waves. We use a 2-D spectrum image to estimate the size and direction of the ocean waves and to design the size and angle of the filter. The method of designing the size and angle of the filter in consideration of ocean wave effects is one of the most important aspects of this study. By applying the designed DMF to each RGB and NIR channel image, we create four input neurons for use in the ANN approach. The results of the generated oil probability map are improved compared to other methods, and accuracy of approximately 98.12% is verified using the ROC curve. The threshold value used to classify the oil spill area is calculated by the histogram distribution, and the estimated oil spill area is then verified from the reference oil spill map. The POD, POFD, FAR, and PC indices are calculated as 90%, 1%, 1%, and 9%, respectively. The negative indices (POFD and FAR) show very small changes (within 0.2%), but the positive indices (POD and PC) are increased by over 6% compared to the traditional method.
In conclusion, the results of this study included three main points: (i) The high-frequency components of the 2-D power spectrum image show the size and pattern of the sun glint effects generated from ocean waves. (ii) As the sun glint effects distort the pixel values, they can be effectively applied to the DMF. (iii) The proposed correction method enables better detection of oil spill areas.
The DMF is useful when using images with severe wave effects, and it has the effect of increasing the true positive rate while maintaining the false-positive rate.
Although the test image used in this study is appropriate for validation of the proposed method, further studies are required to improve the proposed algorithm: (i) Both the ocean wave effect generated by heavy winds and ship movement need to be corrected; (ii) the algorithm needs to be applied to various cases with differing ocean wave sizes and oil spill distributions; (iii) the method should be verified using SAR images or in-situ data taken at similar a time similar to the optical imaging time; and (iv) the method should be improved so that image denoising and detection can be performed simultaneously by applying the ANN approach.
Author Contributions
Conceptualization, S.-H.P. and H.-S.J.; methodology, S.-H.P. and H.-S.J.; software, H.-S.J.; validation, S.-H.P. formal analysis, S.-H.P., H.-S.J. and M.-J.L.; investigation, S.-H.P., H.-S.J. and M.-J.L.; writing—original draft preparation, S.-H.P. and H.-S.J.; writing—review and editing, H.-S.J. All authors have read and agreed to the published version of the manuscript.
Funding
This work was supported by the 2018 Research Fund of the University of Seoul for Hyung-Sup Jung, and it was also conducted at Korea Environment Institute (KEI) with support from the Basic Science Research Program through the National Research Foundation of Korea (NRF) funded by the Ministry of Education (NRF-2018R1D1A1B07041203) for Moung-Jin Lee.
Acknowledgments
We would like to thank Sung-Ho Chae and Jeong-In Hwang.
Conflicts of Interest
The authors declare no conflict of interest.
References
- Adams, M. Assessing cause and effect of multiple stressors on marine systems. Mar. Pollut. Bull. 2005, 51, 649–657. [Google Scholar] [CrossRef] [PubMed]
- Yang, C.S.; Kim, D.; Oh, J.H. Study on improvement of oil spill prediction using satellite data and oil-spill model: Hebei Sprit oil spill. Korean J. Remote Sens. 2009, 25, 435–444. [Google Scholar]
- Gill, D.A.; Ritchie, L.A.; Picou, J.S.; Langhinrichsen-Rohling, J.; Long, M.A.; Shenesey, J.W. The Exxon and BP oil spills: A comparison of psychosocial impacts. Nat. Hazards 2014, 74, 1911–1932. [Google Scholar] [CrossRef]
- Zhao, J.; Temimi, M.; Ghedira, H.; Hu, C.M. Exploring the potential of optical remote sensing for oil spill detection in shallow coastal waters-a case study in the Arabian Gulf. Opt. Express 2014, 22, 13755–13772. [Google Scholar] [CrossRef] [PubMed]
- Liu, S.C.; Chi, M.M.; Zou, Y.X.; Samat, A.; Benediktsson, J.A.; Plaza, A. Oil spill detection via multitemporal optical remote sensing images: A change detection perspective. IEEE Geosci. Remote Sens. Lett. 2017, 14, 324–328. [Google Scholar] [CrossRef]
- O’hara, P.D.; Serra-Sogas, N.; Canessa, R.; Keller, P.; Pelot, R. Estimating discharge rates of oily wastes and deterrence based on aerial surveillance data collected in western Canadian marine waters. Mar. Pollut. Bull. 2013, 69, 157–164. [Google Scholar] [CrossRef]
- Brekke, C.; Solberg, A.H.S. Oil spill detection by satellite remote sensing. Remote Sens. Environ. 2005, 95, 1–13. [Google Scholar] [CrossRef]
- Fingas, M.; Brown, C. Review of oil spill remote sensing. Mar. Pollut. Bull. 2014, 83, 9–23. [Google Scholar] [CrossRef] [Green Version]
- Fingas, M.; Brown, C.E. A Review of Oil Spill Remote Sensing. Sensors 2018, 18, 91. [Google Scholar] [CrossRef] [Green Version]
- Zhao, S.H.; Wang, Q.; Li, Y.; Liu, S.H.; Wang, Z.T.; Zhu, L.; Wang, Z.F. An overview of satellite remote sensing technology used in China’s environmental protection. Earth Sci. Inform. 2017, 10, 137–148. [Google Scholar] [CrossRef]
- Park, S.M.; Yang, C.S.; Oh, Y. Numerical simulation radar backscattering from oil spills on sea surface for L-band SAR. Korean J. Remote Sens. 2010, 26, 21–27. [Google Scholar]
- Angelliaume, S.; Minchew, B.; Chataing, S.; Martineau, P.; Miegebielle, V. Multifrequency radar imagery and characterization of hazardous and noxious substances at sea. IEEE Trans. Geosci. Remote Sens. 2017, 55, 3051–3066. [Google Scholar] [CrossRef]
- Kim, D.; Jung, H.S. Oil spill detection from RADARSAT-2 SAR image using non-local means filter. Korean J. Remote Sens. 2017, 33, 61–67. [Google Scholar] [CrossRef] [Green Version]
- Gade, M.; Alpers, W. Using ERS-2 SAR images for routine observation of marine pollution in European coastal waters. Sci. Total Environ. 1999, 238, 441–448. [Google Scholar] [CrossRef]
- Girard-Ardhuin, F.; Mercier, G.; Collard, F.; Garello, R. Operational oil-slick characterization by SAR imagery and synergistic data. IEEE J. Ocean. Eng. 2005, 30, 487–495. [Google Scholar] [CrossRef] [Green Version]
- Gambardella, A.; Giacinto, G.; Migliaccio, M.; Montali, A. One-class classification for oil spill detection. Pattern Anal. Appl. 2010, 13, 349–366. [Google Scholar] [CrossRef]
- Shu, Y.M.; Li, J.; Yousif, H.; Gomes, G. Dark-spot detection from SAR intensity imagery with spatial density thresholding for oil-spill monitoring. Remote Sens. Environ. 2010, 114, 2026–2035. [Google Scholar] [CrossRef] [Green Version]
- Salberg, A.B.; Rudjord, O.; Solberg, A.H.S. Oil spill detection in hybrid-polarimetric SAR images. IEEE Trans. Geosci. Remote Sens. 2014, 52, 6521–6533. [Google Scholar] [CrossRef]
- Solberg, A.H.S.; Storvik, G.; Solberg, R.; Volden, E. Automatic detection of oil spills in ERS SAR images. IEEE Trans. Geosci. Remote Sens. 1999, 37, 1916–1924. [Google Scholar] [CrossRef] [Green Version]
- Kim, D.; Jung, H.S. Mapping oil spills from dual-polarized SAR images using an artificial neural network: Application to oil spill in the Kerch Strait in November 2007. Sensors 2018, 18, 2237. [Google Scholar] [CrossRef] [Green Version]
- Hu, C.M.; Li, X.F.; Pichel, W.G.; Muller-Karger, F.E. Detection of natural oil slicks in the NW Gulf of Mexico using MODIS imagery. Geophys. Res. Lett. 2009, 36, L01604. [Google Scholar] [CrossRef]
- Srivastava, H.; Singh, T.P. Assessment and development of algorithms to detection of oil spills using MODIS data. J. Indian Soc. Remote Sens. 2010, 38, 161–167. [Google Scholar] [CrossRef]
- Bulgarelli, B.; Djavidnia, S. On MODIS retrieval of oil spill spectral properties in the marine environment. IEEE Geosci. Remote Sens. Lett. 2012, 9, 398–402. [Google Scholar] [CrossRef]
- Leifer, I.; Lehr, W.J.; Simecek-Beatty, D.; Bradley, E.; Clark, R.; Dennison, P.; Hu, Y.X.; Matheson, S.; Jones, C.E.; Holt, B. State of the art satellite and airborne marine oil spill remote sensing: Application to the BP Deepwater Horizon oil spill. Remote Sens. Environ. 2012, 124, 185–209. [Google Scholar] [CrossRef] [Green Version]
- Taravat, A.; del Frate, F. Development of band rationing algorithms and neural networks to detection of oil spills using Landsat ETM + data. EURASIP J. Adv. Signal Process. 2012, 107, 1–8. [Google Scholar] [CrossRef]
- Lu, Y.C.; Li, X.; Tian, Q.J.; Zheng, G.; Sun, S.J.; Liu, Y.X.; Yang, Q. Progress in marine oil spill optical remote sensing: Detected targets, spectral response characteristics, and theories. Mar. Geod. 2013, 36, 334–346. [Google Scholar] [CrossRef]
- Lu, Y.C.; Tian, Q.J.; Wang, X.Y.; Zheng, G.; Li, X. Determining oil slick thickness using hyperspectral remote sensing in the Bohai Sea of China. Int. J. Digit. Earth 2013, 6, 76–93. [Google Scholar] [CrossRef]
- Lee, M.S.; Park, K.A.; Lee, H.R.; Park, J.J.; Kang, C.K.; Lee, M. Detection and dispersion of thick and film-like oil spills in a coastal bay using satellite optical images. IEEE J. Sel. Top. Appl. Earth Obs. Remote Sens. 2016, 9, 5139–5150. [Google Scholar] [CrossRef]
- Jahne, B.; Klinke, J.; Waas, S. Imaging of short ocean wind-waves—A critical theoretical review. J. Opt. Soc. Am. A 1994, 11, 2197–2209. [Google Scholar] [CrossRef]
- Bondur, V.G.; Dulov, V.A.; Murynin, A.B.; Ignatiev, V.Y. Retrieving sea-wave spectra using satellite-imagery spectra in a wide range of frequencies. Izv. Atmos. Ocean. Phys. 2016, 52, 637–648. [Google Scholar] [CrossRef]
- Bondur, V.G.; Murynin, A.B. Methods for retrieval of sea wave spectra from aerospace image spectra. Izv. Atmos. Ocean. Phys. 2016, 52, 877–887. [Google Scholar] [CrossRef]
- Harmel, T.; Chami, M.; Tormos, T.; Reynaud, N.; Danis, P.-A. Sunglint correction of the Multi-Spectral Instrument (MSI)-SENTINEL-2 imagery over inland and sea waters from SWIR bands. Remote Sens. Environ. 2018, 204, 308–321. [Google Scholar] [CrossRef]
- Kay, S.; Hedley, J.D.; Lavender, S. Sun Glint Correction of High and Low Spatial Resolution Images of Aquatic Scenes: A Review of Methods for Visible and Near-Infrared Wavelengths. Remote Sens. 2009, 1, 697–730. [Google Scholar] [CrossRef] [Green Version]
- Garcia-Pineda, O.; MacDonald, I.R.; Li, X.F.; Jackson, C.R.; Pichel, W.G. Oil spill mapping and measurement in the Gulf of Mexico with textural classifier neural network algorithm (TCNNA). IEEE J. Sel. Top. Appl. Earth Obs. Remote Sens. 2013, 6, 2517–2525. [Google Scholar] [CrossRef]
- Hochberg, E.J.; Andrefouet, S.; Tyler, M.R. Sea surface correction of high spatial resolution Ikonos images to improve bottom mapping in near-shore environments. IEEE Trans. Geosci. Remote Sens. 2003, 41, 1724–1729. [Google Scholar] [CrossRef]
- Hedley, J.D.; Harborne, A.R.; Mumby, P.J. Simple and robust removal of sun glint for mapping shallow-water benthos. Int. J. Remote Sens. 2005, 26, 2107–2112. [Google Scholar] [CrossRef]
- Lyzenga, D.R.; Malinas, N.R.; Tanis, F.J. Multispectral bathymetry using a simple physically based algorithm. IEEE Trans. Geosci. Remote Sens. 2006, 44, 2251–2259. [Google Scholar] [CrossRef]
- Keller, W.C.; Gotwols, B.L. Two-dimensional optical measurement of wave slope. Appl. Opt. 1983, 22, 3476–3478. [Google Scholar] [CrossRef]
- Yang, X.; Wang, N.N.; Song, B.; Gao, X.B. BoSR: A CNN-based aurora image retrieval method. Neural Netw. 2019, 116, 188–197. [Google Scholar] [CrossRef]
- Pang, J.M.; Chen, K.; Shi, J.P.; Feng, H.J.; Ouyang, W.L.; Lin, D.H. Libra R-CNN: Towards balanced learning for object detection. In Proceedings of the IEEE Computer Vision and Pattern Recognition, Long Beach, CA, USA, 16–20 June 2019. [Google Scholar]
- Zhu, C.C.; He, Y.H.; Savvides, M. Feature selective anchor-free module for single-shot object detection. In Proceedings of the IEEE Computer Vision and Pattern Recognition, Long Beach, CA, USA, 16–20 June 2019. [Google Scholar]
- Del Frate, F.; Petrocchi, A.; Lichtenegger, J.; Calabresi, G. Neural networks for oil spill detection using ERS-SAR data. IEEE Trans. Geosci. Remote Sens. 2000, 38, 2282–2287. [Google Scholar] [CrossRef] [Green Version]
- Singha, S.; Bellerby, T.J.; Trieschmann, O. Satellite oil spill detection using artificial neural networks. IEEE J. Sel. Top. Appl. Earth Obs. Remote Sens. 2013, 6, 2355–2363. [Google Scholar] [CrossRef]
- Kubat, M.; Holte, R.C.; Matwin, S. Machine learning for the detection of oil spills in satellite radar images. Mach. Learn. 1998, 30, 195–215. [Google Scholar] [CrossRef] [Green Version]
- Chen, G.D.; Li, Y.; Sun, G.M.; Zhang, Y.Z. Application of deep networks to oil spill detection using polarimetric synthetic aperture radar Images. Appl. Sci. 2017, 7, 968. [Google Scholar] [CrossRef]
- Lee, S.; Cho, S.; Lee, B.S.; Kim, J. Design, implementation, and validation of KOMPSAT-2 software simulator. ETRI J. 2005, 27, 140–152. [Google Scholar] [CrossRef]
- Oh, K.Y.; Jung, H.S. Automated bias-compensation approach for pushbroom sensor modeling using digital elevation model. IEEE Trans. Geosci. Remote Sens. 2016, 54, 3400–3409. [Google Scholar] [CrossRef]
- Svejkovsky, J.; Hess, M.; Muskat, J.; Nedwed, T.J.; McCall, J.; Garcia, O. Characterization of surface oil thickness distribution patterns observed during the Deepwater Horizon (MC-252) oil spill with aerial and satellite remote sensing. Mar. Pollut. Bull. 2016, 110, 162–176. [Google Scholar] [CrossRef]
- Chae, S.H.; Lee, W.J.; Jung, H.S.; Zhang, L. Ionospheric correction of L-band SAR offset measurements for the precise observation of glacier velocity variations on Novaya Zemlya. IEEE J. Sel. Top. Appl. Earth Obs. Remote Sens. 2017, 10, 3591–3603. [Google Scholar] [CrossRef]
- Xu, L.L.; Li, J.; Brenning, A. A comparative study of different classification techniques for marine oil spill identification using RADARSAT-1 imagery. Remote Sens. Environ. 2014, 141, 14–23. [Google Scholar] [CrossRef]
- Spencer, M.; Eichholt, J.; Cheng, J.L. A deep learning network approach to ab initio protein secondary structure prediction. IEEE-ACM Trans. Comput. Biol. Bioinform. 2015, 12, 103–112. [Google Scholar] [CrossRef]
- Hwang, J.I.; Jung, H.S. Automatic ship detection using the artificial neural network and support vector machine from X-band SAR satellite images. Remote Sens. 2018, 10, 1799. [Google Scholar] [CrossRef] [Green Version]
- Hwang, J.I.; Chae, S.H.; Kim, D.; Jung, H.S. Application of artificial neural networks to ship detection from X-band Kompsat-5 imagery. Appl. Sci. 2014, 7, 961. [Google Scholar] [CrossRef]
- Kim, T.S.; Park, K.A.; Lee, M.S.; Park, J.J.; Hong, S.; Kim, K.L.; Chang, E. Application of bimodal histogram method to oil spill detection from a satellite synthetic aperture radar image. Korean J. Remote Sens. 2013, 29, 645–655. [Google Scholar] [CrossRef] [Green Version]
- Garaba, S.P.; Zielinski, O. Methods in reducing surface reflected glint for shipborne above-water remote sensing. J. Eur. Opt. Soc. Rapid Publ. 2013, 8, 13058. [Google Scholar] [CrossRef] [Green Version]
Figure 1.
KOMPSAT-2 image of Gulf of Mexico oil spill area: (a) Test area used in this study; (b) oil spill map produced manually; (c) zoomed-in area of box A showing characteristics of oil spill area; and (d) zoomed-in area of box B showing characteristics of sea area.
Figure 1.
KOMPSAT-2 image of Gulf of Mexico oil spill area: (a) Test area used in this study; (b) oil spill map produced manually; (c) zoomed-in area of box A showing characteristics of oil spill area; and (d) zoomed-in area of box B showing characteristics of sea area.

Figure 2.
Detailed flowchart of the method used to detect oil spill areas in this study. The flowchart is divided into two parts: (i) Sun glint effect removal using DMF; and (ii) oil spill area detection using the Artificial Neural Network (ANN).
Figure 2.
Detailed flowchart of the method used to detect oil spill areas in this study. The flowchart is divided into two parts: (i) Sun glint effect removal using DMF; and (ii) oil spill area detection using the Artificial Neural Network (ANN).

Figure 3.
(a) Two-dimensional power spectrum in the frequency domain and (b) window kernel of directional filter determined from the power spectrum. and are respectively the dominant frequency and wavelength of ocean wave, α is the angle of ocean wave propagation direction, θ is the maximum difference angle among effective ocean wave propagation directions, (Wx, Wy) and (Wx’, Wy’) are, respectively, the kernel sizes in the x and y directions before and after the window kernel is rotated.

Figure 4.
The two-dimensional power spectrum and estimated directional median filter (DMF) size from the test image: (a) 2-D power spectrum image; (b) size and angle of DMF in this study.
Figure 4.
The two-dimensional power spectrum and estimated directional median filter (DMF) size from the test image: (a) 2-D power spectrum image; (b) size and angle of DMF in this study.

Figure 5.
A comparison between the low-pass filtered image and directional median filtered image: (a) Low-pass filtered image; (b) directional median filtered image; (c) zoomed-in area of box A showing low-pass filtered oil spill area; and (d) zoomed-in area of box B showing directional median filtered oil spill area. Yellow arrows indicate wave effects remaining after applying low-pass filter.

Figure 6.
A comparison between oil spill area detection methods: (a,b) No filter with multi-layer perceptron (MLP)-ANN and zoomed-in area of box A; (c,d) low-pass filter with MLP-ANN and zoomed-in area of box B; (e,f) DMF with MLP-ANN and zoomed-in area of box C.
Figure 6.
A comparison between oil spill area detection methods: (a,b) No filter with multi-layer perceptron (MLP)-ANN and zoomed-in area of box A; (c,d) low-pass filter with MLP-ANN and zoomed-in area of box B; (e,f) DMF with MLP-ANN and zoomed-in area of box C.

Figure 7.
Between the histograms after oil spill detection processing: (a) No filter with ANN; (b) low-pass filter with ANN; and (c) DMF with ANN. Red lines represent the histogram section used to determine the threshold value.
Figure 7.
Between the histograms after oil spill detection processing: (a) No filter with ANN; (b) low-pass filter with ANN; and (c) DMF with ANN. Red lines represent the histogram section used to determine the threshold value.

Figure 8.
Between ROC curves generated by ANN approaches: (a) no filter with ANN; (b) low-pass filter with ANN; and (c) DMF with ANN.
Figure 8.
Between ROC curves generated by ANN approaches: (a) no filter with ANN; (b) low-pass filter with ANN; and (c) DMF with ANN.

Figure 9.
The final oil spill area detected through the process presented in this study: (a) Comparison between detected the oil spill area from the proposed method (directional filter with MLP-ANN), traditional method (low-pass filter with MLP-ANN). The profile AB is a line for knowing the change of DN values and probability values; (b) DN values of median filtered image in the profile AB; and (c) probability values from MLP-ANN with directional median filter in the profile AB.


Table 1.
Standard deviations from oil spill areas.
| Band | Original Std. | Low-Pass Filtered Std. | Directional-Filtered Std. |
|---|---|---|---|
| Blue | 36 | 15 | 10 |
| Green | 40 | 17 | 11 |
| Red | 28 | 14 | 11 |
| NIR | 22 | 11 | 8 |
Values in parentheses indicate the percentage decrease in the standard deviation.
Table 2.
The error matrix of each oil spill area detection method.
| Oil Spill Detection Map | Oil Spill Reference Map | ||
|---|---|---|---|
| Oil | Non-Oil | ||
| ANN approach with low-pass filter | Oil | 2,132,243 | 13,836 |
| NON-Oil | 507,329 | 1,540,896 | |
| ANN approach with directional median filter | Oil | 2,363,974 | 17,958 |
| Non-oil | 275,598 | 1,536,774 | |
Table 3.
Detection accuracy of each oil spill area detection method.
| ANN Approach with Low-Pass Filter | ANN Approach with Directional Median Filter | |
|---|---|---|
| Probability of detection (POD) | 81% | 90% |
| Probability of false detection (POFD) | 1% | 1% |
| False alarm ratio (FAR) | 1% | 1% |
| Proportion correct (PC) | 88% | 93% |
© 2020 by the authors. Licensee MDPI, Basel, Switzerland. This article is an open access article distributed under the terms and conditions of the Creative Commons Attribution (CC BY) license (http://creativecommons.org/licenses/by/4.0/).
Share and Cite
MDPI and ACS Style
Park, S.-H.; Jung, H.-S.; Lee, M.-J. Oil Spill Mapping from Kompsat-2 High-Resolution Image Using Directional Median Filtering and Artificial Neural Network. Remote Sens. 2020, 12, 253. https://doi.org/10.3390/rs12020253
AMA Style
Park S-H, Jung H-S, Lee M-J. Oil Spill Mapping from Kompsat-2 High-Resolution Image Using Directional Median Filtering and Artificial Neural Network. Remote Sensing. 2020; 12(2):253. https://doi.org/10.3390/rs12020253
Chicago/Turabian StylePark, Sung-Hwan, Hyung-Sup Jung, and Moung-Jin Lee. 2020. "Oil Spill Mapping from Kompsat-2 High-Resolution Image Using Directional Median Filtering and Artificial Neural Network" Remote Sensing 12, no. 2: 253. https://doi.org/10.3390/rs12020253
Note that from the first issue of 2016, this journal uses article numbers instead of page numbers. See further details here.