Quantifying Understory and Overstory Vegetation Cover Using UAV-Based RGB Imagery in Forest Plantation
by
 , , , and
Linyuan Li
1,2,3 ,
,
Jun Chen
1,2,
Xihan Mu
1,2,*,
Weihua Li
1,2,
Guangjian Yan
1,2,
Donghui Xie
1,2 and
Wuming Zhang
1,2 1
State Key Laboratory of Remote Sensing Science, Jointly Sponsored by Beijing Normal University and Institute of Remote Sensing and Digital Earth of Chinese Academy of Sciences, Beijing 100875, China
2
Beijing Engineering Research Center for Global Land Remote Sensing Products, Institute of Remote Sensing Science and Engineering, Faculty of Geographical Science, Beijing Normal University, Beijing 100875, China
3
INRA EMMAH UMR1114, Domaine Saint-Paul, Site Agroparc, CEDEX 9, 84914 Avignon, France
*
Author to whom correspondence should be addressed.
Remote Sens. 2020, 12(2), 298; https://doi.org/10.3390/rs12020298
Submission received: 18 November 2019
/
Revised: 7 January 2020
/
Accepted: 14 January 2020
/
Published: 16 January 2020
(This article belongs to the Special Issue Thematic Information Extraction and Application in Forests)
Abstract
:Vegetation cover estimation for overstory and understory layers provides valuable information for modeling forest carbon and water cycles and refining forest ecosystem function assessment. Although previous studies demonstrated the capability of light detection and ranging (LiDAR) in the three-dimensional (3D) characterization of forest overstory and understory communities, the high cost inhibits its application in frequent and successive survey tasks. Low-cost commercial red–green–blue (RGB) cameras mounted on unmanned aerial vehicles (UAVs), as LiDAR alternatives, provide operational systems for simultaneously quantifying overstory crown cover (OCC) and understory vegetation cover (UVC). We developed an effective method named back-projection of 3D point cloud onto superpixel-segmented image (BAPS) to extract overstory and forest floor pixels using 3D structure-from-motion (SfM) point clouds and two-dimensional (2D) superpixel segmentation. The OCC was estimated from the extracted overstory crown pixels. A reported method, called half-Gaussian fitting (HAGFVC), was used to segement green vegetation and non-vegetation pixels from the extracted forest floor pixels and derive UVC. The UAV-based RGB imagery and field validation data were collected from eight forest plots in Saihanba National Forest Park (SNFP) plantation in northern China. The consistency of the OCC estimates between BAPS and canopy height model (CHM)-based methods (coefficient of determination: 0.7171) demonstrated the capability of the BAPS method in the estimation of OCC. The segmentation of understory vegetation was verified by the supervised classification (SC) method. The validation results showed that the OCC and UVC estimates were in good agreement with reference values, where the root-mean-square error (RMSE) of OCC (unitless) and UVC (unitless) reached 0.0704 and 0.1144, respectively. The low-cost UAV-based observation system and the newly developed method are expected to improve the understanding of ecosystem functioning and facilitate ecological process modeling.

1. Introduction
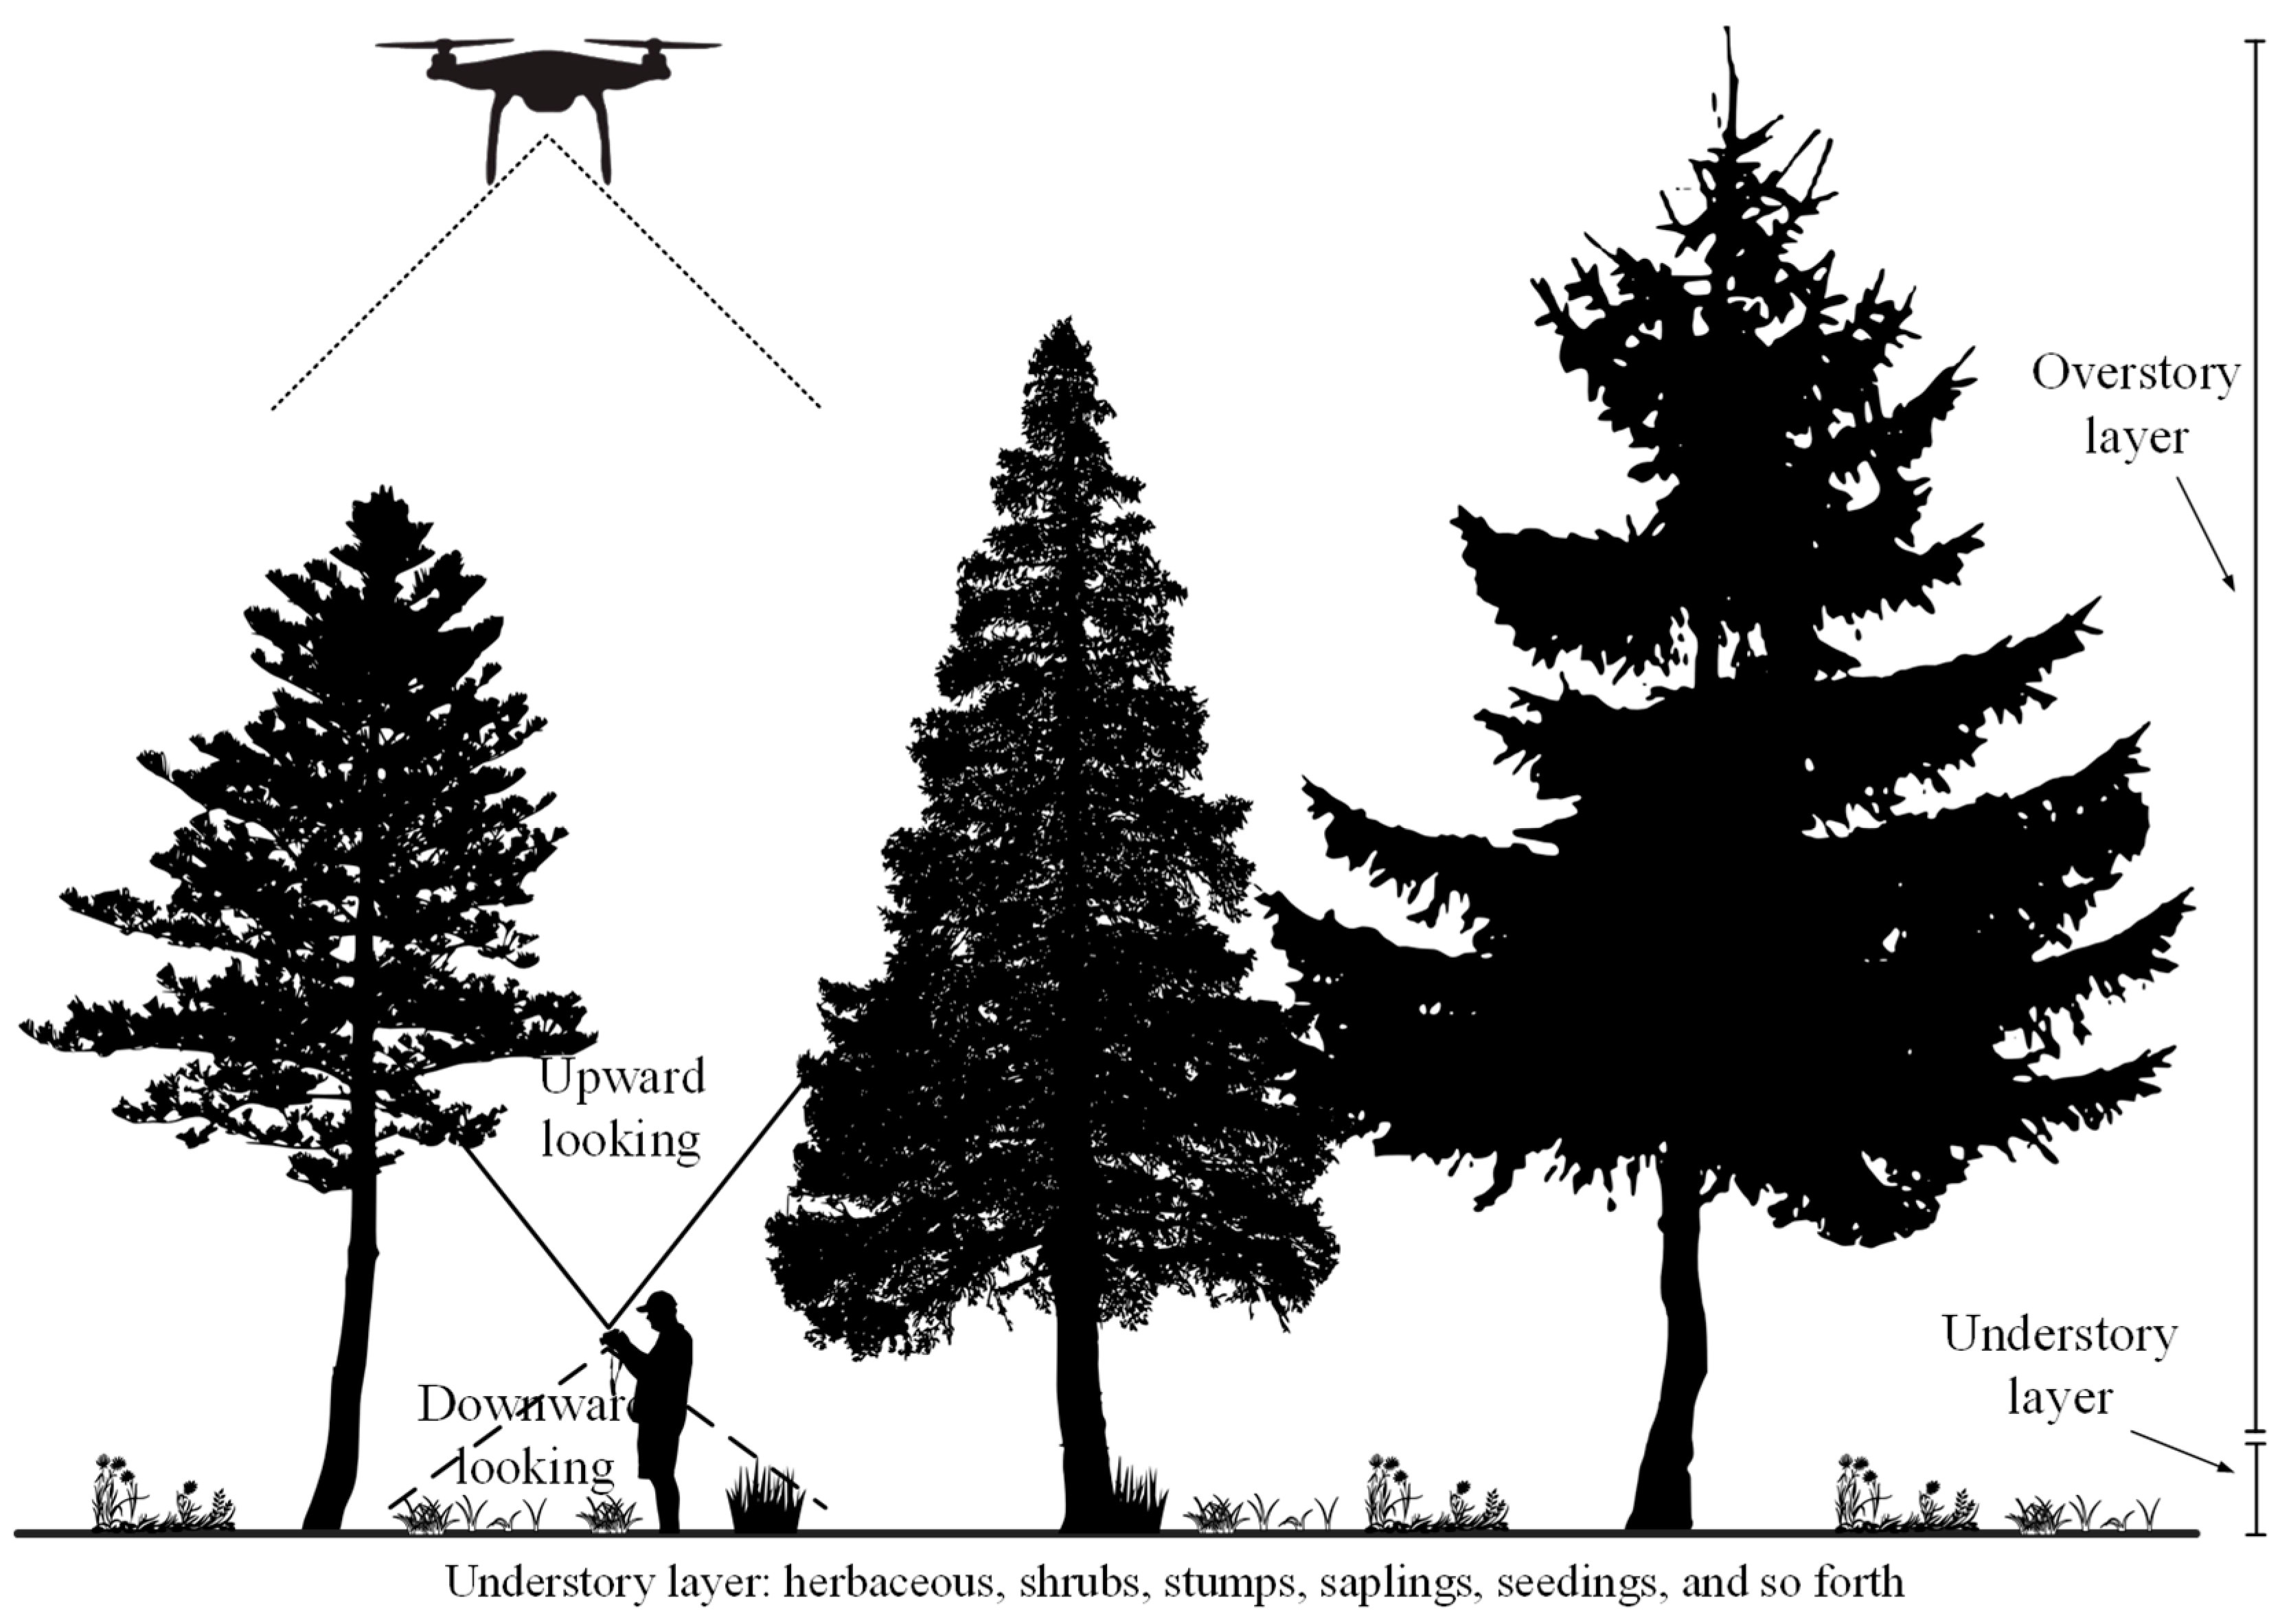
Forest ecosystems generally comprise overstory and understory communities [1,2]. The overstory layer (>2 m) refers to the uppermost layer of woody plants [3], whereas the understory layer (0–2 m) falls under the overstory layer [4] and includes herbaceous plants, shrubs, stumps, saplings, seedlings, grasses, small stature trees, etc. (Figure 1). Both communities play important roles in water/carbon/nutrient cycle modeling and forest ecosystem functions [5,6]. Understory vegetation characterized by high biodiversity is often considered a good ecological indicator of forest health [7,8]. Understory communities can potentially influence overstory succession, long-term stand productivity, species composition, and structure over a long period [9]. In turn, the overstory layer influences light attenuation patterns and understory plant community productivity and diversity [10]. The overstory is also an important key variable in the studies of natural hazards dynamics, forest protective function assessment models, and forest management and planning [7,11]. The overstory–understory relationships are complex and mutual [10].
Forest vegetation cover is a critical variable in describing the water, carbon, and energy exchange of vegetation with the atmosphere [12,13,14] and the forest dynamics. The separation of vegetation cover for overstory and understory layers can improve the modeling of forest carbon and water cycles and refine the assessment of forest ecosystem functions [1,7,11,15]. In general, overstory crown cover (OCC) and understory vegetation cover (UVC) are used to characterize the stratification of forest cover attributes. Failure to account for UVC can reduce the accuracy of the remotely sensed estimates of OCC [16].
Typically, the quantification of UVC and OCC can be conducted by using nadir (downward-looking) and zenith (upward-looking) photography methods in the field, respectively [17]. Previous studies confirmed the effectiveness and accuracy of the commonly used photography methods [18,19] to segment green vegetation from the background (i.e., soil or sky). The ground-based measurement is generally treated as ground truth or reference value in validating other remote sensing estimates [20]. However, given the considerable efforts, difficulties of access, small areas, and spatial discontinuousness in ground surveys, an alternative remote sensing technique is desirable for the community and ecosystem scales. Light detection and ranging (LiDAR) remote sensing can provide a direct way of assessing the elevations on the earth’s surface. LiDAR is particularly useful in depicting the understory layer because the laser beams can penetrate small gaps within an overstory canopy [3,7,21]. The beams interact with understory components, and the returned laser pulses can be used to determine the understory traits. LiDAR shows a remarkable potential to obtain accurate and rich information on forest overstory and understory, including OCC and UVC [2,3,7,22]. However, high cost limits the extended application of LiDAR in a wide range of fields.
By contrast, remote sensing imagery generally features advantages in the cost of acquisition. Unmanned aerial vehicles (UAVs) emerged as new close-range remote sensing platforms in measuring forest variables at the community level. UAVs provide opportunities for user-controlled high spatial-temporal resolution estimation of plant traits [14]. Commercial red–green–blue (RGB) cameras, as the most common payload of UAVs, are used to estimate crop canopy cover at a low cost [23]. RGB cameras can also be used to estimate OCC of forest on the basis of the canopy height model (CHM) derived from the structure-from-motion (SfM) point cloud [24].
However, a robust and efficient method is still desired to estimate OCC and UVC from UAV-based RGB imagery. The RGB images were rarely used to estimate forest strata attributes due to the significant challenge in decoupling overstory and understory vegetation signals in image processing. The threshold- and texture-based image analysis algorithms showed their incapability to cope with UAV images over complex forest areas [25]. Furthermore, the estimation and prediction of UVC from top-of-canopy imagery are inherently difficult due to the obstruction from the overstory layer and the high heterogeneity of the understory layer [9]. Understory vegetation also poses further challenges because it is characterized by similar spectral/color features to that of overstory vegetation in the visible domain. The complicated illumination environment within the forest ecosystem also presents a significant challenge. Thus, the robust handling of variant brightness while detecting green vegetation pixels in the understory layer is critical. Increased spatial resolution and three-dimensional (3D) view can offer new opportunities in achieving the robust and accurate estimate of OCC and UVC [26]. Given that the color, texture, or height information fails to extract the stratified vegetation cover independently, an integration of these data might offer new insights into image analysis. On one hand, given the advancement of computer vision, UAV-based overlapped images can produce a 3D point cloud through the SfM algorithm [26]. On the other hand, superpixel, as a group of connected pixels with similar colors or gray levels, enables the description of color and texture information [24]. The superpixel-wise method allows the computation of features in important regions, thereby showing the potential to derive more robust and rational results than the pixel-wise method.
This study aimed to develop a method named back-projection of 3D point cloud onto superpixel-segmented image (BAPS) for automatically estimating OCC and UVC of forests from UAV-based RGB images and validate the accuracy of BAPS using the estimation from reported methods, i.e., CHM-based method and supervised classification (SC) method, and using in situ reference values. In this study, we used 3D point clouds and two-dimensional (2D) superpixels derived from RGB images to quantify OCC and UVC. UAV-based RGB imagery data were used to explore the possibilities to detect and characterize the overstory and understory covers of forests, including conifer and deciduous forests.
2. Data
2.1. Study Area
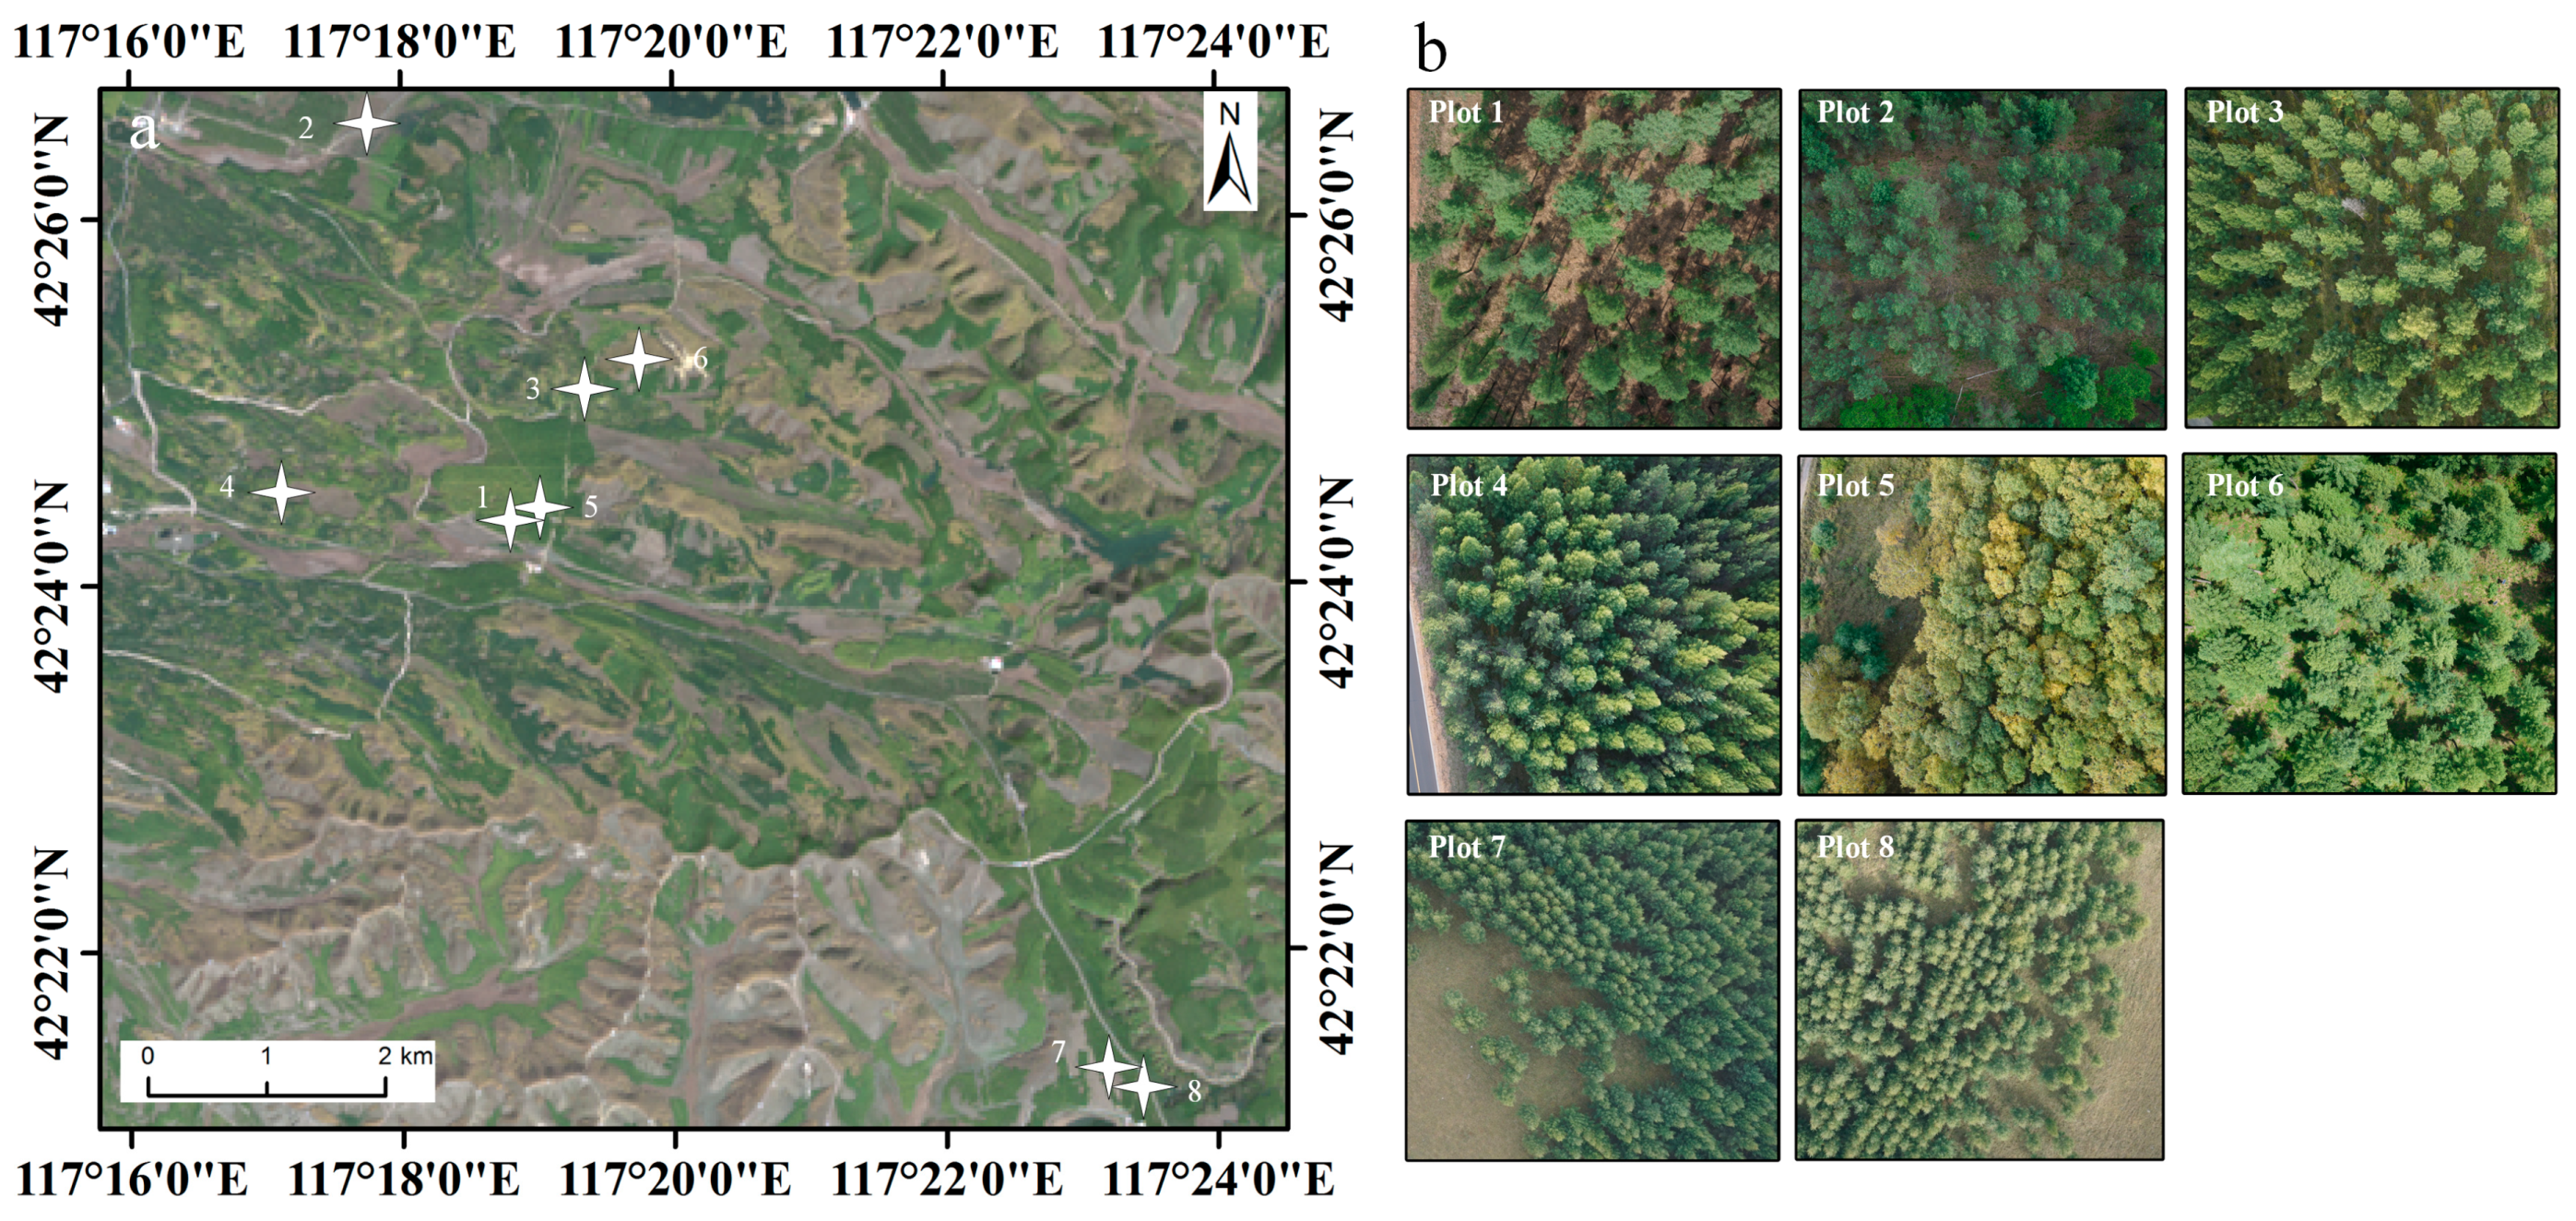
Our field plots are located at a temperate forest ecoregion (Figure 2) as part of the Saihanba national forest park (SNFP), Chengde, China (42.35° north (N), 117.32° east (E)). This park was established in 1993 and covers a total area of 27,300 ha of semi-natural mixed deciduous–conifer forest. SNFP experiences an average annual precipitation of approximately 450 mm, approximately 70% of which occurs from June to August [27]. The average annual temperature is −1.4 °C, with a long winter and a short growing season (from May to September). The terrain within SNFP features a rugged topography, with a mean altitude of approximately 1700 m above the sea level.
One deciduous forest plot with birch trees (Betula platyphylla) and seven conifer forest plots consisting of a single species of Mongolian pine (Larix principis-rupprechtii Mayr) or larch tree (Pinus sylvestris var. mongolica Litv.) for each plot were selected across a range of canopy structures (tree pattern, tree height, etc.). These eight forest plots (30 m × 30 m) were located on flat surfaces. Figure 2 and Table 1 provide overviews of the plot locations and tree types, respectively. These plots, vertically characterized by two-layer structures (overstory tree canopy and understory grass/small shrub canopy), feature different vegetation coverage levels. According to the field survey in our experiment, the heights of trees in these plots were in the range of 17–27 m. The average height of understory vegetation was below 0.5 m. Table 1 shows an overview of data collection. The reference values in Table 1 were derived from in situ measurements which are described in Section 2.3.
2.2. Acquisition of UAV-Based RGB Images
The UAV was automatically controlled by a preprogrammed flight plan on the ground station computer. During the flight, the UAV log unit recorded the flight altitude, speed, global positioning system (GPS) position, and orientation parameters. The UAV captured one nadir image at every waypoint. A SONY ILCE-QX1 digital camera was used, thereby providing an image size of 5456 × 3632 pixels. In this study, the UAV RGB images were acquired at a flight altitude in the range of 50–120 m above ground level, thereby resulting in a ground sample distance of approximately 2 cm. The actual resolution of crown pixels is higher than 2 cm due to the tree height. The flight paths were designed to produce a minimum photographic side overlap of 70% and a forward overlap of 80%. The flight speed was set to 3 m/s to minimize the possibility of motion blur. Each plot was fully covered by UAV images, with an additional buffer of several meters (Table 1). The camera aperture and shutter speed were set manually depending on different light conditions before takeoff. After the image acquisition, all images were exported to a computer and then manually trimmed to remove photos from the take-off and landing using the camera timestamp. Each image was inspected to ensure the explicit quality of the RGB images. Approximately 45 images were used for each plot.
2.3. In Situ Measurements and Image Processing
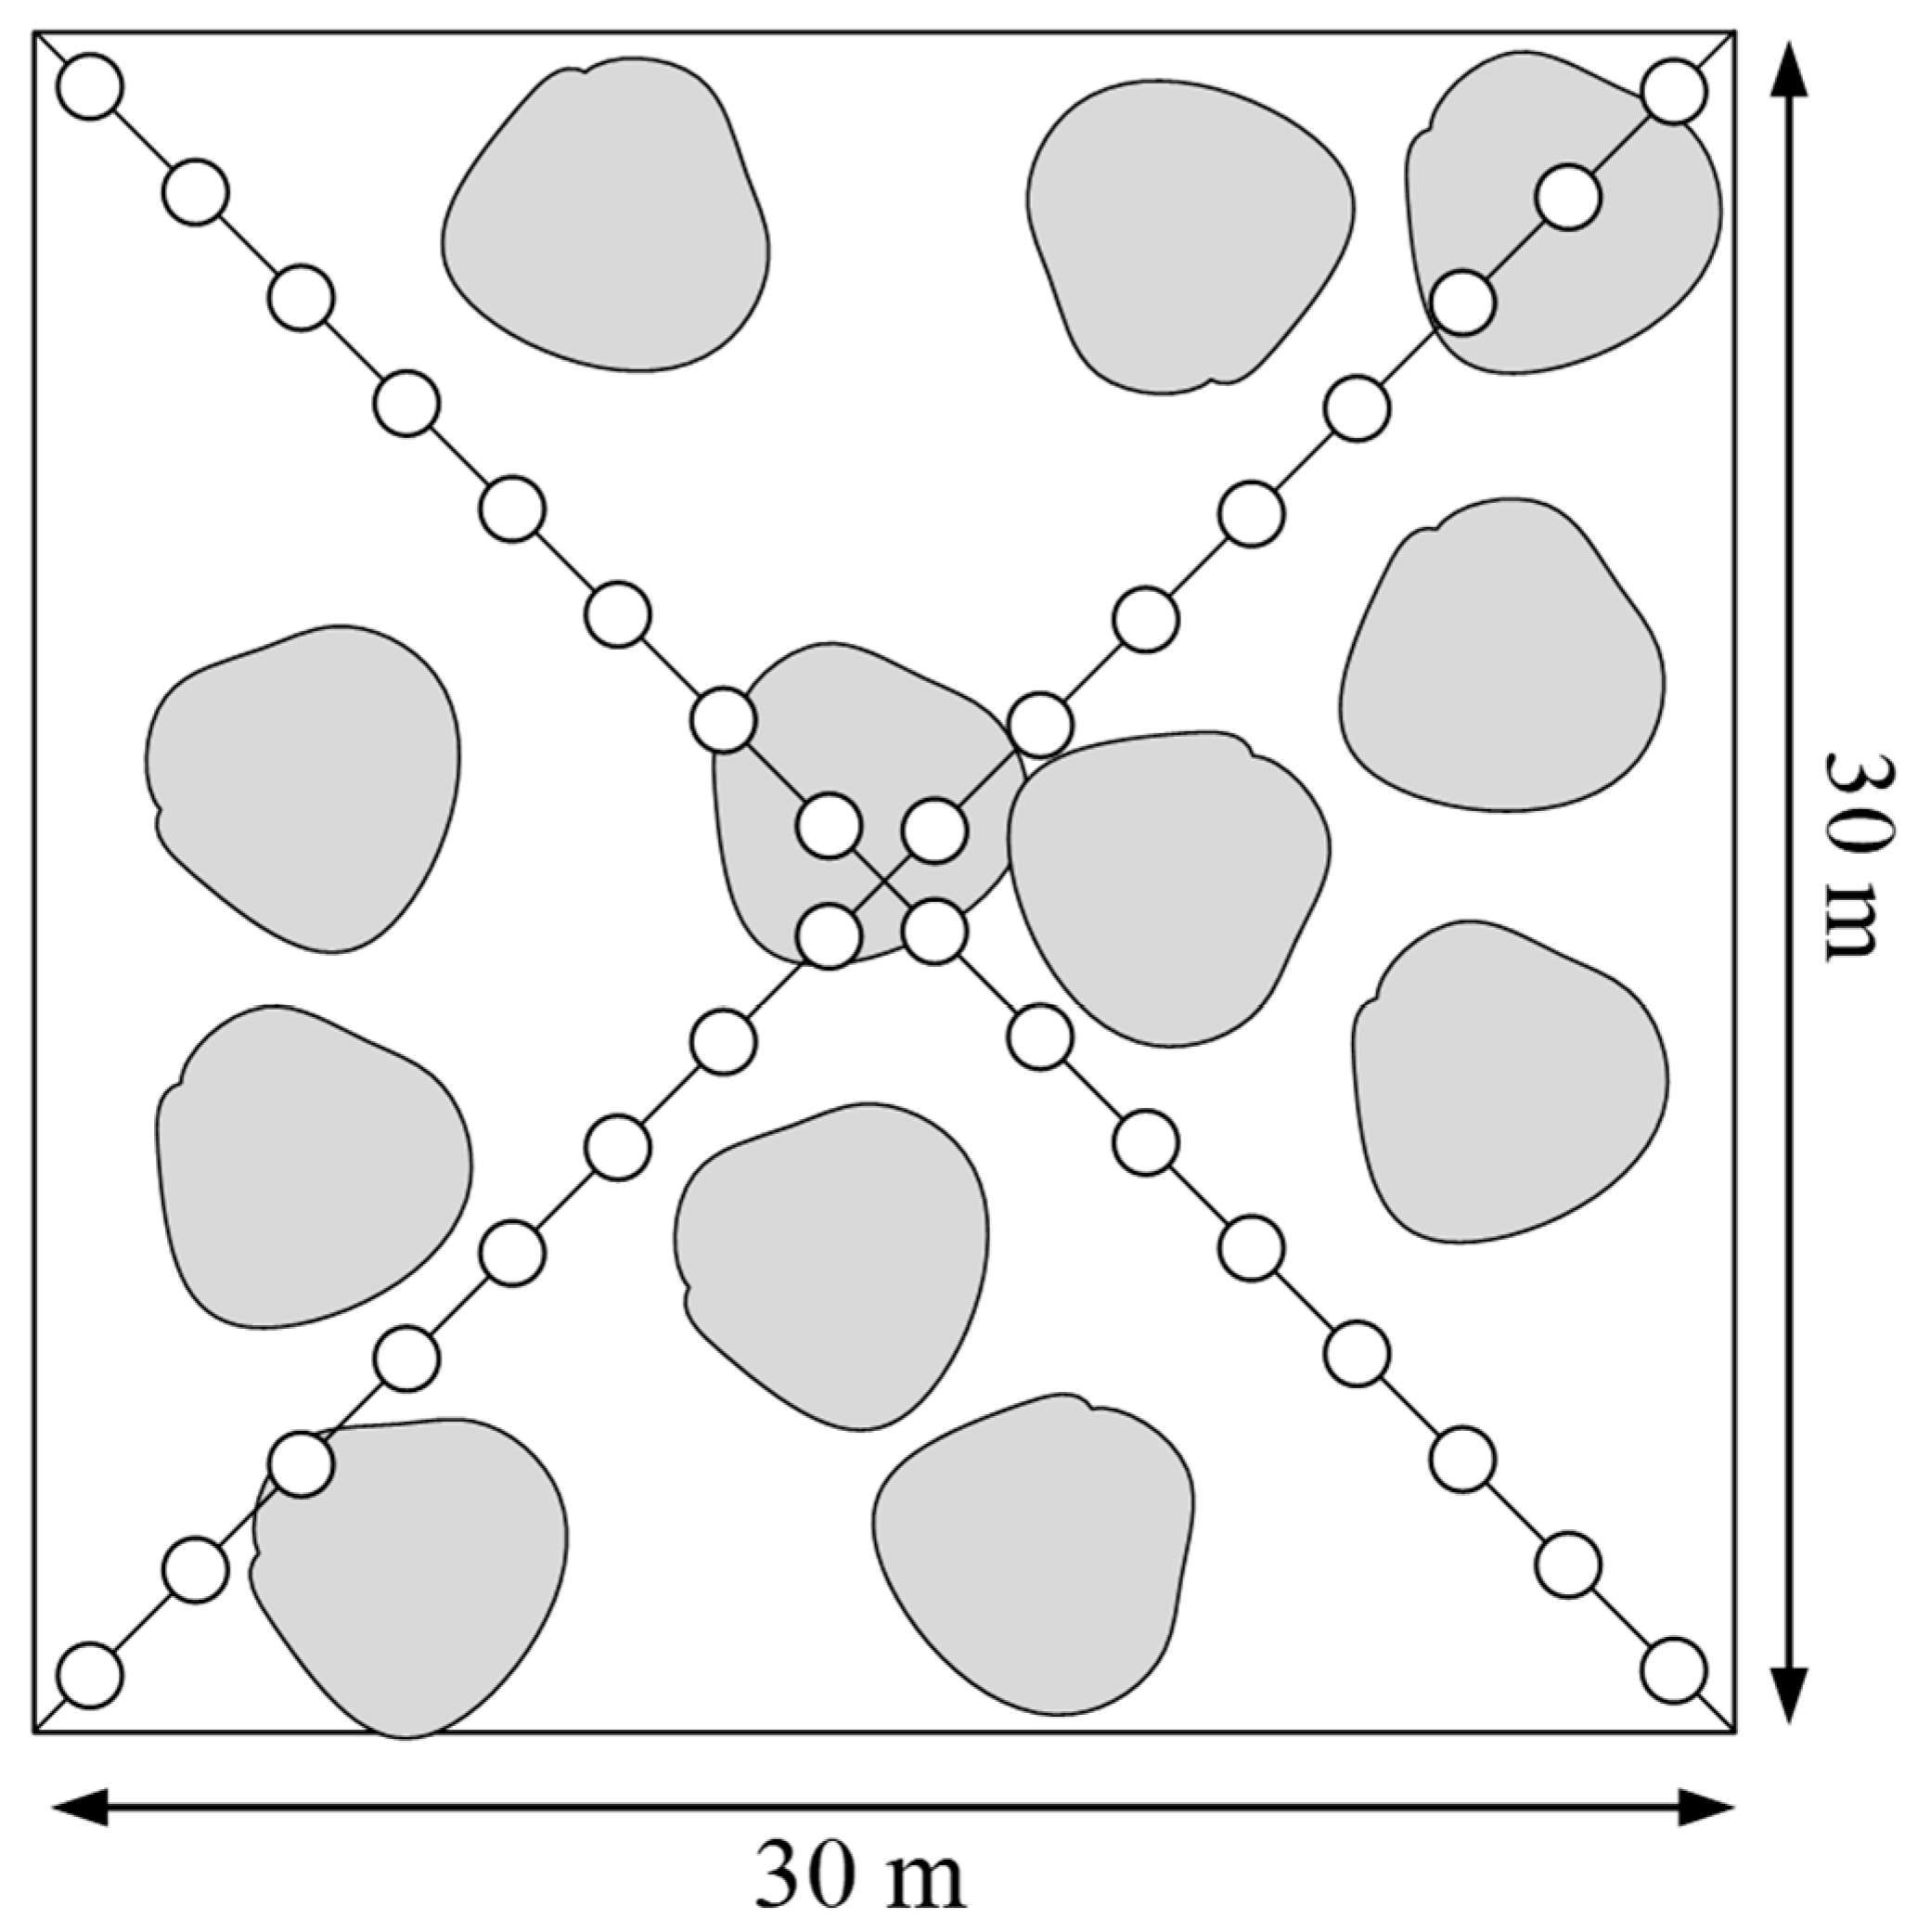
We implemented in situ measurements to assess the accuracy of UAV-estimated variables. We collected approximately 30 upward photos and approximately 30 downward photos following the two-diagonal sampling pattern in each plot (Figure 3). A Nikon D3000 digital camera was held by hand and leveled at 1.5 m above ground with the camera settings, including aperture priority mode, automatic exposure, automatic focus, ISO 100, and 18-mm focal length, to produce fine JPEG images (11,430,144 pixels per image). A surveyor walked along the two diagonals beneath the tree canopy and took a photo around every 3 m.
The upward- and downward-looking images of each plot were imported into MATLAB 2018a for subsequent processing using the LAB2 method [17]. The LAB2 method was originally designed for estimating foliage cover in forest understory [17] and hereafter was used to estimate canopy gap fraction from upward-looking RGB images [28,29]. Many independent studies reported that the LAB2 method performed well for proximal sensing images [14,25,30] with a root-mean-square error (RMSE) of less than 0.05. It was confirmed that the LAB2 method has an ability to produce reference values of canopy cover and understory foliage cover. The OCC and UVC of the entire sampling plot were the averages of the covers extracted from upward- and downward-looking images, respectively. The OCC and UVC values of each plot were considered to be the reference values (Table 1).
3. Methods
3.1. Quantification of OCC and UVC Using BAPS
Given the definition discrepancy in literature [11], the cover-related terminology used in this study should be clarified. The OCC is defined as the percentage of ground area covered by the vertical projection of the outermost perimeter of the natural spread of tree foliage. The UVC refers to the percentage of green vegetation vertically occupying a unit ground area. Following the previous study [3], we used the threshold of 2 m to distinguish overstory and understory.
To quantify the OCC and UVC, we proposed the BAPS method to process images mainly using back-projecting 3D SfM point cloud onto superpixel-segmented RGB images. Only the original images that cover the plot with sufficient proportion of the image area (over 50% in this study) and visually sufficient projected points were used for the estimation of OCC and UVC.The workflow consisted of two major steps: (1) determining crown pixels through back-projecting 3D crown point cloud onto superpixel-segmented UAV-based RGB images and then calculating the OCC; (2) locating forest floor pixels by morphologically dilating crown areas and using an advanced image segmentation method named half-Gaussian fitting method (HAGFVC) [31] to separate green vegetation pixels from non-vegetation pixels and calculate the UVC, where we assume that the extracted forest floor areas can represent the situation of the entire forest. The implemented steps are described hereafter and are illustrated in Figure 4.
3.1.1. Calculation of OCC
Prior to the superpixel segmentation and SfM point cloud generation, all UAV-based RGB images were manually trimmed to remove the take-off and landing photos in accordance with the camera timestamp and visual interpretation.
A simple linear iterative clustering (SLIC) algorithm, on the basis of k-means clustering in spectral and spatial domains with each pixel linked to a feature vector, was used to obtain superpixels given its efficient computational performance [32]. We implemented superpixel segmentation with the MATLAB 2018a built-in SLIC function to segment each UAV-based RGB image into numerous superpixels, where each superpixel consisted of approximately 4000 pixels. These superpixels were not categorized into any class, such as overstory or understory classes.
In addition to the usage in superpixel segmentation, the UAV-based RGB images of each plot and the correspondingly tagged geographic information were used to generate a 3D forest point cloud by using the PhotoScan Pro v1.4.5 software (Agisoft LLC, St. Petersburg, Russia). PhotoScan offers a completely automated SfM workflow, including feature identification, tie-point matching, and bundle adjustment. PhotoScan was firstly used to perform image alignment to detect and match points. The alignment also estimated internal and external camera orientation parameters. A bundle adjustment algorithm was used to estimate and optimize the 3D location of features corresponding to the internal and external parameters of the camera. Then, PhotoScan was used to build dense point clouds. Given that the height information in the 3D point cloud can depict the overstory and understory classes well, we classified the overstory and understory points using a height threshold of 2 m. After the elimination of the understory point cloud, the overstory point cloud was then used to identify overstory superpixels in the subsequent step.
Figure 5 illustrates the process of determining overstory crown pixels from an example UAV-based image. For the identification of overstory superpixels, the 3D overstory points were firstly back-projected onto the superpixel-segmented image on the basis of collinearity constraints (Figure 5b). This process was executed by a user-programmed Python script with PhotoScan API. The core function of this script is to establish a transformation matrix from the 3D world geo-referenced coordinate system or the local field coordinate system to the 2D image coordinate. PhotoScan provides an API function (i.e., class camera, function project) to automatically retrieve the transformation matrix (rotation matrix and translation matrix) and perform this back-projection. The transformation from the 3D world coordinates to 2D image coordinate can be expressed by Equation (1).
where R is the rotation matrix and T is the translation matrix. and are image coordinates of a back-projection on the image. is the focal length of the camera. , , and are world coordinates of a 3D point. ( = 1, 2, 3; = 1, 2, 3) and ( = 1, 2, 3) are rotation coefficients and translation coefficients, respectively.
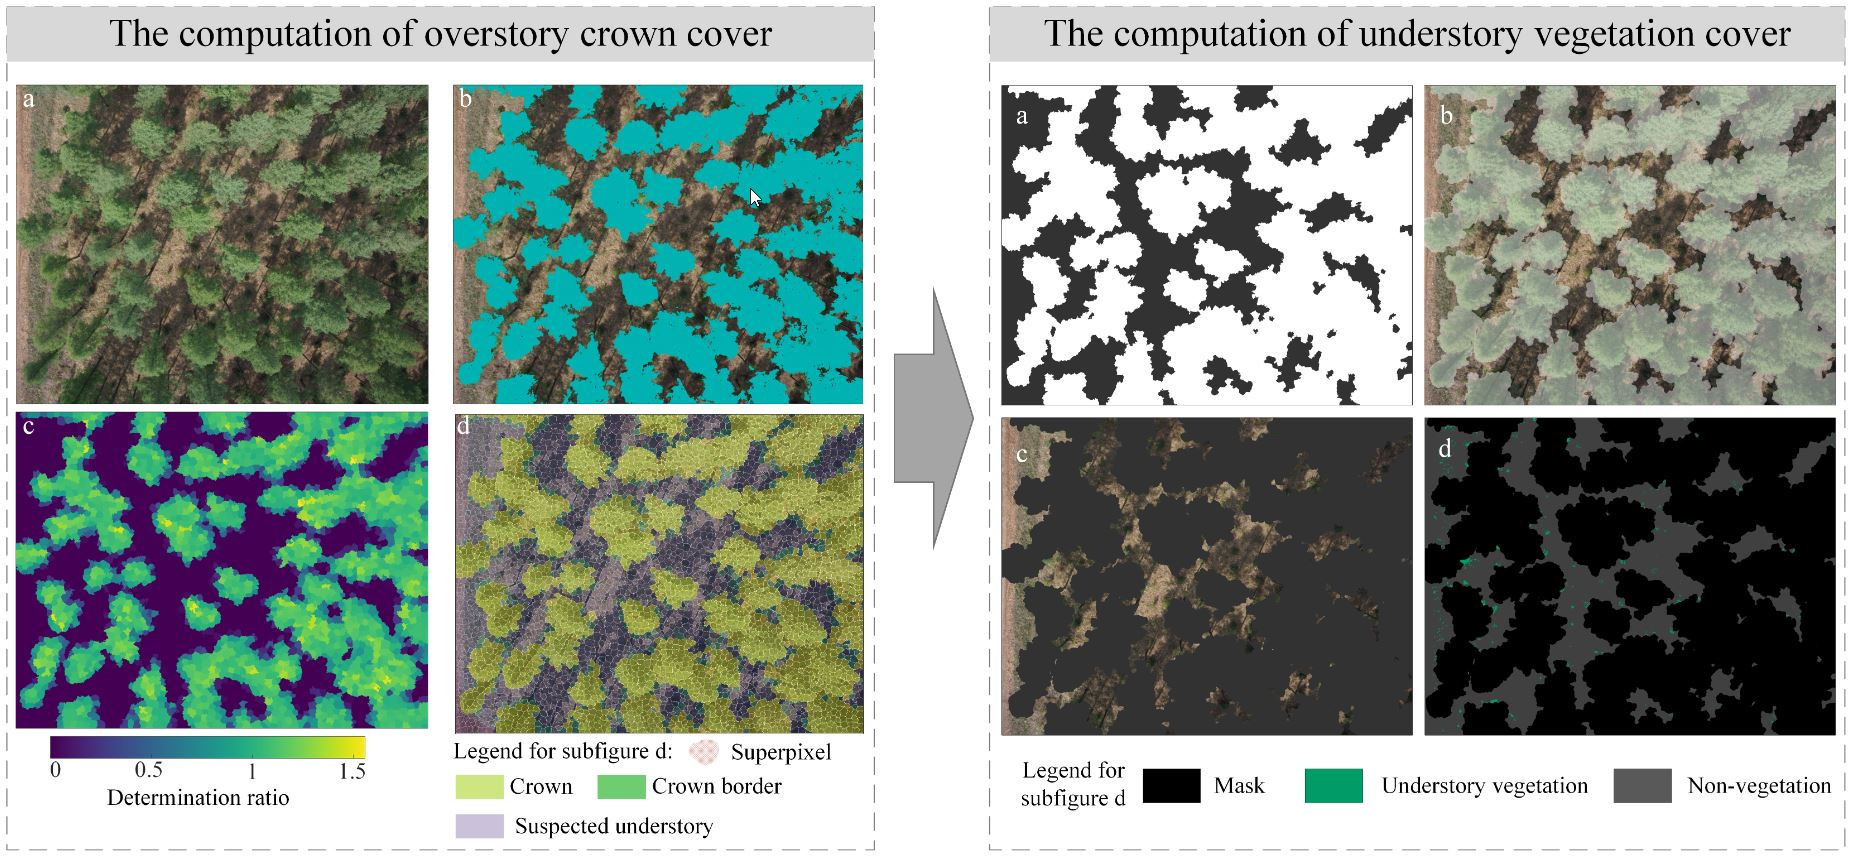
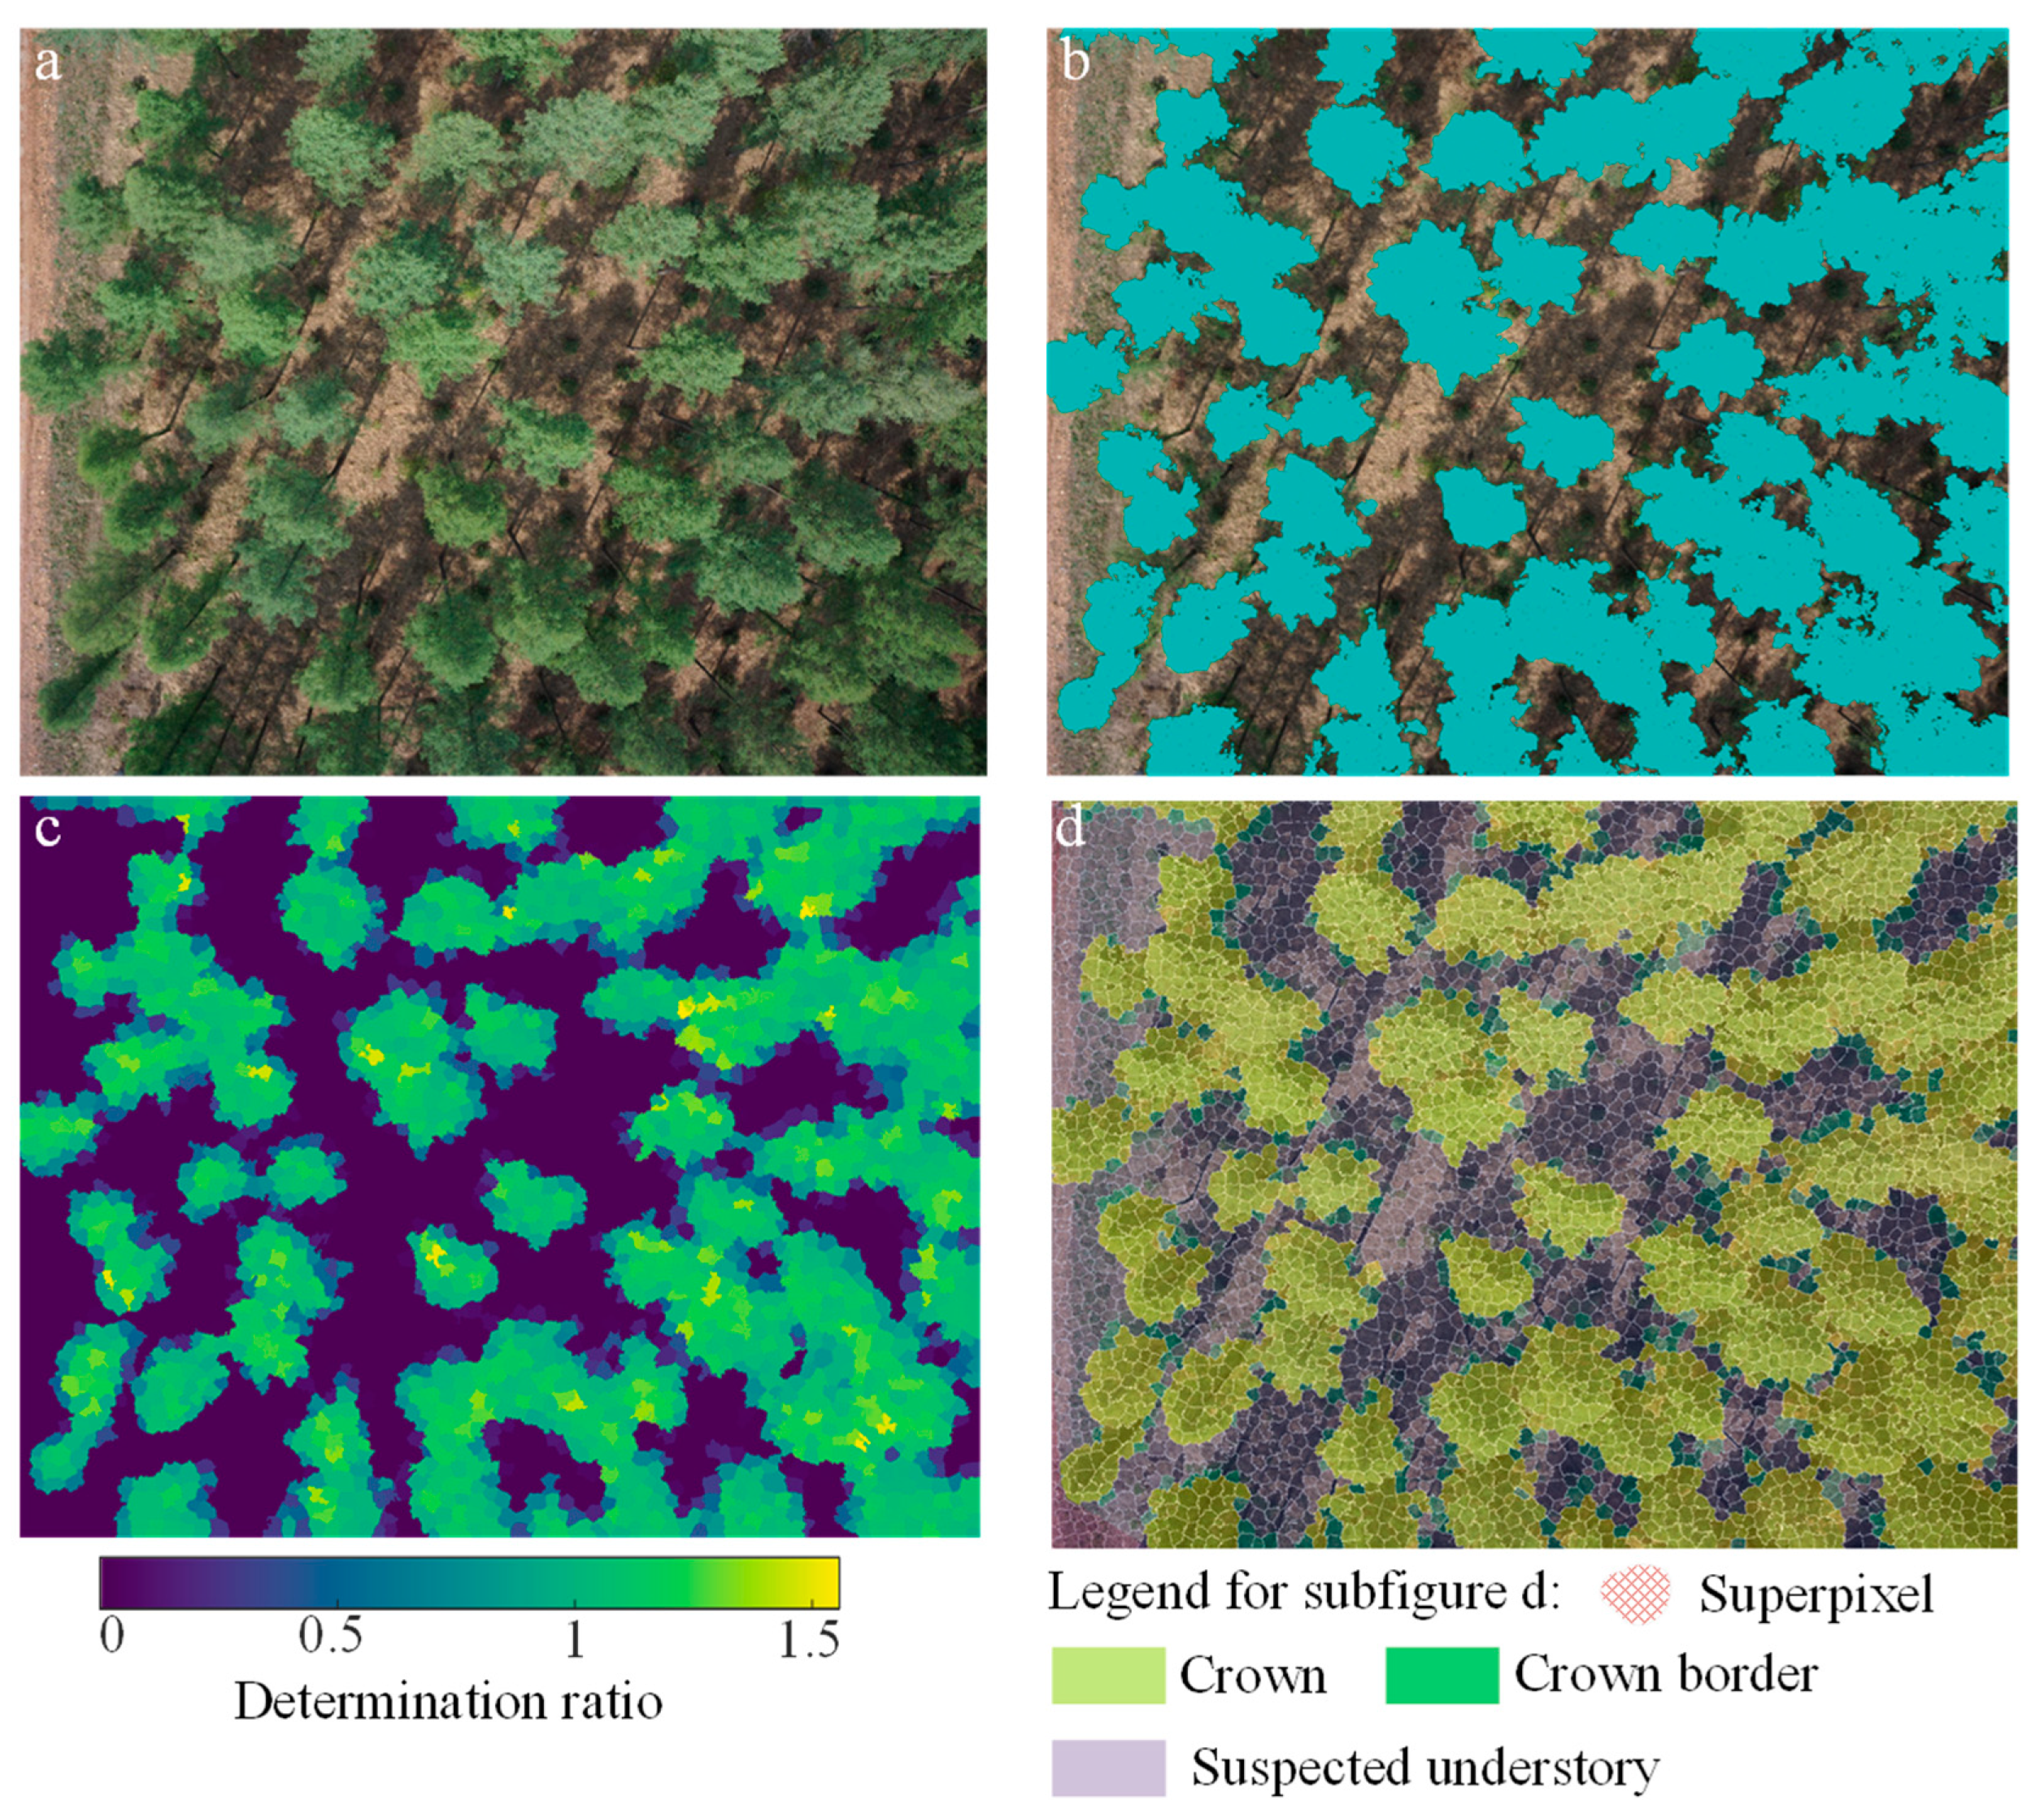
The 2D projected points within each superpixel were discrete, which induced difficulties in the annotation of overstory superpixels. Hence, we calculated the hull area of the α-shaped concave [33] of the projected points within each superpixel. The ratio of the α-shaped concave hull area to the superpixel area was used as an indicator to determine the class of a superpixel (determination ratio in Figure 5c). This ratio describes the probability of a superpixel classified into the overstory class and can be larger than one because the α-shaped algorithm can yield convex shapes. If the ratio was larger than the empirically defined threshold (i.e., 0.2), then the corresponding superpixel was classified as overstory (Figure 5d, superpixels marked with light-green color). If there was not any projected point in a superpixel, the determination ratio was assigned to be zero and was marked as “suspected understory” (Figure 5d, superpixels with transparent light-purple color) because missing overstory points would lead to incorrect judgment. For example, an overstory superpixel without any projected point would be mistakenly classified as the understory forest floor in accordance with the determination ratio. Another class of the superpixels highlighted with transparent dark-green color (Figure 5d) featured a determination ratio of less than 0.2 but larger than zero, thereby indicating the extremely low points within these superpixels. These superpixels generally occurred at the border of tree crowns and were not counted in the OCC.
3.1.2. Calculation of UVC
The computation of UVC is composed of two substeps: (1) extracting forest floor pixels, and (2) separating green understory vegetation pixels from non-vegetation pixels.
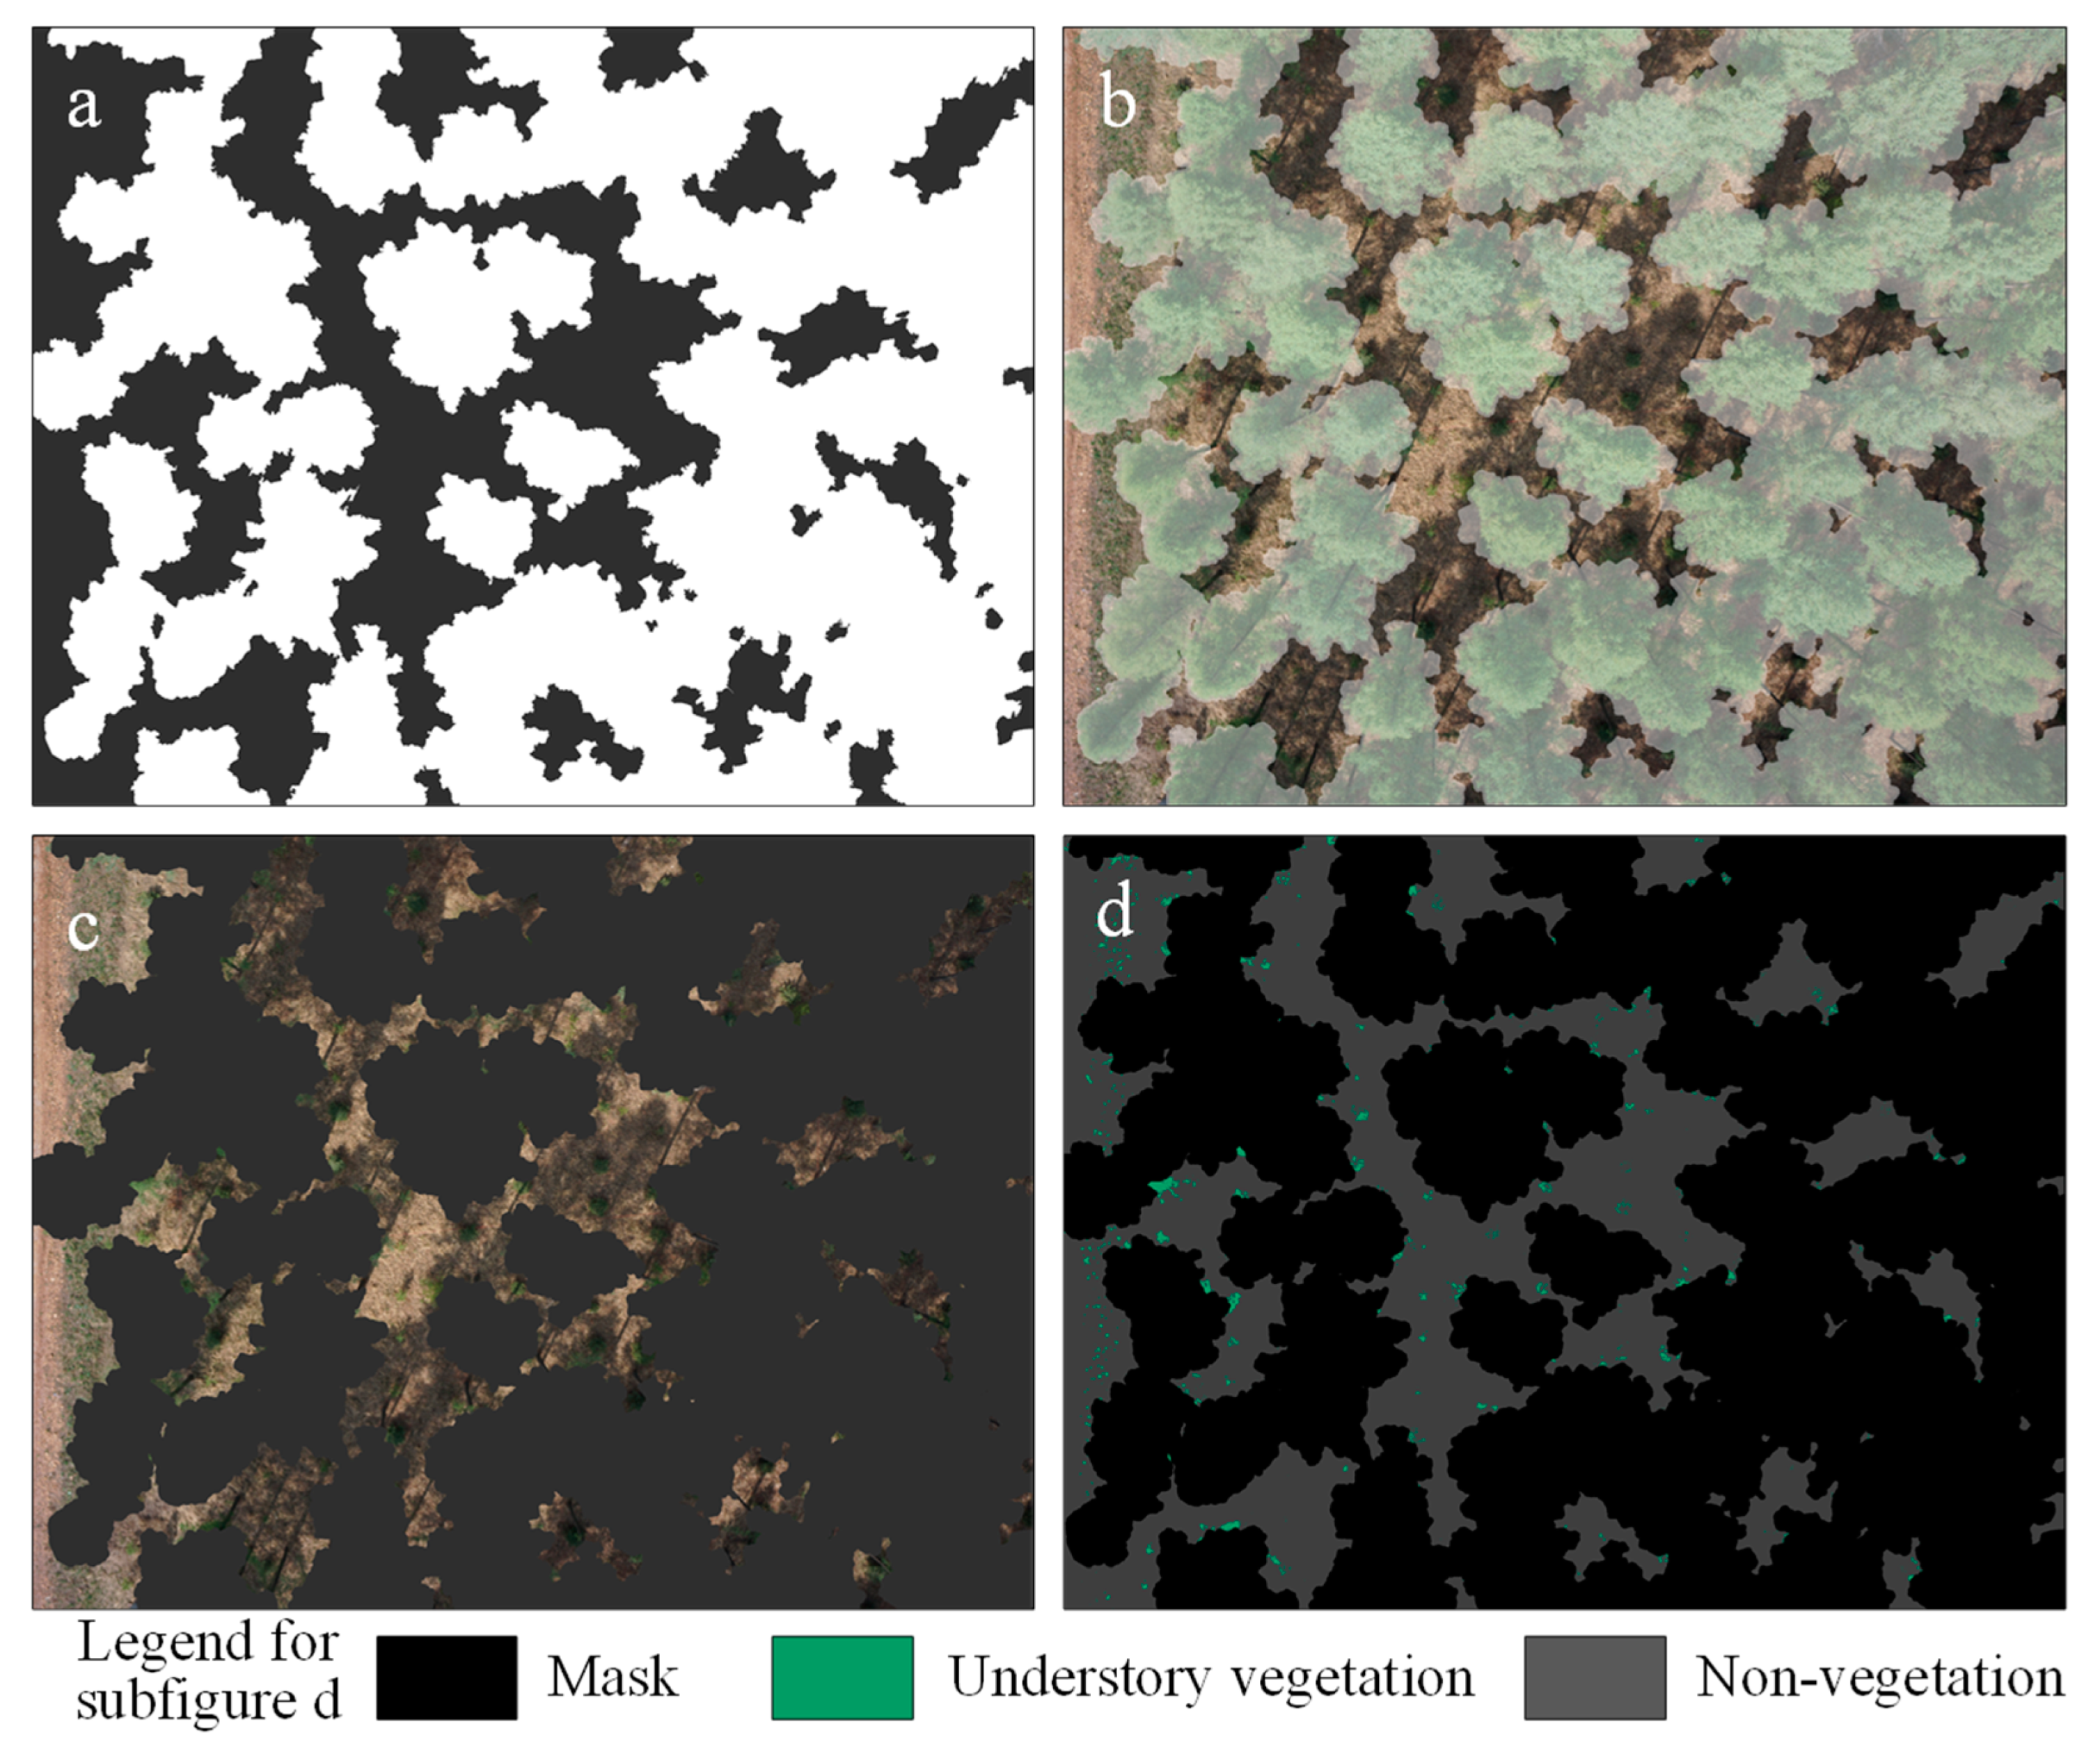
As mentioned above, the superpixel with the determination ratio of less than the threshold (0.2) cannot be directly classified as the forest floor because the SfM overstory point clouds extracted from UAV-based images were not a complete representation of 3D tree crowns. The incomplete overstory point clouds were sourced from various possible aspects, such as low image quality, low image overlap, complicated forest architecture, and weak texture. Projecting the 3D understory point cloud onto the superpixel-segmented image was ineffective because overstory elements and understory components may be present in the traversal path of view ray, thereby showing that both met the collinearity constraints. Hence, we implemented a morphological dilation to mask the overstory superpixels, thereby minimizing overstory pixels in the remaining pixels. A MATLAB 2018a built-in function was used to implement morphological dilation on the binary mask images (Figure 6a) derived from the classification map of superpixels (Figure 6d). A 15 × 15 circle-shaped structuring element was applied in dilation, thereby yielding a dilated mask image (Figure 6b). The dilated overstory areas (light-green areas in Figure 6b) covered all the superpixels of crowns and crown borders although they were also mixed with some understory pixels. Correspondingly, the complementary areas of the masked areas constituted the subsets of the entire forest floor areas (Figure 6b). We masked the dilated overstory pixels and extracted the forest floor pixels in Figure 6c.
The extracted forest floor pixels underwent pixel classification using an advanced histogram-based method, HAGFVC [31]. HAGFVC aims at estimating green cover from close-range UAV-based RGB images and was designed to address the mixed pixel problem in UAV-based images. This method was operated in the CIE L*a*b* color space, where a* characterizes the greenness level. HAGFVC assumes that pure pixels appear at the edges of the a* histogram, whereas mixed pixels are distributed between the bimodal peaks of vegetation and background in the a* histogram. The half-Gaussian fitting process fitted two separated half-Gaussian distributions of vegetation and background in the a* histogram by using Equation (2), excluding the influence of mixed pixels. After separating pure and mixed pixels, HAGFVC used an automatic thresholding method to classify mixed pixels as vegetation or background at the equivalent rates of misclassification [34]. The extracted forest floor pixels were classified into green vegetation or non-vegetation classes (Figure 6d) as follows:
where h(x) is the half-Gaussian distribution function; is the value of a*; μ and σ are the mean value and standard deviation, respectively. Subscripts v and b refer to vegetation and background, respectively.
The vegetation cover fraction of the extracted forest floor areas was estimated as the ratio of the number of green vegetation pixels to the number of all extracted forest floor pixels. In this study, we assumed that the extracted forest floor areas sufficiently represent the situation of the entire forest floor. Consequently, the UVC of each plot was derived.
3.2. Comparison of Classification Methods
3.2.1. OCC Estimation Using CHM
CHM is a raster dataset that maps tree height as a continuous surface. Previous studies verified the capability of CHM in retrieving tree-level information, such as tree height, tree density, biomass, and projected crown area [24,35]. The plot- and stand-level descriptors (e.g., OCC) can also be obtained by using the CHM data. The SfM point cloud of each plot was filtered by a cloth-simulation ground filter to separate the ground surface point cloud [36]. The entire and ground surface point clouds were used to derive digital surface models (DSM) and digital terrain models (DTM), respectively. The DSM was normalized to the height above ground by subtracting DTM elevation from the Z-axis of each pixel projected on the ground. The rasterized CHM of each plot was produced from the normalized DSM with a 0.05-m resolution using an open-source MATLAB package called Digital Forestry Toolbox. To remove the outlier CHM pixels, we performed the outlier detection on the basis of the minimum (min) and standard deviation (SD) of eight neighboring pixels. In this process, the pixel with the value of less than the threshold (i.e., min 2 × SD) is replaced by the median of its eight neighboring pixels [27]. The CHM-based OCC was calculated as the ratio of the number of the pixels higher than 2 m to all pixels within the plot.
3.2.2. UVC Estimation Using SC
After the extraction of forest floor pixels described in Section 3.1.2, we also conducted a maximum likelihood supervised classification (SC) for the extracted pixels in ENVI 4.8 image analysis software (Exelis Inc., Boulder, CO, USA). In the creation of training data, we categorized the floor pixels into three classes, namely, sunlit vegetation pixel, shaded vegetation pixel, and background pixel, which may include rocks, soil, senescent leaves, and dry grass. The SC-based UVC was calculated as the ratio of the quantity of green vegetation pixels to all extracted forest floor pixels.
4. Results
4.1. Comparison of BAPS- and CHM-Derived OCC
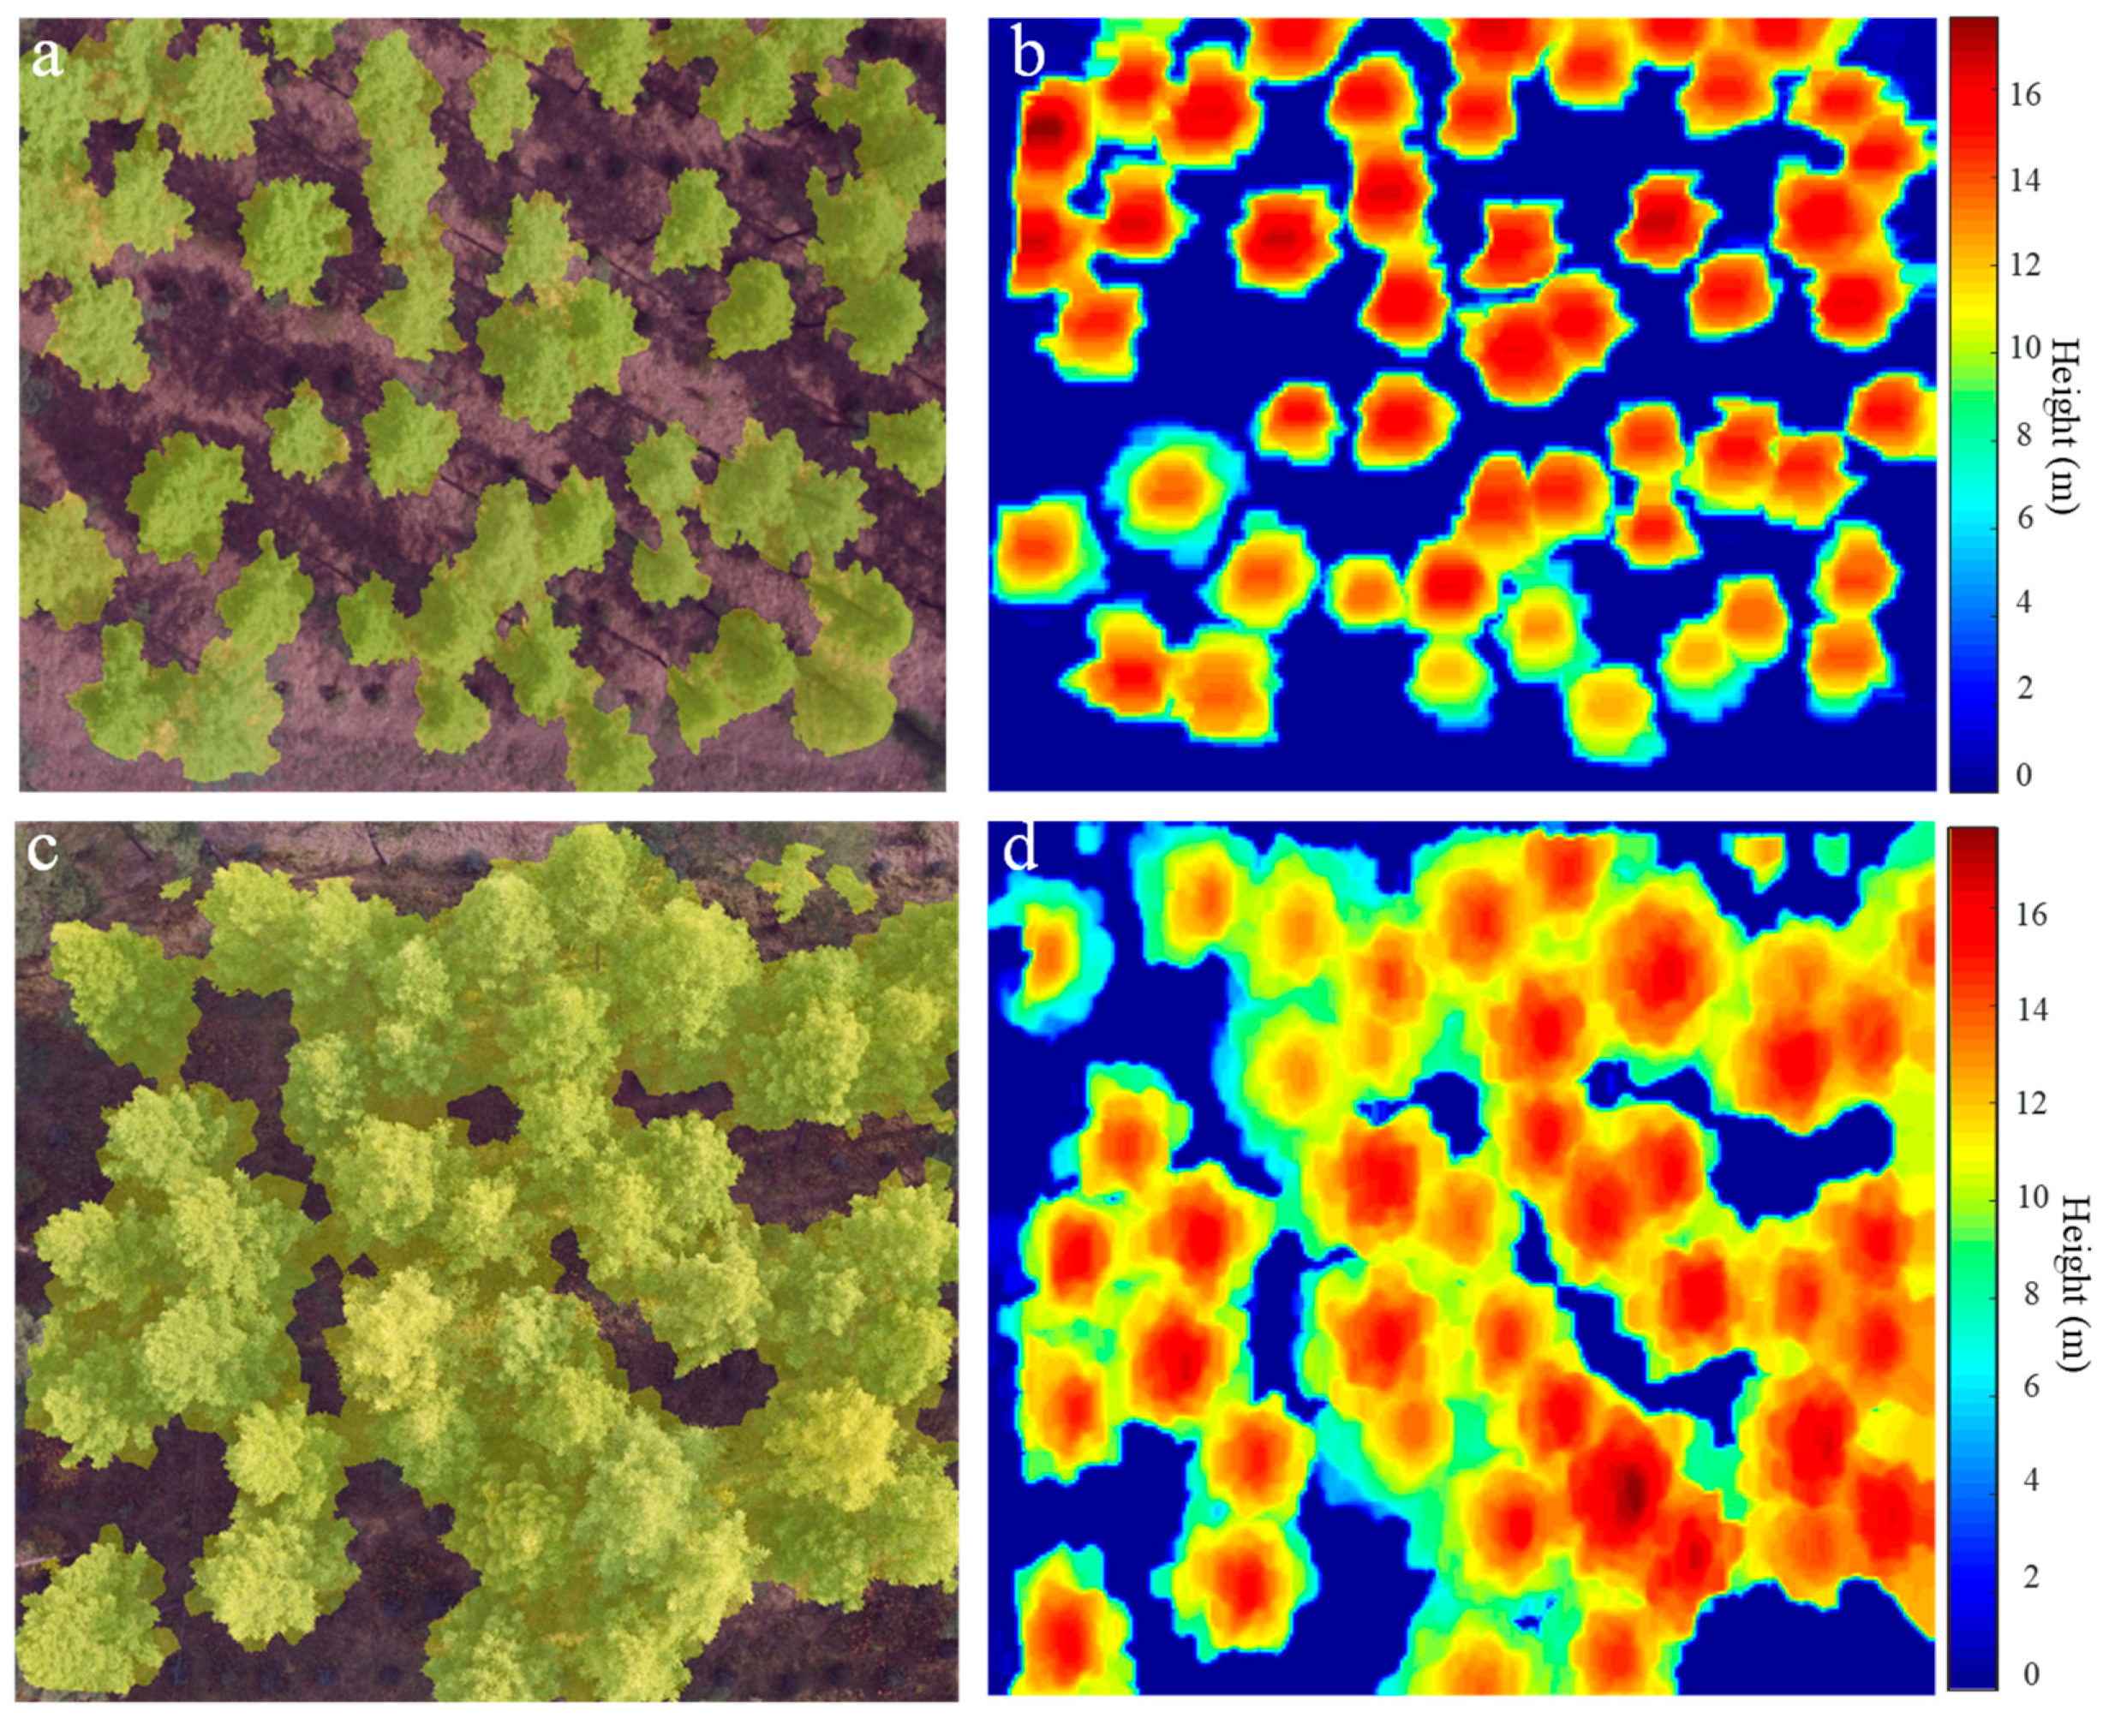
Figure 7 shows the maps of the overstory crown area of plots 1 and 2 derived from BAPS and CHM. The OCC estimates were calculated as the ratio of the sum of the crown area to the plot area. The BAPS detected the crown pixels, although an extremely low number of overstory pixels were missed. Several floor pixels in the between-crown gaps were classified as crown pixels. The two kinds of misclassification can lead to a counterbalance, thereby reducing the negative effect of misclassification in the estimation of OCC. BAPS-based estimation was also based on an original image instead of the orthorectified image. The perspective projection of the original UAV-based image caused the slight overestimation of the crown area compared with the parallel projection of orthophoto. Comparably, the CHM method yielded an improved map of the crown area, but it highly depended on the completeness of the SfM point cloud of a plot and the grid resolution setting. Considering the low quality of point cloud in the boundary areas of the plot, the CHM generally misestimated crown pixels in these areas. According to the comparisons of all plots, the BAPS and CHM exhibit similar capabilities to characterize the crown area and OCC.
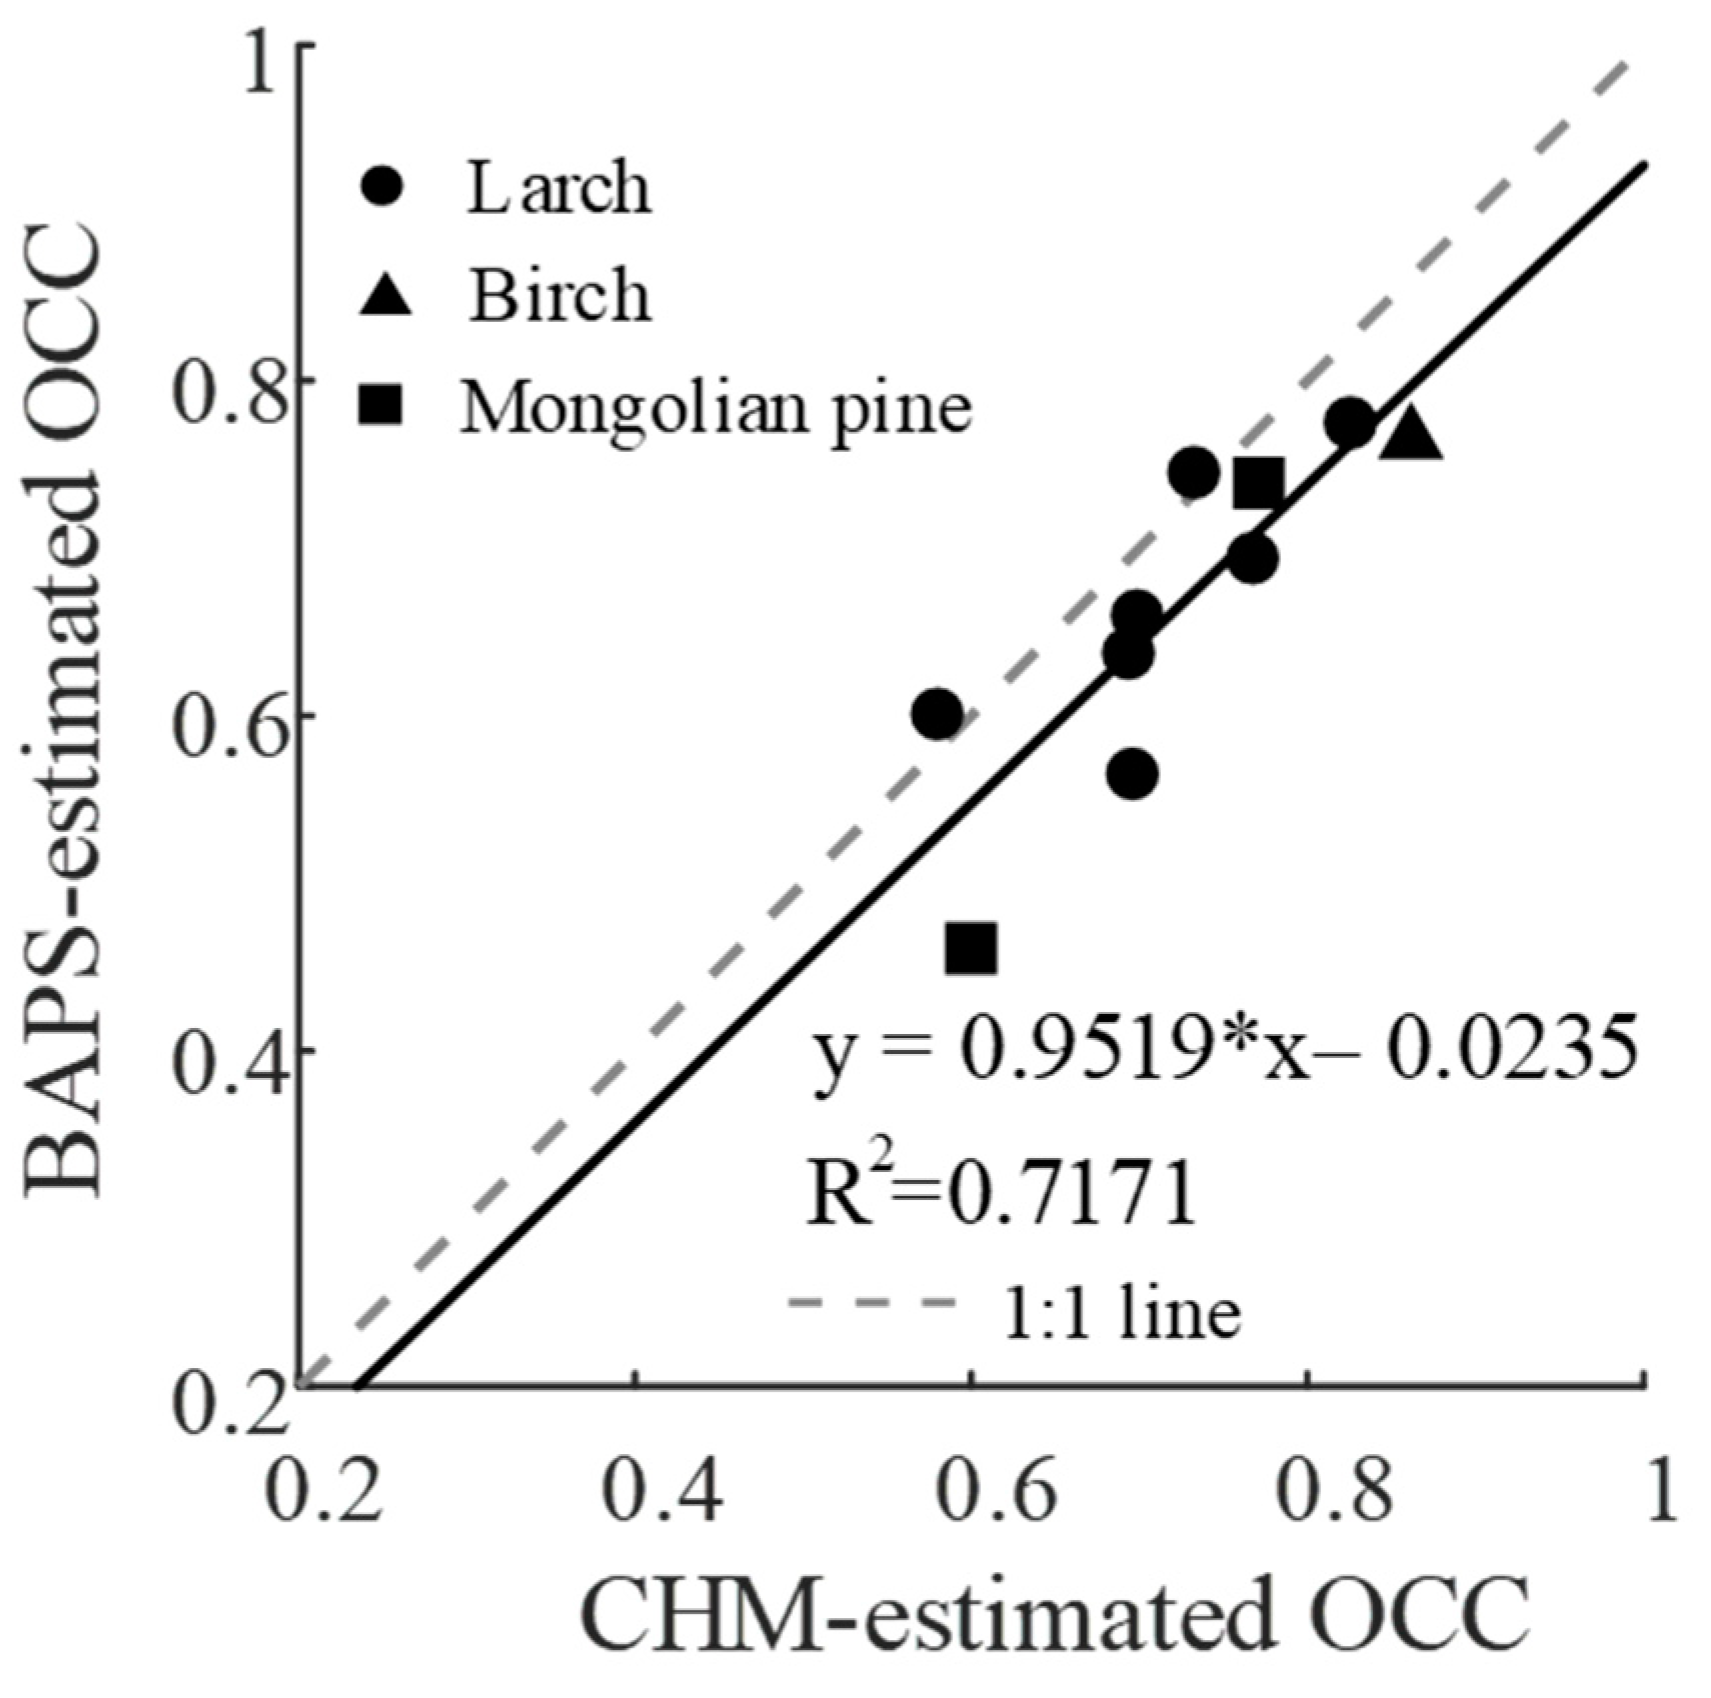
We compared the BAPS- and CHM-estimated OCC of all plots (Figure 8). The two methods exhibited relatively good consistencies (coefficient of determination (R2) = 0.7171) for all the data of three tree species, including larch, birch, and Mongolian pine. For larch plots, the BAPS and CHM yielded similar OCC estimates across various OCC levels. CHM-estimated OCC was generally higher than the BAPS-estimated OCC.
4.2. Comparison of BAPS- and SC-Derived UVC
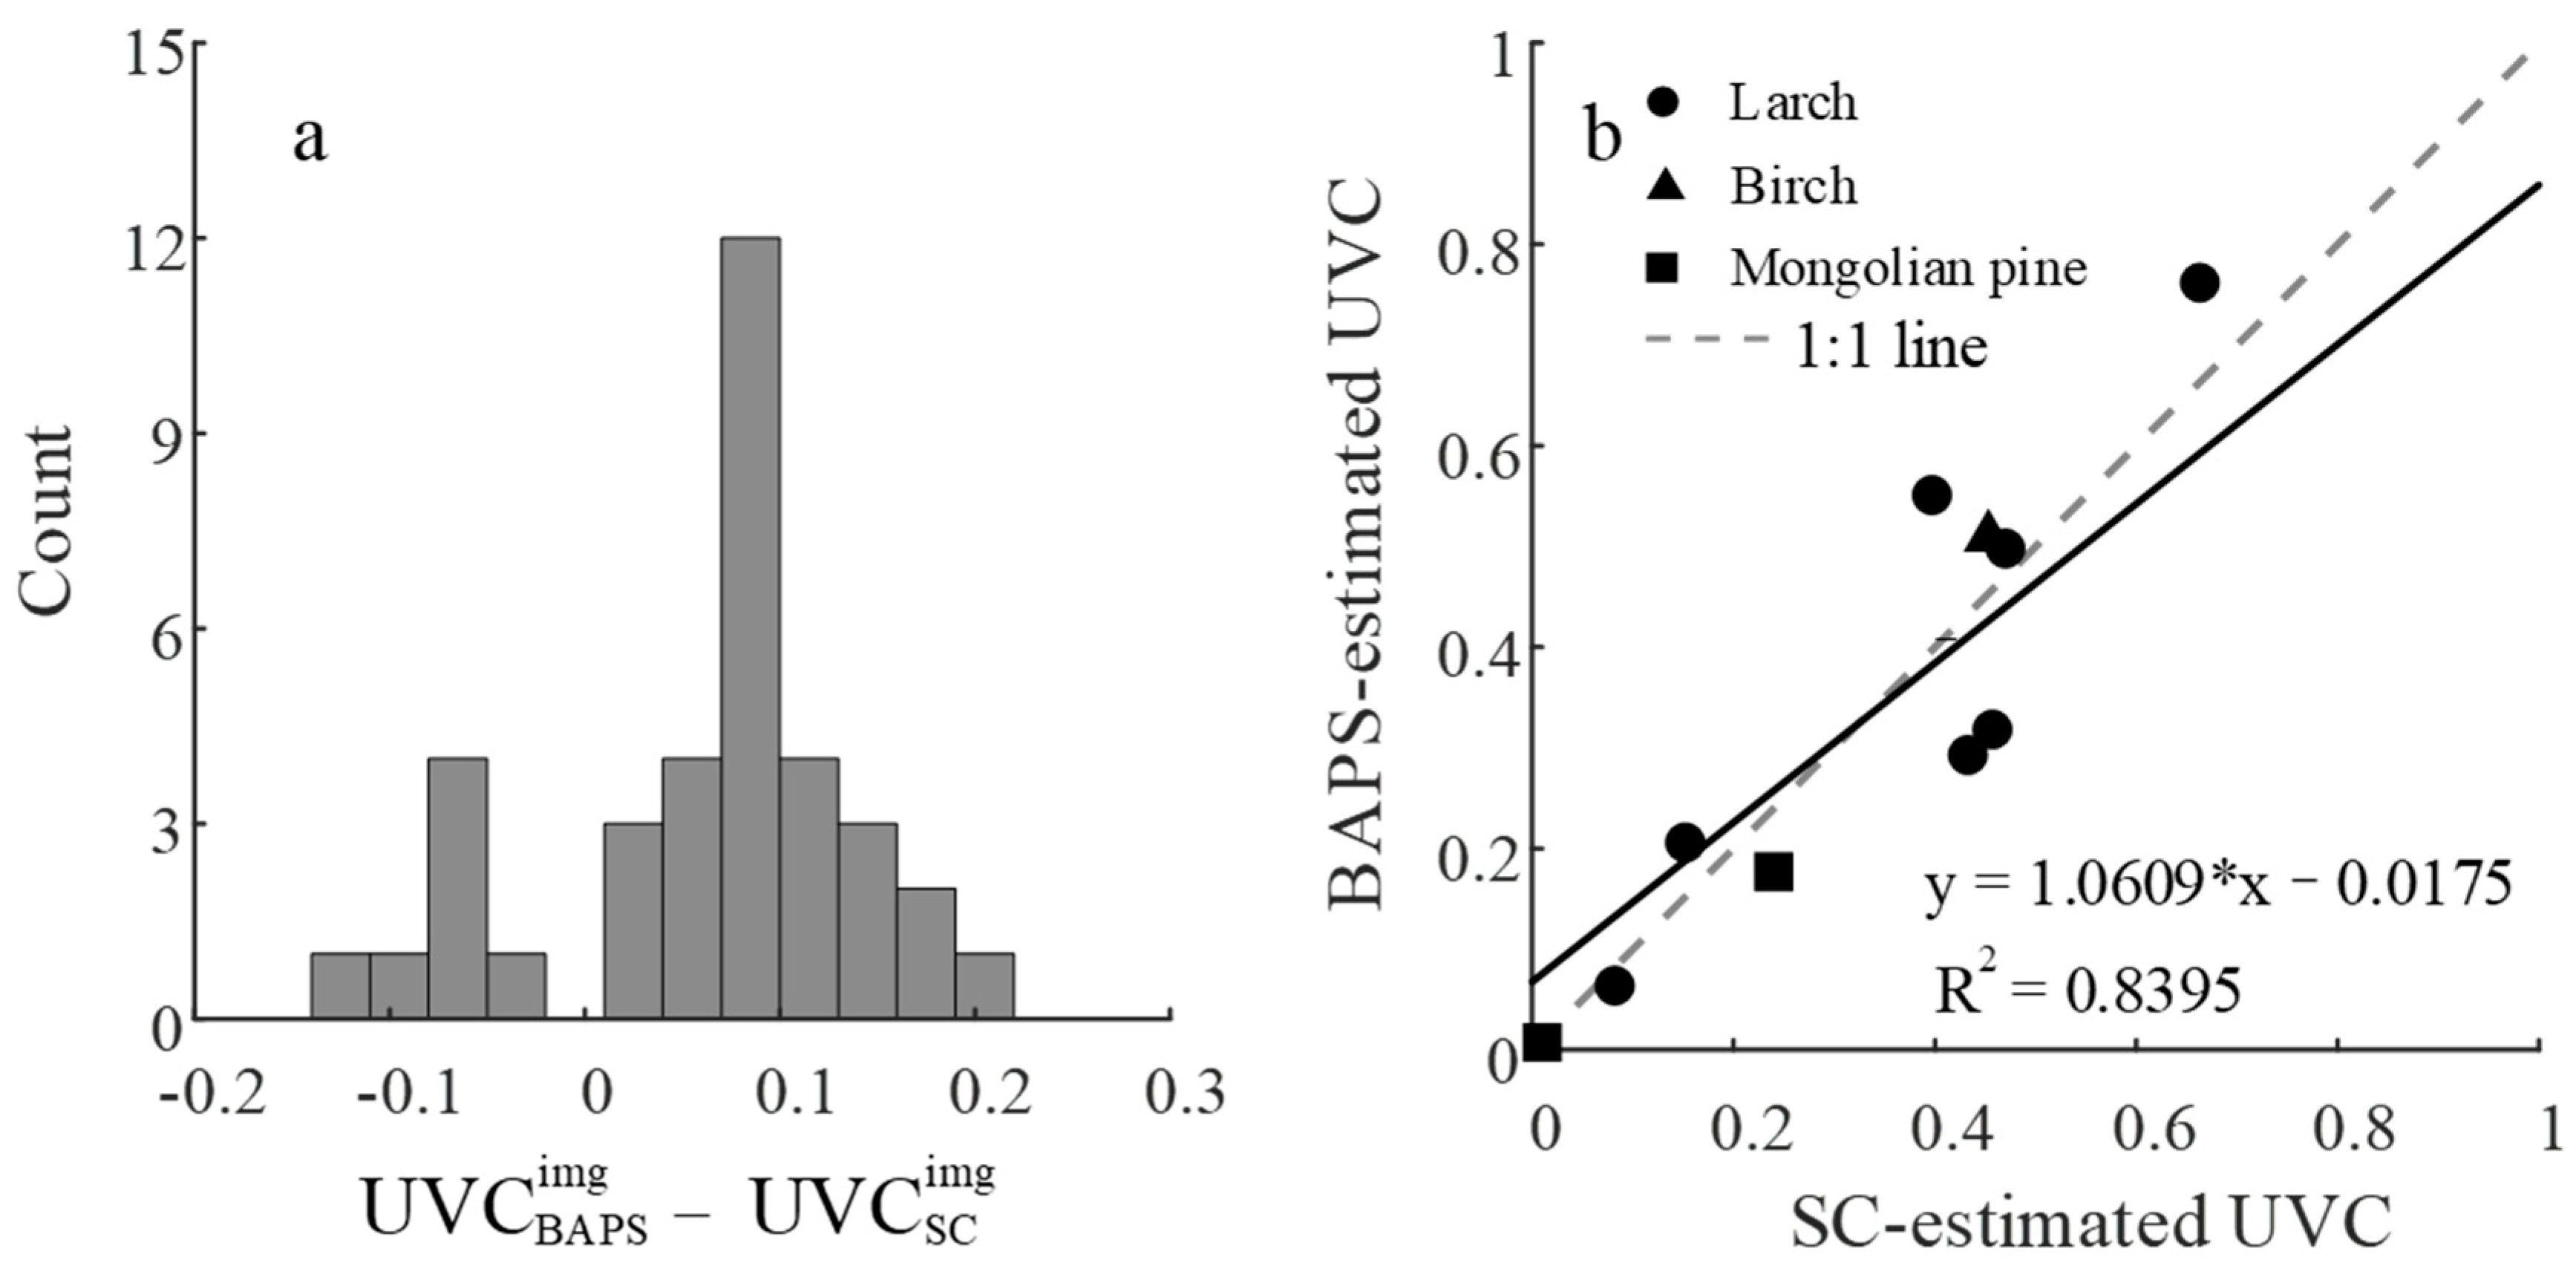
Figure 9 indicates the performance of BAPS in the estimation of UVC compared with the SC method. The BAPS method used the HAGFVC algorithm to segment green understory vegetation pixels from the extracted understory pixels. As shown in Figure 9a, the BAPS obtained UVC estimates with comparable results of SC for 36 randomly selected images of eight plots. The absolute values of the differences in UVC were generally less than 0.1 for most images. Figure 9b shows the comparison of BAPS- and SC-estimated UVC for all forest plots with three tree species. The BAPS-derived UVC values were in good agreement with SC-derived UVC (R2 = 0.8395) across the range of UVC.
4.3. Assessment of BAPS-Derived OCC and UVC with In Situ Measurements
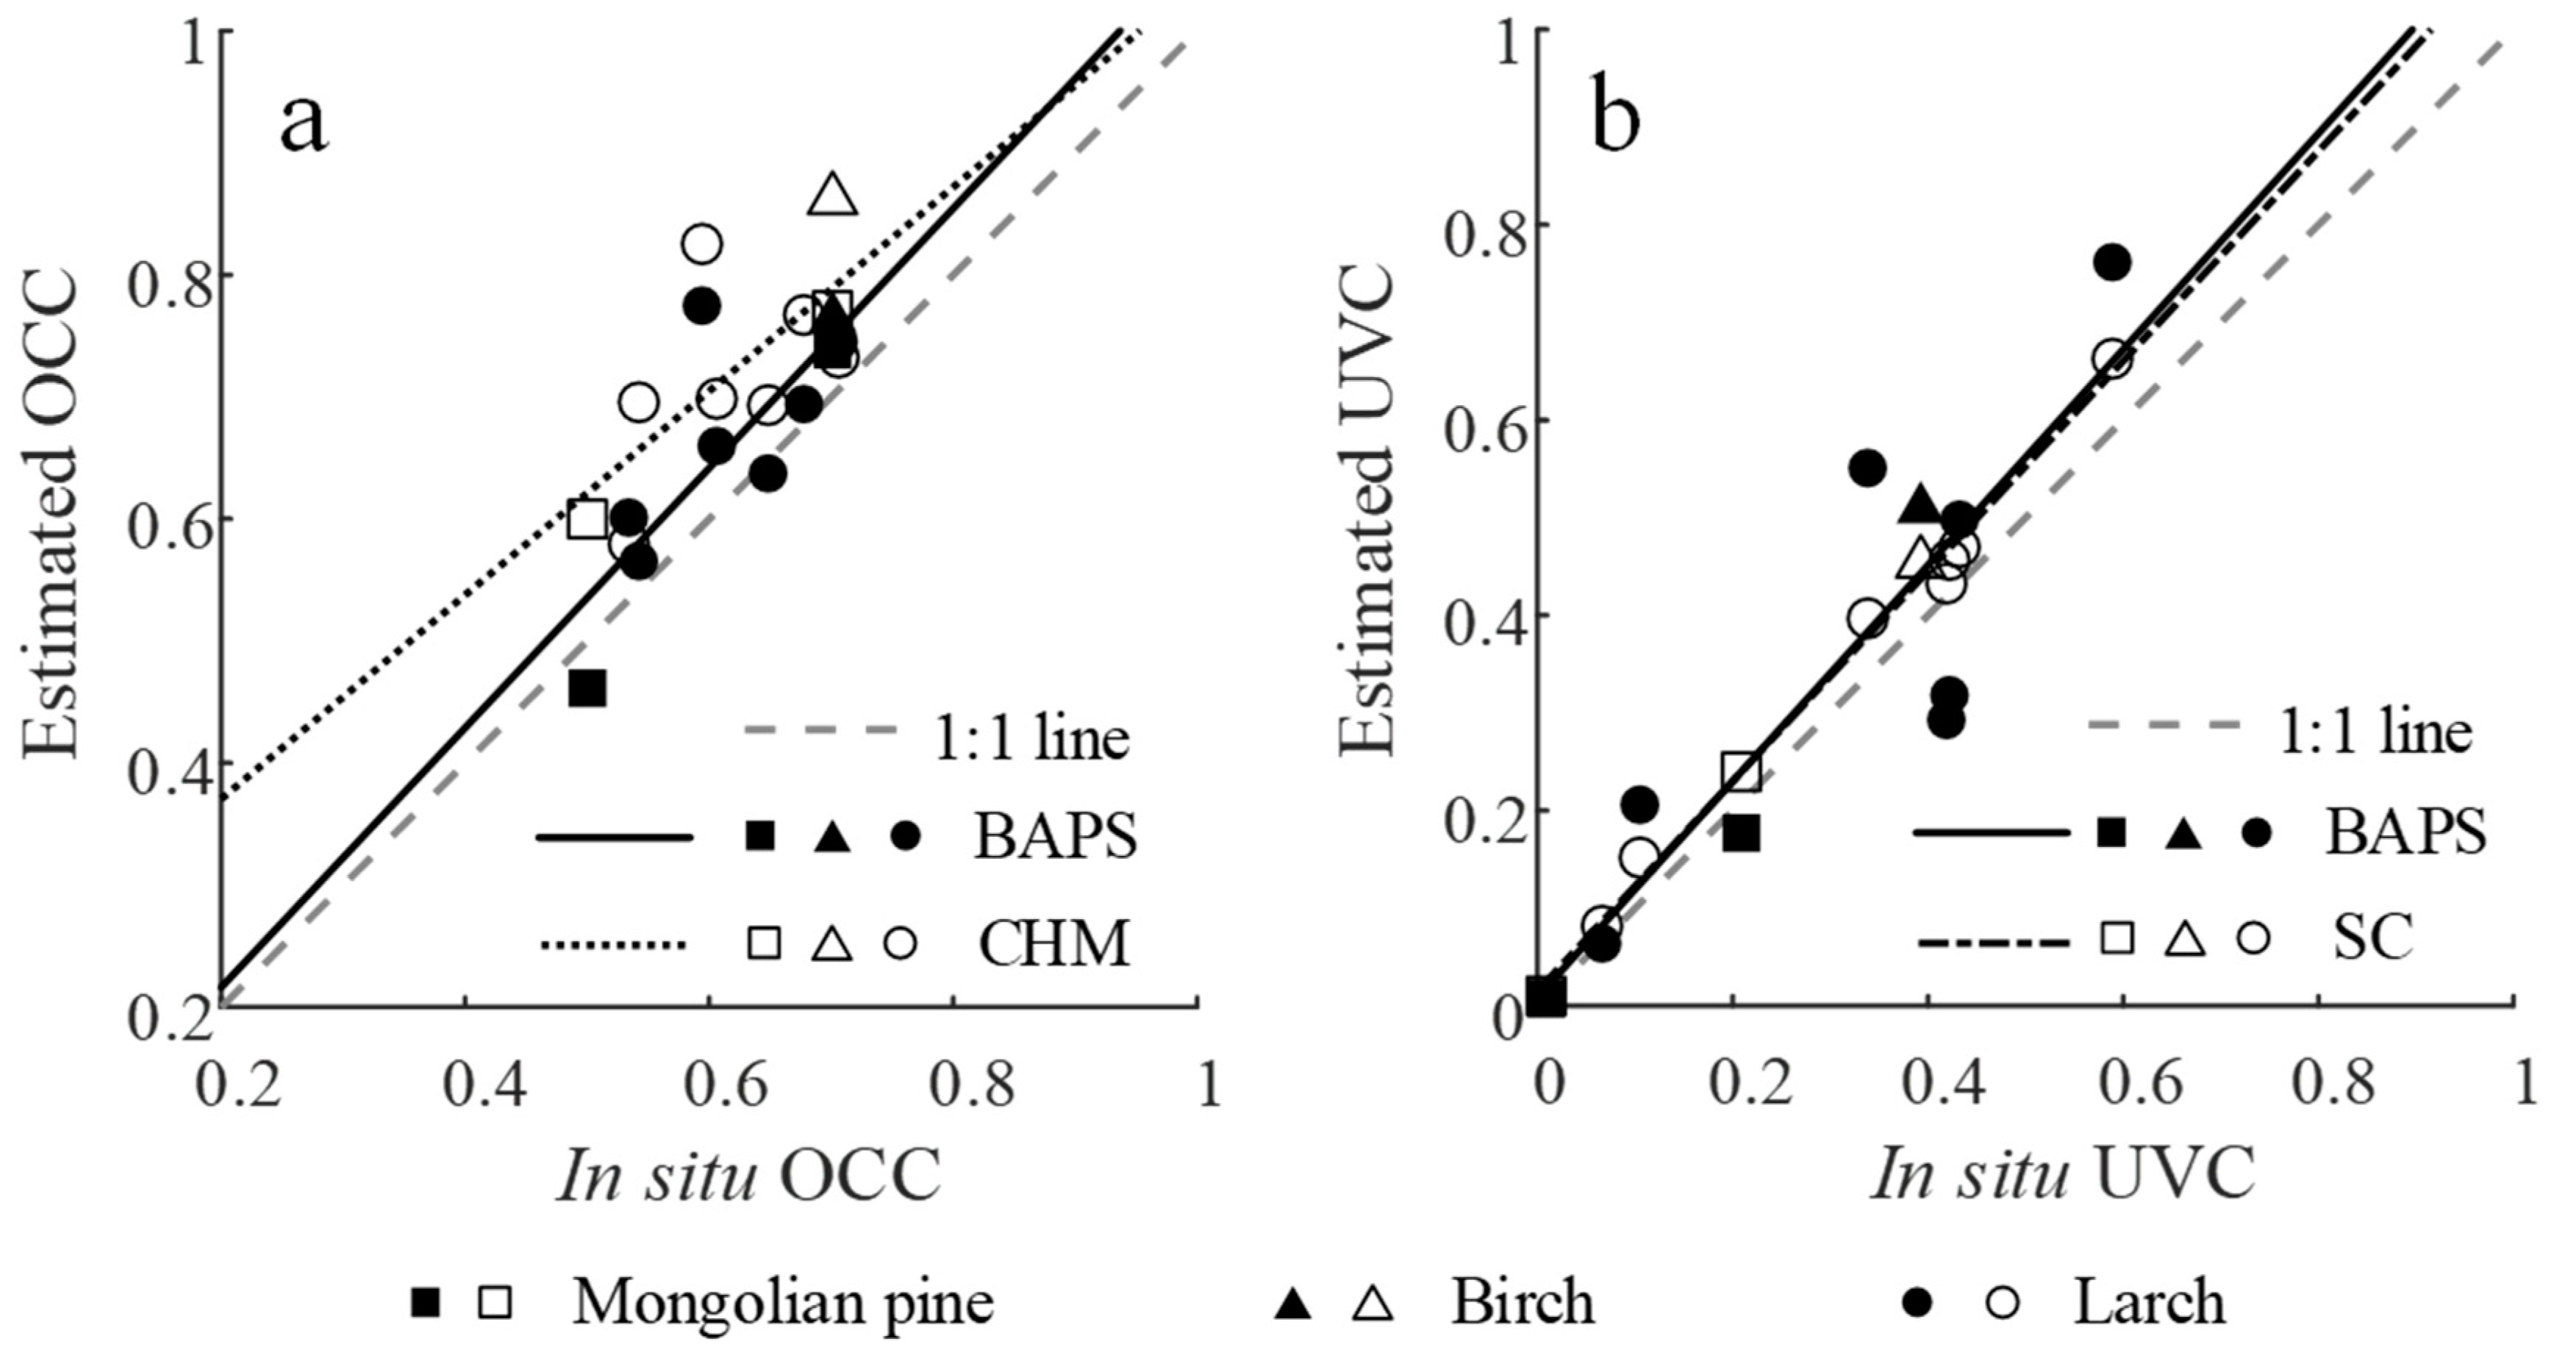
The estimated OCC and UVC values were compared with the in situ values in Figure 10. Overall, the BAPS estimation of the two variables from the UAV-based RGB image coincided with the references (RMSE of 0.0704 for OCC and RMSE of 0.1144 for UVC in Table 2) for the three tree species. The BAPS slightly overestimated the OCC if the in situ observations were considered as the reference (Figure 10a). The overestimation may be caused by the discrepancy in the definition of OCC. The in situ photography method calculated the OCC excluding the within-crown gaps. The UAV-based method considered a crown as a solid object. The CHM-estimated OCC showed a worse agreement with in situ values (RMSE of 0.1180) and lower precision (R2 = 0.5169) than the BAPS method. In situ observation also revealed several error sources, such as trunk obstruction and perspective projection.
The BAPS method offered UVC estimates on the basis of the extracted understory areas. These BAPS-derived UVC estimates were comparable to the in situ UVC with a slightly larger RMSE and a lower bias (RMSE of 0.1144 and Bias of 0.0405 in Figure 10b and Table 2, respectively) than those in the OCC estimation. BAPS-estimated UVC values were also slightly overestimated. The overestimation increased when the forest overstory cover became large, which may be explained by the lower representativeness of the understory areas viewed by UAV to the entire plot. Another important error was the un-orthorectified UAV-based original images, which deviated from the demand of parallel projection in the definition of vegetation cover. Figure 10b also shows that the SC-derived UVC values were close to the in situ findings (RMSE of 0.0375) and the linear regression line (R2 = 0.9923). The plot of Mongolian pine was measured at two temporal phases with a time interval of approximately one month (Table 1). The results in Figure 10 illustrate that the UAV-based method can capture the changes of two-layer vegetation covers.
5. Discussion
Prior to this study, the characterization of overstory and understory vegetation was only investigated by 3D remote sensing data, such as airborne laser scanning data (airborne LiDAR) [3,21]. This technique is effective but relatively expensive for forest monitoring at the community level. Traditional 2D remote sensing data showed the incapability of this technique in estimating and predicting understory situations due to the spectral similarity between the two strata and invisibility problem of understory [2]. The present study demonstrated that the low-cost UAV-based RGB camera provided a new operational means of quantifying forest overstory and understory vegetation cover. A feasible pipeline was developed for processing UAV-based RGB imagery across various forest scenarios (Figure 4). We separated the overstory layer from the understory layer and then estimated OCC and UVC by taking advantage of 3D point cloud derived from RGB images and the color and texture information within superpixels. The vegetation covers of understory and overstory layers were quantitatively characterized through the proposed method.
The BAPS method suggested that the SfM point cloud derived from RGB images can identify the overstory and understory layers (Figure 5), yet the point cloud was occasionally incomplete. Therefore, the integration of SfM point cloud and superpixel segmentation, making full use of height, color, and texture information, offered new insights into the characterization of understory and overstory situations (Figure 5c). The classification map of superpixels depicted the overstory crown fraction of the image well (Figure 5d).
In our cases, we used an empirically defined threshold of 0.2 (determination ratio) to determine the class of superpixels. Theoretically, the threshold of 0.5 would be a proper cut. However, we found that the incomplete point cloud of crown borders is the major factor causing incorrect estimation of OCC. The superpixels located at the crown border generally contain both overstory pixels and forest floor pixels. Therefore, the superpixel segmentation is relatively poor due to the strong similarity of color and illumination in this region. In addition, the point clouds in forests are generally characterized by incomplete point clouds due to the limited view point(s) and occlusion effects. When overstory pixels dominate the superpixel but the projected points are severely incomplete, the area of the α-shape concave hull is generally small. Hence, in this case, the determination ratio is small. The superpixel will not be classified as overstory if the threshold is large, resulting in an underestimation of OCC. According to our tests, a threshold of 0.2 is an appropriate threshold. Additional morphological processing enabled the extraction of understory pixels, although they were the subset of the original understory layer (Figure 6). This result proves that our method can be used to analyze understory status with the capability close to time- and cost-consuming fieldwork [37]. This result also saves payload onboard the UAV compared with the combination of spectral cameras and laser scanning devices, which need sophisticated flight control and complicated post-processing [35].
As suggested by the comparison of OCC and UCC estimated by using the BAPS method and other methods (Figure 7, Figure 8 and Figure 9), the BAPS method can yield OCC and UVC estimates comparable with commonly used methods. Our results indicate that the performance of the BAPS method is robust for different forest structures, plant species, and illumination conditions (Figure 10). The accuracy of the OCC estimates is dependent on the completeness of point clouds for the CHM method. The BAPS method is more resistant to incomplete point cloud than the CHM method because superpixel segmentation in original high-resolution images can alleviate this effect. In this study, the results demonstrate that the BAPS method performed better than CHM in OCC estimation (Figure 10). However, the reference value was not a perfectly true value given that the in situ observations still present several error sources. The OCC was defined as a continuous convex surface containing all small gaps within the crown [38], which naturally caused differences between in situ OCC and BAPS-derived OCC. Given the unceritainty of in situ measurements, we can draw the conclusion that the BAPS method can be used as an alternative to the CHM method at least (Figure 8).
The results also demonstrate that the BAPS method showed a similar performance to the SC method in UVC estimation (Figure 10). We noticed that the SC-estimated UVC was highly correlated with in situ value (R2 = 0.9923). This might be caused by the relatively low number of experimental data used to establish the correlation, i.e., 10 plots. Moreover, the understory situations of our plantation plots were more homogeneous and simpler than those of natural forests. Despite the high correlation, the RMSE and bias were 0.0435 and 0.0375 for the SC-based estimation of UVC, respectively. The UVC estimates derived using the BAPS algorithm agreed with the reference values measured with downward-looking photography, with an RMSE of 0.1144 and bias of 0.0405. This finding verified the applicability of the HAGFVC algorithm embedded in the BAPS method for forest scenes, although the HAGFVC algorithm was originally designed for the application to crops [31]. The BAPS-derived UVC estimates were relatively higher than the reference UVC, with a slight overestimation for large overstory tree cover (Figure 9). This result may be explained by the insufficient representativeness of the extracted subset of the understory layer. The assumption that the understory layer is homogeneous might be problematic when the understory situation in the between-crown gaps is not consistent with that beneath the tree crowns.
The good agreement between UAV-estimated and reference values was encouraging, but several possible limitations were still present. Firstly, in UVC estimation, the HAGFVC algorithm only used a single color feature (greenness) to quantify green vegetation and non-vegetation components, which might cause failure in processing extremely complicated forest scenarios with high variability in terms of illumination, color, and 3D architecture. The premise of applying HAGFVC to images was that the histogram of color features followed a bimodal distribution. We enhanced the algorithm to adapt it to images with the unimodal distribution. Nonetheless, complex scenes would reduce the performance of the HAGFVC method. Secondly, low overlap among images, low-quality images, and highly complex ground objects generally reduce the quality and completeness of the SfM point cloud. The incomplete SfM point cloud brought challenges for the extraction of the understory layer. A largely incomplete overstory point cloud led to the extracted understory areas mixing with overstory pixels, thereby resulting in an overestimation of the UVC. Therefore, we recommend that >80% overlap in both side and forward directions should be applied. Thirdly, the heterogeneity of understory vegetation is also an important factor affecting UVC estimation. It is difficult to obtain the forest floor pixels vertically obstructed by tree crowns. However, the field of view (FOV) of UAV-based RGB camera can help to observe some floor pixels under crowns. Generally, the visible floor pixels are mainly located at the between-crown gaps. We assumed that the extracted visible understory areas can be used to fully characterize the entire understory layer of the plot. This assumption was valid for our plantation plots in SNFP but might be inapplicable to other forest ecosystems [39,40]. A possible solution is to obtain a correction factor based on field measurements or ecological knowledge. Finally, for the complex forest scenarios with layers more than two, such as the mixture of mature trees, small young trees, and understory vegetation, the SfM point clouds should be divided into three layers based on the heights of different layers. The processing of the two overstory layers is similar to that of the overstory layer in the BAPS method.
6. Conclusions
Emerging UAV-based centimetric resolution remote sensing techniques advanced our ability to finely quantify forest component structures. In this study, we proposed a method named back-projection of 3D point cloud onto superpixel-segmented image (BAPS) to estimate forest overstory and understory vegetation cover from low-cost UAV-based RGB imagery as an alternative to expensive LiDAR sensors. The method integrates 3D point cloud and 2D superpixel segmentation to discriminate overstory and understory layers. This method provided overstory crown cover (OCC) and understory vegetation cover (UVC) estimations comparable with those of commonly used methods (canopy height model (CHM) and supervised classification (SC)) and in situ reference data with an RMSE of less than 0.12. Our results confirmed the capability of low-cost UAV systems in 3D forest monitoring and ecosystem management. The results also encourage the further estimation of ecological variables of two-layer forest communities.
Author Contributions
L.L., J.C., and X.M. designed and conceptualized the research. L.L. and J.C. conducted field campaigns and data processing and analyzed the data. L.L. prepared the manuscript. X.M., D.X., W.Z., and G.Y. supervised the study and edited the manuscript. W.L. participated in field experiments and data processing. All authors have read and agreed to the published version of the manuscript.
Funding
This work was partially funded by the General Program and Key R&D Program of Natural Science Foundation of China (grant no. 41871230), partially supported by the program (grant no. 04-Y30B01-9001-18/20-3-1), and partially supported by the Open Fund of State Key Laboratory of Remote Sensing Science (grant no. OFSLRSS201920). The China Scholarship Council also offered funding for this study (grant no. 201706040156).
Acknowledgments
The authors thank the manager of Saihanba National Forest Park for providing available plantation plots across the landscape region.
Conflicts of Interest
The authors declare no conflicts of interest. The founding sponsors had no role in the design of the study; in the collection, analyses, or interpretation of data; in the writing of the manuscript; and in the decision to publish the results.
References
- Ryu, Y.; Lee, G.; Jeon, S.; Song, Y.; Kimm, H. Monitoring multi-layer canopy spring phenology of temperate deciduous and evergreen forests using low-cost spectral sensors. Remote Sens. Environ. 2014, 149, 227–238. [Google Scholar] [CrossRef]
- Pisek, J. Forest Background. Compr. Remote Sens. 2018, 78–103. [Google Scholar]
- Campbell, M.J.; Dennison, P.E.; Hudak, A.T.; Parham, L.M.; Butler, B.W. Quantifying understory vegetation density using small-footprint airborne lidar. Remote Sens. Environ. 2018, 215, 330–342. [Google Scholar] [CrossRef]
- Pisek, J.; Chen, J.M.; Miller, J.R.; Freemantle, J.R.; Peltoniemi, J.I.; Simic, A. Mapping Forest Background Reflectance in a Boreal Region Using Multiangle Compact Airborne Spectrographic Imager Data. IEEE Trans. Geosci. Remote Sens. 2010, 48, 499–510. [Google Scholar] [CrossRef]
- Baldocchi, D.D.; Xu, L.; Kiang, N. How plant functional-type, weather, seasonal drought, and soil physical properties alter water and energy fluxes of an oak–grass savanna and an annual grassland. Agric. For. Meteorol. 2004, 123, 13–39. [Google Scholar] [CrossRef] [Green Version]
- Wang, T.J.; Skidmore, A.K.; Toxopeus, A.G. Improved understorey bamboo cover mapping using a novel hybrid neural network and expert system. Int. J. Remote Sens. 2009, 30, 965–981. [Google Scholar] [CrossRef]
- Morsdorf, F.; Mårell, A.; Koetz, B.; Cassagne, N.; Pimont, F.; Rigolot, E.; Allgöwer, B. Discrimination of vegetation strata in a multi-layered Mediterranean forest ecosystem using height and intensity information derived from airborne laser scanning. Remote Sens. Environ. 2010, 114, 1403–1415. [Google Scholar] [CrossRef] [Green Version]
- Qiao, Y.; Miao, S.; Silva, L.C.R.; Horwath, W.R. Understory species regulate litter decomposition and accumulation of C and N in forest soils: A long-term dual-isotope experiment. For. Ecol. Manage. 2014, 329, 318–327. [Google Scholar] [CrossRef]
- Tuanmu, M.-N.; Viña, A.; Bearer, S.; Xu, W.; Ouyang, Z.; Zhang, H.; Liu, J. Mapping understory vegetation using phenological characteristics derived from remotely sensed data. Remote Sens. Environ. 2010, 114, 1833–1844. [Google Scholar] [CrossRef]
- Bartemucci, P.; Messier, C.; Canham, C.D. Overstory influences on light attenuation patterns and understory plant community diversity and composition in southern boreal forests of Quebec. Can. J. For. Res. 2006, 36, 2065–2079. [Google Scholar] [CrossRef] [Green Version]
- Tang, H.; Ganguly, S.; Zhang, G.; Hofton, M.A.; Nelson, R.F.; Dubayah, R. Characterizing leaf area index (LAI) and vertical foliage profile (VFP) over the United States. Biogeosciences 2016, 13, 239–252. [Google Scholar] [CrossRef] [Green Version]
- Baret, F.; Weiss, M.; Lacaze, R.; Camacho, F.; Makhmara, H.; Pacholcyzk, P.; Smets, B. GEOV1: LAI and FAPAR essential climate variables and FCOVER global time series capitalizing over existing products. Part1: Principles of development and production. Remote Sens. Environ. 2013, 137, 299–309. [Google Scholar] [CrossRef]
- Mu, X.; Song, W.; Gao, Z.; McVicar, T.R.; Donohue, R.J.; Yan, G. Fractional vegetation cover estimation by using multi-angle vegetation index. Remote Sens. Environ. 2018, 216, 44–56. [Google Scholar] [CrossRef]
- Yan, G.; Li, L.; Coy, A.; Mu, X.; Chen, S.; Xie, D.; Zhang, W.; Shen, Q.; Zhou, H. Improving the estimation of fractional vegetation cover from UAV RGB imagery by colour unmixing. ISPRS J. Photogramm. Remote Sens. 2019, 158, 23–34. [Google Scholar] [CrossRef]
- Liu, Y.; Liu, R.; Pisek, J.; Chen, J.M. Separating overstory and understory leaf area indices for global needleleaf and deciduous broadleaf forests by fusion of MODIS and MISR data. Biogeosciences 2017, 14, 1093–1110. [Google Scholar] [CrossRef] [Green Version]
- Eriksson, H.M.; Eklundh, L.; Kuusk, A.; Nilson, T. Impact of understory vegetation on forest canopy reflectance and remotely sensed LAI estimates. Remote Sens. Environ. 2006, 103, 408–418. [Google Scholar] [CrossRef]
- Macfarlane, C.; Ogden, G.N. Automated estimation of foliage cover in forest understorey from digital nadir images. Methods Ecol. Evol. 2012, 3, 405–415. [Google Scholar] [CrossRef]
- Hwang, Y.; Ryu, Y.; Kimm, H.; Jiang, C.; Lang, M.; Macfarlane, C.; Sonnentag, O. Correction for light scattering combined with sub-pixel classification improves estimation of gap fraction from digital cover photography. Agric. For. Meteorol. 2016, 222, 32–44. [Google Scholar] [CrossRef] [Green Version]
- Macfarlane, C. Classification method of mixed pixels does not affect canopy metrics from digital images of forest overstorey. Agric. For. Meteorol. 2011, 151, 833–840. [Google Scholar] [CrossRef]
- Song, W.; Mu, X.; Ruan, G.; Gao, Z.; Li, L.; Yan, G. Estimating fractional vegetation cover and the vegetation index of bare soil and highly dense vegetation with a physically based method. Int. J. Appl. Earth Obs. Geoinf. 2017, 58, 168–176. [Google Scholar] [CrossRef]
- Wing, B.M.; Ritchie, M.W.; Boston, K.; Cohen, W.B.; Gitelman, A.; Olsen, M.J. Prediction of understory vegetation cover with airborne lidar in an interior ponderosa pine forest. Remote Sens. Environ. 2012, 124, 730–741. [Google Scholar] [CrossRef]
- Marsden, S.J.; Fielding, A.H.; Mead, C.; Hussin, M.Z. A technique for measuring the density and complexity of understorey vegetation in tropical forests. For. Ecol. Manage. 2002, 165, 117–123. [Google Scholar] [CrossRef]
- Li, L.; Yan, G.; Mu, X.; Liu, S.; Chen, Y.; Yan, K.; Luo, J.; Song, W. Estimation of fractional vegetation cover using mean-based spectral unmixing method. In Proceedings of the 2017 IEEE International Geoscience and Remote Sensing Symposium (IGARSS), Fort Worth, TX, USA, 23–28 July 2017; pp. 3178–3180. [Google Scholar]
- Cunliffe, A.M.; Brazier, R.E.; Anderson, K. Ultra-fine grain landscape-scale quantification of dryland vegetation structure with drone-acquired structure-from-motion photogrammetry. Remote Sens. Environ. 2016, 183, 129–143. [Google Scholar] [CrossRef] [Green Version]
- Chianucci, F.; Disperati, L.; Guzzi, D.; Bianchini, D.; Nardino, V.; Lastri, C.; Rindinella, A.; Corona, P. Estimation of canopy attributes in beech forests using true colour digital images from a small fixed-wing UAV. Int. J. Appl. Earth Obs. Geoinf. 2016, 47, 60–68. [Google Scholar] [CrossRef] [Green Version]
- Dandois, J.P.; Ellis, E.C. High spatial resolution three-dimensional mapping of vegetation spectral dynamics using computer vision. Remote Sens. Environ. 2013, 136, 259–276. [Google Scholar] [CrossRef] [Green Version]
- Sun, Z.; Liu, L.; Peng, S.; Peñuelas, J.; Zeng, H.; Piao, S. Age-Related Modulation of the Nitrogen Resorption Efficiency Response to Growth Requirements and Soil Nitrogen Availability in a Temperate Pine Plantation. Ecosystems 2016, 19, 698–709. [Google Scholar] [CrossRef] [Green Version]
- Chianucci, F.; Cutini, A.; Corona, P.; Puletti, N. Estimation of leaf area index in understory deciduous trees using digital photography. Agric. For. Meteorol. 2014, 198, 259–264. [Google Scholar] [CrossRef] [Green Version]
- Ryu, Y.; Verfaillie, J.; Macfarlane, C.; Kobayashi, H.; Sonnentag, O.; Vargas, R.; Ma, S.; Baldocchi, D.D. Continuous observation of tree leaf area index at ecosystem scale using upward-pointing digital cameras. Remote Sens. Environ. 2012, 126, 116–125. [Google Scholar] [CrossRef]
- Song, W.; Mu, X.; Yan, G.; Huang, S. Extracting the green fractional vegetation cover from digital images using a shadow-resistant algorithm (SHAR-LABFVC). Remote Sens. 2015, 7, 10425–10443. [Google Scholar] [CrossRef] [Green Version]
- Li, L.; Mu, X.; Macfarlane, C.; Song, W.; Chen, J.; Yan, K.; Yan, G. A half-Gaussian fitting method for estimating fractional vegetation cover of corn crops using unmanned aerial vehicle images. Agric. For. Meteorol. 2018, 262, 379–390. [Google Scholar] [CrossRef]
- Achanta, R.; Shaji, A.; Smith, K.; Lucchi, A.; Fua, P.; Süsstrunk, S. SLIC Superpixels Compared to State-of-the-Art Superpixel Methods. IEEE Trans. Pattern Anal. Mach. Intell. 2012, 34, 2274–2282. [Google Scholar] [CrossRef] [Green Version]
- Edelsbrunner, H.; Kirkpatrick, D.; Seidel, R. On the shape of a set of points in the plane. IEEE Trans. Inf. Theory 1983, 29, 551–559. [Google Scholar] [CrossRef] [Green Version]
- Liu, Y.; Mu, X.; Wang, H.; Yan, G. A novel method for extracting green fractional vegetation cover from digital images. J. Veg. Sci. 2012, 23, 406–418. [Google Scholar] [CrossRef]
- Sankey, T.; Donager, J.; McVay, J.; Sankey, J.B. UAV lidar and hyperspectral fusion for forest monitoring in the southwestern USA. Remote Sens. Environ. 2017, 195, 30–43. [Google Scholar] [CrossRef]
- Zhang, W.; Qi, J.; Wan, P.; Wang, H.; Xie, D.; Wang, X.; Yan, G.; Zhang, W.; Qi, J.; Wan, P.; et al. An Easy-to-Use Airborne LiDAR Data Filtering Method Based on Cloth Simulation. Remote Sens. 2016, 8, 501. [Google Scholar] [CrossRef]
- Hillman, S.; Wallace, L.; Reinke, K.; Hally, B.; Jones, S.; Saldias, D.S. A Method for Validating the Structural Completeness of Understory Vegetation Models Captured with 3D Remote Sensing. Remote Sens. 2019, 11, 2118. [Google Scholar] [CrossRef] [Green Version]
- Tang, H.; Song, X.-P.; Zhao, F.A.; Strahler, A.H.; Schaaf, C.L.; Goetz, S.; Huang, C.; Hansen, M.C.; Dubayah, R. Definition and measurement of tree cover: A comparative analysis of field-, lidar- and landsat-based tree cover estimations in the Sierra national forests, USA. Agric. For. Meteorol. 2019, 268, 258–268. [Google Scholar] [CrossRef]
- Peltoniemi, J.I.; Kaasalainen, S.; Näränen, J.; Rautiainen, M.; Stenberg, P.; Smolander, H.; Smolander, S.; Voipio, P. BRDF measurement of understory vegetation in pine forests: dwarf shrubs, lichen, and moss. Remote Sens. Environ. 2005, 94, 343–354. [Google Scholar] [CrossRef]
- Rautiainen, M. Retrieval of leaf area index for a coniferous forest by inverting a forest reflectance model. Remote Sens. Environ. 2005, 99, 295–303. [Google Scholar] [CrossRef]
Figure 1.
Depiction of overstory (>2 m) and understory (0–2 m) components. The surveyor collects upward- and downward-looking digital images. Several components of this figure originated from a free high-quality picture library website (https://www.pikpng.com/).
Figure 1.
Depiction of overstory (>2 m) and understory (0–2 m) components. The surveyor collects upward- and downward-looking digital images. Several components of this figure originated from a free high-quality picture library website (https://www.pikpng.com/).

Figure 2.
(a) Study area in the Saihanba National Forest Park (SNFP) and geographic locations of study plots marked as white stars. (b) The perspective views of all eight forest plots are shown.
Figure 2.
(a) Study area in the Saihanba National Forest Park (SNFP) and geographic locations of study plots marked as white stars. (b) The perspective views of all eight forest plots are shown.

Figure 3.
Sampling positions (circles) along diagonals of a plot in field measurements. The gray shapes roughly mark the crowns of trees.
Figure 3.
Sampling positions (circles) along diagonals of a plot in field measurements. The gray shapes roughly mark the crowns of trees.

Figure 4.
Workflow of back-projection of three-dimensional (3D) point cloud onto superpixel-segmented image method (BAPS) in estimating overstory crown cover (OCC) and understory vegetation cover (UVC) from unmanned aerial vehicle (UAV)-based red–green–blue (RGB) imagery.
Figure 4.
Workflow of back-projection of three-dimensional (3D) point cloud onto superpixel-segmented image method (BAPS) in estimating overstory crown cover (OCC) and understory vegetation cover (UVC) from unmanned aerial vehicle (UAV)-based red–green–blue (RGB) imagery.

Figure 5.
Visualization of overstory crown pixel determination. (a) Original UAV-based RGB image. (b) Back-projection of overstory points (cyan dots) onto the original image. (c) Determination ratio map for determining the class of superpixels. (d) Classification map of superpixels.
Figure 5.
Visualization of overstory crown pixel determination. (a) Original UAV-based RGB image. (b) Back-projection of overstory points (cyan dots) onto the original image. (c) Determination ratio map for determining the class of superpixels. (d) Classification map of superpixels.

Figure 6.
Extraction of understory pixels. (a) Binary mask derived from a classification map of superpixels, where white areas refer to crown and crown borders. (b) Morphological dilation for binary mask overlapping on the RGB image, where the light-green areas refer to dilated overstory crown areas. (c) Extraction of understory pixels. Overstory pixels and buffer pixels are masked with black color. (d) Image segmentation of understory pixels using a half-Gaussian fitting (HAGFVC) algorithm.

Figure 7.
Overstory crown areas extracted using different methods. (a) BAPS method for Plot 1, (b) canopy height model (CHM) for Plot 1, (c) BAPS method for Plot 2, and (d) CHM for Plot 2. The crown areas are highlighted with light-green color in subfigures (a) and (c).
Figure 7.
Overstory crown areas extracted using different methods. (a) BAPS method for Plot 1, (b) canopy height model (CHM) for Plot 1, (c) BAPS method for Plot 2, and (d) CHM for Plot 2. The crown areas are highlighted with light-green color in subfigures (a) and (c).

Figure 8.
Comparison of BAPS- and CHM-estimated OCC for all forest plots with three tree species.

Figure 9.
Comparison between BAPS- and supervised classification (SC)-estimated UVCs. (a) Histogram of the differences in UVC obtained by using the two methods from 36 randomly selected UAV-based images. (b) Scatter plot of BAPS- and SC-estimated UVC for all plots.
Figure 9.
Comparison between BAPS- and supervised classification (SC)-estimated UVCs. (a) Histogram of the differences in UVC obtained by using the two methods from 36 randomly selected UAV-based images. (b) Scatter plot of BAPS- and SC-estimated UVC for all plots.

Figure 10.
Comparison of (a) OCC and (b) UVC between in situ observation and estimation from BAPS, CHM, and SC.
Figure 10.
Comparison of (a) OCC and (b) UVC between in situ observation and estimation from BAPS, CHM, and SC.


Table 1.
Overview of study plots and in situ measurements of overstory crown cover (OCC) and understory vegetation cover (UVC). UAV—unmanned aerial vehicle.
Table 1.
Overview of study plots and in situ measurements of overstory crown cover (OCC) and understory vegetation cover (UVC). UAV—unmanned aerial vehicle.
| Plot | Tree Type | Acquisition Time (Ground and UAV) | Resolution UAV (cm) | Reference Value | |
|---|---|---|---|---|---|
| UVC | OCC | ||||
| Plot_1 | Larch | 16 May 2018 | 2 | 0.066 | 0.534 |
| 21 June 2019 | 1 | 0.589 | 0.706 | ||
| Plot_2 | Larch | 20 June 2019 | 1 | 0.422 | 0.606 |
| Plot_3 | Mongolian pine | 9 May 2019 | 5 | 0.009 | 0.502 |
| 21 June 2019 | 1 | 0.209 | 0.701 | ||
| Plot_4 | Larch | 13 September 2017 | 2 | 0.432 | 0.594 |
| Plot_5 | Birch | 13 September 2017 | 2 | 0.393 | 0.698 |
| Plot_6 | Larch | 13 September 2017 | 2 | 0.419 | 0.542 |
| Plot_7 | Larch | 14 September 2017 | 2 | 0.338 | 0.648 |
| Plot_8 | Larch | 14 September 2017 | 2 | 0.105 | 0.677 |
Table 2.
Overview of the accuracy of different methods for overstory crown cover (OCC) andunderstory vegetation cover (UVC). In the regression equations, x refers to in situ reference value, and y refers to the estimates by different methods. BAPS—back-projection of three-dimensional (3D) point cloud onto superpixel-segmented image; CHM—canopy height model; SC—supervised classification; RMSE—root-mean-square error.
| Variable | Method | RMSE | Bias | Regression Equation | R2 |
|---|---|---|---|---|---|
| OCC | BAPS | 0.0704 | 0.0433 | y = 1.0640x + 0.0035 | 0.6631 |
| CHM | 0.1180 | 0.1015 | y = 0.8357x + 0.2035 | 0.5169 | |
| UVC | BAPS | 0.1144 | 0.0405 | y = 1.1061x + 0.0088 | 0.7825 |
| SC | 0.0435 | 0.0375 | y = 1.0757x + 0.0151 | 0.9923 |
© 2020 by the authors. Licensee MDPI, Basel, Switzerland. This article is an open access article distributed under the terms and conditions of the Creative Commons Attribution (CC BY) license (http://creativecommons.org/licenses/by/4.0/).
Share and Cite
MDPI and ACS Style
Li, L.; Chen, J.; Mu, X.; Li, W.; Yan, G.; Xie, D.; Zhang, W. Quantifying Understory and Overstory Vegetation Cover Using UAV-Based RGB Imagery in Forest Plantation. Remote Sens. 2020, 12, 298. https://doi.org/10.3390/rs12020298
AMA Style
Li L, Chen J, Mu X, Li W, Yan G, Xie D, Zhang W. Quantifying Understory and Overstory Vegetation Cover Using UAV-Based RGB Imagery in Forest Plantation. Remote Sensing. 2020; 12(2):298. https://doi.org/10.3390/rs12020298
Chicago/Turabian StyleLi, Linyuan, Jun Chen, Xihan Mu, Weihua Li, Guangjian Yan, Donghui Xie, and Wuming Zhang. 2020. "Quantifying Understory and Overstory Vegetation Cover Using UAV-Based RGB Imagery in Forest Plantation" Remote Sensing 12, no. 2: 298. https://doi.org/10.3390/rs12020298
Note that from the first issue of 2016, this journal uses article numbers instead of page numbers. See further details here.