Reliable and Efficient UAV Image Matching via Geometric Constraints Structured by Delaunay Triangulation


1
School of Computer Science, China University of Geosciences, Wuhan 430074, China
2
Hubei Key Laboratory of Intelligent Geo-Information Processing, China University of Geosciences, Wuhan 430074, China
3
State Key Laboratory of Information Engineering in Surveying, Mapping and Remote Sensing, Wuhan University, Wuhan 430072, China
4
Collaborative Innovation Center of Geospatial Technology, Wuhan University, Wuhan 430072, China
5
Provincial Key Laboratory of Geo-Information Engineering in Surveying, Mapping and Remote Sensing, Hunan University of Science and Technology, Xiangtan 411201, China
*
Author to whom correspondence should be addressed.
Remote Sens. 2020, 12(20), 3390; https://doi.org/10.3390/rs12203390
Submission received: 15 September 2020
/
Revised: 2 October 2020
/
Accepted: 13 October 2020
/
Published: 16 October 2020
(This article belongs to the Special Issue Latest Developments in 3D Mapping with Unmanned Aerial Vehicles)
Abstract
:Outlier removal is a crucial step in local feature-based unmanned aerial vehicle (UAV) image matching. Inspired by our previous work, this paper proposes a method for reliable and efficient outlier removal in UAV image matching. The inputs of the method are only two images without any other auxiliary data. The core idea is to design local geometric constraints within the neighboring structure via the Delaunay triangulation and use a two-stage method for outlier removal and match refinement. In the filter stage, initial matches are first organized as the Delaunay triangulation (DT) and its corresponding graph, and their dissimilarity scores are computed from the affine-invariant spatial angular order (SAO), which is used to achieve hierarchical outlier removal. In addition, by using the triangle constraint between the refined Delaunay triangulation and its corresponding graph, missed inliers are resumed from match expansion. In the verification stage, retained matches are refined using the RANSAC-based global geometric constraint. Therefore, the two-stage algorithm is termed DTSAO-RANSAC. Finally, using four datasets, DTSAO-RANSAC is comprehensively analyzed and compared with other methods in feature matching and image orientation tests. The experimental results demonstrate that compared with the LO-RANSAC algorithm, DTSAO-RANSAC can achieve efficient outlier removal with speedup ratios ranging from 4 to 16 and, it can provide reliable matching results for image orientation of UAV datasets.
1. Introduction
In recent years, Unmanned Aerial Vehicles (UAVs) have gained extensive attention in the fields of photogrammetry and remote sensing due to their flexible data acquisition, easiness of use, and low economic costs. UAVs have been utilized in various applications, including transmission line inspection [1,2], agricultural management [3], and cultural heritage documentation [4]. Image orientation is a prerequisite for their successful application, and reliable and efficient image matching ensures the precision of image orientation and the instantaneity of their usage, which aims to find reliable and accurate correspondences from multiple images with overlap regions [5].
In the literature, image matching methods can be divided into two groups, i.e., area-based methods and feature-based methods [6]. For the former, pixel intensity values are used to compute the similarity scores of correspondences, and widely used similarity measurements include normalized cross-correlation (NCC), mutual information (MI), and least-square matching (LSM) [7]. As area-based methods are sensitive to scale and viewpoint changes, recent years have seen the explosive development of feature-based methods, which describe neighboring regions of feature points with descriptor vectors and find matches by searching for point pairs with the smallest Euclidean distances between two descriptor sets. As descriptors are computed from local patches of features, these methods are also known as local feature-based matching. Generally, local feature-based matching consists of three major steps: (1) Feature extraction: For individual images, feature points with their descriptor vectors are extracted and computed from image patches, such as corners, blobs, and regions. (2) Feature matching: For each image pairs, candidate matches are obtained by searching feature pairs with the smallest Euclidean distance from two descriptor sets. (3) Outlier removal: For each initial match sets, geometric or photometric constraints are exploited to eliminate false matches. The first and second steps generate initial matches, and different solutions have been designed for varying scenes [8,9,10,11,12]. Initial matches, however, are inevitably contaminated by outliers due to the complex photometric and geometric distortions between image pairs and the only usage of local appearances for feature description. Therefore, outlier removal plays a important role in local feature-based matching, and this study would focus on this step.
According to the types of constraints, outlier removal methods can be classified as two groups, i.e., methods based on geometric and photometric constraints. For the former group, the Random Sample Consensus (RANSAC) [13] method has been widely used for model estimation because of its robustness to outliers, and it can cooperate with the fundamental matrix estimation to achieve global geometric constraint. Its efficiency, however, decreases dramatically with the increase of outlier ratios. To cope with this situation, many variants of the RANSAC have been designed from aspects of hypothesis generation and model verification [14]. In contrast to the explicit model estimation used in the RANSAC, methods based on the idea of Hough transformation (HT) can achieve an implicit estimation of transformation parameters [15]. Due to the inconsistent voting of false matches and the direct voting scheme, HT can tolerate higher outlier ratios and achieve higher efficiency for outlier removal [16,17,18]. For the above-mentioned methods, a predefined transformation model is required, and thus they are termed parametric methods as transformation parameters are estimated in either explicit or implicit manners. For feature matching of image pairs whose transformation cannot be simply modeled, nonparametric methods are designed by exploiting spatial relationships of feature points. Graph matching is the extensively used nonparametric technique for outlier removal, such as the Graph Transformation Matching (GTM) [19] and the Weighted Graph Transformation Matching (WGTM) [20]. Considering the consistent motion of initial matches, Vector Field Consensus (VFC) is exploited to establish the geometric constraint used for outlier removal [21]. Compared with these global geometric constraints, local geometric constraints can fit local deformations well and tolerate a large fraction of outliers. For outlier removal, existing solutions are usually used in either a pre-filter step to increase inlier ratios [22] or a post-filter step to refine final matches [23]. In addition, some research attempts to achieve affine-invariant constraints, including the Spatial Angular Order (SAO) constraint [24] and the Triangle Area Ratio (TAR) constraint [25].
For methods using photometric constraints, feature descriptors can be considered as the first-order photometric constraint as only local patches around feature points are used for similarity computation. This is the main reason causing outliers in initial matches. To achieve further refinement of initial matches, high-order photometric constraints should be exploited. Obviously, line descriptors that describe a line-strip region connecting two feature points can be considered as second-order photometric constraints, e.g., the mean-standard deviation line descriptor (MSLD) [26] and the multi-scale line band descriptor (LBD) [27]. Among the reported researches, Liu et al. [28] proposed a virtual line descriptor (VLD) to describe the local region of an image strip between two feature points, and outliers are removed by using a semi-local matching method, termed K-VLD. Because of their high discriminability, photometric constraints are modeled as local constraints and cooperate with local geometric constraints to achieve reliable outlier removal. In the research of Li et al. [29], outlier removal was achieved by the combination of a photometric constraint based on support-line voting and a geometric constraint based on the affine-invariant ratio. Similarly, a region descriptor, termed the 4FP-Structure, was designed by exploiting a SIFT-like line descriptor [30]. For all these above-mentioned methods, constructing a neighboring structure is a prerequisite to implement both local geometric and photometric constraints. To address the neighbor searching issue caused by the KNN ((K-nearest neighbors)) algorithm, Jiang et al. [31] proposed to use the Delaunay triangulation for organizing randomly matched points and designed a reliable image matching algorithm that combines photometric and geometric constraints in the neighboring structure of the Delaunay triangulation.
Consequently, the combination of local geometric and photometric constraints can achieve reliable outlier removal for both rigid and non-rigid images. However, for UAV image matching the efficiency issue is not considered and addressed in these methods. Although photometric constraints are usually achieved in a local manner, the SIFT-like strategy for computing line descriptors would cause high time consumption. This can be explained in two aspects. On the one hand, image pyramids should be constructed to achieve the scale-invariant property, such as the LBD and VLD line descriptors; on the other hand, SIFT-like descriptors are computed for all line strips that form the neighboring structure of one corresponding point. For UAV images with high resolutions, these two steps would cause extremely high time costs compared with other steps in the pipeline of local feature-based matching [32].
Inspired by our previous work [31,33], this study aims to design a reliable and efficient outlier removal method for UAV images. The main contribution of this paper can be summarized as (1) a reliable and efficient outlier removal method. For building the reliable neighboring structure, random feature points of initial matches are first organized by using the Delaunay triangulation and its corresponding graph; and a local geometric constraint based on the SAO is designed to achieve hierarchical outlier removal; and (2) the comparison and analysis of the proposed algorithm. By using four datasets, including one benchmark and three oblique UAV datasets, the performance of the proposed algorithm has been comprehensively compared with other methods in both feature matching and image orientation tests.
This paper is organized as follows. Section 2 describes the motivation for the design of the proposed method. Section 3 presents the spatial angular order based geometric constraint and the triangulation constrained match expansion. Comprehensive analysis and comparison of the proposed method in feature matching and bundle adjustment tests are presented in Section 4. Finally, Section 5 presents the discussion for the proposed algorithm, and Section 6 presents the conclusions of this work.
2. Principle for the Design of the Proposed Algorithm
The purpose of the proposed algorithm is to achieve reliable and efficient feature matching for UAV images. Except for the precision of image matching, the efficiency and reliability should be considered and addressed for the design of the proposed matching algorithm to processing large-scale datasets [34,35]. This can be seen from three aspects: First, the number of UAV images is relatively larger compared with traditional aerial images, and high combinational complexity is observed even using a carefully designed match pair selection method [36]. Second, for UAV images repetitive patterns and building occlusions would cause high outlier ratios in initial matches and seriously degenerate the performance of RANSAC. Third, for initial matches with high outlier ratios, outliers with high possibility must be removed earlier than other matches to avoid their influence on the decision of inliers. For these three issues, corresponding solutions have been proposed in our previous studies and are listed as follows.
- For the first issue, match pair selection before feature matching can be an efficient way to decrease the number of image pairs. In our previous work [36], the rough POS of images and mean elevation of test sites have been utilized to compute the footprints of images and determine overlapped match pairs. Compared with exhaustive matching strategy, match pair selection can dramatically decrease the number of match pairs and reduce the total time costs consumed in the stage of feature matching. However, as demonstrated in the tests [36], the number of selected match pairs is still very large when only using the overlap criterion, such as 18,283 match pairs retained for the UAV dataset of 750 images. Thus, the efficiency of feature matching for one image pair should also be addressed, which relates to the second and third issues for image matching.
- For the second issue, an efficient pre-filter step can be designed to remove obvious outliers and increase inlier ratios of initial matches. In our previous work [33], a two-stage geometric verification algorithm was designed for outlier removal of UAV images. In the filtering stage, obvious outliers are removed by using a local consistency analysis of their projected motions, which can increase inlier ratios of initial matches; in the verification stage, retained matches are refined based on the global geometric constraint achieved by fundamental matrix estimation. This method can be utilized to address the second issue. This method, however, depends on extra auxiliary information, i.e., rough POS of images and mean elevation.
- For the third issue, Jiang et al. [31] designed an image matching algorithm for both rigid and non-rigid images, in which a photometric constraint based on the VLD line descriptor and a geometric constraint by using the SAO is implemented by using neighboring structures deduced from the Delaunay triangulation. Initial matches are sorted according to their dissimilarity scores computed using these two constraints, and outlier removal is conducted in a hierarchical manner where matches with high dissimilarity scores are first removed. However, due to high resolutions and large dimensions of UAV images, this method causes very high time costs to achieve scale-invariant photometric constraints.
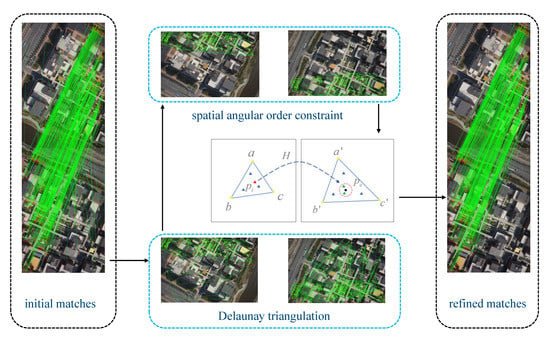
Combining the hierarchical outlier removal framework [31] and the two-stage match refinement [33], this study aims to design a UAV image matching algorithm considering both the reliability and efficiency. The overall workflow of the proposed algorithm is shown in Figure 1. The input of the proposed algorithm is only one image pair without any other auxiliary data sources. The overall workflow is divided into two major parts as labeled in Figure 1. In the first part, initial matches are obtained according to the workflow of local feature-based image matching, and two strategies, i.e., cross-check and ratio-test [15], are adopted to remove false matches. In the second part, a reliable and efficient algorithm is designed to remove remaining outliers from initial matches, which is achieved by using the two-stage strategy. Similar to Jiang et al. [31], initial matches are first organized by using the Delaunay triangulation and its corresponding graph. Obvious outliers are then removed hierarchically using the SAO-based geometric constraint in the filtering stage, which is followed by match expansion to resume as many as missed inliers under the triangle constraint. In the verification stage, because of the weak discriminability of the SAO constraint, the RANSAC algorithm with the fundamental matrix estimation is used as the global geometric constraint to refine the final matches. In this study, the proposed algorithm, namely, DTSAO-RANSAC, is described in the following sections.
3. UAV Image Matching Based on DTSAO-RANSAC
In this study, only local geometric constraints are used to achieve outlier removal in the filtering stage because of two reasons. First, local geometric constraints can be implemented with extremely high efficiency compared with existing photometric constraints. Second, the aim of the filtering stage is to remove obvious outliers and increase inliers ratios of initial matches, which can be achieved using the non-rigorous local geometric constraints. In addition, the precision of final matches can be refined by the subsequent verification stage with rigorous geometric constraints.
3.1. Delaunay Triangulation from Initial Matches
Neighboring structure construction is a prerequisite to creating local geometric constraints. K-nearest neighbor (KNN) graphs, implemented using the KNN algorithm [37], represent a commonly used method. However, this strategy has two problems [31]: (1) The number of neighbors is difficult to determine for varying sets of initial matches, and (2) the even distribution of neighboring points is difficult to guarantee. Due to the properties of dynamic generation and good geometry, the Delaunay triangulation is used to organize randomly located feature points of initial candidate matches. This structure limits insertion and deletion operations to local region updating and maximize the minimum angle of all triangles to avoid skinny triangles. Thus, the Delaunay triangulation enables fast updating for frequent vertex deletion and adding and constructs good neighboring structures to achieve local geometric constraints [31].
The Delaunay triangulation can be considered as a special graph under the empty circle property. Suppose that the Delaunay triangulation is represented as a graph , where V and E stand for the vertex and edge sets, respectively; P and Q represent feature points of image pair , respectively; stands for initial matches with and . Therefore, the Delaunay triangulation is created from feature points of image : one feature point defines a vertex , such that , and any triangle consisted of three edges in E fulfills the empty circle property. According to the corresponding relationships of initial matches, the corresponding graph of can also be created. Similarly, a Delaunay triangulation can be created using feature points from image with its corresponding graph using feature points from image . For simplification, and are respectively defined as the Delaunay triangulation and its corresponding graph in the following sections.
Figure 2 illustrates the Delaunay triangulation and its corresponding graph generated from initial matches, where Figure 2a represent initial matches with inliers and outliers rendered by green and blue lines, respectively; Figure 2b,c indicates the Delaunay triangulation and its corresponding graph, respectively. It is clearly shown that for each vertex, its incident neighboring vertices locate evenly around the target vertex in the angular direction. In addition, as shown in Figure 2b, the Delaunay triangulation divides the image plane into small patches, and a majority of these patches are non-skinny triangles, which can facilitate the calculation of transformation parameters to its corresponding triangle in Figure 2c. These properties would be used to achieve triangle constrained match expansion.
3.2. Geometric Constraints Structured by Delaunay Triangulation
In this section, two local geometric constraints are used to remove obvious outliers and resume missed true matches in the filtering stage of the DTSAO-RANSAC. The first local geometric constraint is achieved by using the affine-invariant spatial angular order (SAO), which assumes that under the local polar coordinate system with the pole centered on the target vertex and the polar axis in the horizontal direction, the angular order of neighboring points remains invariant under a similarity or an affine transformation [24]. By using the formed Delaunay triangulation, incident vertices are utilized to form the neighboring structure for each target vertex, and a dissimilarity score can be computed using the difference between their spatial angular orders. The dissimilarity score is used to measure the possibility of one match being an outlier, and outlier removal can be conducted hierarchically.
The following steps are executed to calculate the dissimilarity score for one target vertex in graph . (1) An incident neighbor list is determined based on the connection of graph . (2) For each incident neighbor in , its polar angle is computed in the polar coordinate system. (3) A polar angle list is obtained and sorted anticlockwise according to their polar angles. The angular order of vertex is then constructed using the point number list deduced from list . Similarly, the angular order of the corresponding vertex in graph can be obtained in the same manner. The dissimilarity score of the match is calculated as the mean cyclic edit distance (CED) according to Equation (1),
where N is the incident neighbor number for vertex , and calculates the CED of two angular orders, which is measured by the minimum number of operations to transform one angular order to another. In the context of outlier removal, the dissimilarity score is used to measure the possibility of one match to be an outlier. This is the foundation to achieve outlier removal in a hierarchical manner.
After outlier removal based on the SAO constraints, the second local geometric constraint is used to exploit missed matches. In the matching stage, one feature descriptor from the first image would be compared with all feature descriptors in the second image. This global searching strategy leads to the omission of true matches. On the contrary, the Delaunay triangulation splits the image plane into near-regular triangle patches, which can be used to build reliable transformations between corresponding triangles and restrict the searching space of candidate matches. This is the core idea of triangulation constrained match expansion. In this study, an affine model is used to build the transformation between corresponding triangles because of two reasons. On the one hand, three non-collinear points are sufficient to compute parameters of the affine model; on the other hand, the perspective transformation between two small triangle patches can be approximately modeled as the affine transformation [38].
Figure 3 illustrates the procedure of match expansion based on the Delaunay triangulation. Figure 3a,b represent the left and right image, respectively. For simplification, two corresponding triangles are utilized to describe the pipeline of match expansion, which are indicated by triangles and , respectively. Suppose that feature points inside triangles and are denoted by P and Q, respectively. Match expansion is achieved based on the following procedure.
- Affine transformation estimation. By using the three nonlinear point pairs of the two corresponding triangles, the affine transformation matrix H from the left triangle to the right triangle is estimated.
- Candidate match searching. For one feature point shown as a red triangle on the left image, its predicted location is computed by shown as a black circle in the right image. Feature points inside the dashed red circle with its center and radius r are searched from Q, which are candidate matches of .
- Expanded match determination. Feature point is compared with each candidate feature by computing the SIFT descriptor distance that is defined as the cosine angle of two feature vectors. Finally, the feature pair with the smallest distance is labeled as an expanded match when its distance is not greater than a distance threshold .
3.3. Implementation of the DTSAO-RANSAC Method
Based on the SAO geometric constraint and triangulation constrained match expansion, this study designs and implements a reliable and efficient matching algorithm for UAV images. The hierarchical elimination and left-right checking strategies are integrated into these two geometric constraints. The former strategy is utilized to decrease the influence of false matches on the judgment of true matches; the latter strategy is adopted to eliminate false matches as many as possible [31]. The implementation of the UAV image matching method is described as follows.
- Initial match generation. For the input images, SIFT features are first detected for each image and described using 128-dimensional descriptors, and initial matches are then obtained by searching for the nearest neighbors with the smallest Euclidean distance of SIFT descriptors. Due to the high resolution of UAV images, the SIFTGPU algorithm [39] with hardware acceleration is used for the fast computation of initial matches. Default parameters of the SIFTGPU library are used.
- Delaunay triangulation construction. According to Section 3.1, the Delaunay triangulation and its corresponding graph are constructed using the initial matches. In this study, the two-dimensional triangulation of Computational Geometry Algorithms Library (CGAL) [40] is selected to implement the Delaunay triangulation of the initial matches.
- Outlier removal based on the SAO constraint. For one target vertex in graph , a dissimilarity score is calculated according to Equation (1) after determining two corresponding angular orders; then, a list of dissimilarity scores can be obtained from n vertices in . The list is sorted in descending order of the dissimilarity score. Assume that the vertex corresponding to the first item in the list is denoted as . In this study, outlier removal is iteratively conducted using a hierarchical elimination strategy until the dissimilarity score of is less than a specified threshold : (a) remove the vertex from graph , and set the dissimilarity score of as zero; (b) update the dissimilarity score of all incident neighbors of the vertex , and resort the score list . With the iterative conduction of these two steps, an outlier list is obtained. To remove remaining outliers, a left-right checking strategy that is implemented by exchanging the roles of graphs and is adopted, and another outlier list is obtained. Finally, an initial match is classified as an outlier as long as it belongs to one of the outlier lists and .
- Match expansion based on the triangulation constraint. According to Section 3.2, match expansion is conducted to resume missed true matches. In this study, to achieve the high efficiency in neighboring point searching, feature points from each image are indexed by using the K-nearest-neighbors [37] algorithm. Similar to Step 3, the left-right checking strategy is also used in match expansion. In other words, the point pair is labeled as a true match if and only if and are the nearest neighbors of each other.
- Match refinement based on RANSAC. Retained matches are finally refined based on the rigorous geometric constraint. In this study, the RANSAC method with the estimation of a fundamental matrix using the seven-point algorithm [41] is utilized to refine the final matches.
In the workflow of the proposed algorithm, step 1 represents a classical local feature-based matching solution that is used to generate initial matches; steps 2–4 are combined to achieve outlier removal in the filtering stage, which aims to increase inlier ratios of initial matches and improve the performance of the RANSAC method in step 5. In this study, the workflow of steps 2–4 is termed DTSAO, and steps 2–5 consist of DTSAO-RANSAC as presented in Algorithm 1.
| Algorithm 1 DTSAO-RANSAC |
| Input: n initial candidate matches C Output: final matches
|
4. Experimental Results
In this section, four datasets are used for performance evaluate of the proposed algorithm. First, we analyze the influence of the dissimilarity score threshold on image matching. Second, the robustness to outliers of the proposed algorithm is analyzed in terms of precision and recall. Third, four UAV image pairs are used to analyze the DTSAO algorithm. Finally, by using three oblique UAV datasets, DTSAO-RANSAC is compared with other methods in tests of feature matching and image orientation. In the following tests, the candidate match searching radius r is set as 3 pixels, and the distance threshold for accepting candidate matches is configured as 0.7, as suggested in [38].
4.1. Datasets
The first dataset is the Oxford benchmark [42], as shown in Figure 4. It consists of eight image sequences, and each sequence includes six images with gradually increasing deformations. For the eight sequences, the homograph transformation between the first and one of the other images is given. Thus, for each sequence, five image pairs are created for feature matching with ground-truth data.
The detailed information of the three UAV datasets is presented in Table 1. The first dataset is collected from a residual region that is covered by some low buildings, as shown in Figure 5a. By using a multi-rotor UAV equipped with one Sony ILCE-7R camera of dimensions of 7360 by 4912 pixels, a total number of 157 images are collected with the Ground Sampling Distance (GSD) value of approximately 4.20 cm. The second dataset is located in a suburban area, as shown in Figure 5b. For data acquisition, a multi-rotor UAV equipped with one Sony RX1R camera of dimensions of 6000 by 4000 pixels, and a total number of 320 images of GSD 5.05 cm are collected under the flight height of 165 m. For data acquisition, the pitch and roll angles are set as 25 and −15, respectively. The third dataset is collected from an urban region, as shown in Figure 5b. For this test site, a five-camera oblique photogrammetric system is utilized. It consists of one nadir and four oblique cameras, and the four oblique cameras are rotated 45 with respect to the nadir camera. The imaging system consists of five cameras of dimensions of 6000 by 4000 pixels. By using a multi-rotor UAV, a total number of 750 images are recorded under the flight height of 175 m. The GSD value is approximately 4.27 cm.
4.2. Analysis of the Influence of the Score Threshold
In the DTSAO, the dissimilarity score threshold is used to terminate the hierarchical outlier removal procedure. In this section, dataset 1 is used to analyze its influence on image matching. For performance evaluation, the dissimilarity score threshold is uniformly sampled between 0.1 and 0.9 with an interval value of 0.1, and two criteria, namely, precision and recall, are utilized as measurements. In this section, only DTSAO is executed in feature matching.
Figure 6 presents the statistical results of precision and recall for the eight sequences of dataset 1. Noticeably, for the sequences Graf and Boat the precision and recall are smaller than the others mainly because feature matching fails for the last two image pairs. For each sequence, the average precision and recall are calculated by using the results of five pairs. It is clearly shown that with the increase of the score threshold , the precision of the eight sequences decreases gradually, and the recall has an opposite trend. The main reason is that more matches can surpass the SAO geometric constraint under a high threshold value. The increase ratio of inliers is less than that of outliers. By further analysis of the precision, we can find that (a) the threshold has little influence on precision when it increases from 0.1 to 0.5; (b) the precision decreases when the threshold increases from 0.5 to 0.8; and (c) when the threshold reaches 0.8, the precision becomes stable. These findings can be explained by the increasing ratios of inliers and outliers during these three spans. In the first span, the increasing ratios of inliers and outliers are competitive, which results in a stable precision; in the second span, the increasing ratio of outliers is larger than that of inliers, and the precision starts decreasing; and in the third span, the increasing ratios of inliers and outliers become zero as presented by the stable precision and recall.
To facilitate the selection of an optimal threshold , Figure 7 presents the overall precision and recall for image matching of dataset 1. In this study, the overall precision and recall are computed using the average statistical results of 40 image pairs of eight sequences. It is clearly shown that the precision and recall have an opposite change trend, which is similar to that of each individual sequence, as shown in Figure 6. To make a balance between precision and recall, the optimal value of the threshold is set as 0.6.
4.3. Analysis of the Robustness to Outliers of DTSAO
In this section, we will generate artificially contaminated matches with specified outlier ratios using dataset 1 and analyze the algorithm’s robustness to outliers. Similar to Section 4.2, only DTSAO is executed in feature matching, and the average precision and recall of each sequence are used for performance evaluation.
To prepare test datasets, each image pair of each sequence of dataset 1 is first matched based on the local feature-based matching method. Outliers are separated from inliers according to their transformation errors (greater than five pixels) based on their transformation parameters. Suppose that the numbers of outliers and initial matches are indicated by and N, respectively; the specified outlier ratio is indicated by . Thus, the number of randomly selected point pairs from unmatched feature points can be computed according to Equation (2). In this test, the outlier ratio is uniformly sampled between 0.1 and 0.9 with an interval value of 0.1.
Figure 8 presents the statistical results of precision and recall for the eight sequences in dataset 1, where Figure 8a,b shows the results of precision and recall, respectively. Similarly, for the sequences Graf and Boat, feature matching fails for the last two pairs, which results in relatively lower precision and recall. It is clearly shown that with the increase of the outlier ratio , the precision and recall of all sequences gradually decrease, and the decrease ratio of the recall is faster than that of the precision, which can be observed from the steeper curve as presented in Figure 8b. Except for the Graf and Boat sequences, the precision of the other sequences is greater than 60% even with an outlier ratio of 0.9. The recall, however, is not greater than 40% for almost all sequences. The main reason is that for initial matches with extremely high outlier ratios, inliers rarely exist in the neighboring structure of the target point. This leads to the high dissimilarity score even though the target point belongs to true matches. Thus, high outlier ratios cause low recall. However, some of these abandoned inliers can be resumed from the triangulation constrained match expansion.
To analyze the performance of the hierarchical elimination strategy, we also conduct experiments without the hierarchical elimination strategy. The statistical results of the precision and recall are shown in Figure 9. Similar to the results presented in Figure 8, the precision and recall of all sequences decrease gradually with the increase of outlier ratios. However, two different findings can be observed: (1) The decrease ratios of the precision from the DTSAO without the hierarchical elimination strategy is higher than that of the DTSAO with the hierarchical elimination strategy. This can be deduced by comparing the curve descent ratios between Figure 8a and Figure 9a. (2) The recall from the DTSAO without the hierarchical elimination strategy is higher than that of the DTSAO with the hierarchical elimination strategy. For the former strategy, the recall is larger than 40%, as shown in Figure 9b; however, it is lower than 40% for the latter strategy, as shown in Figure 8b. By analyzing precision and recall defined by Equations (2) and (3), we can conclude that the high recall achieved in Figure 9b is implemented by ignoring more outliers in match results because low precision can be observed in Figure 9a. In conclusion, higher precision is achieved by using the hierarchical elimination strategy.
4.4. Outlier Elimination Based on the DTSAO Algorithm
In this section, four image pairs with different configurations between oblique and nadir images are used for the analysis of the DTSAO method. These four image pairs are selected from dataset 2, which consists of UAV images captured using a nadir-view campaign and a 45 oblique-view campaign. For more details, refer to the work of Jiang et al. [33].
Initial matches are first extracted for the four image pairs by using the SIFTGPU library. Based on the pipeline of local feature-based matching, initial matches of each image pair are obtained and shown in Figure 10, with numbers of 391, 192, 69, and 95 for the four image pairs, respectively. Noticeably, oblique images are geometrically rectified for a better interpretation, where lines of inliers are approximately parallel to each other; lines of outliers intersect others. The matching results reveal that even with the usage of the outlier elimination techniques, i.e., cross-check and ratio-test, a large proportion of false matches exist in initial matches, especially for the third and fourth image pairs with larger perspective deformations. The inlier ratios of the four image pairs are approximately 47.1%, 35.9%, 24.6%, and 27.4%, respectively.
In the first step of the DTSAO, the Delaunay triangulation and its corresponding graph are constructed using feature locations of the initial matches. Figure 11 and Figure 12 show the Delaunay triangulation and its corresponding graph for the image pairs 1 and 3, respectively. It is clearly shown that the Delaunay triangulation can split image planes into near-regular triangles, as presented in Figure 11a and Figure 12a. Because of the existence of outliers, the corresponding graphs do not meet the empty circle properties of the Delaunay triangulation, which can be observed from the intersected edges in Figure 11b and Figure 12b. In the second step of the DTSAO, candidate outliers are gradually detected and removed using the SAO-based geometric constraint. For each vertex of the Delaunay triangulation, a dissimilarity score is computed. The vertex with the highest score is hierarchically detected and eliminated. With the execution of outlier removal, the topological structures of the Delaunay triangulation and its corresponding graph become more and more identical, which is presented in Figure 11c,d for image pair 1 and Figure 12c,d for image pair 3. For the four image pairs, the numbers of removed outliers are 14, 34, 51, and 37, respectively, which are 3.6%, 17.7%, 73.9%, and 38.9% of the corresponding total matches. In the third step of the DTSAO, match expansion is conducted to resume as many as missed true matches. Finally, the numbers of retained matches are 377, 158, 18, and 58 for the four image pairs, respectively. Figure 13 shows the match results of the four image pairs after outlier elimination based on the proposed DTSAO algorithm. We can see that (1) obvious outliers are removed, which can be verified by the intersected lines in Figure 10, and (2) fewer outliers still exist in the match results of the DTSAO, as shown in Figure 13d.
4.5. Comparison with Other Outlier Elimination Methods
In this section, DTSAO-RANSAC would be compared with other seven algorithms, i.e., LOSAC, SPRT, PROSAC, USAC [14], GC-RANSAC [15], KVLD-RANSAC [28], and DTVLD-RANSAC [31]. The first four methods are the variants of the RANSAC by integrating optimization processing in the hypothesis generation or model verification stage: GC-RANSAC uses a Hough transformation-based voting strategy to filter obvious outliers, KVLD-RANSAC uses the virtual line descriptor (VLD) to construct a photometric constraint in the filter stage and cooperates with RANSAC for match refinement, and DTVLT-RANSAC combines the VLD-based photometric constraint and the SAO-based geometric constraint for outlier removal. In this section, two tests would be conducted for performance evaluation. In the first test, four image pairs described in Section 4.4 are used to evaluate outlier removal in the filter and verification stages of GC-RANSAC, KVLD-RANSAC, DTVLD-RANSAC, and DTSAO-RANSAC. In the second test, image orientation is conducted to assess their performance in terms of efficiency, completeness, and accuracy. For all evaluated RANSAC-based methods, the number of iterations is pre-set with the value of 100,000. All these methods are implemented by using the C++ programming language. All experiments are conducted on a Windows PC with a 3.2 GHz Intel Core i7-8700 CPU and a 6 GB GeForce GTX 1060 graphic card.
4.5.1. Comparison Using Outlier Removal Tests
In this test, time costs and numbers of inliers are used as the criteria. For a fair comparison, the time costs and numbers of inliers are the average values calculated from the results of 100 times execution of the corresponding method. The performance is compared in the filter and verification stages separately. Figure 14 shows the statistical results for the performance comparison in the filter stage. It is shown that for KVLD-RANSAC and DTVLD-RANSAC, the time costs are near 5 s, which is approximately 100 times to that used in DTSAO-RANSAC. Although GC-RANSAC achieves the highest efficiency, its time costs are quadratically correlated to the numbers of matches. On the contrary, almost constant time costs are observed from DTSAO-RANSAC for the four image pairs. In addition, a nearly equal number of inliers are obtained for DTVLD-RANSAC and DTSAO-RANSAC, which is greater than that generated from KVLD-RANSAC for image pairs 1, 2, and 4. Noticeably, KVLD-RANSAC fails for image pair 4, as shown in Figure 14b, due to larger viewing angles.
Figure 15 shows the statistical results for performance comparison in the verification stage. It is shown that by using the progressive sampling strategy, PROSAC and USAC achieve high efficiency for image pairs 1, 2, and 4. However, its time costs increase dramatically for image pair 3 because of higher outlier ratios, and the same results are observed from LOSAC and SPRT. On the contrary, by using the filter stage to increase inlier ratios, the time costs of GC-RANSAC, KVLD-RANSAC, DTVLD-RANSAC, and DTSAO-RANSAC are much less than that of the RANSAC variants when processing image pair 3 with a higher outlier ratio, as presented in Figure 15a. Besides, the numbers of inliers are shown in Figure 15b, which are comparative for all the eight methods, except for image pair 4 processed by KVLD-RANSAC. To verify the validation of retained matches, the Sampson errors of estimating the fundamental matrix from the retained matches are listed in Table 2. It is clearly shown that competitive accuracy is achieved for all evaluated methods for image pairs 1, 2, and 4 with relatively higher inlier ratio; with the increase of outlier ratios, the performance of LOSAC, SPRT, PROSAC, and USAC decrease obviously, such as image pair 3. In conclusion, the proposed method can achieve high efficiency for outlier removal and obtain comparable and even higher accuracy for fundamental estimation.
4.5.2. Comparison Using Image Orientation Tests
Image orientation tests are also used for the performance comparison of the eight methods. Overlapped image pairs are first selected by computing image footprints using on-board Position and Orientation System (POS) data [36]. For the three UAV datasets, the numbers of selected image pairs are 4430, 5153, and 18,283, respectively. Image matching is then executed for each image pair, which is followed by image orientation based on Structure from Motion [36]. In this test, three metrics, namely efficiency, completeness and accuracy, are used for performance evaluation. The efficiency is quantified by the time costs in outlier removal of feature matching; completeness is quantified by the number of connected images and reconstructed 3D points in the SfM-based image orientation; accuracy is quantified by the re-projection errors in the SfM-based image orientation.
Table 3 shows the statistical results of efficiency, and two criteria, i.e., mean and sum, are used for efficiency comparison. The results reveal that DTSAO-RANSAC achieves the highest efficiency among the compared methods; for LOSAC, SPRT, PROSAC, and USAC, the time costs involved in datasets with larger oblique angles are obviously higher than that consumed in datasets with smaller oblique angles. This can also be verified by the time costs consumed in datasets 1 and 3. The main reason is that larger oblique angles cause many more outliers and degenerate the performance of the RANSAC-based methods. Compared with DTSAO-RANSAC, comparative efficiency is observed from the verification stage of KVLD-RANSAC and DTVLD-RANSAC. However, extremely high time costs are consumed in the filter stage due to high computational costs of the VLD-based photometric constraint. For efficiency comparison, performance of GC-RANSAC ranks to DTSAO-RANSAC. However, its efficiency is dramatically influenced by the number of matches, which can be verified by the mean time costs in the filter stage. In a word, DTSAO can achieve the highest efficiency for outlier removal.
After feature matching, image orientation is then executed by using the SfM technique. Results are compared in terms of completeness and accuracy, as shown in Table 4. It is shown that all images are oriented by using the four methods, except that only 279 and 450 images in the second and third datasets, respectively, are successfully oriented using KVLD-RANSAC. The main reason is that the KVLD fails to achieve outlier removal for image pairs with very large perspective deformations, e.g., the image pairs consisted of one left-viewed and one front-viewed image. This can also be verified by the 3D reconstruction of dataset 2 in Figure 16 (the local plane coordinate system with its origin at the center of test sites used as the reference system). For the three datasets, the numbers of points reconstructed from DTVLD-RANSAC and DTSAO-RANSAC are larger than that from LO-RANSAC, because of the usage of the triangulation constrained match expansion. Besides, comparing the results between DTVLD-RANSAC and DTSAO-RANSAC, we find that the number of reconstructed points from the former method is higher than that from the latter method. This can be explained by the VLD-based photometric constraint used in DTVLD, which can improve the precision and recall of initial matches and increase the number of expanded matches. For all the three datasets, competitive accuracy is obtained from LO-RANSAC, DTVLD-RANSAC and DTSAO-RANSAC.
5. Discussion
This paper proposes and designs an efficient and reliable outlier removal method for large-scale UAV image matching. It combines the local and global geometric constraints within the neighborhood structure that is deduced from the Delaunay triangulation. The experimental results demonstrate that the proposed algorithm can achieve supervised efficiency for outlier elimination while obtaining competitive performance in terms of inlier number and precision. Compared with other methods, including our previous work [31,33], the proposed algorithm has the following advantages for large-scale UAV images.
For UAV image matching, three issues, i.e., precision, efficiency, and reliability, should be carefully addressed, which have partially addressed in our previous work. In the work of Jiang et al. [33], we have used the on-board GNSS/IMU data of UAV platforms and the mean elevation of test sites for projecting feature points from the image space to the object space and designed an efficient outlier removal method with a speedup ratio of 100 when compared with the classical RANSAC-like methods. However, this method depends on the auxiliary data sources, especially for the mean elevation of test sites. In the work of Jiang et al. [31], we have designed a reliable outlier removal method, which utilizes the good geometry of the Delaunay triangulation to design a local photometric and geometric constraints and use a hierarchical strategy for outlier elimination. Although this method has been tested for feature matching of relatively small-size photos, it would consume high time costs for UAV images with high spatial resolutions. Considering these issues, this study integrates the advantages of these previously published work and designed the proposed outlier removal method, which aims to achieve efficient and reliable feature matching for UAV images and provide high prevision for image orientation. In conclusion, the proposed algorithm is elegant designed for processing UAV images with high spatial resolutions.
The robustness to outliers is a crucial measurement for evaluating the performance of outlier removal methods. In Section 4.3, the image pairs in the Oxford benchmark with ground-truth geometric transformations are utilized to analyze the robustness to outliers, whose ratios are configured from 0.1 to 0.9. The experimental results show that even though the outlier ratio reaches 0.9, the precision of image matching is still larger than 60% for all successfully matched image pairs. This result can ensure the stability and efficiency of the subsequently executed RANSAC-based match refinement, whose performance would be seriously degenerated when the outlier ratio exceeds 50%. Besides, it is verified that the high prevision is achieved mainly from the usage of the hierarchical elimination strategy. This can be observed from experimental tests conducted with and without the hierarchical elimination strategy. In the tests, the decrease ratios of the precision from the DTSAO without the hierarchical elimination strategy is higher than that of the DTSAO with the hierarchical elimination strategy, because more outliers are retained compared with the number of retained inliers without the hierarchical strategy. This experiments clearly show that the hierarchical elimination strategy can enhance the stability of the outlier removal method because it can detect and remove the most possible outliers and decrease the influence of outliers on the checking of remaining inliers.
In Section 4.5, the performance of the proposed DTSAO-RANSAC is evaluated by using feature matching and image orientation tests. The RANSAC variants and other methods with a similar filter stage are compared in the comparison evaluation. The results demonstrate that in the filter stage, DTSAO achieves a 100 times speed-up ratio when compared with KVLD and DTVLD because of the only usage of the SAO-based local geometric constraint. In addition, the time costs are almost constant for evaluated image pairs, which indicates that high efficiency can be obtained even for initial matches with large numbers. The main reason is that the proposed method only needs to calculate the local geometric constraint, instead of the pairwise relationships among all features such as the GC-RANSAC. In the verification stage, the advantage of the proposed algorithm can be observed from processing image pairs with high outlier ratios, such as datasets 1 and 3 with large oblique angles. In the image orientation tests, the highest efficiency is seen from the proposed DTSAO-RANSAC, which increases obviously compared with the RANSAC variants and the other two-stage methods. Besides, for the three datasets, all UAV images are successfully connected in the SfM-based reconstruction. Therefore, the proposed DTSAO-RANSAC can achieve the highest efficiency and provide comparable precision for the SfM-based orientation of large-scale UAV images.
Compared with our previous outlier removal method, namely DTVLD-RANSAC, the main advantage of the DTSAO-RANSAC is the extremely high efficiency for high resolution UAV images. DTVLD-RANSAC uses VLD-based descriptors as the second-order photometric constraint to remove outlier before the execution of SAO-based geometric constraint. Due to the stronger discriminative power of VLD, DTVLD-RANSAC can improve the precision and recall of initial matches and increase the number of matches when compared with DTSAO-RANSAC. Thus, in future studies, some computation efficient photometric constraints can also be integrated into the outlier removal framework.
6. Conclusions
In this paper, we propose the DTSAO-RANSAC algorithm to achieve reliable and efficient outlier removal in UAV images matching. The inputs of the proposed method are two only images. Random feature points of initial matches are first organized by using the Delaunay triangulation, which is utilized to construct neighboring structures for each point and split image planes into near-regular triangles. The spatial angular order-based local geometric constraint is then implemented to achieve outlier elimination with cooperation with a hierarchical elimination strategy. Based on the triangle constraint between the Delaunay triangulation and its corresponding graph, match expansion is conducted to resume as many missed inliers as possible, which is followed by the refinement using a RANSAC-based global geometric constraint. Finally, using four datasets, the performance of the proposed method is verified and compared with other methods in image matching and image orientation tests. The results show that the proposed algorithm can achieve efficient outlier removal and provide reliable matching results for UAV image orientation.
Author Contributions
Conceptualization, S.J.; Formal analysis, S.J. and W.J.; Funding acquisition, S.J.; Investigation, L.L. and L.W.; Methodology, S.J.; Project administration, S.J.; Resources, W.J., L.W., and W.H.; Writing—original draft, S.J.; Writing—review and editing, W.J. and L.L. All authors have read and agreed to the published version of the manuscript.
Funding
This research was funded by the National Natural Science Foundation of China (Grant No. 42001413, U1711266), the Nature Science Foundation of Hubei Province (Grant No. 2020CFB324), the Open Fund of State Laboratory of Information Engineering in Surveying, Mapping and Remote Sensing, Wuhan University (Grant No. 20E03), the Key Research and Development Projects of Hunan Science and Technology Plan (Grant No. 2015GK3027), and the Scientific Research Fund of Hunan Provincial Education Department (Grant No. 17B093).
Acknowledgments
The authors would like to thank authors who have made their algorithms of SiftGPU, USAC, and K-VLD as free and open source software packages, which is really helpful to the research in this paper. Meanwhile, heartfelt thanks to the anonymous reviewers and the editors, whose comments and advice improve the quality of the work.
Conflicts of Interest
The authors declare no conflict of interest.
References
- Jiang, S.; Jiang, W. Uav-Based Oblique Photogrammetry for 3d Reconstruction of Transmission Line: Practices and Applications. ISPRS-Int. Arch. Photogramm. Remote Sens. Spat. Inf. Sci. 2019, 4213, 401–406. [Google Scholar] [CrossRef] [Green Version]
- Jiang, S.; Jiang, W.; Huang, W.; Yang, L. UAV-Based Oblique Photogrammetry for Outdoor Data Acquisition and Offsite Visual Inspection of Transmission Line. Remote Sens. 2017, 9, 278. [Google Scholar] [CrossRef] [Green Version]
- Habib, A.; Han, Y.; Xiong, W.; He, F.; Zhang, Z.; Crawford, M. Automated Ortho-Rectification of UAV-Based Hyperspectral Data over an Agricultural Field Using Frame RGB Imagery. Remote Sens. 2016, 8, 796. [Google Scholar] [CrossRef] [Green Version]
- Xu, Z.; Wu, L.; Shen, Y.; Li, F.; Wang, Q.; Wang, R. Tridimensional reconstruction applied to cultural heritage with the use of camera-equipped UAV and terrestrial laser scanner. Remote Sens. 2014, 6, 10413–10434. [Google Scholar] [CrossRef] [Green Version]
- Jiang, S.; Jiang, C.; Jiang, W. Efficient structure from motion for large-scale UAV images: A review and a comparison of SfM tools. ISPRS J. Photogramm. Remote Sens. 2020, 167, 230–251. [Google Scholar] [CrossRef]
- Ye, Y.; Shan, J. A local descriptor based registration method for multispectral remote sensing images with non-linear intensity differences. ISPRS J. Photogramm. Remote Sens. 2014, 90, 83–95. [Google Scholar] [CrossRef]
- Sedaghat, A.; Ebadi, H. Accurate affine invariant image matching using oriented least square. Photogramm. Eng. Remote Sens. 2015, 81, 733–743. [Google Scholar] [CrossRef]
- Bay, H.; Ess, A.; Tuytelaars, T.; Van Gool, L. Speeded-up robust features (SURF). Comput. Vis. Image Underst. 2008, 110, 346–359. [Google Scholar] [CrossRef]
- Harris, C.; Stephens, M. A combined corner and edge detector. In Proceedings of the Alvey Vision Conference, Manchester, UK, 31 August–2 September 1988; Volume 15, pp. 10–5244. [Google Scholar]
- Lowe, D.G. Distinctive image features from scale-invariant keypoints. Int. J. Comput. Vis. 2004, 60, 91–110. [Google Scholar] [CrossRef]
- Moravec, H.P. Rover Visual Obstacle Avoidance. IJCAI 1981, 81, 785–790. [Google Scholar]
- Rublee, E.; Rabaud, V.; Konolige, K.; Bradski, G. ORB: An efficient alternative to SIFT or SURF. In Proceedings of the 2011 International Conference on Computer Vision, Barcelona, Spain, 6–13 November 2011; pp. 2564–2571. [Google Scholar]
- Fischler, M.A.; Bolles, R.C. Random sample consensus: A paradigm for model fitting with applications to image analysis and automated cartography. Commun. ACM 1981, 24, 381–395. [Google Scholar] [CrossRef]
- Raguram, R.; Chum, O.; Pollefeys, M.; Matas, J.; Frahm, J.M. USAC: A universal framework for random sample consensus. IEEE Trans. Pattern Anal. Mach. Intell. 2013, 35, 2022–2038. [Google Scholar] [CrossRef]
- Lu, L.; Zhang, Y.; Tao, P. Geometrical Consistency Voting Strategy for Outlier Detection in Image Matching. Photogramm. Eng. Remote Sens. 2016, 82, 559–570. [Google Scholar] [CrossRef]
- Li, X.; Larson, M.; Hanjalic, A. Pairwise geometric matching for large-scale object retrieval. In Proceedings of the IEEE Conference on Computer Vision and Pattern Recognition, Boston, MA, USA, 7–12 June 2015; pp. 5153–5161. [Google Scholar]
- Schonberger, J.L.; Frahm, J.M. Structure-from-motion revisited. In Proceedings of the IEEE Conference on Computer Vision and Pattern Recognition, Las Vegas, NV, USA, 27–30 June 2016; pp. 4104–4113. [Google Scholar]
- Zhuo, X.; Koch, T.; Kurz, F.; Fraundorfer, F.; Reinartz, P. Automatic UAV Image Geo-Registration by Matching UAV Images to Georeferenced Image Data. Remote Sens. 2017, 9, 376. [Google Scholar] [CrossRef] [Green Version]
- Aguilar, W.; Frauel, Y.; Escolano, F.; Martinez-Perez, M.E.; Espinosa-Romero, A.; Lozano, M.A. A robust graph transformation matching for non-rigid registration. Image Vis. Comput. 2009, 27, 897–910. [Google Scholar] [CrossRef]
- Izadi, M.; Saeedi, P. Robust weighted graph transformation matching for rigid and nonrigid image registration. IEEE Trans. Image Process. 2012, 21, 4369–4382. [Google Scholar] [CrossRef]
- Ma, J.; Zhao, J.; Tian, J.; Yuille, A.L.; Tu, Z. Robust point matching via vector field consensus. IEEE Trans. Image Process. 2014, 23, 1706–1721. [Google Scholar] [CrossRef] [Green Version]
- Sattler, T.; Leibe, B.; Kobbelt, L. SCRAMSAC: Improving RANSAC’s efficiency with a spatial consistency filter. In Proceedings of the Computer Vision, 2009 IEEE 12th International Conference on IEEE, Kyoto, Japan, 29 September–2 October 2009; pp. 2090–2097. [Google Scholar]
- Hu, H.; Zhu, Q.; Du, Z.; Zhang, Y.; Ding, Y. Reliable spatial relationship constrained feature point matching of oblique aerial images. Photogramm. Eng. Remote Sens. 2015, 81, 49–58. [Google Scholar] [CrossRef]
- Li, Y.; Tsin, Y.; Genc, Y.; Kanade, T. Object detection using 2D spatial ordering constraints. In Proceedings of the 2005 IEEE Computer Society Conference on Computer Vision and Pattern Recognition (CVPR’05), San Diego, CA, USA, 20–25 June 2005; Volume 2, pp. 711–718. [Google Scholar]
- Alajlan, N.; El Rube, I.; Kamel, M.S.; Freeman, G. Shape retrieval using triangle-area representation and dynamic space warping. Pattern Recognit. 2007, 40, 1911–1920. [Google Scholar] [CrossRef]
- Wang, Z.; Wu, F.; Hu, Z. MSLD: A robust descriptor for line matching. Pattern Recognit. 2009, 42, 941–953. [Google Scholar] [CrossRef]
- Zhang, L.; Koch, R. An efficient and robust line segment matching approach based on LBD descriptor and pairwise geometric consistency. J. Vis. Commun. Image Represent. 2013, 24, 794–805. [Google Scholar] [CrossRef]
- Liu, Z.; Marlet, R. Virtual Line Descriptor and Semi-Local Graph Matching Method for Reliable Feature Correspondence. In Proceedings of the British Machine Vision Conference, Surrey, UK, 3–7 September 2012; pp. 16.1–16.11. [Google Scholar]
- Li, J.; Hu, Q.; Ai, M.; Zhong, R. Robust feature matching via support-line voting and affine-invariant ratios. ISPRS J. Photogramm. Remote Sens. 2017, 132, 61–76. [Google Scholar] [CrossRef]
- Li, J.; Hu, Q.; Ai, M. 4FP-Structure: A Robust Local Region Feature Descriptor. Photogramm. Eng. Remote Sens. 2017, 83, 813–826. [Google Scholar] [CrossRef]
- Jiang, S.; Jiang, W. Reliable image matching via photometric and geometric constraints structured by Delaunay triangulation. ISPRS J. Photogramm. Remote Sens. 2019, 153, 1–20. [Google Scholar] [CrossRef]
- Dominik, W.A. Exploiting the Redundancy of Multiple Overlapping Aerial Images for Dense Image Matching Based Digital Surface Model Generation. Remote Sens. 2017, 9, 490. [Google Scholar] [CrossRef] [Green Version]
- Jiang, S.; Jiang, W. Hierarchical motion consistency constraint for efficient geometrical verification in UAV stereo image matching. ISPRS J. Photogramm. Remote Sens. 2018, 142, 222–242. [Google Scholar] [CrossRef]
- Liu, J.; Xue, Y.; Ren, K.; Song, J.; Windmill, C.; Merritt, P. High-Performance Time-Series Quantitative Retrieval From Satellite Images on a GPU Cluster. IEEE J. Sel. Top. Appl. Earth Obs. Remote Sens. 2019, 12, 2810–2821. [Google Scholar] [CrossRef] [Green Version]
- Wang, N.; Chen, F.; Yu, B.; Qin, Y. Segmentation of large-scale remotely sensed images on a Spark platform: A strategy for handling massive image tiles with the MapReduce model. ISPRS J. Photogramm. Remote Sens. 2020, 162, 137–147. [Google Scholar] [CrossRef]
- Jiang, S.; Jiang, W. Efficient structure from motion for oblique UAV images based on maximal spanning tree expansion. ISPRS J. Photogramm. Remote Sens. 2017, 132, 140–161. [Google Scholar] [CrossRef]
- Cover, T.; Hart, P. Nearest neighbor pattern classification. IEEE Trans. Inf. Theory 1967, 13, 21–27. [Google Scholar] [CrossRef]
- Guo, X.; Cao, X. Good match exploration using triangle constraint. Pattern Recognit. Lett. 2012, 33, 872–881. [Google Scholar] [CrossRef]
- Wu, C. SiftGPU: A GPU Implementation of David Lowe’s Scale Invariant Feature Transform (SIFT). 2007. Available online: https://github.com/pitzer/SiftGPU (accessed on 19 June 2017).
- Boissonnat, J.D.; Devillers, O.; Pion, S.; Teillaud, M.; Yvinec, M. Triangulations in CGAL. Comput. Geom. 2002, 22, 5–19. [Google Scholar] [CrossRef] [Green Version]
- Zhang, Z. Determining the epipolar geometry and its uncertainty: A review. Int. J. Comput. Vis. 1998, 27, 161–195. [Google Scholar] [CrossRef]
- Mikolajczyk, K.; Schmid, C. A performance evaluation of local descriptors. IEEE Trans. Pattern Anal. Mach. Intell. 2005, 27, 1615–1630. [Google Scholar] [CrossRef] [PubMed] [Green Version]
Figure 1.
The overall workflow of the proposed UAV image matching algorithm.

Figure 2.
The illustration of the Delaunay triangulation and its corresponding graph from initial candidate matches: (a) initial candidate matches, (b) the Delaunay triangulation, and (c) its corresponding graph.
Figure 2.
The illustration of the Delaunay triangulation and its corresponding graph from initial candidate matches: (a) initial candidate matches, (b) the Delaunay triangulation, and (c) its corresponding graph.

Figure 3.
The illustration of the triangle constrained match expansion. (a) Triangle in the left image. (b) The corresponding triangle in the right image [31].
Figure 3.
The illustration of the triangle constrained match expansion. (a) Triangle in the left image. (b) The corresponding triangle in the right image [31].

Figure 4.
Dataset 1 from the Oxford benchmark. (a) Bark. (b) Bikes. (c) Boat. (d) Trees. (e) Graf. (f) Wall. (g) Leuven. (h) Ubc.
Figure 4.
Dataset 1 from the Oxford benchmark. (a) Bark. (b) Bikes. (c) Boat. (d) Trees. (e) Graf. (f) Wall. (g) Leuven. (h) Ubc.

Figure 5.
The ground details of the three UAV datasets. (a) Dataset 2. (b) Dataset 3. (c) Dataset 4.
Figure 5.
The ground details of the three UAV datasets. (a) Dataset 2. (b) Dataset 3. (c) Dataset 4.

Figure 6.
The influence of the score threshold on image matching for the eight sequences of dataset 1. (a) Precision. (b) Recall.
Figure 6.
The influence of the score threshold on image matching for the eight sequences of dataset 1. (a) Precision. (b) Recall.

Figure 7.
The influence of the score threshold on image matching for dataset 1.

Figure 8.
The influence of outliers on DTSAO-based image matching. (a) Precision. (b) Recall.

Figure 9.
The influence of outliers on DTSAO-based image matching without the hierarchical elimination strategy. (a) Precision. (b) Recall.
Figure 9.
The influence of outliers on DTSAO-based image matching without the hierarchical elimination strategy. (a) Precision. (b) Recall.

Figure 10.
Initial matches of the four image pairs. (a) The first image pair. (b) The second image pair. (c) The third image pair. (d) The fourth image pair.
Figure 10.
Initial matches of the four image pairs. (a) The first image pair. (b) The second image pair. (c) The third image pair. (d) The fourth image pair.

Figure 11.
DTSAO for outlier elimination of image pair 1. (a) The Delaunay triangulation before outlier removal. (b) Its corresponding graph before outlier removal. (c) The Delaunay triangulation after outlier removal. (d) Its corresponding graph after outlier removal.
Figure 11.
DTSAO for outlier elimination of image pair 1. (a) The Delaunay triangulation before outlier removal. (b) Its corresponding graph before outlier removal. (c) The Delaunay triangulation after outlier removal. (d) Its corresponding graph after outlier removal.

Figure 12.
DTSAO for outlier elimination of image pair 3. (a) The Delaunay triangulation before outlier removal. (b) Its corresponding graph before outlier removal. (c) The Delaunay triangulation after outlier removal. (d) Its corresponding graph after outlier removal.
Figure 12.
DTSAO for outlier elimination of image pair 3. (a) The Delaunay triangulation before outlier removal. (b) Its corresponding graph before outlier removal. (c) The Delaunay triangulation after outlier removal. (d) Its corresponding graph after outlier removal.

Figure 13.
Outlier elimination of the four image pairs. (a) The first image pair. (b) The second image pair. (c) The third image pair. (d) The fourth image pair.
Figure 13.
Outlier elimination of the four image pairs. (a) The first image pair. (b) The second image pair. (c) The third image pair. (d) The fourth image pair.


Figure 14.
Comparison of time costs and numbers of inliers in the filter stage. (a) Time costs. (b) Number of inliers.
Figure 14.
Comparison of time costs and numbers of inliers in the filter stage. (a) Time costs. (b) Number of inliers.

Figure 15.
Comparison of time costs and numbers of inliers in the verification stage. (a) Time costs. (b) Number of inliers.
Figure 15.
Comparison of time costs and numbers of inliers in the verification stage. (a) Time costs. (b) Number of inliers.

Figure 16.
3D scene reconstruction of dataset 3. (a) LO-RANSAC; (b) KVLD-RANSAC; (c) DTVLD-RANSAC; (d) DTSAO-RANSAC.
Figure 16.
3D scene reconstruction of dataset 3. (a) LO-RANSAC; (b) KVLD-RANSAC; (c) DTVLD-RANSAC; (d) DTSAO-RANSAC.


Table 1.
Detailed information for data acquisition of the three UAV datasets.
| Item Name | Dataset 1 | Dataset 2 | Dataset 3 |
|---|---|---|---|
| UAV type | multi-rotor | multi-rotor | multi-rotor |
| Flight height (m) | 300 | 165 | 175 |
| Camera mode | Sony ILCE-7R | Sony RX1R | Sony NEX-7 |
| Number of cameras | 1 | 1 | 5 |
| Focal length (mm) | 35 | 35 | nadir: 16 oblique: 35 |
| Camera angle () | nadir: 0 oblique: 45/−45 | front: 25, −15 | nadir: 0 oblique: 45/−45 |
| Number of images | 157 | 320 | 750 |
| Image size (pixel) | 7360 × 4912 | 6000 × 4000 | 6000 × 4000 |
| GSD (cm) | 4.20 | 5.05 | 4.27 |
Table 2.
The errors of estimating the fundamental matrix (in pixels).
| No. | LOSAC | SPRT | PROSAC | USAC | GC-RANSAC | KVLD-RANSAC | DTVLD-RANSAC | DTSAO-RANSAC |
|---|---|---|---|---|---|---|---|---|
| 1 | 0.256 | 0.271 | 0.257 | 0.255 | 0.252 | 0.252 | 0.255 | 0.257 |
| 2 | 0.240 | 0.270 | 0.262 | 0.244 | 0.236 | 0.237 | 0.240 | 0.236 |
| 3 | 0.162 | 0.188 | 0.195 | 0.195 | 0.163 | 0.068 | 0.118 | 0.098 |
| 4 | 0.232 | 0.271 | 0.249 | 0.241 | 0.224 | —— | 0.222 | 0.225 |
Table 3.
Efficiency comparison in SfM-based image orientation.
| Item | LOSAC | SPRT | PROSAC | USAC | GC-RANSAC | KVLD-RANSAC | DTVLD-RANSAC | DTSAO-RANSAC | ||||
|---|---|---|---|---|---|---|---|---|---|---|---|---|
| Filter | Verif | Filter | Verif | Filter | Verif | Filter | Verif | |||||
| (a) Mean (unit in seconds) | ||||||||||||
| 1 | 0.913 | 1.608 | 1.244 | 1.239 | 0.056 | 0.096 | 14.857 | 0.011 | 4.634 | 0.012 | 0.049 | 0.011 |
| 2 | 0.071 | 0.127 | 0.287 | 0.291 | 0.114 | 0.012 | 5.816 | 0.007 | 2.883 | 0.009 | 0.055 | 0.009 |
| 3 | 0.924 | 1.335 | 0.983 | 0.982 | 0.041 | 0.115 | 8.390 | 0.005 | 2.759 | 0.007 | 0.051 | 0.005 |
| (b) Sum (unit in minutes) | ||||||||||||
| 1 | 67.40 | 118.75 | 91.86 | 91.51 | 4.11 | 7.12 | 1096.95 | 0.78 | 342.15 | 0.92 | 3.65 | 0.83 |
| 2 | 6.12 | 10.86 | 24.67 | 25.00 | 9.81 | 1.05 | 499.48 | 0.63 | 247.59 | 0.75 | 4.76 | 0.74 |
| 3 | 281.49 | 406.84 | 299.49 | 299.25 | 12.59 | 34.93 | 2556.49 | 1.45 | 840.63 | 2.00 | 15.51 | 1.65 |
Table 4.
Completeness and accuracy comparison in SfM-based image orientation (root mean square error (RMSE) in pixels).
Table 4.
Completeness and accuracy comparison in SfM-based image orientation (root mean square error (RMSE) in pixels).
| Dataset | Item | LOSAC | SPRT | PROSAC | USAC | GC- RANSAC | KVLD- RANSAC | DTVLD- RANSAC | DTSAO- RANSAC |
|---|---|---|---|---|---|---|---|---|---|
| 1 | No. images | 157/157 | 157/157 | 157/157 | 157/157 | 157/157 | 157/157 | 157/157 | 157/157 |
| No. points | 70,967 | 71,515 | 67,994 | 69,653 | 68,783 | 76,988 | 76,997 | 75,720 | |
| RMSE | 0.537 | 0.538 | 0.539 | 0.539 | 0.532 | 0.548 | 0.548 | 0.541 | |
| 2 | No. images | 320/320 | 320/320 | 320/320 | 320/320 | 320/320 | 279/320 | 320/320 | 320/320 |
| No. points | 136,131 | 140,475 | 132,005 | 139,766 | 138,829 | 118,425 | 163,370 | 163,245 | |
| RMSE | 0.591 | 0.599 | 0.598 | 0.595 | 0.596 | 0.428 | 0.618 | 0.618 | |
| 3 | No. images | 750/750 | 750/750 | 750/750 | 750/750 | 750/750 | 450/750 | 750/750 | 750/750 |
| No. points | 267,794 | 258,192 | 224,295 | 222,977 | 262,837 | 147,241 | 292,087 | 278,429 | |
| RMSE | 0.670 | 0.661 | 0.654 | 0.647 | 0.671 | 0.620 | 0.683 | 0.676 |
Publisher’s Note: MDPI stays neutral with regard to jurisdictional claims in published maps and institutional affiliations. |
© 2020 by the authors. Licensee MDPI, Basel, Switzerland. This article is an open access article distributed under the terms and conditions of the Creative Commons Attribution (CC BY) license (http://creativecommons.org/licenses/by/4.0/).
Share and Cite
MDPI and ACS Style
Jiang, S.; Jiang, W.; Li, L.; Wang, L.; Huang, W. Reliable and Efficient UAV Image Matching via Geometric Constraints Structured by Delaunay Triangulation. Remote Sens. 2020, 12, 3390. https://doi.org/10.3390/rs12203390
AMA Style
Jiang S, Jiang W, Li L, Wang L, Huang W. Reliable and Efficient UAV Image Matching via Geometric Constraints Structured by Delaunay Triangulation. Remote Sensing. 2020; 12(20):3390. https://doi.org/10.3390/rs12203390
Chicago/Turabian StyleJiang, San, Wanshou Jiang, Lelin Li, Lizhe Wang, and Wei Huang. 2020. "Reliable and Efficient UAV Image Matching via Geometric Constraints Structured by Delaunay Triangulation" Remote Sensing 12, no. 20: 3390. https://doi.org/10.3390/rs12203390
Note that from the first issue of 2016, this journal uses article numbers instead of page numbers. See further details here.