Article

Comparing Measured Incoming Shortwave and Longwave Radiation on a Glacier Surface with Estimated Records from Satellite and Off-Glacier Observations: A Case Study for the Forni Glacier, Italy

by
Antonella Senese
*,
Veronica Manara
,
Maurizio Maugeri
and
Guglielmina Adele Diolaiuti
Department of Environmental Science and Policy, Università degli Studi di Milano, 20133 Milan, Italy
*
Author to whom correspondence should be addressed.
Remote Sens. 2020, 12(22), 3719; https://doi.org/10.3390/rs12223719
Submission received: 13 October 2020 / Revised: 2 November 2020 / Accepted: 9 November 2020 / Published: 12 November 2020
(This article belongs to the Special Issue Recent Advances in Cryospheric Sciences)

Abstract

:
The development of methods for quantifying meltwater from glaciated areas is very important for better management of water resources and because of the strong impact of current and expected climate change on the Alpine cryosphere. Radiative fluxes are the main melt-drivers, but they can generally not be derived from in situ measures because glaciers are usually located in remote areas where the number of meteorological stations is very low. For this reason, focusing, as a case study, on one of the few glaciers with a supraglacial automatic weather station (Forni Glacier), we investigated methods based on both satellite records and off-glacier surface observations to estimate incoming short- and long-wave radiation at the glacier surface (SWin and LWin). Specifically, for SWin, we considered CM SAF SARAH satellite gridded surface solar irradiance fields and data modeled by cloud transmissivity parametrized from both CM SAF COMET satellite cloud fractional cover fields and daily temperature range observed at the closest off-glacier station. We then used the latter two data sources to derive LWin too. Finally, we used the estimated SWin and LWin records to assess the errors obtained when introducing estimated rather than measured incoming radiation data to quantify glacier melting by means of an energy balance model. Our results suggest that estimated SWin and LWin records derived from satellite measures are in better agreement with in situ observations than estimated SWin and LWin records parametrized from observations performed at the closest off-glacier station. Moreover, we find that the former estimated records permit a significantly better quantification of glacier melting than the latter estimated ones.

Graphical Abstract

1. Introduction

The global warming period temperature increase has been particularly strong in the Alpine region, which has recorded a significantly higher temperature trend than Earth’s average one (see, e.g., [1]). The strong temperature trend, together with high vulnerability to climate change, has strongly enhanced the impact of global warming in high-elevation areas of this region that in the last decades have experienced relevant environmental changes. These changes are particularly strong in glacierized areas because glaciers have lost a relevant fraction of their volume with a wide range of impacts, including significant changes in the amount and in the seasonality of meltwater discharge [2]. Expected temperature increase for the next decades will further strengthen the current changes with dramatic impacts on the Alpine cryosphere [3].
In this context, investigating Alpine glacier melting processes is becoming increasingly important. One of the most applied methodologies to investigate glacier melting processes is the energy balance model [4]. According to this model, whenever the glacier surface is at the melting point (i.e., 0 °C), melting occurrence and rate are regulated by radiative, sensible, and latent heat fluxes; of these, sensible and latent heat fluxes are strongly dependent on turbulence allowing heat and water vapor transport in the atmospheric layer over the glacier surface.
Since radiative flux terms are generally larger than turbulent flux ones in this model [5,6], detailed knowledge of the spatial distribution and temporal evolution of incoming and outgoing short- and long-wave radiation at the glacier surface (SWin, SWout, LWin, LWout) is very important. However, this knowledge generally cannot be based on in situ measures because glaciers are usually located in remote areas where the number of meteorological stations is very low (e.g., for shortwave radiation [7,8]). Moreover, in Alpine high-elevation areas, the data produced by circulation models generally do not provide accurate information on radiation, even when high-resolution models are used [9]. Therefore, it is necessary to develop methodologies that allow estimating radiative data at the glacier surface, or, in other terms, it is necessary to model or parametrize them by means of other known data. This approach is particularly important for incoming radiation data: SWin is often the dominant incoming flux for melting processes; however, LWin can contribute with a similar or higher amount of energy especially during cloudy periods [10,11,12], and these conditions are becoming more important every day in a warming and moistening atmosphere.
Modeling of clear-sky solar radiation has substantially advanced in recent decades, and current models allow taking into account atmospheric transmissivity as well as surface topography, including shading and reflection from surrounding surfaces [9,13,14]. On the contrary, the inclusion of clouds is still problematic [9] despite their relevant role in controlling incoming radiation. In mountain areas, in fact, clouds exhibit generally noticeably changes in space and time, and they strongly affect the surface radiation balance by (i) reducing the incoming solar radiation, (ii) absorbing the infrared radiation emitted by the surface and the lower atmosphere, and (iii) re-emitting it back to the surface, the so-called cloud greenhouse effect [15].
The occurrence and the relevance of clouds can be expressed both focusing on the fraction of sky that is covered by clouds (cloudiness, n) or considering the effect they produce on incoming solar radiation (cloud transmissivity, τ). The former variable can be used to model incoming longwave radiation [16,17], and the latter can be used to obtain incoming shortwave radiation from clear-sky incoming shortwave radiation [16,18].
In spite of the quite abundant literature focusing on large-scale models for deriving cloudiness [19,20,21,22,23,24,25], glacier applications are still poorly debated and sometimes underestimated. In fact, these models do not provide reliable data to estimate local values, especially in complex orographic areas where glaciers are generally located. As far as Alpine glaciated areas are concerned, interesting results for the parametrization of cloud transmissivity are available from Pellicciotti et al. [9] and show that the 2 m daily air-temperature range is the best predictor of variations in cloud transmissivity. This is because clouds affect the daily temperature range by both decreasing the maximum surface temperature and increasing the minimum one compared to clear-sky conditions. The relationship between clouds and the daily temperature range is naturally not restricted to glaciated areas; it is much more general [23,24,25].
Aside from parametrization methods, cloudiness and radiation data can also be derived from satellite measures. Satellite observations have indeed been largely used for investigating high-elevation areas. Specifically, they have been used for mapping glacier outlines, thus permitting the quantification of glacier extent over wide areas (see [26,27,28,29,30,31,32,33,34,35,36]): in regions with stronger glacier shrinkage, such as the tropical Andes (e.g., [37,38]) or the European Alps (e.g., [39,40]), a high update frequency of these outlines is likely required, and only remote sensing investigations can assure it. Recently, Paul et al. [41] published the glacier inventory of the whole Alps by analyzing Sentinel-2 images. These images feature 10 m resolution data making it possible to substantially improve the quality of the derived glacier outlines (compared to Landsat TM ones) (see [42]) and to cover a wide and complex region such as the Alps with a few scenes acquired within a few weeks or even days. Remote sensing also permitted glacier surface flow velocity to be mapped at the regional scale by using a multiple-sensor approach [43] to describe glacier dynamics and its changes. Moreover, satellite imagery has permitted the description of glacier darkening (see [44]), an ongoing phenomenon that is largely affecting glaciers worldwide and thus increasing ice melt. By analyzing remote sensing data, glacier surface conditions (i.e., supraglacial debris cover occurrence and depth) were described over large areas [34,45,46], and their recent changes, witnessing an actual darkening, were quantified [47]. Glacier darkening is also evident from the analysis of glacier albedo. Satellite images permitted the description of glacier albedo [48,49,50], which is diminishing in the Alps [51] due to increasing debris and black carbon deposition. Furthermore, remote sensing highly improved snow cover mapping, thus permitting researchers to describe snow depletion and to compute more accurately the water budget of a mountain catchment [52,53,54,55,56,57,58,59,60].
Widely used satellite data sets for Europe concerning the variables considered in this paper are the gridded surface solar irradiance fields SARAH-2.1 [61,62] and the corresponding cloud fractional cover fields COMET Ed. 1 [63,64] that are available among climate products from EUMETSAT Satellite Application Facility on Climate Monitoring (CM SAF—https://www.cmsaf.eu). One of the most interesting features of these products is that in EUMETSAT CM SAF, the generation of long-term data sets is pursued with the goal of obtaining data records suitable for the analysis of climate variability and potentially for the detection of climate trends. This is not an easy issue, especially for areas like Italy that have experienced relevant changes in the atmospheric transparency over the last decades [65].
In spite of their wide availability, satellite observations are not easy to use for the detection of cloudiness and solar radiation over high-elevation areas because snow coverage is not always correctly distinguished from clouds, resulting in an enhanced cloud optical depth and subsequently in an overestimation of cloudiness and an underestimation of surface solar irradiance, particularly under clear-sky conditions [61,66].
In this context, we focus, as a case study, on the Forni Glacier (Stelvio National Park, Italian Alps) where since September 2005 an on-glacier automatic weather station has been continuously running [49,67,68,69], and we use the radiation data recorded at this site to (i) search for parametrizations that allow estimating cloud transmissivity at a glacier surface from meteorological data acquired in the area surrounding the glacier (i.e., at an off-glacier weather station) or from COMET cloud fractional cover fields, (ii) investigate the ability of these parametrized values to estimate the incoming shortwave and longwave radiation over the glacier surface (SWin and LWin), and (iii) study the impact of introducing estimated incoming shortwave and longwave radiation in the application of an energy balance model applied to calculate daily glacier melt. For shortwave incoming radiation, we also test the benefits of using SARAH−2.1 gridded surface solar irradiance fields instead of estimated SWin.
The paper is organized into six sections. After the introduction (Section 1), Section 2 presents the study area and the data. In Section 3, we illustrate the methods for estimating incoming shortwave and longwave radiation and for quantifying glacier melt. The results of the analyses are reported in Section 4. In Section 5, we discuss our findings. Finally, we report the conclusions of the paper in Section 6.

2. Study Area and Data

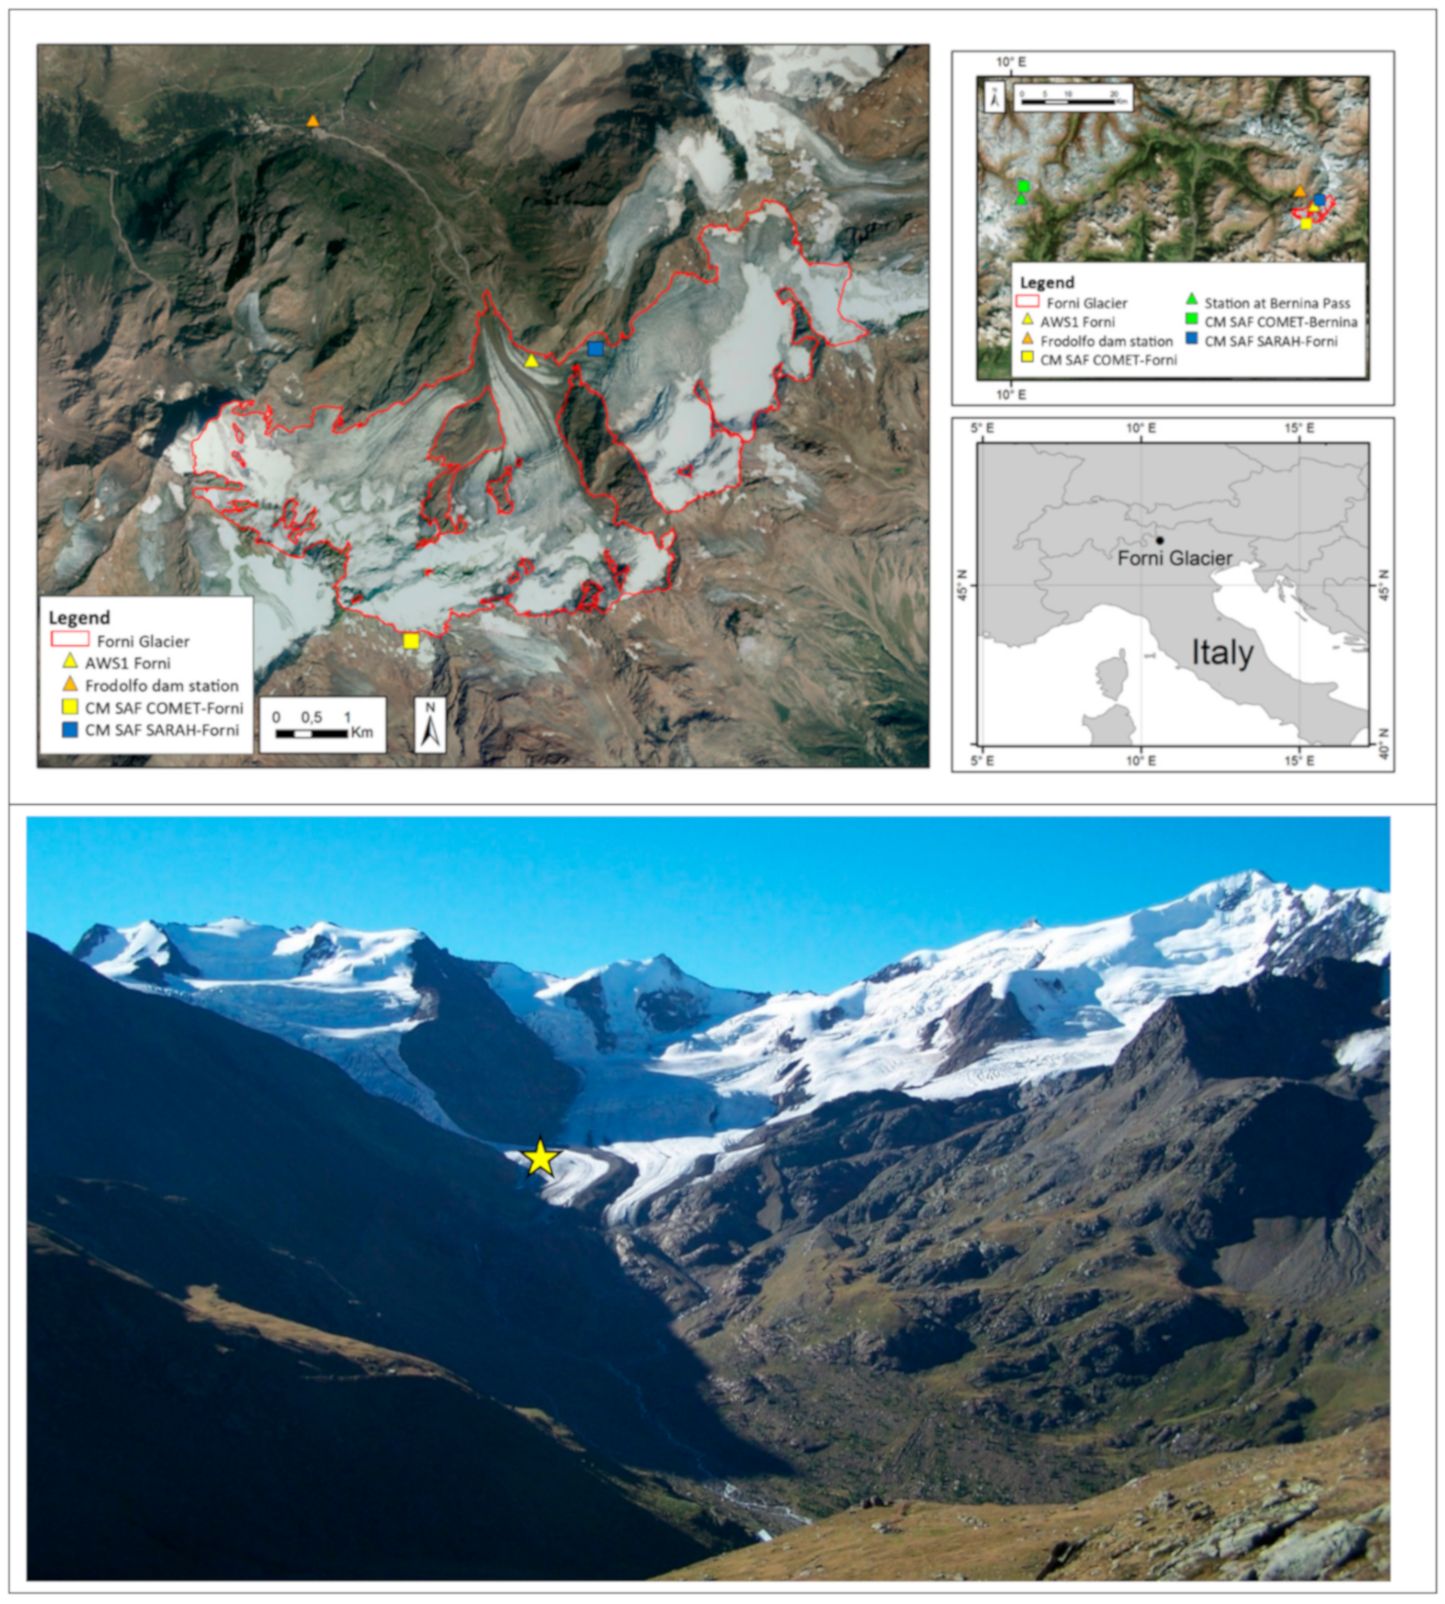
2.1. Forni Glacier and the Meteorological Stations

Forni Glacier is one of the largest glaciers in Italy (ca. 11.34 km2, [70]) covering an elevation range from about 2600 to 3670 m a.s.l. It is located inside an extensive natural protected area (Stelvio National Park).
In September 2005, the first on-glacier meteorological station in Italy (AWS1 Forni; Figure 1) was set up at the lower sector of the eastern tongue of this glacier [6]. The WGS84 coordinates of AWS1 Forni were 46°23′56.0″N, 10°35′25.2″E, at an elevation of 2631 m a.s.l. A second station (AWS Forni SPICE; Figure 1) was set up in May 2014 close to AWS1 Forni (at a distance of about 17 m). Due to the formation of ring faults (i.e., series of circular or semicircular fractures with stepwise subsidence), both AWSs were moved to the Forni Glacier central tongue (46°23′42.4″N and 10°35′24.2″E, 2675 m a.s.l., [70]) in November 2015.
AWS1 Forni is equipped with sensors for measuring air temperature (Tgl) and humidity (by means of a naturally ventilated shielded sensor), wind speed and direction, air pressure, the four components of the radiation budget (incoming and outgoing short- and long-wave radiation at the glacier surface—SWin-gl, SWout-gl, LWin-gl, LWout-gl), liquid precipitation (by means of an unheated precipitation gauge), and snow depth (Campbell SR50 and Sommer USH8 sonic ranger sensors) (see also Senese et al. [6]). AWS Forni SPICE is equipped with a snow pillow and a barometer for measuring the snow water equivalent (SWE) (see also Senese et al. [70]). Both AWS1 Forni and AWS Forni SPICE are supported by four-leg stainless steel masts (5 and 6 m high, respectively) standing on the ice surface. The meteorological variables are sampled every 60 s, and the acquired data are averaged every 60 min (snow depth (Campbell SR50), wind speed and direction, and air pressure), every 30 min (air temperature, relative humidity, solar and infrared radiation, and liquid precipitation) or every 10 min (snow depth (Sommer USH8) and SWE). All data are recorded in a flash memory card, including the basic distribution parameters (minimum, mean, maximum, and standard deviation values).
In the Forni Glacier area, there is also a station located near the dam of the Frodolfo stream (46°25′12.64″N, 10°33′45.35″E, 2180 m a.s.l., Figure 1) at a distance of about 3 km from the on-glacier station. This off-glacier station is included in the meteorological network of Lombardy Environmental Agency (ARPA Lombardia), and it measures only air temperature (daily minimum, mean, and maximum values). Hourly temperature data are available from 2006 to 2009 and from June to August.

2.2. Incoming Shortwave Radiation Satellite Data

For incoming shortwave radiation satellite data (SWin-SARAH), we used CM SAF Surface Solar Radiation Data Set, Heliosat, Edition 2.1 (SARAH 2.1) [62] based on the geostationary Meteosat satellite series. SARAH 2.1 data are available at daily resolution over the 1983−2017 period and they are provided on a regular 0.05° × 0.05° grid (at the Forni glacier, the extension of this grid cell is 3.8 km in the east–west direction and 5.6 km in the south–north one): we considered the closest (about 0.8 km) grid-point (46°24′00″N and 10°36′00″E, Figure 1) with respect to the AWS1 Forni station. As reported in the validation report, the SARAH 2.1 dataset has been compared with the Baseline Surface Radiation Network (BSRN) data showing a bias of 1.5 W m−2 and a mean absolute difference of 11.7 W m−2 (below the target accuracy value of 20 W m−2 and below the optimal accuracy of 12 W m−2). Moreover, an extensive analysis of temporal variability and trends in Europe was performed and discussed in detail by Pfeifroth et al. [61]. The comparison between the daily AWS1 Forni incoming shortwave radiation (SWin-gl) and the corresponding data from SARAH (SWin-SARAH) over the summer months (June to August) of the 2006–2009 period (Figure 2A, Table 2) highlights a rather good agreement. The mean difference is 2.0 W m−2, the mean absolute difference is 34.9 W m−2, and the common variance is 73%, corresponding to a correlation index of 0.85.

2.3. Cloudiness Satellite Data

For cloudiness, we considered the data from the CM SAF Cloud Fractional Cover dataset from Meteosat First and Second Generation (COMET) [63,64]. COMET data are available at daily resolution over the 1991−2015 period and they are provided on a regular 0.05° × 0.05° grid: we considered the closest (about 3 km) grid-point (46°22′30.0″N and 10°34′30.0″E, Figure 1) with respect to the AWS1 Forni station.
COMET fractional cover data are expressed as the percentage of the sky covered by clouds, with values between 0 (clear sky) and 100 (overcast sky). As reported in the validation report [63], these data fulfilled the optimal accuracy and precision requirements (mean bias error of −0.2%, bias-removed root-mean-square error of 16.5%) when they were compared with 237 SYNOP reference sites. However, in order to evaluate their goodness over an area characterized by a complex orography like a glacier, we assessed their agreement with daily data from Bernina Pass (46°24′33.0″N, 10°01′10.4″E, 2260 m a.s.l., Figure 1) meteorological station. This station is managed by the Switzerland Federal Office of Meteorology and Climatology (Meteo Swiss—http://www.meteoswiss.admin.ch/home.html) and it is the closest site (about 40 km) to Forni Glacier with an elevation over 2000 m a.s.l. and with cloudiness observations. The comparison was performed considering the closest COMET grid point to the Bernina Pass meteorological station (46°25′30.0″N and 10°01′30.0″E, Figure 1) and considering all days in the summer months (from June to August) of the 1991−2014 period, which is the one in common to the two datasets. It showed a bias-removed root-mean-square error of 0.16 and a common variance of 74%.

3. Methods

In this section, we first list the indicators we used to evaluate the errors of the adopted models. Then, we introduce cloud transmissivity (Section 3.2) and present the parametrizations we used to estimate this variable from daily temperature range data acquired at the off-glacier Frodolfo dam station (Section 3.3). Then, we present the methods we used to link cloud transmissivity to cloudiness (Section 3.4) and to estimate incoming shortwave (SWin) and longwave (LWin) radiation over the glacier surface (Section 3.5). Then, we present the energy balance model we applied to quantify the amount of melting (Section 3.6). Finally, we explain how we performed the comparison of glacier melt obtained from observed and estimated SWin and LWin records (Section 3.7).

3.1. Error Measures

We evaluated the performance of the different models by means of (i) mean bias error (MBE), (ii) mean absolute error (MAE), (iii) root-mean-square error (RMSE), (iv) bias-removed root-mean-square error (BRRMSE), and (v) common variance (R2).
MBE (the mean of the differences between estimated and measured values) highlights any systematic bias, while MAE (the mean of the absolute differences between estimated and measured values) gives evidence of the accuracy of the estimated values. RMSE (square root of the quadratic mean of the differences between estimated and measured values) is again a measure of the accuracy of the estimated values but is more sensitive to outliers. BRRMSE is calculated as RMSE, but the estimated values are corrected for bias before RMSE calculation. Finally, R2 is the common variance (the correlation coefficient is the square root of the common variance) between the estimated and the measured values, and it shows how much of the variability of the measured values is reproduced by the estimated ones.

3.2. Cloud Transmissivity at AWS1 Forni

Cloud transmissivity (τ—comprised between 0–1) is a factor that reduces the potential SWin of a quantity, which depends on the amount and type of clouds [15,71,72]. A value of τ = 1 corresponds to a clear sky with no clouds, whereas τ = 0 means that no shortwave radiation reaches the surface at all. However, an overcast sky usually has τ > 0 [71,72], with different values for different cloud types. For example, Anslow et al. [72] used τ = 0.4 for completely cloudy conditions for South Cascade Glacier (Washington, DC, USA).
We derived daily τ (τgl) from the 2006−2012 AWS1 Forni daily mean SWin-gl dataset and following Senese et al. [17]:
τ gl = SW in gl SW in CS
where SWin-CS is the potential clear-sky mean SWin for the considered day at the AWS1 Forni site (W m−2) calculated following the approach proposed by Senese et al. [17].

3.3. Cloud Transmissivity Parametrization from Daily Temperature Range

We tested different models from linear regression to models of enhancing complexity (see Table 1) to parametrize τ by means of the daily temperature range (difference between maximum and minimum daily temperature) acquired at the off-glacier Frodolfo dam station (ΔTdam). Specifically, we used the temperature measured at the off-glacier Frodolfo dam station instead of the temperature measured at the glacier surface because the latter one can be affected by the microconditions of the lowest air layers over the glacier. In fact, the low ice/snow temperature can cause, especially in summer, temperature inversions above the glacier, and melting conditions can affect the relative humidity values of the air over the glacier. Both phenomena (i.e., lower surface temperature and melting surface) do not influence the air conditions outside the glacier, while they can affect the conditions around the station.
We considered 2006 and 2008 (from June to August) for the calibration phase and 2007 and 2009 (from June to August) for the validation one. We evaluated the performance of the different models comparing the parametrized τ values with those from Equation (1) (τgl). The obtained results showed very similar performance of the different methods, with MBE and MAE respectively equal to 0.006 and 0.109 for the exponential method and 0.019 and 0.111 for the other methods. The common variance turned out to be 42% for all the methods, corresponding to a correlation index of 0.65. Considering the very similar results obtained with the different models, we decided to use the linear method for our analysis considering that increasing the complexity of the adopted method does not produce any significant difference in the results. The obtained relation between τ and ΔTdam is as follows:
τ = 0.055 ± 0.005 Δ T dam + 0.26 ± 0.05

3.4. Cloud Transmissivity and Cloudiness

We linked τ to n by means of the approach proposed by Sauberer [73] and Konzelmann et al. [74] using the following relation:
τ = 1 0.41 6.5 · 10 5 · altitude   n 0.37   n 2
This relation was found by Sauberer [73] and Konzelmann et al. [74] through the analysis of global radiation data from Austrian climate stations (Alps) and can be used also for other sites with similar climate conditions using the altitude of the considered point. In particular, if we consider the altitude of the AWS1 Forni site (2631 m a.s.l.), Equation (3) becomes
τ = 1 0.24   n 0.37   n 2
or
n = 0.12 + 0.12 2 + 0.37 1 τ 0.37
Moreover, we also calibrated the following relation between τ and n using τ values obtained at AWS1 Forni (τgl) and n from satellite data (nCOMET) and focusing on 2006 and 2008 (from June to August) data:
τ = 0.99 ± 0.04 0.41 ± 0.15   n 0.08 ± 0.15 n 2
or
n = 0.41 + 0.41 2 + 4 0.08 0.99 τ 2 0.08
The comparison with τgl values, performed by means of 2007 and 2009 (from June to August) data, showed that the agreement is comparable for τ values obtained from Equations (4) and (6). Specifically, MBE values are 0.014 and 0.016, MAE values are 0.104 and 0.097 and common variances are 51% and 53% for the former and the latter equation, respectively.
Considering that the results are comparable (or slightly better for equation calibrated by means of COMET data), we will present the results obtained using Equations (6) and (7) in the remaining part of the paper, even if all the results have also been obtained using τ and n obtained from Equations (4) and (5).

3.5. Estimated Incoming Shortwave and Longwave Records

We used τ estimated by means of ΔTdam (Equation (2)) and τ estimated by means of nCOMET (Equation (6)) in Equation (1) to get two derived records of incoming shortwave radiation (SWin-∆T and SWin-COMET, respectively) at AWS1 Forni.
We considered both n estimated by Equation (7) and n from satellite data (nCOMET) to get derived records of incoming longwave radiation (LWin-∆T and LWin-COMET, respectively) at this site. Specifically, we calculated LWin following the approach reported in Senese et al. [17]:
LW in = ε CS 1 n 2 + ε CL n 2 σ T gl 4
where εCL is the emissivity for overcast sky (0.976) [75], σ is the Stephan–Boltzmann constant (5.67 × 10⁻⁸ W m−2 K−4), and n is the cloudiness that can be obtained either from τ by applying Equation (7) (giving LWin-∆T) or from COMET data (giving LWin-COMET); εCS is the emissivity for clear sky and is given by [74]
ε CS = 0.23 + 0.475 e gl T gl 1 8
where Tgl (K) is the air temperature acquired by AWS1 Forni and egl is the vapor pressure calculated following Wexler [76]:
e gl = RH gl 610.8   e 19.85 1 273.15 T gl
where RHgl is the relative humidity acquired by AWS1 Forni.

3.6. Glacier Melting

We applied the energy balance model to quantify the amount of melting. Specifically, according to Senese et al. [6] we used the following relation:
M EnBal = SWin SWout + LWin LWout + SH + LE Lm
where MEnBal is the snow/ice melt (kg m−2 or meters of water equivalent (m w.e.)), SWout is the reflected solar radiation, LWout is the longwave radiation emitted by the surface, SH and LE are the sensible and latent heat fluxes, respectively, and Lm is the latent heat of melting (3.34 × 10⁵ J kg−1). SWout and LWout are measured by AWS1 Forni, and SH and LE are calculated by applying bulk aerodynamic formulas as reported by Senese et al. [6]. All the fluxes are defined as positive when directed towards the surface. Melting occurs as soon as the surface temperature is at 0 °C and the numerator is positive [6,77].
Senese et al. [6] compared the melt amount derived from the energy balance model to field measurements at a selection of ablation stakes located near AWS1 Forni. They reported an excellent agreement between the measured and the modeled cumulative melts (about 3% underestimation), supporting the usefulness of the energy balance computation in assessing the actual melt amount at this site.

3.7. Comparison of Glacier Melt Amount from Observed and Estimated SWin and LWin

We investigated how much the results of Equation (11) change when estimated values are used for incoming shortwave and longwave radiation instead than measured ones (SWin-gl and LWin-gl). Specifically, we performed this analysis only for daily average values as the estimated shortwave and longwave radiation records are available at this resolution. We also used a shortwave incoming radiation record from satellite data (SWin-SARAH) and checked the advantages and disadvantages of using it in Equation (11) instead of the parametrized SWin records.
The comparisons were performed (see Table 3) by first introducing parametrized or satellite values in only one of the two incoming radiation terms and then by introducing them in both the shortwave and the longwave terms. The agreement between the melting records obtained with observed and parametrized/satellite radiation was estimated according to the error indexes presented in Section 3.1 and considering as reference the daily melt record obtained by considering SWin-gl and LWin-gl in Equation (11).

4. Results

Table 2 shows the main results obtained by comparing the estimated daily SWin (SWin-∆T and SWin-COMET) and LWin (LWin-∆T and LWin-COMET) values with corresponding values (SWin-gl and LWin-gl) measured at AWS1 Forni (June–August data of the 2006–2009 period). SWin-∆T and SWin-COMET values show a positive bias of about 11 and 8 W m−2, respectively, while LWin-∆T and LWin-COMET values show a negative bias of about 9 and 7 W m−2, respectively (Table 2). The common variance of measured and estimated SWin values is 66% for SWin-COMET and 51% for SWin-∆T, while corresponding values for LWin are 76% for LWin-COMET and 51% for LWin-∆T, respectively (Table 2). The comparison of LWin-COMET and LWin-gl is also shown in Figure 2b. Overall, statistical indicators (Table 2) show better performance for incoming radiation values obtained from cloudiness satellite data than for corresponding values obtained from daily temperature range measured at the closest off-glacier station. However, SWin-COMET has significantly lower performance than SWin-SARAH when it is compared with SWin-gl.
Table 3 shows the main results obtained comparing the values from Equation (11) applied using different combinations of estimated incoming radiation data (SWin-∆T, SWin-COMET, SWin-SARAH, LWin-∆T, and LWin-COMET) with those from the same equation applied using measured incoming radiation data (SWin-gl and LWin-gl).
These results highlight that parametrizing LWin introduces a smaller error in the modeled melting than parametrizing SWin. In fact, when parametrizing LWin only, the explained variance with M(SWin-gl,LWin-gl) is 98% when the parametrization is performed by means of cloudiness satellite data (M(SWin-gl,LWin-COMET)) and 96% when it is performed by means of daily temperature range data (M(SWin-gl,LWin-∆T)). In both situations, the modeled melting is underestimated with respect to M(SWin-gl,LWin-gl), showing an MBE of about −0.002 m w.e. per day. On the contrary, when parametrizing SWin only, the modeled melting shows a much lower explained variance with M(SWin-gl,LWin-gl). Specifically, the explained variance with M(SWin-gl,LWin-gl) turns out to be 75% if satellite solar radiation data are used (M(SWin-SARAH,LWin-gl)), while it reduces to 58% and 44% if SWin is obtained from cloudiness satellite data (M(SWin-COMET,LWin-gl)) and daily temperature range data (M(SWin-∆T,LWin-gl)), respectively. Parametrizing SWin only, the resulting MBE is always positive and equal to 0.001 m w.e. per day in the first case (M(SWin-SARAH,LWin-gl)) and 0.003 m. w.e. per day for the other two cases (M(SWin-COMET,LWin-gl) and M(SWin-∆T,LWin-gl)).
Considering the case in which neither SWin-gl nor LWin-gl are used in Equation (11), the best result is obtained when SWin is obtained from satellite solar radiation and LWin is parametrized by means of cloudiness satellite data (M(SWin-SARAH,LWin-COMET)). In this case, the common variance with M(SWin-gl,LWin-gl) turns out to be 73%, corresponding to a correlation index of 0.85. Using only cloudiness satellite data, the common variance of the modeled melting (M(SWin-COMET,LWin-COMET)) with M(SWin-gl,LWin-gl) reduces to 62% (corresponding to a correlation index of 0.79), and when using only daily temperature range data it reduces to 55% (corresponding to a correlation index of 0.74). The MBE values for all the situations range between 0.000 and 0.001 m w.e. per day.
Figure 3 shows the comparison of the progressive cumulative daily melting (m w.e.) curves for the four years of the 2006–2009 period obtained from M(SWin-SARAH,LWin-COMET) and M(SWin-gl,LWin-gl). The figure gives evidence that the agreement is good not only for the seasonal cumulated values but also for the single days. The days with the greatest disagreement are those which present high albedo values (due to fresh snow): they are probably interpreted as cloudy days by satellite measures. These periods are most evident in the first days of the June–August period when the glacier at the AWS1 Forni site is often covered by snow.

5. Discussion

The radiation record best fitting with measured short-wave incoming radiation values is indeed that of SARAH 2.1, which shows the lowest MBE and MAE (2.0 and 34.9 W m−2, respectively) and the highest common variance (73%). However, the very low bias we find cannot be generalized trivially to other glacier sites, because both ground-based and satellite radiation measures can be significantly biased in complex orography contexts. In fact, on one hand, ground-based measures can be underestimated by shading or overestimated by reflected radiation from surrounding snow-covered surfaces; on the other hand, satellite measures can be underestimated due to high albedo of snow-covered ground being incorrectly interpreted as cloudiness [66]. These issues are fortunately not so relevant for the AWS1 Forni site because the station exposure ensures limited shading in summer, and fresh snow events that cause high albedo over a relevant fraction of the SARAH grid-cell are not frequent. However, such problems can make a comparison between ground-based and satellite solar radiation measures in complex orographic contexts very problematic.
Unfortunately, for LWin SARAH 2.1, data are available only at monthly resolution, thus not permitting the same comparison. However, satellite data are also found to be the best solution for modeling LWin when COMET cloudiness data are used compared to ∆Tdam. Therefore, our results suggest that satellite input data show better performance compared to surface observations from a close off-glacier site for the estimation of on-glacier incoming radiation. The good performance of on-glacier incoming radiation data obtained by means of satellite records is also evident when they are used in Equation (11) instead of on-glacier incoming radiation measures: in this case, in fact, the use of estimated radiation values does not introduce any bias in the daily melt record, and MAE and RMSE correspond to 8 and 10 mm w.e. per day, respectively.
Interestingly, parametrizing LWin only introduces a slight underestimation of the estimated melt, whereas parametrizing SWin only involves a slight overestimation of it. In addition, parametrizing LWin only entails much higher common variance than parametrizing SWin only when the melt record is compared with the one obtained using measured incoming radiation data in Equation (11).

6. Conclusions

In this paper, focusing on one of the few glaciers with a supraglacial automatic meteorological station (Forni Glacier), we have investigated several methods of estimating incoming short- and long-wave radiation at a glacier surface by means of satellite records and/or off-glacier surface observations. Moreover, we have compared the daily melt records for four summer seasons (2006–2009) obtained when incoming estimated radiation data are used in an energy balance model with those obtained from the same model when correspondent on-glacier measured data are used.
The analyses have highlighted that the use of satellite data gives indeed much better estimations of on-glacier short- and long-wave incoming radiation that the parametrization of off-glacier surface observations. Moreover, as the reliability of the results of the energy balance model depends on the input data, satellite records also give better results for the estimation of glacier melt, suggesting that satellite data should be preferred over off-glacier surface observations whenever on-glacier measured radiative fluxes are not available.
The results we found for the Forni glacier cannot be generalized trivially to other glacier sites, because both satellite data and ground-based measures can be significantly biased in complex orography contexts. The former can in fact be influenced by high albedo of snow-covered ground being incorrectly interpreted as cloudiness, whereas the latter can be affected by shading and/or by reflected radiation from surrounding snow-covered surfaces. Such problems can make a comparison between ground-based and satellite solar radiation measures in complex orographic contexts very problematic.
In spite of these potential problems, the case study discussed in this paper highlights that satellite observations are a very important resource for better monitoring and modeling of glacier melt processes; they will become even more important in the future as the availability and quality of these observations are becoming more relevant every day.
An example where satellite data can represent a precious resource is the Central Karakoram National Park (CKNP, Pakistan) where about 700 glaciers are located, covering an area of about 4600 km2. Previous studies estimated the fresh water derived from the CKNP glaciers by applying an enhanced T-index model, which is easier when compared to the energy balance one [78,79]. Taking into account the methodology proposed in this paper could lead to more reliable SWin and LWin modeling and thus to more accurate meltwater quantification. Another example is represented by a hydrology study focused upon the Maipo River in Chile [80], a semi-arid area with mostly dry summer and rain in winter and where snow and glacier melt accounts for up to 70–80% of summer runoff. In this case, introducing SWin and LWin modeled by means of the methodology proposed in this paper could also facilitate a more reliable quantification of snow/ice melting. The Hindu Kush and Himalayan (HKH) chain is a final example of areas where remote sensing can play a crucial role in providing data to compute ice- and snowmelt. This area is the origin of 10 major river basins and encompasses over 4.2 million km2 area [81]. The HKH area and the Tien Shan mountains form the largest area of permanent ice cover outside of the North and South Poles (hence the occasional reference to the HKH as the “Third Pole”). For this area, the methodology proposed in this paper could also lead to more reliable modeling of incoming radiation and thus to more accurate quantification of ice- and snowmelt.
This work has explored parameterizations of radiative fluxes as a crucial component of the summer glacier energy balance. In the future, it might be interesting to investigate such fluxes for the whole year because snowmelt processes at the glacier surface also occur before June [77]. Detecting the occurrence of snowmelt is important, for instance, in studying snow avalanches [82] or permafrost phenomena [83]. Moreover, the correct assessment of snow ablation in addition to ice ablation is also fundamental in studies aimed at computing the hydrological budget or the glacier mass balance [4].

Author Contributions

Conceptualization, A.S., V.M., M.M. and G.A.D.; validation, A.S., V.M., M.M. and G.A.D.; formal analysis, A.S., V.M., M.M. and G.A.D; methodology, A.S., V.M., M.M. and G.A.D; data curation, A.S., V.M., M.M. and G.A.D.; writing—original draft preparation, A.S., V.M., M.M. and G.A.D.; writing—review and editing, A.S., V.M., M.M. and G.A.D. All authors have read and agreed to the published version of the manuscript.

Funding

This work has been supported by Agroalimentare E Ricerca (Ager), under Grant 2017–1176 within the project IPCC-MOUPA (Interdisciplinary project for assessing current and expected Climate Change impacts on MOUntain Pastures). The authors are thankful to the Department for Regional Affairs and Autonomies (DARA) of the Italian Presidency of the Council of Ministers and Levissima Sanpellegrino S.p.A. for funding this research. Moreover, Stelvio National Park (ERSAF) kindly supported data analyses. Finally, we are also grateful for the support of AlbaOptics.

Acknowledgments

Stelvio National Park (ERSAF) hosts AWS1 Forni and AWS Forni SPICE at the surface of the Forni Glacier, thus making possible the launch of glacier micro-meteorology in Italy. Our gratitude also goes to EUMETSAT CM SAF and Federal Office of Meteorology and Climatology MeteoSwiss (Meteo Swiss—http://www.meteoswiss.admin.ch/home.html) for providing the cloudiness data and ARPA Lombardia for temperature data of the Frodolfo dam station.

Conflicts of Interest

The authors declare no conflict of interest. The funders had no role in the design of the study; in the collection, analyses, or interpretation of data; in the writing of the manuscript; or in the decision to publish the results.

References

  1. Brunetti, M.; Lentini, G.; Maugeri, M.; Nanni, T.; Auer, I.; Böhm, R.; Schöner, W. Climate variability and change in the Greater Alpine Region over the last two centuries based on multi-variable analysis. Int. J. Clim. 2009, 29, 2197–2225. [Google Scholar] [CrossRef]
  2. Haeberli, W.; Beniston, M. Climate change and its impacts on glaciers and permafrost in the Alps. Ambio 1998, 27, 258–265. [Google Scholar]
  3. Gobiet, A.; Kotlarski, S.; Beniston, M.; Heinrich, G.; Rajczak, J.; Stoffel, M. 21st century climate change in the European Alps—A review. Sci. Total Environ. 2014, 493, 1138–1151. [Google Scholar] [CrossRef] [PubMed]
  4. Hock, R. Glacier melt: A review of processes and their modelling. Prog. Phys. Geogr. Earth Environ. 2005, 29, 362–391. [Google Scholar] [CrossRef]
  5. Oerlemans, J.; Oerlemansutrecht, J. Analysis of a 3 year meteorological record from the ablation zone of Morteratschgletscher, Switzerland: Energy and mass balance. J. Glaciol. 2000, 46, 571–579. [Google Scholar] [CrossRef] [Green Version]
  6. Senese, A.; Diolaiuti, G.; Mihalcea, C.; Smiraglia, C. Energy and mass balance of Forni Glacier (Stelvio National Park, Italian Alps) from a 4-year meteorological data record. Arct. Antarct. Alp. Res. 2012, 44, 122–134. [Google Scholar] [CrossRef] [Green Version]
  7. Manara, V.; Brunetti, M.; Celozzi, A.; Maugeri, M.; Sanchez-Lorenzo, A.; Wild, M. Detection of dimming/brightening in Italy from homogenized all-sky and clear-sky surface solar radiation records and underlying causes (1959–2013). Atmos. Chem. Phys. Discuss. 2016, 16, 11145–11161. [Google Scholar] [CrossRef] [Green Version]
  8. Manara, V.; Bassi, M.; Brunetti, M.; Cagnazzi, B.; Maugeri, M. 1990–2016 surface solar radiation variability and trend over the Piedmont region (northwest Italy). Theor. Appl. Clim. 2019, 136, 849–862. [Google Scholar] [CrossRef]
  9. Pellicciotti, F.; Raschle, T.; Huerlimann, T.; Carenzo, M.; Burlando, P. Transmission of solar radiation through clouds on melting glaciers: A comparison of parameterizations and their impact on melt modelling. J. Glaciol. 2011, 57, 367–381. [Google Scholar] [CrossRef] [Green Version]
  10. Müller, H. On the radiation budget in the alps. J. Clim. 1985, 5, 445–462. [Google Scholar] [CrossRef]
  11. Granger, R.J.; Gray, D.M. A Net Radiation Model for Calculating Daily Snowmelt in Open Environments. Hydrol. Res. 1990, 21, 217–234. [Google Scholar] [CrossRef]
  12. Conway, J.P.; Cullen, N.J. Cloud effects on surface energy and mass balance in the ablation area of Brewster Glacier, New Zealand. Cryosphere 2016, 10, 313–328. [Google Scholar] [CrossRef] [Green Version]
  13. Iziomon, M.; Mayer, H.; Matzarakis, A. Downward atmospheric longwave irradiance under clear and cloudy skies: Measurement and parameterization. J. Atmos. Sol. Terr. Phys. 2003, 65, 1107–1116. [Google Scholar] [CrossRef]
  14. Choi, M.; Jacobs, J.M.; Kustas, W.P. Assessment of clear and cloudy sky parameterizations for daily downwelling longwave radiation over different land surfaces in Florida, USA. Geophys. Res. Lett. 2008, 35. [Google Scholar] [CrossRef] [Green Version]
  15. Zhang, T.; Stamnes, K.; Bowling, S.A. Impact of Clouds on Surface Radiative Fluxes and Snowmelt in the Arctic and Subarctic. J. Clim. 1996, 9, 2110–2123. [Google Scholar] [CrossRef]
  16. Hock, R.; Noetzli, C. Areal melt and discharge modeling of Storgläciaren, Sweden. Ann. Glaciol. 1997, 24, 997. [Google Scholar] [CrossRef] [Green Version]
  17. Senese, A.; Maugeri, M.; Ferrari, S.; Confortola, G.; Soncini, A.; Bocchiola, D.; Diolaiuti, G. 2016: Modelling shortwave and longwave downward radiation and air temperature driving ablation at the Forni Glacier (Stelvio National Park, Italy). Geogr. Fis. Dinam. Quat. 2016, 39, 89–100. [Google Scholar]
  18. Iqbal, M. An Introduction to Solar Radiation; Academic Press: Orlando, FL, USA, 1983. [Google Scholar]
  19. Frederick, J.E.; Steele, H.D. The Transmission of Sunlight through Cloudy Skies: An Analysis Based on Standard Meteorological Information. J. Appl. Meteorol. 1995, 34, 2755–2761. [Google Scholar] [CrossRef] [Green Version]
  20. Xu, K.M.; Randall, D.A. A semiempirical cloudiness parameterization for use in climate models. J. Atmos. Sci. 1996, 53, 3084–3102. [Google Scholar] [CrossRef] [Green Version]
  21. Shonk, J.K.; Hogan, R.J.; Edwards, J.M.; Mace, G.G. Effect of improving representation of horizontal and vertical cloud structure on the Earth’s global radiation budget. Part I: Review and parametrization. Q. J. R. Meteorol. Soc. 2010, 136, 1191–1204. [Google Scholar] [CrossRef] [Green Version]
  22. Morcrette, C.J.; O’Connor, E.J.; Petch, J.C. Evaluation of two cloud parametrization schemes using ARM and Cloud-Net observations. Q. J. R. Meteorol. Soc. 2012, 138, 964–979. [Google Scholar] [CrossRef]
  23. Bristow, K.L.; Campbell, G.S. On the relationship between incoming solar radiation and daily maximum and minimum temperature. Agric. For. Meteorol. 1984, 31, 159–166. [Google Scholar] [CrossRef]
  24. Campbell, G.G.; Haar, T.H.V. Comparison of surface temperature minimum and maximum and satellite measured cloudiness and radiation budget. J. Geophys. Res. Space Phys. 1997, 102, 16639–16645. [Google Scholar] [CrossRef]
  25. Thornton, P.E.; Running, S.W. An improved algorithm for estimating incident daily solar radiation from measurements of temperature, humidity, and precipitation. Agric. For. Meteorol. 1999, 93, 211–228. [Google Scholar] [CrossRef]
  26. Paul, F.; Kääb, A.; Maisch, M.; Kellenberger, T.W.; Haeberli, W. The new remote-sensing-derived Swiss glacier inventory I. Methods. Ann. Glaciol. 2002, 34, 355–361. [Google Scholar] [CrossRef] [Green Version]
  27. Paul, F.; Frey, H.; Le Bris, R. A new glacier inventory for the European Alps from Landsat TM scenes of 2003: Challenges and results. Ann. Glaciol. 2011, 52, 144–152. [Google Scholar] [CrossRef] [Green Version]
  28. Paul, F.; Barrand, N.; Baumann, S.; Berthier, E.; Bolch, T.; Casey, K.; Frey, H.; Joshi, S.; Konovalov, V.; Le Bris, R.; et al. On the accuracy of glacier outlines derived from remote-sensing data. Ann. Glaciol. 2013, 54, 171–182. [Google Scholar] [CrossRef] [Green Version]
  29. Paul, F.; Bolch, T.; Briggs, K.; Kääb, A.; McMillan, M.; McNabb, R.; Nagler, T.; Nuth, C.; Rastner, P.; Strozzi, T.; et al. Error sources and guidelines for quality assessment of glacier area, elevation change, and velocity products derived from satellite data in the Glaciers_cci project. Remote Sens. Environ. 2017, 203, 256–275. [Google Scholar] [CrossRef] [Green Version]
  30. Pellikka, P.; Rees, W.G. Remote sensing of glaciers: Techniques for topographic, spatial, and thematic mapping of glaciers. In Remote Sensing of Glacier, 1st ed.; CRC Press: Cleveland, OH, USA, 2009. [Google Scholar]
  31. Racoviteanu, A.E.; Paul, F.; Raup, B.; Khalsa, S.J.S.; Armstrong, R. Challenges in glacier mapping from space: Recommendations from the Global Land Ice Measurements from Space (GLIMS) initiative. Ann. Glaciol. 2009, 50, 53–69. [Google Scholar] [CrossRef] [Green Version]
  32. Fischer, M.; Huss, M.; Barboux, C.; Hoelzle, M. The New Swiss Glacier Inventory SGI2010: Relevance of Using High-Resolution Source Data in Areas Dominated by Very Small Glaciers. Arct. Antarct. Alp. Res. 2014, 46, 933–945. [Google Scholar] [CrossRef] [Green Version]
  33. Kääb, A.; Winsvold, S.H.; Altena, B.; Nuth, C.; Nagler, T.; Wuite, J. Glacier Remote Sensing Using Sentinel-2. Part I: Radiometric and Geometric Performance, and Application to Ice Velocity. Remote Sens. 2016, 8, 598. [Google Scholar] [CrossRef] [Green Version]
  34. Minora, U.; Bocchiola, D.; D’Agata, C.; Maragno, D.; Mayer, C.; Lambrecht, A.; Vuillermoz, E.; Senese, A.; Compostella, C.; Smiraglia, C.; et al. Glacier area stability in the Central Karakoram National Park (Pakistan) in 2001–2010: The “Karakoram Anomaly” in the spotlight. Prog. Phys. Geogr. Earth Environ. 2016, 40, 629–660. [Google Scholar] [CrossRef]
  35. Mölg, N.; Bolch, T.; Rastner, P.; Strozzi, T.; Paul, F. A consistent glacier inventory for Karakoram and Pamir derived from Landsat data: Distribution of debris cover and mapping challenges. Earth Syst. Sci. Data 2018, 10, 1807–1827. [Google Scholar] [CrossRef] [Green Version]
  36. Azzoni, R.S.; Sarıkaya, M.A.; Fugazza, D. Turkish glacier inventory and classification from high-resolution satellite data. Mediterr. Geosci. Rev. 2020, 2, 153–162. [Google Scholar] [CrossRef]
  37. Rabatel, A.; Francou, B.; Soruco, A.; Gomez, J.; Cáceres, B.; Ceballos, J.L.; Basantes, R.; Vuille, M.; Sicart, J.-E.; Huggel, C.; et al. Current state of glaciers in the tropical Andes: A multi-century perspective on glacier evolution and climate change. Cryosphere 2013, 7, 81–102. [Google Scholar] [CrossRef] [Green Version]
  38. Rabatel, A.; Ceballos, J.L.; Micheletti, N.; Jordan, E.; Braitmeier, M.; González, J.; Mölg, N.; Ménégoz, M.; Huggel, C.; Zemp, M. Toward an imminent extinction of Colombian glaciers? Geogr. Ann. Ser. A Phys. Geogr. 2018, 100, 75–95. [Google Scholar] [CrossRef]
  39. Gardent, M.; Rabatel, A.; Dedieu, J.-P.; Deline, P. Multitemporal glacier inventory of the French Alps from the late 1960s to the late 2000s. Glob. Planet. Chang. 2014, 120, 24–37. [Google Scholar] [CrossRef]
  40. Diolaiuti, G.A.; Azzoni, R.S.; D’Agata, C.; Maragno, D.; Fugazza, D.; Vagliasindi, M.; Mortara, G.; Perotti, L.; Bondesan, A.; Carton, A.; et al. Present extent, features and regional distribution of Italian glaciers. LHB 2019, 159–175. [Google Scholar] [CrossRef]
  41. Paul, F.; Rastner, P.; Azzoni, R.S.; Diolaiuti, G.A.; Fugazza, D.; Le Bris, R.; Nemec, J.; Rabatel, A.; Ramusovic, M.; Schwaizer, G.; et al. Glacier shrinkage in the Alps continues unabated as revealed by a new glacier inventory from Sentinel-2. Earth Syst. Sci. Data 2020, 12, 1805–1821. [Google Scholar] [CrossRef]
  42. Paul, F.; Winsvold, S.H.; Kääb, A.; Nagler, T.; Schwaizer, G. Glacier Remote Sensing Using Sentinel-2. Part II: Mapping Glacier Extents and Surface Facies, and Comparison to Landsat 8. Remote Sens. 2016, 8, 575. [Google Scholar] [CrossRef] [Green Version]
  43. Millan, R.; Mouginot, J.; Rabatel, A.; Jeong, S.; Cusicanqui, D.; Derkacheva, A.; Chekki, M. Mapping Surface Flow Velocity of Glaciers at Regional Scale Using a Multiple Sensors Approach. Remote Sens. 2019, 11, 2498. [Google Scholar] [CrossRef] [Green Version]
  44. Oerlemans, J.; Giesen, R.; Broeke, M.V.D. Retreating alpine glaciers: Increased melt rates due to accumulation of dust (Vadret da Morteratsch, Switzerland). J. Glaciol. 2009, 55, 729–736. [Google Scholar] [CrossRef] [Green Version]
  45. Mihalcea, C.; Brock, B.W.; Diolaiuti, G.A.; D’Agata, C.; Citterio, M.; Kirkbride, M.; Cutler, M.E.J.; Smiraglia, C. Using ASTER satellite and ground-based surface temperature measurements to derive supraglacial debris cover and thickness patterns on Miage Glacier (Mont Blanc Massif, Italy). Cold Reg. Sci. Technol. 2008, 52, 341–354. [Google Scholar] [CrossRef]
  46. Mihalcea, C.; Mayer, C.; Diolaiuti, G.A.; D’Agata, C.; Smiraglia, C.; Lambrecht, A.; Vuillermoz, E.; Tartari, G. Spatial distribution of debris thickness and melting from remote-sensing and meteorological data, at debris-covered Baltoro glacier, Karakoram, Pakistan. Ann. Glaciol. 2008, 48, 49–57. [Google Scholar] [CrossRef] [Green Version]
  47. Azzoni, R.S.; Fugazza, D.; Zerboni, A.; Senese, A.; D’Agata, C.; Maragno, D.; Carzaniga, A.; Cernuschi, M.; Diolaiuti, G.A. Evaluating high-resolution remote sensing data for reconstructing the recent evolution of supra glacial debris. Prog. Phys. Geogr. Earth Environ. 2018, 42, 3–23. [Google Scholar] [CrossRef] [Green Version]
  48. Klok, E.J.; Greuell, W.; Oerlemans, J. Temporal and spatial variation of the surface albedo of Morteratschgletscher, Switzerland, as derived from 12 Landsat images. J. Glaciol. 2003, 49, 491–502. [Google Scholar] [CrossRef] [Green Version]
  49. Fugazza, D.; Senese, A.; Azzoni, R.S.; Maugeri, M.; Diolaiuti, G.A. Spatial distribution of surface albedo at the Forni Glacier (Stelvio National Park, Central Italian Alps). Cold Reg. Sci. Technol. 2016, 125, 128–137. [Google Scholar] [CrossRef]
  50. Traversa, G.; Fugazza, D.; Senese, A.; Diolaiuti, G.A. Preliminary results on Antarctic albedo from remote sensing observations. Geogr. Fis. Din. Quat. 2019, 42, 245–254. [Google Scholar]
  51. Fugazza, D.; Senese, A.; Azzoni, R.S.; Maugeri, M.; Maragno, D.; Diolaiuti, G.A. New evidence of glacier darkening in the Ortles-Cevedale group from Landsat observations. Glob. Planet. Chang. 2019, 178, 35–45. [Google Scholar] [CrossRef]
  52. Brown, M.E.; Racoviteanu, A.; Tarboton, D.; Gupta, A.S.; Nigro, J.; Policelli, F.; Habib, S.; Tokay, M.; Shrestha, M.; Bajracharya, S.; et al. An integrated modeling system for estimating glacier and snow melt driven streamflow from remote sensing and earth system data products in the Himalayas. J. Hydrol. 2014, 519, 1859–1869. [Google Scholar] [CrossRef] [Green Version]
  53. Minora, U.; Godone, D.; Lorenzini, S.; D’agata, C.; Bocchiola, D.; Barcaza Sepulveda, G.; Smiraglia, C.; Diolaiuti, G.A. 2008–2011 snow cover area (SCA) variability over 18 watersheds of the central Chile through MODIS data. Geogr. Fis. Dinam. Quat. 2015, 38. [Google Scholar] [CrossRef]
  54. Dong, C.; Menzel, L. Producing cloud-free MODIS snow cover products with conditional probability interpolation and meteorological data. Remote Sens. Environ. 2016, 186, 439–451. [Google Scholar] [CrossRef]
  55. Hall, D.; Kelly, R.E.J.; Riggs, G.A.; Chang, A.T.C.; Foster, J.L. Assessment of the relative accuracy of hemispheric-scale snow-cover maps. Ann. Glaciol. 2002, 34, 24–30. [Google Scholar] [CrossRef] [Green Version]
  56. Tsai, Y.-L.S.; Dietz, A.J.; Oppelt, N.; Kuenzer, C. Remote Sensing of Snow Cover Using Spaceborne SAR: A Review. Remote Sens. 2019, 11, 1456. [Google Scholar] [CrossRef] [Green Version]
  57. De Gregorio, L.; Callegari, M.; Marin, C.; Zebisch, M.; Bruzzone, L.; Demir, B.; Strasser, U.; Marke, T.; Günther, D.; Nadalet, R.; et al. A Novel Data Fusion Technique for Snow Cover Retrieval. IEEE J. Sel. Top. Appl. Earth Obs. Remote Sens. 2019, 12, 2862–2877. [Google Scholar] [CrossRef] [Green Version]
  58. Gascoin, S.; Grizonnet, M.; Bouchet, M.; Salgues, G.; Hagolle, O. Theia Snow collection: High-resolution operational snow cover maps from Sentinel-2 and Landsat-8 data. Earth Syst. Sci. Data 2019, 11, 493–514. [Google Scholar] [CrossRef] [Green Version]
  59. Touzi, R.; Hong, G.; Motohka, T.; Shinichi, S.; De Lisle, D. Investigation of Compact SAR L and C band Complementarity for Permafrost Characterization In Arctic Regions. In Proceedings of the 2019 IEEE International Geoscience and Remote Sensing Symposium, Yokohama, Japan, 28 July–2 August 2019; pp. 4665–4667. [Google Scholar]
  60. Fugazza, D.F.; Shaw, T.E.; Mashtayeva, S.; Brock, B.W. Inter-annual variability in snow cover depletion patterns and atmospheric circulation indices in the Upper Irtysh basin, Central Asia. Hydrol. Process. 2020, 34, 3738–3757. [Google Scholar] [CrossRef]
  61. Pfeifroth, U.; Sanchez-Lorenzo, A.; Manara, V.; Trentmann, J.; Hollmann, R. Trends and Variability of Surface Solar Radiation in Europe Based on Surface- and Satellite-Based Data Records. J. Geophys. Res. Atmos. 2018, 123, 1735–1754. [Google Scholar] [CrossRef]
  62. Pfeifroth, U.; Kothe, S.; Trentmann, J.; Hollmann, R.; Fuchs, P.; Kaiser, J.; Werscheck, M. Surface Radiation Data Set—Heliosat (SARAH)—Edition 2.1. Satell. Appl. Facil. Clim. Monit. 2019. [Google Scholar] [CrossRef]
  63. Stöckli, R.; Duguay–Tetzlaff, A.; Bojanowski, J.; Hollmann, R.; Fuchs, P.; Werscheck, M. CM SAF ClOud Fractional Cover dataset from METeosat First and Second Generation—Edition 1 (COMET Ed. 1). Satell. Appl. Facil. Clim. Monit. 2017. [Google Scholar] [CrossRef]
  64. Bojanowski, J.; Stöckli, R.; Duguay-Tetzlaff, A.; Finkensieper, S.; Hollmann, R. Performance Assessment of the COMET Cloud Fractional Cover Climatology across Meteosat Generations. Remote Sens. 2018, 10, 804. [Google Scholar] [CrossRef] [Green Version]
  65. Manara, V.; Brunetti, M.; Gilardoni, S.; Landi, T.C.; Maugeri, M. 1951–2017 changes in the frequency of days with visibility higher than 10 km and 20 km in Italy. Atmos. Environ. 2019, 214, 116861. [Google Scholar] [CrossRef]
  66. Haiden, T.; Trentmann, J. Verification of cloudiness and radiation forecasts in the greater Alpine region. Meteorol. Z. 2016, 25, 3–15. [Google Scholar] [CrossRef]
  67. Senese, A.; Diolaiuti, G.; Verza, G.P.; Smiraglia, C. Surface energy budget and melt amount for the years 2009 and 2010 at the Forni Glacier (Italian Alps, Lombardy). Geogr. Fis. Din. Quat. 2012, 35, 69–77. [Google Scholar]
  68. Gambelli, S.; Senese, A.; D’agata, C.; Smiraglia, C.; Diolaiuti, G. Preliminary analysis for distribution of the surface energy budget of the Forni Glacier, Valtellina (Ortles-Cevedale Group, Italy). Geogr. Fis. Din. Quat. 2014, 37, 15–22. [Google Scholar] [CrossRef]
  69. Azzoni, R.S.; Senese, A.; Zerboni, A.; Maugeri, M.; Smiraglia, C.; Diolaiuti, G.A. Estimating ice albedo from fine debris cover quantified by a semi-automatic method: The case study of Forni Glacier, Italian Alps. Cryosphere 2016, 10, 665–679. [Google Scholar] [CrossRef] [Green Version]
  70. Senese, A.; Maugeri, M.; Meraldi, E.; Verza, G.P.; Azzoni, R.S.; Compostella, C.; Diolaiuti, G.A. Estimating the snow water equivalent on a glacierized high elevation site (Forni Glacier, Italy). Cryosphere 2018, 12, 1293–1306. [Google Scholar] [CrossRef] [Green Version]
  71. Garen, D.C.; Marks, D. Spatially distributed energy balance snowmelt modelling in a mountainous river basin: Estimation of meteorological inputs and verification of model results. J. Hydrol. 2005, 315, 126–153. [Google Scholar] [CrossRef]
  72. Anslow, F.S.; Hostetler, S.; Bidlake, W.R.; Clark, P.U. Distributed energy balance modeling of South Cascade Glacier, Washington and assessment of model uncertainty. J. Geophys. Res. Space Phys. 2008, 113, 02019. [Google Scholar] [CrossRef] [Green Version]
  73. Sauberer, F. Zur Abschätzung der Globalstrahlung in verschiedenen Höhenstufen der Ostalpen. Wetter Leben 1955, 7, 22–29. (In German) [Google Scholar]
  74. Konzelmann, T.; Van De Wal, R.S.; Greuell, W.; Bintanja, R.; Henneken, E.A.; Abe-Ouchi, A. Parameterization of global and longwave incoming radiation for the Greenland Ice Sheet. Glob. Planet. Chang. 1994, 9, 143–164. [Google Scholar] [CrossRef]
  75. Greuell, W.; Knap, W.H.; Smeets, P.C. Elevational changes in meteorological variables along a midlatitude glacier during summer. J. Geophys. Res. Space Phys. 1997, 102, 25941–25954. [Google Scholar] [CrossRef]
  76. Wexler, A. Vapor pressure formulation for water in range 0 to 100 C. A revision. J. Res. Natl. Bur. Stand. Sect. A Phys. Chem. 1976, 80A, 775–785. [Google Scholar] [CrossRef] [PubMed]
  77. Senese, A.; Maugeri, M.; Vuillermoz, E.; Smiraglia, C.; Diolaiuti, G.A. Using daily air temperature thresholds to evaluate snow melting occurrence and amount on Alpine glaciers by T-index models: The case study of the Forni Glacier (Italy). Cryosphere 2014, 8, 1921–1933. [Google Scholar] [CrossRef] [Green Version]
  78. Minora, U.; Senese, A.; Bocchiola, D.; Soncini, A.; D’Agata, C.; Ambrosini, R.; Mayer, C.; Lambrecht, A.; Vuillermoz, E.; Smiraglia, C.; et al. A simple model to evaluate ice melt over the ablation area of glaciers in the Central Karakoram National Park, Pakistan. Ann. Glaciol. 2015, 56, 202–216. [Google Scholar] [CrossRef] [Green Version]
  79. Senese, A.; Maragno, D.; Fugazza, D.F.; Soncini, A.; D’Agata, C.; Azzoni, R.S.; Minora, U.; Ul-Hassan, R.; Vuillermoz, E.; Khan, M.A.; et al. Inventory of glaciers and glacial lakes of the Central Karakoram National Park (CKNP—Pakistan). J. Maps 2018, 14, 189–198. [Google Scholar] [CrossRef]
  80. Bocchiola, D.; Soncini, A.; Senese, A.; Diolaiuti, G.A. Modelling Hydrological Components of the Rio Maipo of Chile, and Their Prospective Evolution under Climate Change. Climate 2018, 6, 57. [Google Scholar] [CrossRef] [Green Version]
  81. Bajracharya, S.R.; Maharjan, S.B.; Shrestha, F.; Guo, W.-Q.; Liu, S.; Immerzeel, W.; Shrestha, B. The glaciers of the Hindu Kush Himalayas: Current status and observed changes from the 1980s to 2010. Int. J. Water Resour. Dev. 2015, 31, 161–173. [Google Scholar] [CrossRef] [Green Version]
  82. Luckman, B.H. The Geomorphic Activity of Snow Avalanches. Geograf. Ann. Ser. A 1977, 59, 31–48. [Google Scholar] [CrossRef]
  83. Ling, F.; Zhang, T. Impact of the timing and duration of seasonal snow cover on the active layer and permafrost in the Alaskan Arctic. Permafr. Periglac. Process. 2003, 14, 141–150. [Google Scholar] [CrossRef]
Figure 1. The Forni Glacier study area (the glacier boundary is marked by the red line). The main panel in the upper part of the figure shows the locations of AWS1 Forni (yellow triangle), Frodolfo dam station (orange triangle), and the center of CM SAF COMET and CM SAF SARAH grid-cells relative to AWS Forni site (yellow and blue squares, respectively); the upper right panel also shows the Bernina Pass station (green triangle) and the center of the corresponding CM SAF COMET grid-cell (green square). The lower part of the figure shows the study area (yellow star indicates AWS1 Forni) as it is observed from the Rifugio Branca during summer season.
Remotesensing 12 03719 g001
Figure 2. (a) Daily incoming short-wave radiation SWin-SARAH (W m−2) versus SWin-gl (W m−2) for the summer months (June to August) of the 2006–2009 period. (b) Daily incoming long-wave radiation LWin-COMET (W m−2) versus LWin-gl (W m−2) for the summer months (June to August) of the 2006–2009 period. In order to allow a better comparison between the considered datasets, the bisector lines are also shown in the two panels.
Remotesensing 12 03719 g002
Figure 3. Progressive cumulative daily melting (m w.e.) for the four years of the 2006–2009 period obtained from M(SWin-SARAH,LWin-COMET) (red line) and M(SWin-gl,LWin-gl) (black line).
Remotesensing 12 03719 g003
Table 1. Models adopted to test the parametrization of cloud transmissivity (τ) by means of the daily temperature range acquired at the off-glacier Frodolfo dam station (ΔTdam).
ModelEquation
Linear τ = a Δ T dam + b
Polynomial τ = a Δ T dam 2 + b Δ T dam + c
Exponential τ =   ae b Δ T dam
Gaussian τ = ae Δ T dam b c 2
Table 2. Mean bias error (MBE), mean absolute error (MAE), root mean square error (RMSE), bias removed root mean square error (BRRMSE), and common variance (R2) obtained comparing estimated daily shortwave incoming radiation (SWin-∆T and SWin-COMET) and longwave incoming radiation (LWin-∆T and LWin-COMET) values with corresponding values measured at AWS1 Forni (SWin-gl and LWin-gl). For comparison, we also report the same results presented in Section 2 for the comparison between SWin-gl and SWin-SARAH.
MBEMAERMSEBRRMSER2
SWin-SARAH (W m−2)2.034.944.444.40.73
SWin-∆T (W m−2)10.847.560.659.70.51
SWin-COMET (W m−2)8.142.052.251.60.66
LWin-∆T (W m−2)−9.414.819.517.00.51
LWin-COMET (W m−2)−6.910.713.611.80.76
Table 3. MBE, MAE, RMSE, BRRMSE, and R2 obtained comparing daily melt from Equation (11) estimated by means of different combinations of estimated short- and long-wave incoming radiation values with the one modeled using measured incoming radiation data values (SWin-gl and LWin-gl). The table also shows the cumulative summer (June–August period) melting (m w.e.) from 2006–2009.
Cumulative Melting (m w.e.)
MBEMAERMSEBRRMSER22006200720082009
M(SWin-gl,LWin-gl) 3.643.543.853.66
M(SWin-gl,LWin-COMET)−0.0020.0030.0030.0030.983.493.343.713.52
M(SWin-gl,LWin-∆T)−0.0020.0040.0050.0040.963.393.263.723.46
M(SWin-SARAH,LWin-gl)0.0010.0080.0110.0110.753.833.683.773.80
M(SWin-COMET,LWin-gl)0.0030.0110.0130.0130.583.733.894.093.81
M(SWin-∆T,LWin-gl)0.0030.0120.0160.0150.443.934.003.983.87
M(SWin-SARAH,LWin-COMET)0.0000.0080.0100.0100.733.673.493.633.65
M(SWin-COMET,LWin-COMET)0.0010.0100.0120.0120.623.573.693.953.66
M(SWin-∆T,LWin-∆T)0.0010.0110.0130.0130.553.673.713.853.65
Publisher’s Note: MDPI stays neutral with regard to jurisdictional claims in published maps and institutional affiliations.

