Dust Dispersion and Its Effect on Vegetation Spectra at Canopy and Pixel Scales in an Open-Pit Mining Area
by
Baodong Ma
1,2,*, 
Xuexin Li
1,2,
Ziwei Jiang
1,2,
Ruiliang Pu
3, 
Aiman Liang
1,2 and
Defu Che
1,2 1
Key Laboratory of Ministry of Education on Safe Mining of Deep Metal Mines, Northeastern University, Shenyang 110819, China
2
Institute for Geoinformatics & Digital Mine Research, Northeastern University, Shenyang 110819, China
3
School of Geosciences, University of South Florida, Tampa, FL 33620, USA
*
Author to whom correspondence should be addressed.
Remote Sens. 2020, 12(22), 3759; https://doi.org/10.3390/rs12223759
Submission received: 24 September 2020
/
Revised: 1 November 2020
/
Accepted: 12 November 2020
/
Published: 16 November 2020
(This article belongs to the Special Issue Multispectral and Hyperspectral Remote Sensing Data for Mineral Exploration and Environmental Monitoring of Mined Areas)
Abstract
:Dust pollution is severe in some mining areas in China due to rapid industrial development. Dust deposited on the vegetation canopy may change its spectra. However, a relationship between canopy spectra and dust amount has not been quantitatively studied, and a pixel-scale condition for remote sensing application has not been considered yet. In this study, the dust dispersion characteristics in an iron mining area were investigated using the American Meteorological Society (AMS) and the U.S. Environmental Protection Agency (EPA) regulatory model (AERMOD). Further, based on the three-dimensional discrete anisotropic radiative transfer (DART) model, the spectral characteristics of vegetation canopy under the dusty condition were simulated, and the influence of dustfall on vegetation canopy spectra was studied. Finally, the dust effect on vegetation spectra at the canopy scale was extended to a pixel scale, and the response of dust effect on vegetation spectra at the pixel scale was determined under different fractional vegetation covers (FVCs). The experimental results show that the dust pollution along a haul road was more severe and extensive than that in a stope. Taking dust dispersion along the road as an example, the variation of vegetation canopy spectra increased with the height of dust deposited on the vegetation canopy. At the pixel scale, a lower vegetation FVC would weaken the influence of dust on the spectra. The results derived from simulation spectral data were tested using satellite remote sensing images. The tested result indicates that the influence of dust retention on the pixel spectra with different FVCs was consistent with that created with the simulated data. The finding could be beneficial for those making decisions on monitoring vegetation under dusty conditions and reducing dust pollution in mining areas using remote sensing technology.
1. Introduction
Dust is a dominant feature of the global aerosol system [1]. Dust can affect air quality, climate, biosphere and atmospheric chemistry [2]. There are two main dust sources: natural sources and human activity [3]. Natural sources include wind erosion, rock weathering, dust storms, etc. [4,5], while human activity-induced dust is mainly caused by construction [6], road transportation [7], fuel combustion [8], open-pit mining [9], etc. In China, mining industry has developed rapidly in recent years [10]. A large-scale and high-intensity mining in open-pit mines may lead to serious dust pollution by drilling, overburden loading and unloading, mineral processing, vehicular movement on the haul roads [11].
There may be different dispersion characteristics of dust between excavation, transportation and mineral processing in mining areas. These dispersion differences could be simulated using models. Several models have been developed for air dispersion simulation, such as the American Meteorological Society (AMS) and the U.S. Environmental Protection Agency (EPA) regulatory model (AERMOD) [12], industrial source complex-short term (ISCST) [13], California puff model (CALPUFF) [14], etc. These models are suitable for different spatial scales, processes and particle sources [15]. AERMOD is one of the most commonly used models worldwide based on Gaussian dispersion [16]. It is a near-field, steady-state Gaussian plume model based on planetary boundary layer turbulence structure and scaling concepts, which can model multiple sources of different types including point, area and volume sources. The distribution is assumed to be Gaussian in both the horizontal and vertical directions in the stable boundary layer [15]. In other words, the model has a clear physical concept, can use the measured data to determine the required parameters, and is easy to modify for different situations. This model can be used in short-range (up to 50 km) dispersion from various polluting sources. Thus, in this study, the AERMOD model would be used to predict dust diffusion characteristics of different pollution sources and to obtain the spatial distribution of the dust in the mining area.
After dispersion, a large amount of dust falls on the land surface around the mining area. For vegetation, dust can deposit on the leaf [17]. From the perspective of remote sensing, the dust retention on vegetation canopy will change vegetation’s spectral characteristics because vegetation spectra are mixed with dust spectra. If the measured spectra of dusty leaves were used to retrieve physiological parameters of vegetation directly, it would reduce the retrieval accuracy due to the mixed spectral information [18]. Therefore, it is necessary to study the dust effect on the vegetation spectra. For example, the effect of foliar dust (atmospheric pollution and limestone dust) on spectra of pear and Fagus sylvatica leaves has been studied, respectively [19,20]. However, most studies have studied the influence of dust retention on leaf spectra, and the related result at a leaf scale cannot be applied to the canopy scale directly due to variable canopy structure [21]. Moreover, due to the limitation of spatial resolution, pixels in a remote sensing image are usually mixed with other features [22]. Therefore, the dust effect on the spectra of pixels with different fractional vegetation covers (FVCs) should be considered for the remote sensing application.
Spectral data acquisition is time-consuming and laborious by field or laboratory measurement due to the complexity of the field environment. Moreover, collected spectral data are often difficult to meet the needs of research due to the various measuring conditions [23]. Therefore, simulation methods can frequently be used to obtain spectra. Various radiative transfer models (RTMs) are valuable tools for spectra simulation. In the case of heterogeneous canopies with complex architectures, three-dimensional (3D) RTMs are more appropriate by describing canopy structures explicitly [24]. The discrete anisotropic radiative transfer (DART) model is one of the most used 3D RTMs to simulate the spectra of crops [25,26] and forests [27,28]. DART could be used to simulate and compute radiation propagation through the entire earth-atmosphere system in the electromagnetic spectrum from visible to thermal infrared parts [24]. Thus, the DART was selected as the basic model to simulate spectra of dust at canopy and pixel scales in this study.
Therefore, in this study, we propose to study the dust effect on vegetation spectra at both canopy and pixel scales in a mining area through spectral modeling and remote sensing technology. More specific research objectives are to (1) quantify the dust dispersion in a mining area, and (2) assess the dust effect on vegetation spectra at canopy and pixel scales. To achieve the two research objectives, AERMOD would be used to study the characteristics of dust dispersion and the DART model to study the dust effect on vegetation spectra.
2. Models and Methods
2.1. Study Area
The study area was Kuancheng Mining Area, which is located in Hebei Province, North China (Figure 1). This area is covered with dense natural vegetation, such as Populus cathayana, Pinus tabuliformis, Armeniaca sibirica, and Castanea mollissima, and maize is the main crop. The annual output of ore is about 100 million tons. It has a continental monsoon climate with a mean annual precipitation of 662.5 mm and a mean annual temperature of 8.7 °C [29]. There are many open-pit iron mines in the mining area. Mining development is the main economic activity in this area, which includes mining, ore transportation and beneficiation. Dust pollution is an environmental problem that cannot be ignored in this area due to the high-intensity mining development.
2.2. A General Work Flowchart
In the mining area, there are different dust sources that show dispersion characteristics. To quantify and assess the dust characteristics and effects on vegetation spectra, three major research components were included in this study. (1) The dust source was classified into point and line types. The spatial distribution of dust was studied by using AERMOD. (2) The dust effect on vegetation spectral reflectance at a canopy scale was studied using the DART model, and the dust effect on vegetation reflectance at a pixel scale was investigated by considering FVC in pixels with simulated spectra. (3) The analysis result with the simulated spectra was finally verified with a satellite remote sensing image. The detailed flowchart is presented in Figure 2.
2.3. AERMOD Modeling Dust Dispersion
The dust emission intensity in a mining area needs to be determined first because it is the input data of AERMOD. Then the dust dispersion can be described by using AERMOD.
2.3.1. Determining Dust Emission Intensity in the Mining Area
There are two dust sources in the mining area: stope and haul road.
- (1)
- In the stope
A stope is a place for mining ore. The dust in the stope is mainly generated by the forklift when it works, and the dust emission intensity can be calculated with the following formula [30]:
where Q is the dust emission intensity (kg/h), U is the wind speed (m/s), H is the unloading height of forklift (m), W is the water content of material (%), and M is the loading capacity per unit time (m3/h). According to field monitoring data in the study area, U was 1.6 m/s, H was 4 m, W was 10%, and M was 50 m3/h. The final dust emission intensity was 3.1 kg/h.
- (2)
- Along the haul road
The haul road, linking a stope to a concentrator, is used for transporting iron ore and bulk and material. The formula of dust source intensity on the haul road is as follows [31]:
where Qroad is the dust generated by vehicle (kg/vehicle), V is the driving speed of the vehicle (km/h), M is the vehicle load (t), p is the road surface material quantity (kg/m2), and L is the road length (km). According to the actual conditions, the road was set with length 200 m and width 12 m. The height affected by dust was 1.5 m, the tail gas mixing height was 2 m, V = 50 km/h, M = 45 t, p = 0.3 kg /m2, and the average transportation was 20 times per hour. The final emission intensity was 7.92 kg/km/vehicle or 44 g/km/s.
2.3.2. Dust Dispersion by Using AERMOD and Dustfall Amount Transformation
The two dust sources, stope and haul road, were classified into continuous point and line sources. The dust emission intensity of each source was set as the initial value of AERMOD (ver 18081) with a grain size of 75 μm, which was the mean grain size of the dust samples in the study area. Furthermore, the meteorological data in the mining area were also set as the initial values for running AERMOD. The average wind speed was 1.6 m/s, measured from 1 June to 12 June 2013, in the growing season. Based on the above data, the spatial dispersion of dust in the two sources was simulated by using AERMOD.
Daily average dust concentration is a direct result derived from AERMOD. For this study, it should be converted into dustfall amount according to the following relationship [32]:
where CTSP is the dust concentration (μg/m3), CDF is the dustfall amount (t/(km2∙30d)) and K is the correlation coefficient with the value of 11.630 (30d∙(103 km)−1). The transformed amount of dustfall is the cumulative value in 30 days, which would hardly deposit on the canopy totally. Considering the influence of wind and the canopy structure on the dust deposition. the dustfall amount was set as a cumulative value of 2 d.
2.4. Spectra Simulation of Dusty Vegetation by Using DART
DART is one of the most accurate and complete models that operate on different 3D scenes simulating radiative transfer from the visible to thermal infrared in the Earth landscapes and the atmosphere. It has been developed since 1992. It models optical signals at the entrance of imaging radiometers and laser scanners onboard satellites and airplanes, as well as the 3D radiative budget of urban and natural landscapes for any experimental configuration and instrumental specification [24]. The input parameters of the DART model mainly include two parts, one is the related parameters of objects in the simulation scene, and the other is the environment parameters of the simulated scene. The object parameters in the simulation scene are physical and biochemical parameters, structural parameters and scattering properties of the object. The scene environment parameters include solar zenith angle, azimuth angle, observation zenith angle and azimuth angle, scene size and resolution, etc.
In this study, maize was selected as an example of vegetation for its wide distribution in the mining area. Firstly, the reflectance at leaf scale was obtained for the DART input. For clean leaves, the reflectance was derived using the PROSPECT model with four input variables: N (leaf structure parameter), EWT (equivalent water thickness or water content), Cab (chlorophyll a + b content) and Cm (dry matter content) [33]. The four input variables of maize leaf were adapted from the LOPEX93 dataset [33], where N = 1.34, EWT = 0.0137 cm, Cab = 45.27 µg/cm², Cm = 0.0047 g/cm². For dusty leaves, the reflectance was derived using the PROSPECT-based mixture model [34,35] based on the dust dispersion along the haul road. To simulate the vertical distribution difference of deposited dust on maize canopy, the canopy model of maize was established with upper, middle and lower layers. Then the dusty leaf spectra under different dust amounts at different layers were imported into the DART model. In this case, the zenith angle and azimuth of the sun were set as 70° and 141° by referring to the Landsat 8 OLI imaging scene parameters (August 9, 2013) passing the study area for validation. Finally, the reflectance of maize canopy with different dust amounts was simulated.
Based on the canopy-scale result achieved, pixel-scale spectral data could be obtained for further analysis. At the pixel scale, it was supposed that the target pixel had only two endmembers, vegetation and soil. To explore the dust influence on the reflectance of mixed pixels with different vegetation covers, FVC was set as 89% (very high), 75% (high), 51% (medium) and 23% (low). The spectral differences of pixels with different FVCs could be compared with different dust amount. Taking pixel reflectance at 626 nm (red band) and 840 nm (NIR band) as examples, a quantitative analysis was made to reflect the dust effect on pixel spectra under different vegetation covers using the change rate. Its formula is as follows:
where CR is the change rate of vegetation reflectance, Rd is the reflectance of dusty vegetation and R0 is the reflectance of dust-free vegetation.
2.5. Validation for Simulation with Satellite Images
Two scenes of Landsat OLI images (path 122 and row 32), with 30 m spatial resolution, were used to validate the simulated results. One was acquired before a rainy day (24 July 2013) and set as the dusty scene, and the other was acquired after a rainy day (9 August 2013) and set as the dust-free scene. The two images were atmospherically corrected to surface reflectance by using the Fast Line-of-Slight Atmospheric Analysis of Spectral Hypercubes (FLAASH) module of ENVI software. Then, FVC was derived by using a dimidiate pixel model based on the dust-free reflectance image [36]. The calculation formula of FVC can be expressed as:
where NDVI is the normalized difference vegetation index, NDVIveg is the NDVI value for “pure” vegetation pixel and NDVIsoil is the NDVI value for “pure” bare soil pixel in the image. In this study, NDVIveg is 0.944, and NDVIsoil is 0.173. Finally, the reflectance difference image (between the dusty scene and the dust-free scene) and FVC image were used to understand the simulated result with the DART model.
3. Results and Discussion
3.1. Spatial Characteristics of Dust Dispersion Based on the AERMOD Simulation
3.1.1. Dust Dispersion in the Stope (Point Source)
In the horizontal direction, the dust diffusion was consistent with the wind direction (Figure 3a). The dust concentration gradually increased first, reached a maximum of 94.50 mg/m3, and then began to decline. The dust pollution range was about 20 m horizontally from the point source. In the vertical direction, the dust concentration increased firstly and then decreased within 1.5 m to the pollution source (Figure 3b).
3.1.2. Dust Dispersion along the Road Transport (Line Source)
Under the condition of 1.6 m/s wind, the dust was almost distributed symmetrically along the road, which meant that the wind had a slight influence on the dust dispersion. In the horizontal direction, the dust concentration was consistent on the line parallel to the road, and the dust concentration reached the maximum at 47.60 mg/m3 on the road and then gradually decreased with the distance off the road (Figure 4a). In the vertical direction, the dust raised by the trucks formed continuous dust layers in a “saddle” shape with different concentrations (Figure 4b). According to the simulation results by AERMOD, the dust concentration decreased with the increasing height.
Taken together, dust pollution along the haul road was more severe and more extensive than that in the stope. After conversion, the amount of dust deposited on the vegetation canopy at different heights (0.5 m, 1.0 m, and 1.5 m) and distances (from 10 m to 100 m) is shown in Figure 5. Generally, the amount of dust decreased with increasing height. For 1.0 m and 1.5 m height, amounts of dust increased firstly when the distance to the road was not greater than 30 m and then decrease with increasing distance. When the horizontal distance was greater than 60 m, the amounts of dust at different heights were close.
AERMOD is suitable for the near-field range (<50 km), so it could be applied in this study. According to AERMOD, the maximum dust concentration was 94.50 mg/m3 in the stope and 47.60 mg/m3 along the haul road, and the maximum dustfall amount was 45.0 g/m2 at the 0.5 m height. The result was close to some reported results. For example, the maximum dust concentration was 10.78 mg/m3 in Sistan, Iran during the summer dusty period [37], and the maximum dustfall amount was 14.98 g/m2 in a limestone quarry in north Israel [38].
3.2. Canopy Spectra under Different Dust Retention Conditions Based on DART Simulation
According to the dust concentration along the road, the dust amount set on the vegetation canopy was 0–80 g/m2, with a gradient level of 8 g/m2. Dust falling on vegetation canopy has different effects on the reflectance of different bands (Figure 6). Generally, the reflectance decreased with the increasing amount of dust in the range of 0.7–1.4 μm and increased with increasing amount of dust outside the range. Under the same amount of dust, the spectral response of the canopy was different when the canopy was covered by dust on the upper, middle and lower layers. The spectral change rate increased gradually when the dust only deposited from lower to upper layers. In other words, the dust on the upper layer had a greater impact on the canopy spectra. Furthermore, the dust deposited on all the layers has had the greatest impact on the canopy.
3.3. Pixel Spectra Change under Different Dust Amount and FVCs
Figure 7 shows the spectra of dust-free mixed pixels when the FVC was set as 89%, 75%, 51%, 23%, 13% and 8% initially. The results show that when the vegetation cover decreased, the pixel reflectance gradually changed to the characteristics of soil reflectance. When vegetation cover was less than 23%, the pixel spectra were similar to the soil spectrum.
Scenes with FVCs of 89%, 75%, 51% and 23% were selected to simulate the spectra of mixed pixels with different dust amount. The change trend of pixel spectra was the same as that at the canopy scale when the amount of dust increased. However, the lower the vegetation cover was, the less the impact of deposited dust on the pixel spectra (Figure 8). The result shows that the change rate decreased with the decrease of FVC at both 626 nm and 840 nm (Figure 9). When the vegetation cover was low, the soil mainly contributed to the pixel spectra. According to the measured soil spectra with different dust deposition levels, the dust effect on it could be ignored. Thus, the pixel spectrum influenced by the dust deposition was mainly determined by the vegetation FVC in the pixel.
3.4. Test by Using Satellite Images
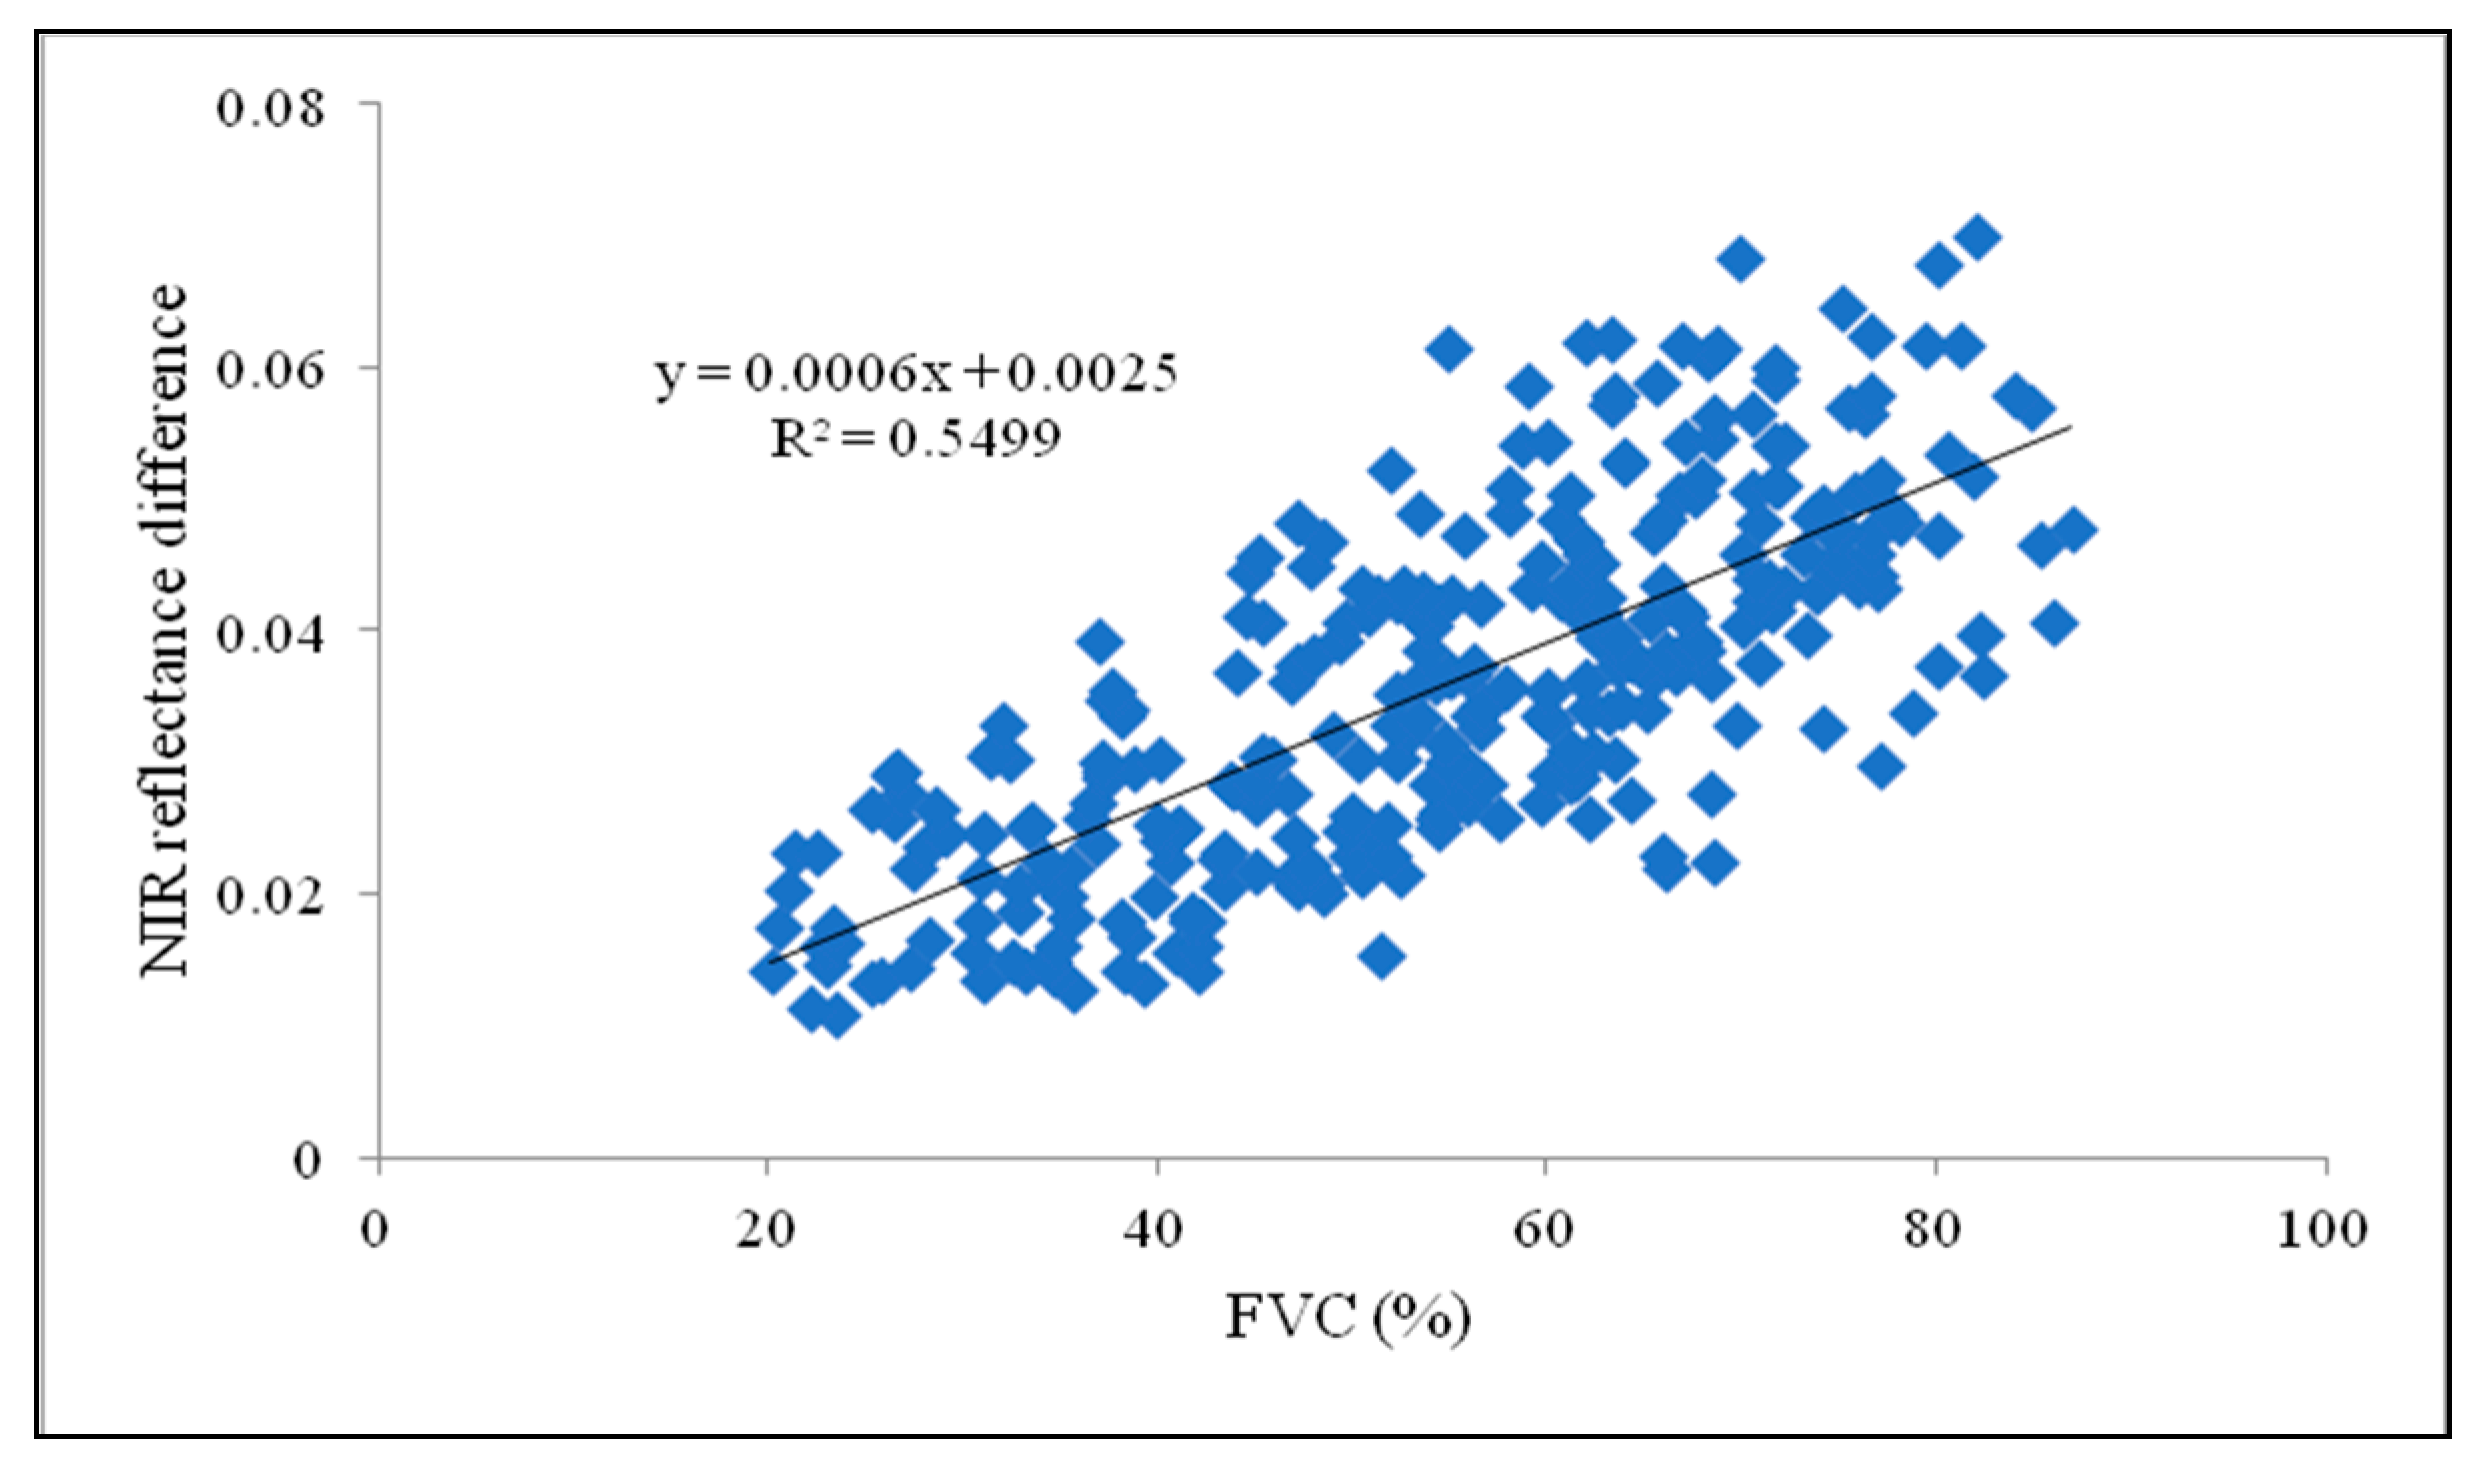
With two scenes of remote sensing images, the pixel spectra on both sides of the haul road in the mining area were extracted and compared to test the above result created with simulation data. To comprehensively consider the pixel spectra influenced by dust absorption on vegetation under different FVCs, the difference in reflectance at the NIR band (845–885 nm) of total 302 pixels between dusty and dust-free remote sensing images was obtained to compare with FVC (Figure 10). The results showed that the difference in reflectance at the NIR band increased while FVC increased, which meant that the influence of dust retention on the spectrum of pixels became stronger. However, some errors may be caused because of the difference between the simulation and the validation. Vegetation type is one of the factors. Maize was selected as the experimental plant in the DART simulation, but the selected pixels on the Landsat image for validation may not only be occupied by maize because there were various types of vegetation in the study area. On the other hand, other parameters in the DART model, such as soil background, could also cause errors due to differences from the actual situation. These factors should be considered in future studies to obtain more accurate results.
The tested result with the satellite images indicates that the influence of dust retention on the pixel spectra with different FVCs was consistent with that created with the simulated spectral data. From the perspective of application, this might be very significant for inversion using remote sensing images under dusty conditions. To remove dust influence accurately on inversion, vegetation cover factor must be considered for its effect on the reflectance. The accurate inversed vegetation parameters are important for sustainable management in mining areas [39].
4. Conclusions
Dust pollution is severe in some mining areas in China. In this study, the dust dispersion was studied by taking an iron mining area as an example. The effect of dust on vegetation spectra was investigated at both the canopy scale and the pixel scale using a spectral simulation method. The AERMOD simulation was conducted in a stope and along a haul road in a mining area. Along the haul road, dust pollution was more severe due to extensive and high-concentration distribution. According to DART simulation, the vertical distribution of dust deposition had an important influence on the canopy spectra. At the canopy scale, the higher the dust deposition on the vegetation canopy layer, the stronger the dust deposition on the vegetation influences. At the pixel scale, the spectra of pixel under dusty conditions varied with the vegetation cover. As the FVC decreased, the dust impact on the pixel spectra would be decreased. This simulated result was compared by the test result estimated using the satellite remote sensing images. The comparative result indicates that the influence of dust retention on the pixel spectra with different FVCs was consistent with that created with the simulated spectral data. These findings would be beneficial to decision-makers or researchers for the remote sensing application to mapping and assessing the dust effect in mining areas.
Author Contributions
Conceptualization, B.M. and X.L.; methodology, B.M.; software, X.L. and B.M.; validation, Z.J. and X.L.; formal analysis, B.M. and R.P.; investigation, B.M. and A.L.; resources, B.M.; data curation, X.L. and Z.J.; writing—original draft preparation, B.M.; writing—review and editing, B.M., R.P. and D.C.; funding acquisition, B.M. and D.C. All authors have read and agreed to the published version of the manuscript.
Funding
This research is jointly supported by the Fundamental Research Funds for the Central Universities (N2001020, N17241004, N160104006, and N170103009), and the National Natural Science Foundation of China (41871310, 41201359).
Acknowledgments
We would like to acknowledge the anonymous reviewers for their valuable suggestions.
Conflicts of Interest
The authors declare no conflict of interest.
References
- Kaufman, Y.J.; Tanre, D.; Dubovik, O.; Karnieli, A.; Remer, L.A. Absorption of sunlight by dust as inferred from satellite and ground-based remote sensing. Geophys. Res. Lett. 2001, 28, 1479–1482. [Google Scholar] [CrossRef] [Green Version]
- Fairlie, T.D.; Jacob, D.J.; Park, R.J. The impact of transpacific transport of mineral dust in the United States. Atmos. Environ. 2007, 41, 1251–1266. [Google Scholar] [CrossRef]
- Tegen, I.; Werner, M.; Harrison, S.P.; Kohfeld, K.E. Relative importance of climate and land use in determining present and future global soil dust emission. Geophys. Res. Lett. 2004, 31, 4. [Google Scholar] [CrossRef] [Green Version]
- Doronzo, D.M.; Khalaf, E.A.; Dellino, P.; De Tullio, M.D.; Dioguardi, F.; Gurioli, L.; Mele, D.; Pascazio, G.; Sulpizio, R. Local impact of dust storms around a suburban building in arid and semi-arid regions: Numerical simulation examples from Dubai and Riyadh, Arabian Peninsula. Arab. J. Geosci. 2014, 8, 7359–7369. [Google Scholar] [CrossRef]
- Kok, J.F.; Parteli, E.J.R.; Michaels, T.I.; Karam, D.B. The physics of wind-blown sand and dust. Rep. Prog. Phys. 2012, 75, 106901. [Google Scholar] [CrossRef] [PubMed] [Green Version]
- Kinuthia, J.; Nidzam, R. Towards zero industrial waste: Utilisation of brick dust waste in sustainable construction. Waste Manag. 2011, 31, 1867–1878. [Google Scholar] [CrossRef]
- Gulia, S.; Goyal, P.; Goyal, S.K.; Kumar, R. Re-suspension of road dust: Contribution, assessment and control through dust suppressants—A review. Int. J. Environ. Sci. Technol. 2018, 16, 1717–1728. [Google Scholar] [CrossRef]
- Steiner, D.; Lanzerstorfer, C. Investigation of dust resistivity for a fractioned biomass fly ash sample during poor combustion conditions with regard to electrostatic precipitation. Fuel 2018, 227, 59–66. [Google Scholar] [CrossRef]
- Zhong, B.; Wang, L.; Liang, T.; Xing, B. Pollution level and inhalation exposure of ambient aerosol fluoride as affected by polymetallic rare earth mining and smelting in Baotou, north China. Atmos. Environ. 2017, 167, 40–48. [Google Scholar] [CrossRef]
- Gan, Y.; Griffin, W.M. Analysis of life-cycle GHG emissions for iron ore mining and processing in China—Uncertainty and trends. Resour. Policy 2018, 58, 90–96. [Google Scholar] [CrossRef]
- Chaulya, S.K.; Ahmad, M.; Singh, R.S.; Bandopadhyay, L.K.; Bondyopadhay, C.; Mondal, G.C. Validation of Two Air Quality Models for Indian Mining Conditions. Environ. Monit. Assess. 2003, 82, 23–43. [Google Scholar] [CrossRef] [PubMed]
- Cimorelli, A.J.; Perry, S.G.; Venkatram, A.; Weil, J.C.; Paine, R.J.; Wilson, R.B.; Lee, R.F.; Peters, W.D.; Brode, R.W. AERMOD: A Dispersion Model for Industrial Source Applications. Part I: General Model Formulation and Boundary Layer Characterization. J. Appl. Meteorol. 2005, 44, 682–693. [Google Scholar] [CrossRef]
- Lorber, M.; Eschenroeder, A.; Robinson, R. Testing the USA EPA’s ISCST-Version 3 model on dioxins: A comparison of predicted and observed air and soil concentrations. Atmos. Environ. 2000, 34, 3995–4010. [Google Scholar] [CrossRef]
- Levy, J.I.; Spengler, J.D.; Hlinka, D.; Sullivan, D.; Moon, D. Using CALPUFF to evaluate the impacts of power plant emissions in Illinois: Model sensitivity and implications. Atmos. Environ. 2002, 36, 1063–1075. [Google Scholar] [CrossRef]
- Holmes, N.S.; Morawska, L. A review of dispersion modelling and its application to the dispersion of particles: An overview of different dispersion models available. Atmos. Environ. 2006, 40, 5902–5928. [Google Scholar] [CrossRef] [Green Version]
- Huang, D.; Guo, H. Dispersion modeling of odour, gases, and respirable dust using AERMOD for poultry and dairy barns in the Canadian Prairies. Sci. Total. Environ. 2019, 690, 620–628. [Google Scholar] [CrossRef]
- Farmer, A.M. The effects of dust on vegetation—A review. Environ. Pollut. 1993, 79, 63–75. [Google Scholar] [CrossRef]
- Lin, W.; Li, Y.; Du, S.; Zheng, Y.; Gao, J.; Sun, T. Effect of dust deposition on spectrum-based estimation of leaf water content in urban plant. Ecol. Indic. 2019, 104, 41–47. [Google Scholar] [CrossRef]
- Peng, J.; Wang, J.-Q.; Xiang, H.-Y.; Niu, J.-L.; Chi, C.-M.; Liu, W.-Y. Effect of Foliar Dustfall Content (FDC) on High Spectral Characteristics of Pear Leaves and Remote Sensing Quantitative Inversion of FDC. Guang Pu Xue Yu Guang Pu Fen Xi = Guang Pu 2015, 35, 1365–1369. [Google Scholar]
- Zajec, L.; Gradinjan, D.; Klančnik, K.; Gaberščik, A. Limestone dust alters the optical properties and traits of Fagus sylvatica leaves. Trees 2016, 30, 2143–2152. [Google Scholar] [CrossRef]
- Asner, G.; Martin, R.E. Spectral and chemical analysis of tropical forests: Scaling from leaf to canopy levels. Remote Sens. Environ. 2008, 112, 3958–3970. [Google Scholar] [CrossRef]
- Mertens, K.C.; De Baets, B.; Verbeke, L.P.C.; Dewulf, R. A sub-pixel mapping algorithm based on sub-pixel/pixel spatial attraction models. Int. J. Remote Sens. 2006, 27, 3293–3310. [Google Scholar] [CrossRef]
- Huesca, M.; García, M.; Roth, K.L.; Casas, A.; Ustin, S.L. Canopy structural attributes derived from AVIRIS imaging spectroscopy data in a mixed broadleaf/conifer forest. Remote Sens. Environ. 2016, 182, 208–226. [Google Scholar] [CrossRef] [Green Version]
- Gastellu-Etchegorry, J.-P.; Yin, T.; Lauret, N.; Cajgfinger, T.; Gregoire, T.; Grau, E.; Feret, J.-B.; Lopes, M.; Guilleux, J.; Dedieu, G.; et al. Discrete Anisotropic Radiative Transfer (DART 5) for Modeling Airborne and Satellite Spectroradiometer and LIDAR Acquisitions of Natural and Urban Landscapes. Remote Sens. 2015, 7, 1667–1701. [Google Scholar] [CrossRef] [Green Version]
- Duthoit, S.; Demarez, V.; Gastellu-Etchegorry, J.-P.; Martin, E.; Roujean, J.L. Assessing the effects of the clumping phenomenon on BRDF of a maize crop based on 3D numerical scenes using DART model. Agric. For. Meteorol. 2008, 148, 1341–1352. [Google Scholar] [CrossRef] [Green Version]
- Ben Hmida, S.; Kallel, A.; Gastellu-Etchegorry, J.-P.; Roujean, J.-L. Crop Biophysical Properties Estimation Based on LiDAR Full-Waveform Inversion Using the DART RTM. IEEE J. Sel. Top. Appl. Earth Obs. Remote Sens. 2017, 10, 4853–4868. [Google Scholar] [CrossRef]
- Morton, D.C.; Rubio, J.; Cook, B.D.; Gastellu-Etchegorry, J.-P.; Longo, M.; Choi, H.; Hunter, M.; Keller, M. Amazon forest structure generates diurnal and seasonal variability in light utilization. Biogeosciences 2016, 13, 2195–2206. [Google Scholar] [CrossRef] [Green Version]
- Schneider, F.D.; Leiterer, R.; Morsdorf, F.; Gastellu-Etchegorry, J.-P.; Lauret, N.; Pfeifer, N.; Schaepman, M. Simulating imaging spectrometer data: 3D forest modeling based on LiDAR and in situ data. Remote Sens. Environ. 2014, 152, 235–250. [Google Scholar] [CrossRef]
- Ma, B.; Pu, R.; Wu, L.; Zhang, S. Vegetation Index Differencing for Estimating Foliar Dust in an Ultra-Low-Grade Magnetite Mining Area Using Landsat Imagery. IEEE Access 2017, 5, 8825–8834. [Google Scholar] [CrossRef]
- Wanjun, T. Study on Dust Distribution and Diffusion Mechanism in Open Pit Coal Mine. Ph.D. Thesis, China University of Mining and Technology, Xuzhou, China, 2018. [Google Scholar]
- Wang, D.; Lin, G.; Xu, Z. Practical Technology for Atmospheric Environmental Impact Assessment; Standards Press of China: Beijing, China, 2010. [Google Scholar]
- Tian, G.; Li, J.-M.; Li, G.; Huang, Y.-H.; Yan, B.-L. Correlation between dust fall and TSP from construction sites. Environ. Sci. 2007, 28, 1941–1943. [Google Scholar]
- Fang, M.; Ju, W.; Zhan, W.; Cheng, T.; Qiu, F.; Wang, J. A new spectral similarity water index for the estimation of leaf water content from hyperspectral data of leaves. Remote Sens. Environ. 2017, 196, 13–27. [Google Scholar] [CrossRef]
- Ma, B.; Li, X.; Liang, A.; Chen, Y.; Che, D. Experimental and Numerical Investigation of Dustfall Effect on Remote Sensing Retrieval Accuracy of Chlorophyll Content. Sensors 2019, 19, 5530. [Google Scholar] [CrossRef] [PubMed] [Green Version]
- Chen, Y. Experimental Study of Dustfall Effect on Chlorophyll Retrieval Using Remote Sensing. Master’s Thesis, Northeastern University, Shenyang, China, 2018. [Google Scholar]
- Zhang, X.; Liao, C.; Li, J.; Sun, Q. Fractional vegetation cover estimation in arid and semi-arid environments using HJ-1 satellite hyperspectral data. Int. J. Appl. Earth Obs. Geoinf. 2013, 21, 506–512. [Google Scholar] [CrossRef]
- Behrooz, R.D.; Esmaili-Sari, A.; Bahramifar, N.; Kaskaoutis, D. Analysis of the TSP, PM10 concentrations and water-soluble ionic species in airborne samples over Sistan, Iran during the summer dusty period. Atmos. Pollut. Res. 2017, 8, 403–417. [Google Scholar] [CrossRef]
- Bluvshtein, N.; Mahrer, Y.; Sandler, A.; Rytwo, G. Evaluating the impact of a limestone quarry on suspended and accumulated dust. Atmos. Environ. 2011, 45, 1732–1739. [Google Scholar] [CrossRef]
- Beadel, S.; Shaw, W.; Bawden, R.; Bycroft, C.; Wilcox, F.; McQueen, J.; Lloyd, K. Sustainable management of geothermal vegetation in the Waikato Region, New Zealand, including application of ecological indicators and new monitoring technology trials. Geothermics 2018, 73, 91–99. [Google Scholar] [CrossRef]
Figure 1.
Location of Kuancheng Mining Area in a false-color composite image of Landsat 8 image (RGB432).
Figure 1.
Location of Kuancheng Mining Area in a false-color composite image of Landsat 8 image (RGB432).
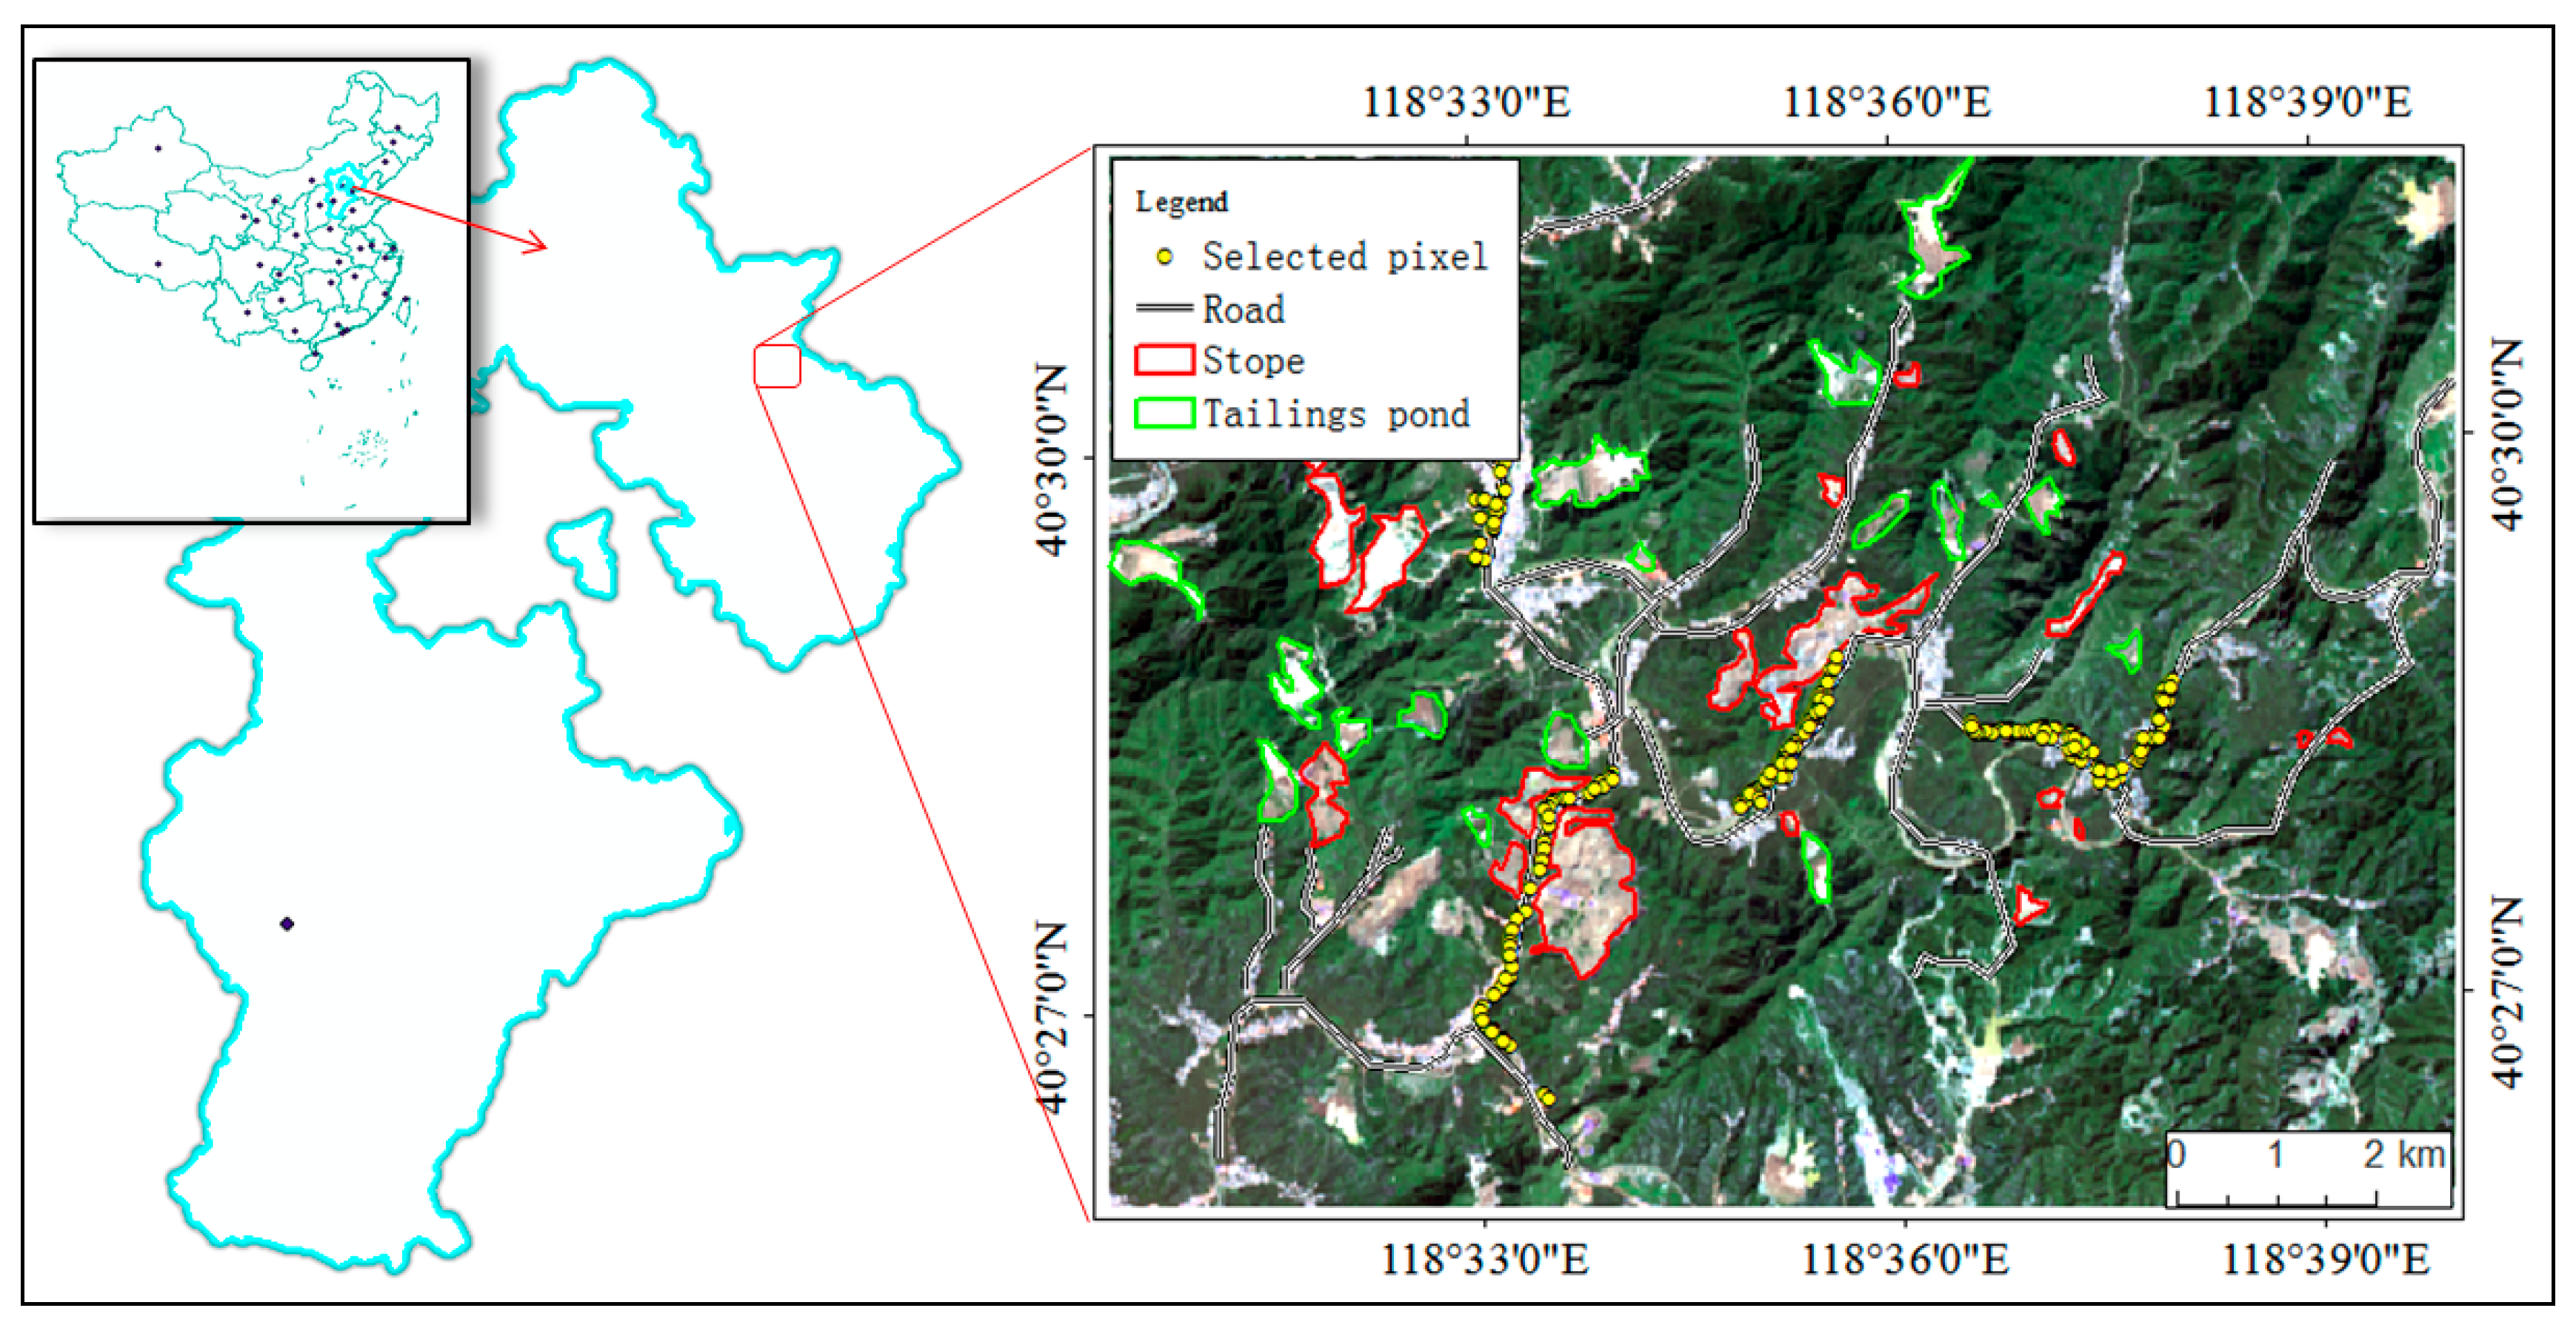
Figure 2.
A general flowchart of this study.

Figure 3.
Spatial distribution of dust concentration in the stope shovel loading (a) is in horizontal direction, and (b) is in vertical direction.
Figure 3.
Spatial distribution of dust concentration in the stope shovel loading (a) is in horizontal direction, and (b) is in vertical direction.
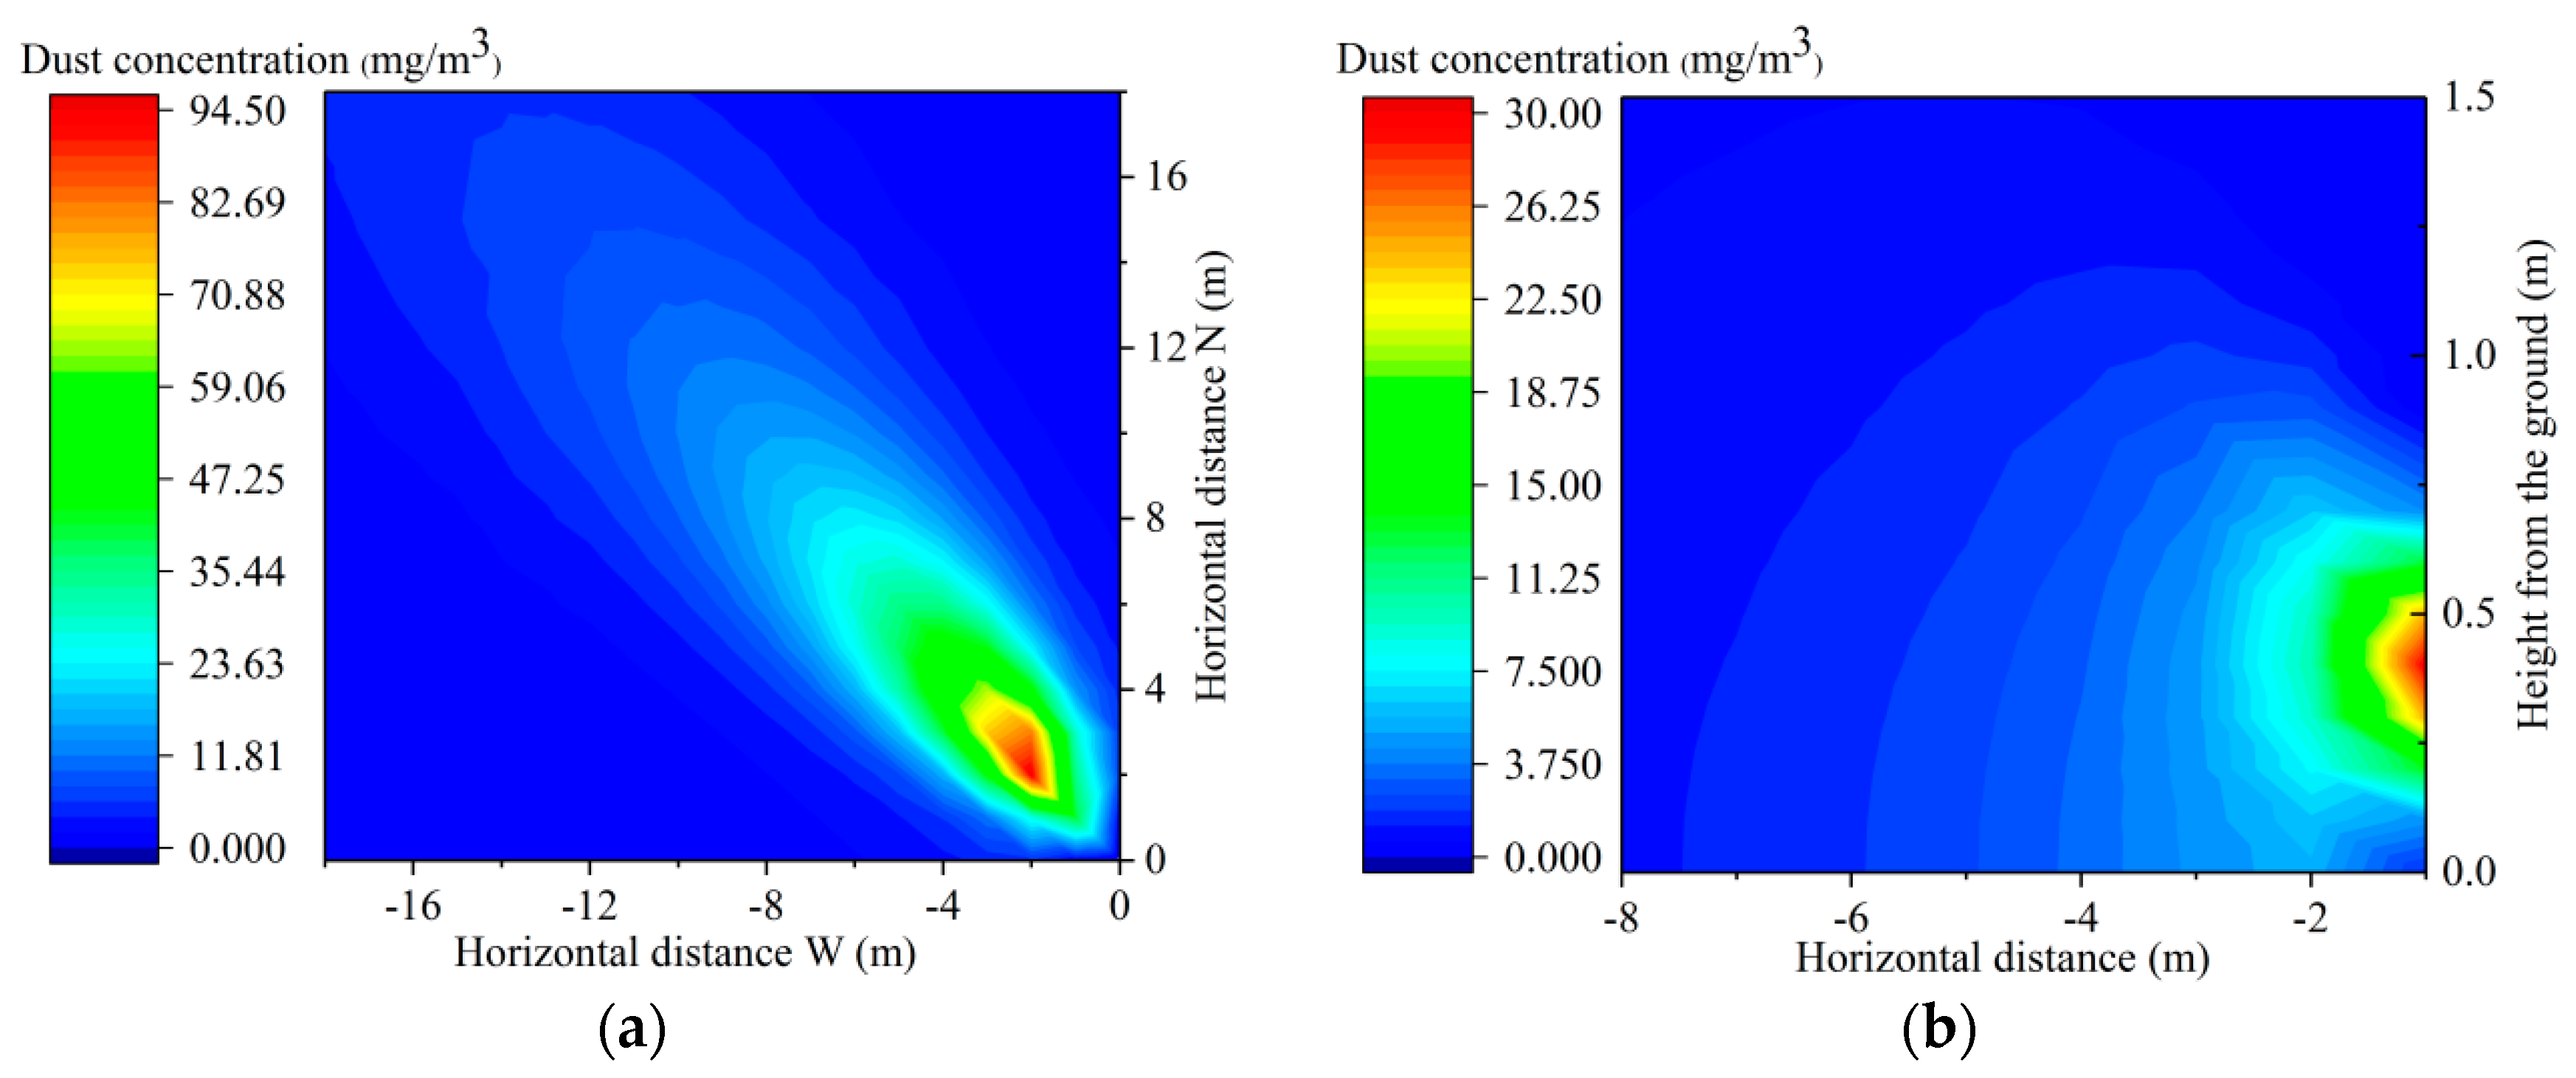
Figure 4.
Spatial distribution of dust concentration in road transportation (a) is in horizontal direction, and (b) is in vertical direction).
Figure 4.
Spatial distribution of dust concentration in road transportation (a) is in horizontal direction, and (b) is in vertical direction).
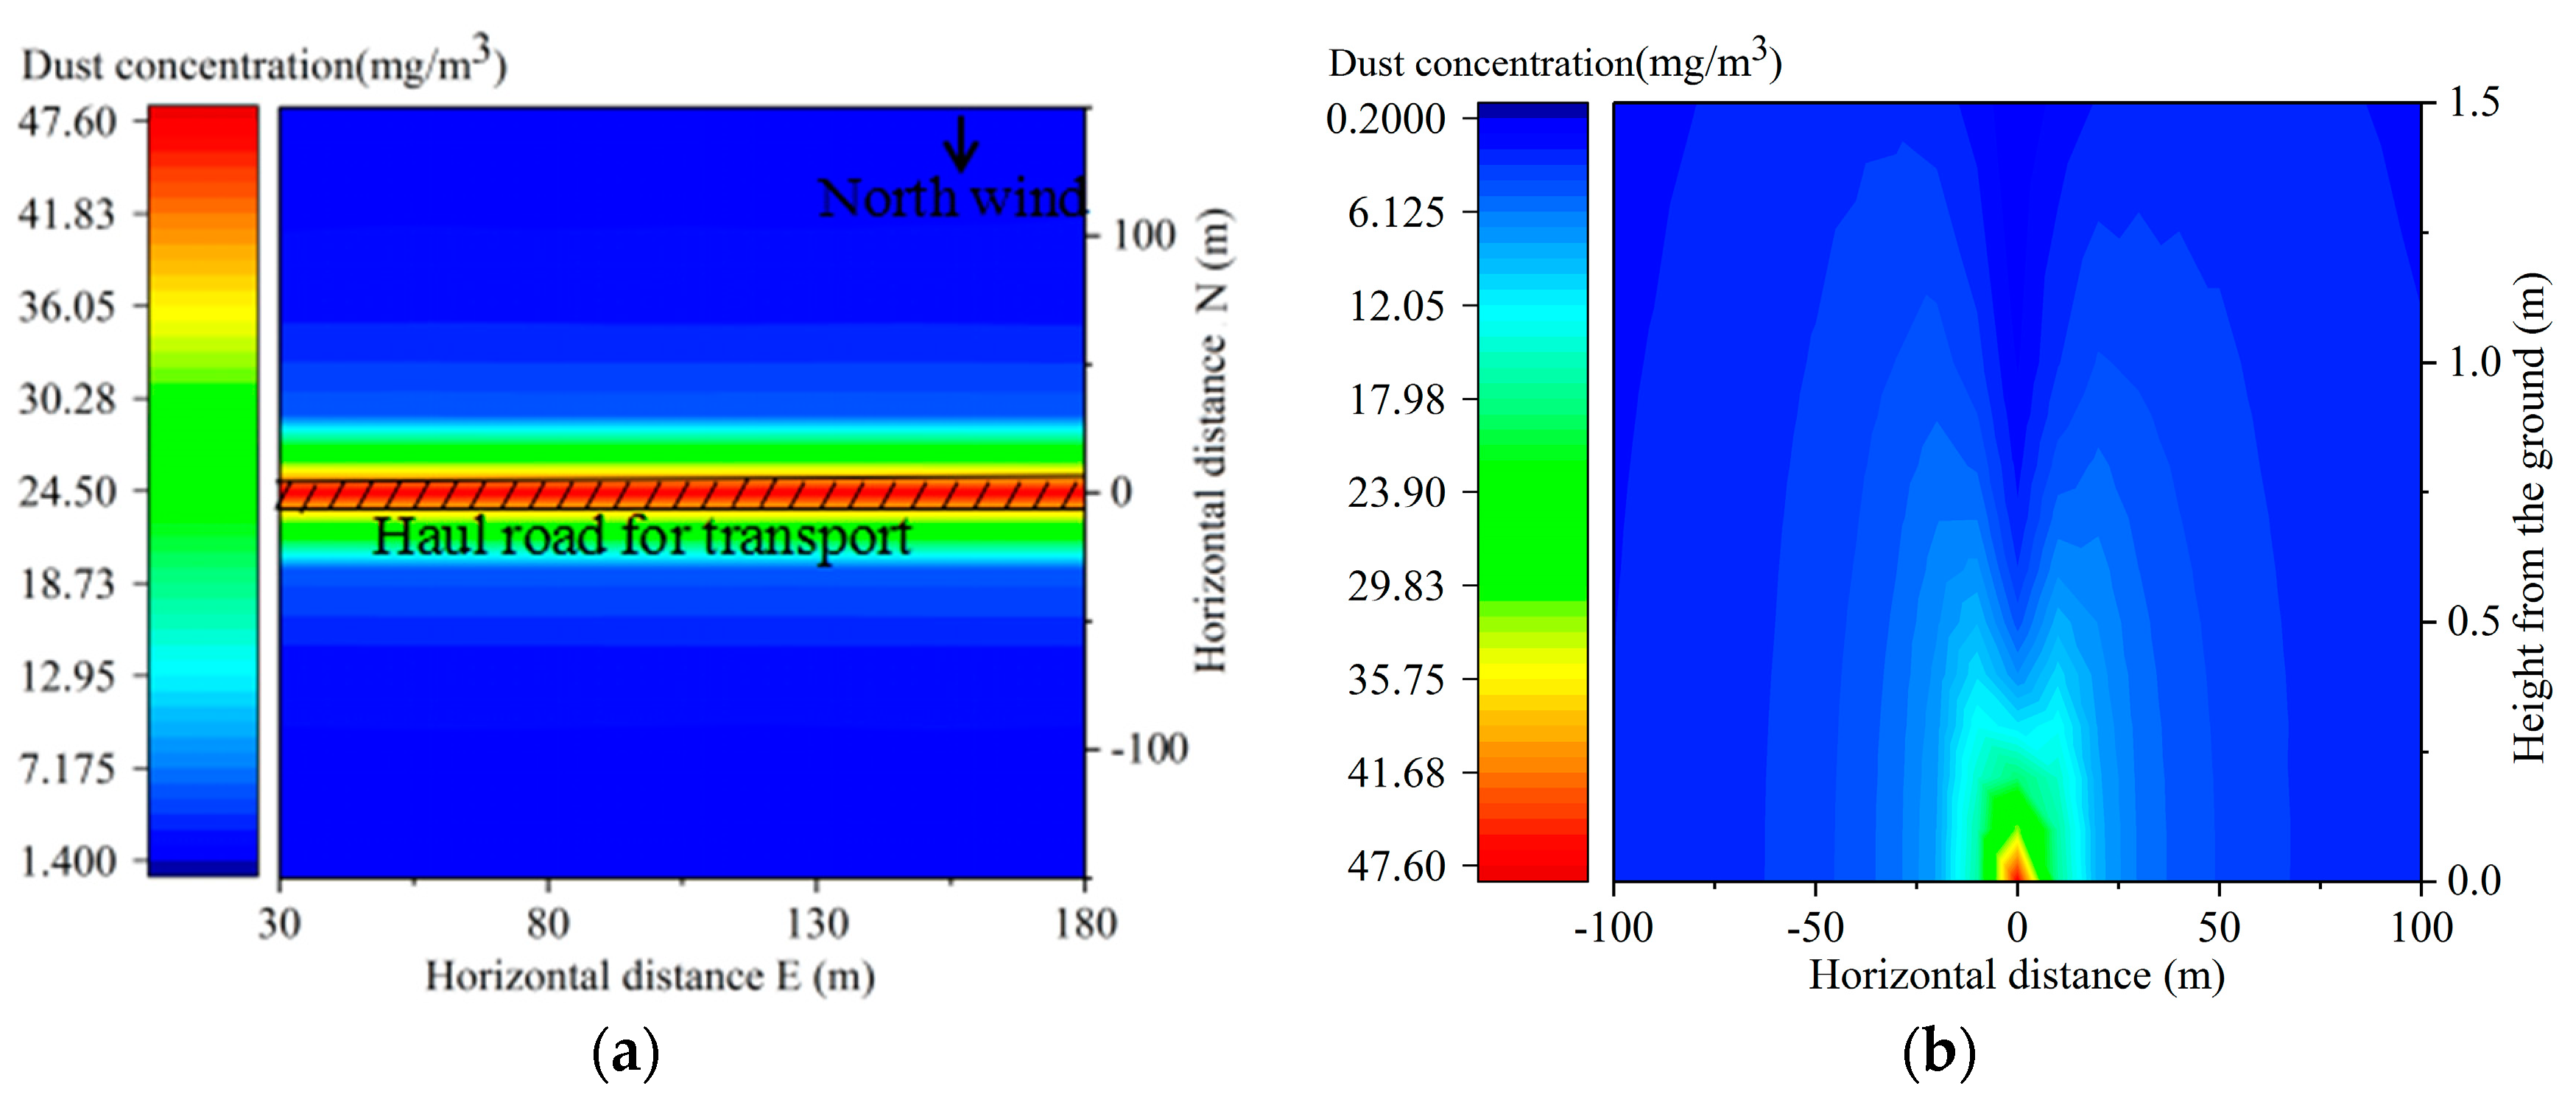
Figure 5.
Changes of dustfall at different heights from the ground.

Figure 6.
The simulated spectral results of maize canopy under different dust retention conditions (a) is dust retention on all the layers of canopy, (b) is dust retention only on the top layer of canopy, (c) is dust retention only on the middle layer of canopy, and (d) is dust retention only on the bottom layer of canopy).
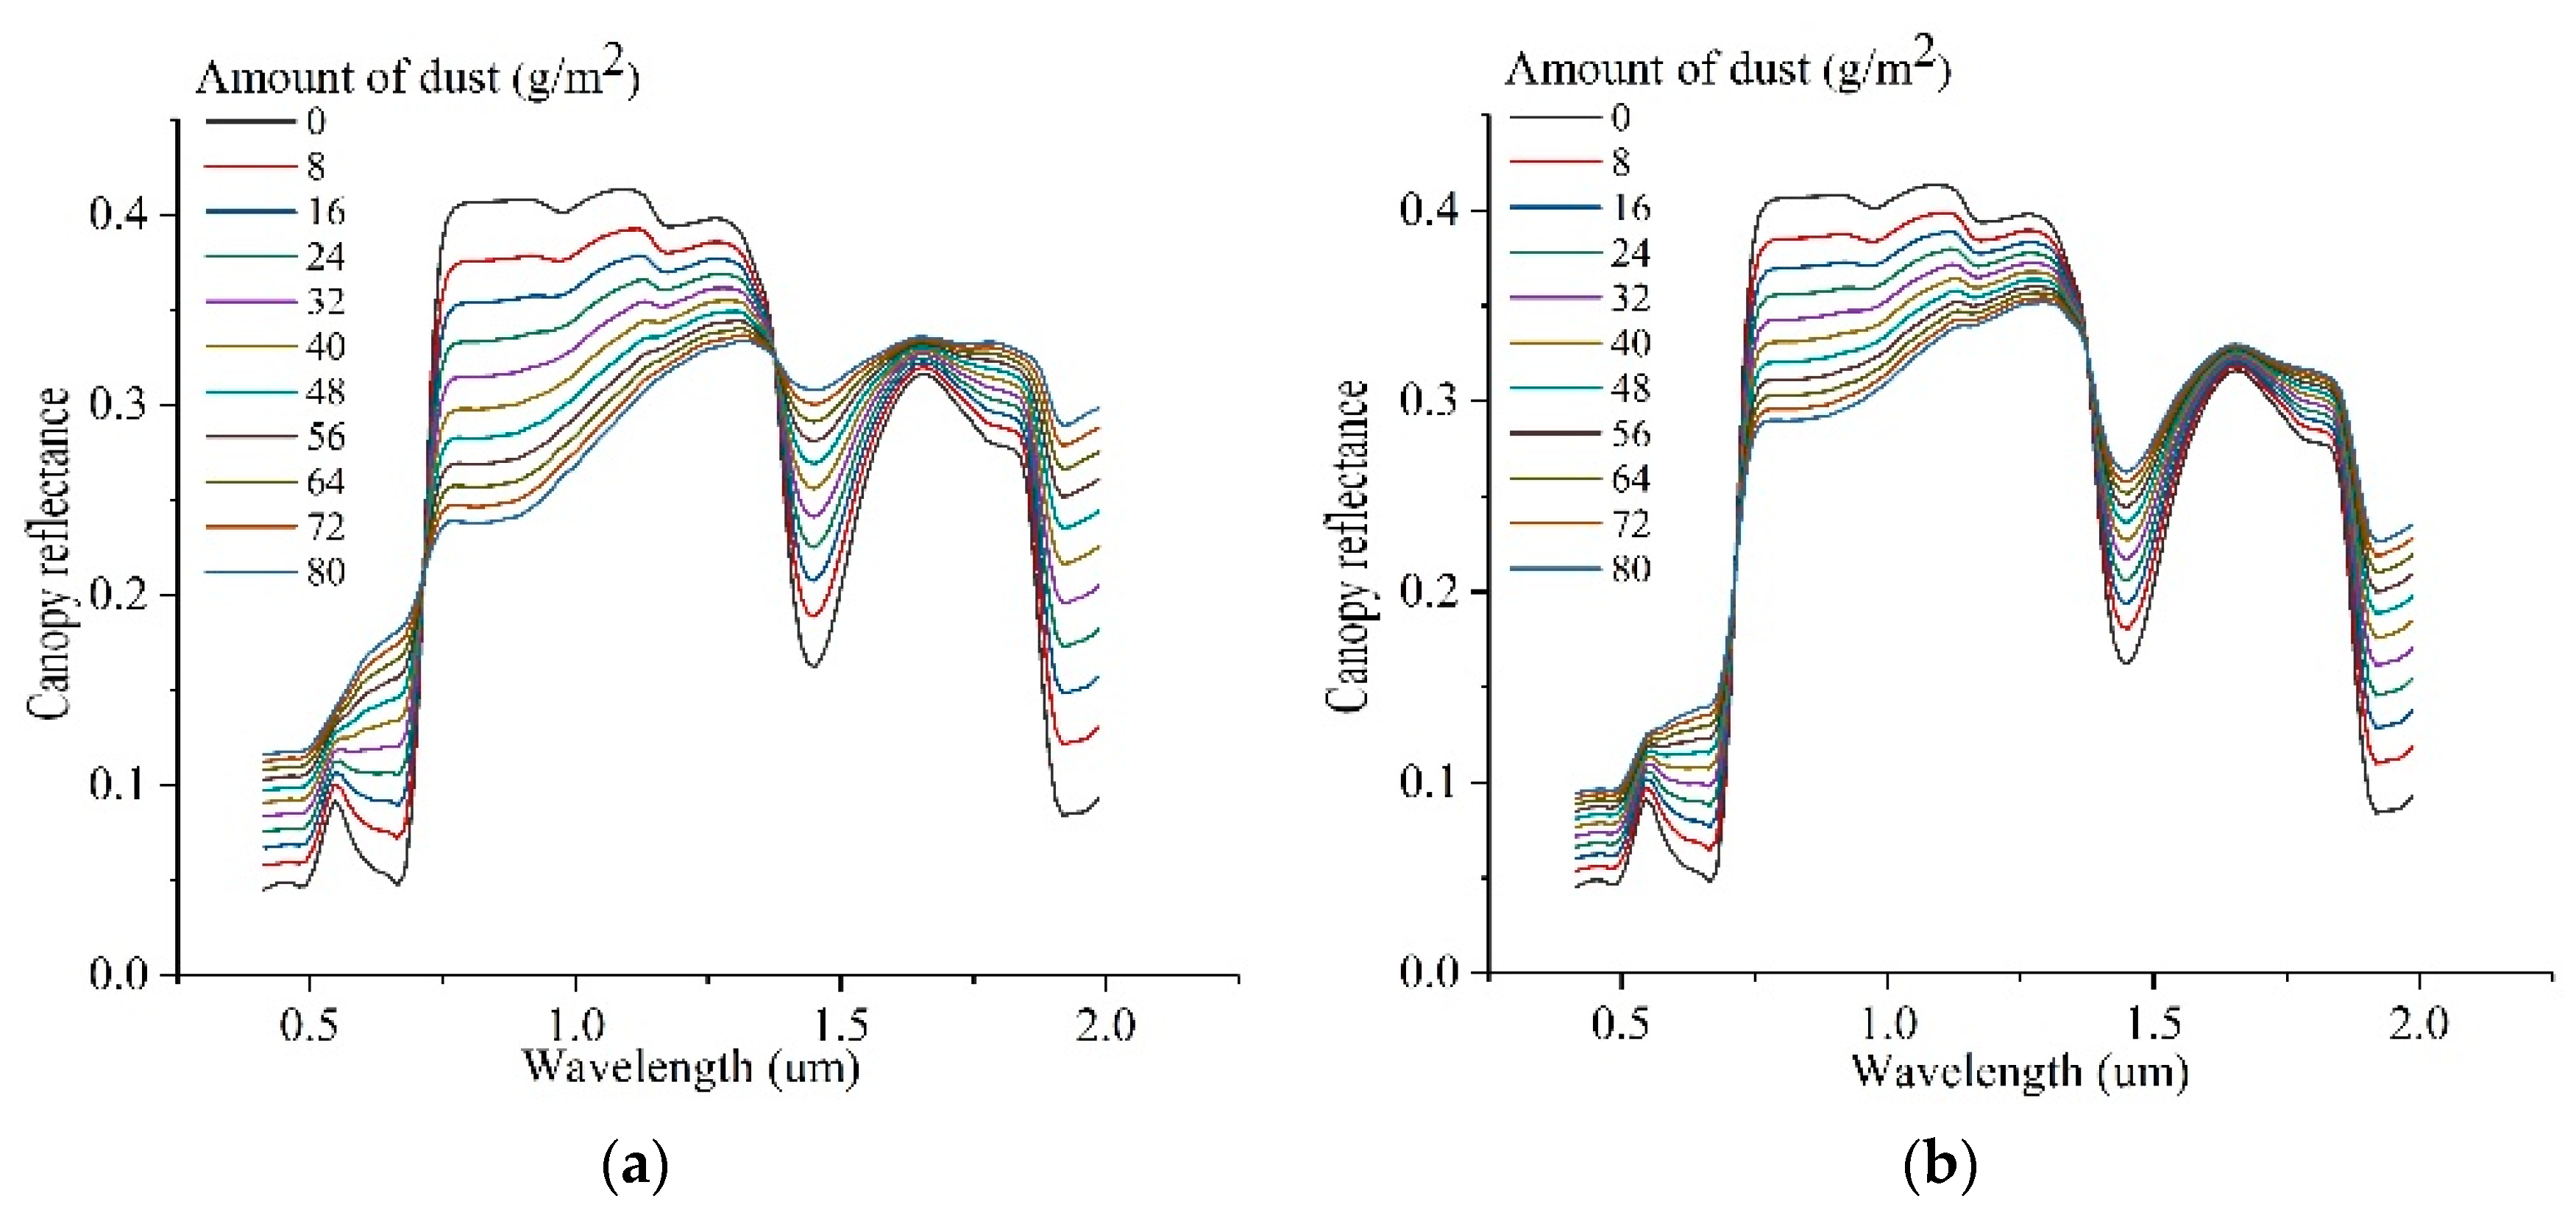
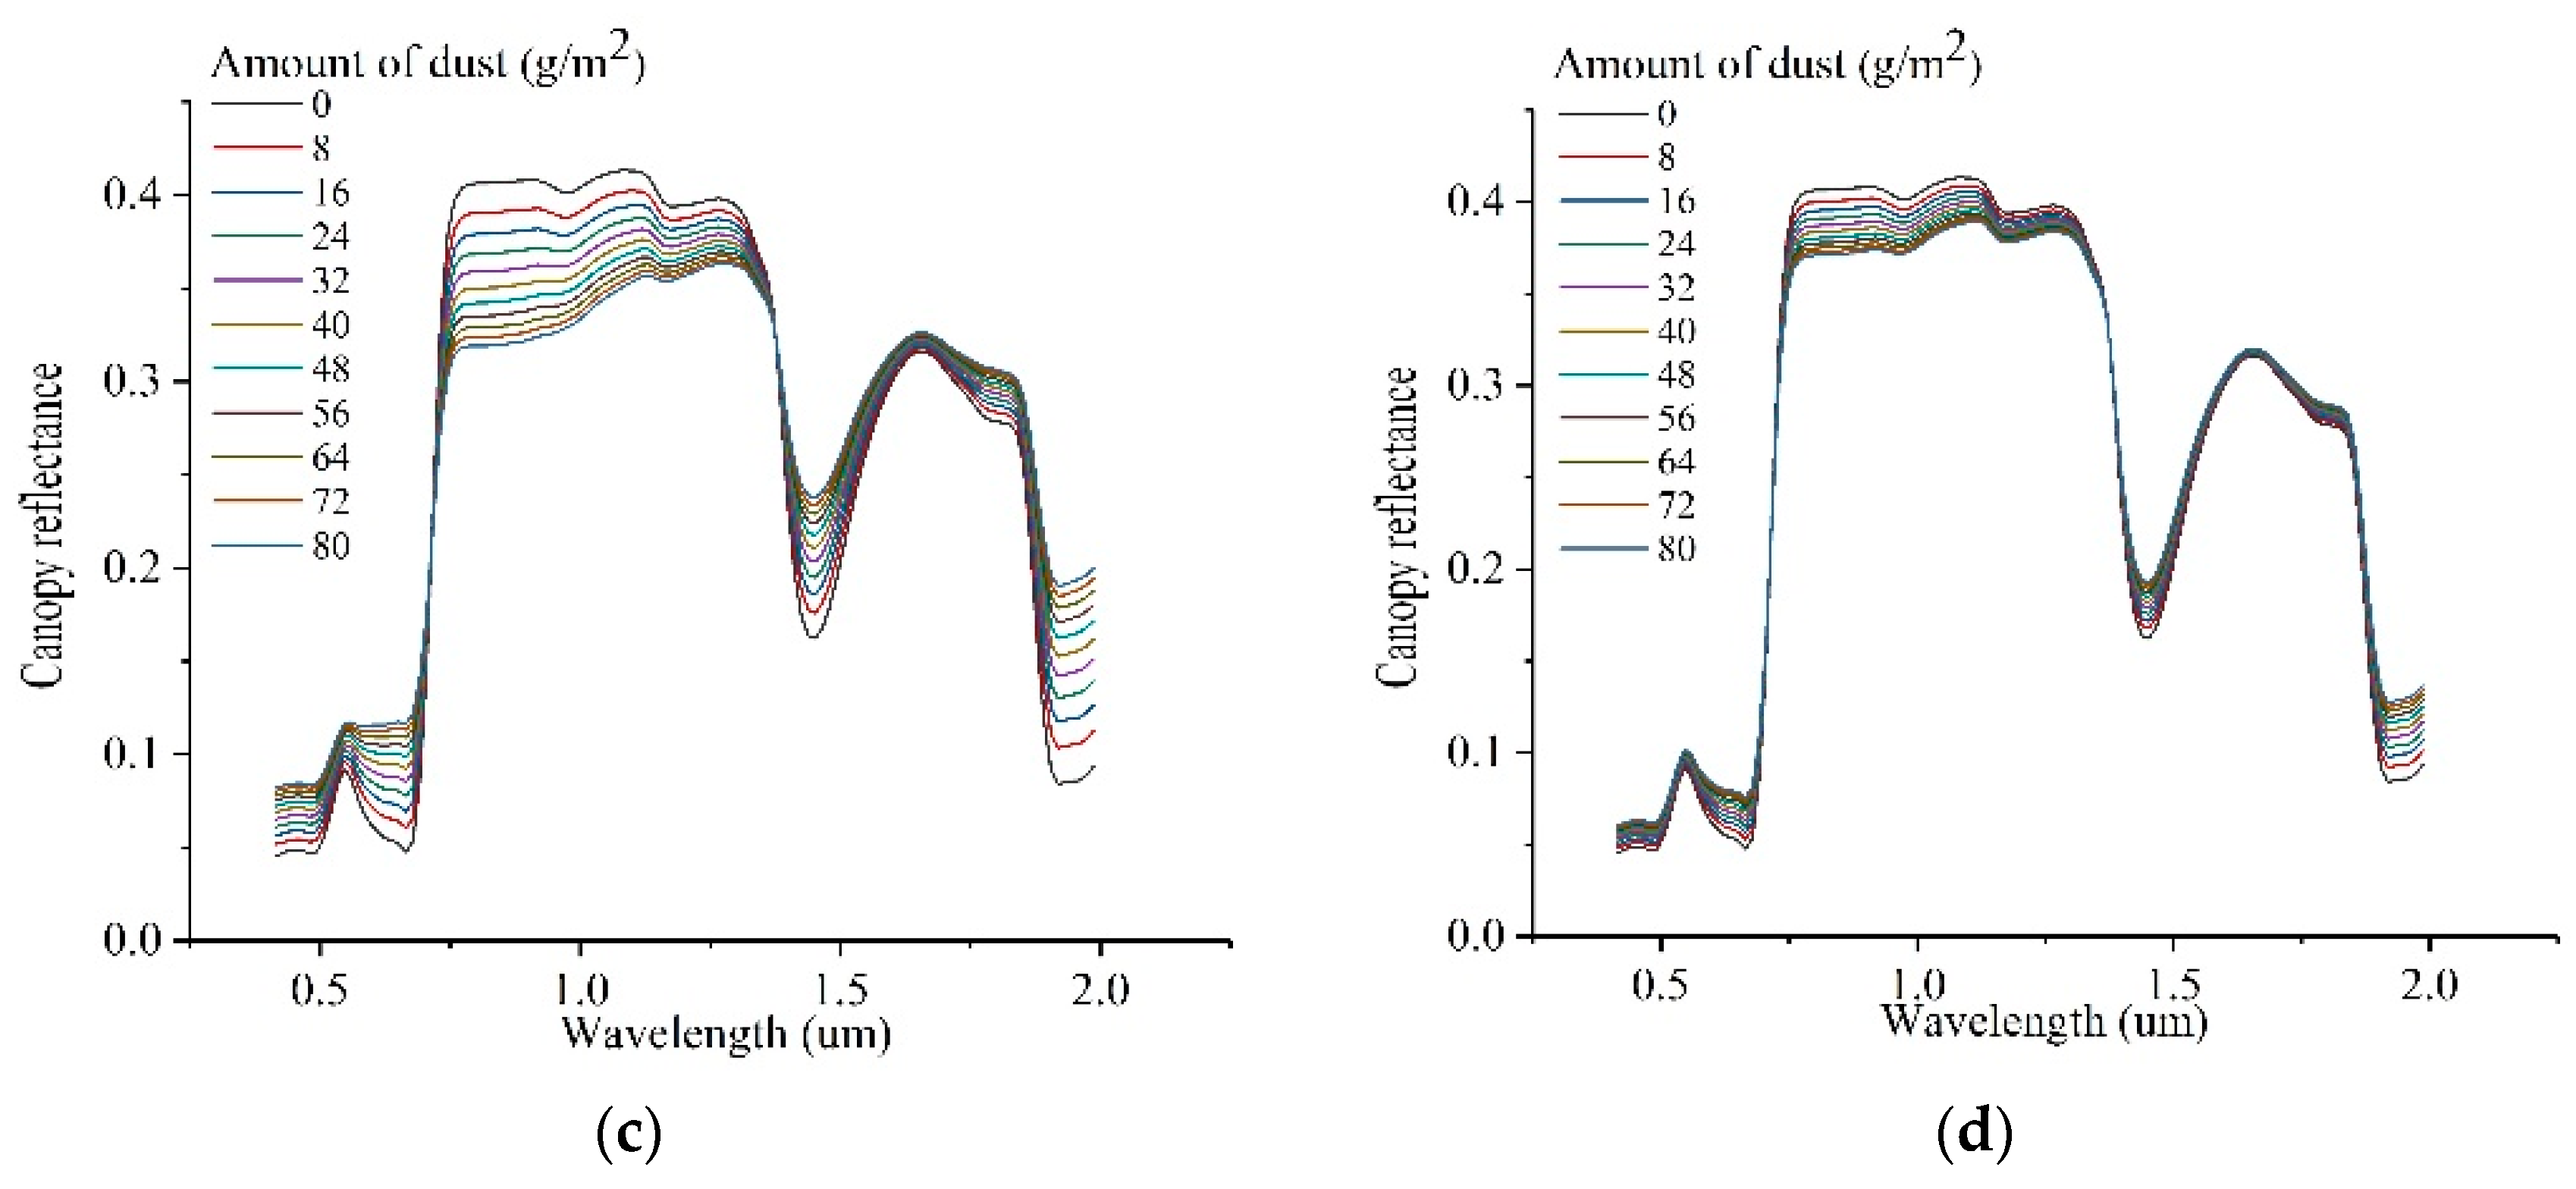
Figure 7.
Mixed pixel spectra under different fractional vegetation covers (FVCs) (FVC of canopy is 100%).
Figure 7.
Mixed pixel spectra under different fractional vegetation covers (FVCs) (FVC of canopy is 100%).

Figure 8.
Effects of dust retention on vegetation spectra under different FVC conditions: (a) 89%, (b) 75%, (c) 51%, and (d) 23%.
Figure 8.
Effects of dust retention on vegetation spectra under different FVC conditions: (a) 89%, (b) 75%, (c) 51%, and (d) 23%.

Figure 9.
Spectral change rates corresponding to different FVCs under dust retention conditions (a) is red band (626 nm), and (b) is NIR band (840 nm)).
Figure 9.
Spectral change rates corresponding to different FVCs under dust retention conditions (a) is red band (626 nm), and (b) is NIR band (840 nm)).
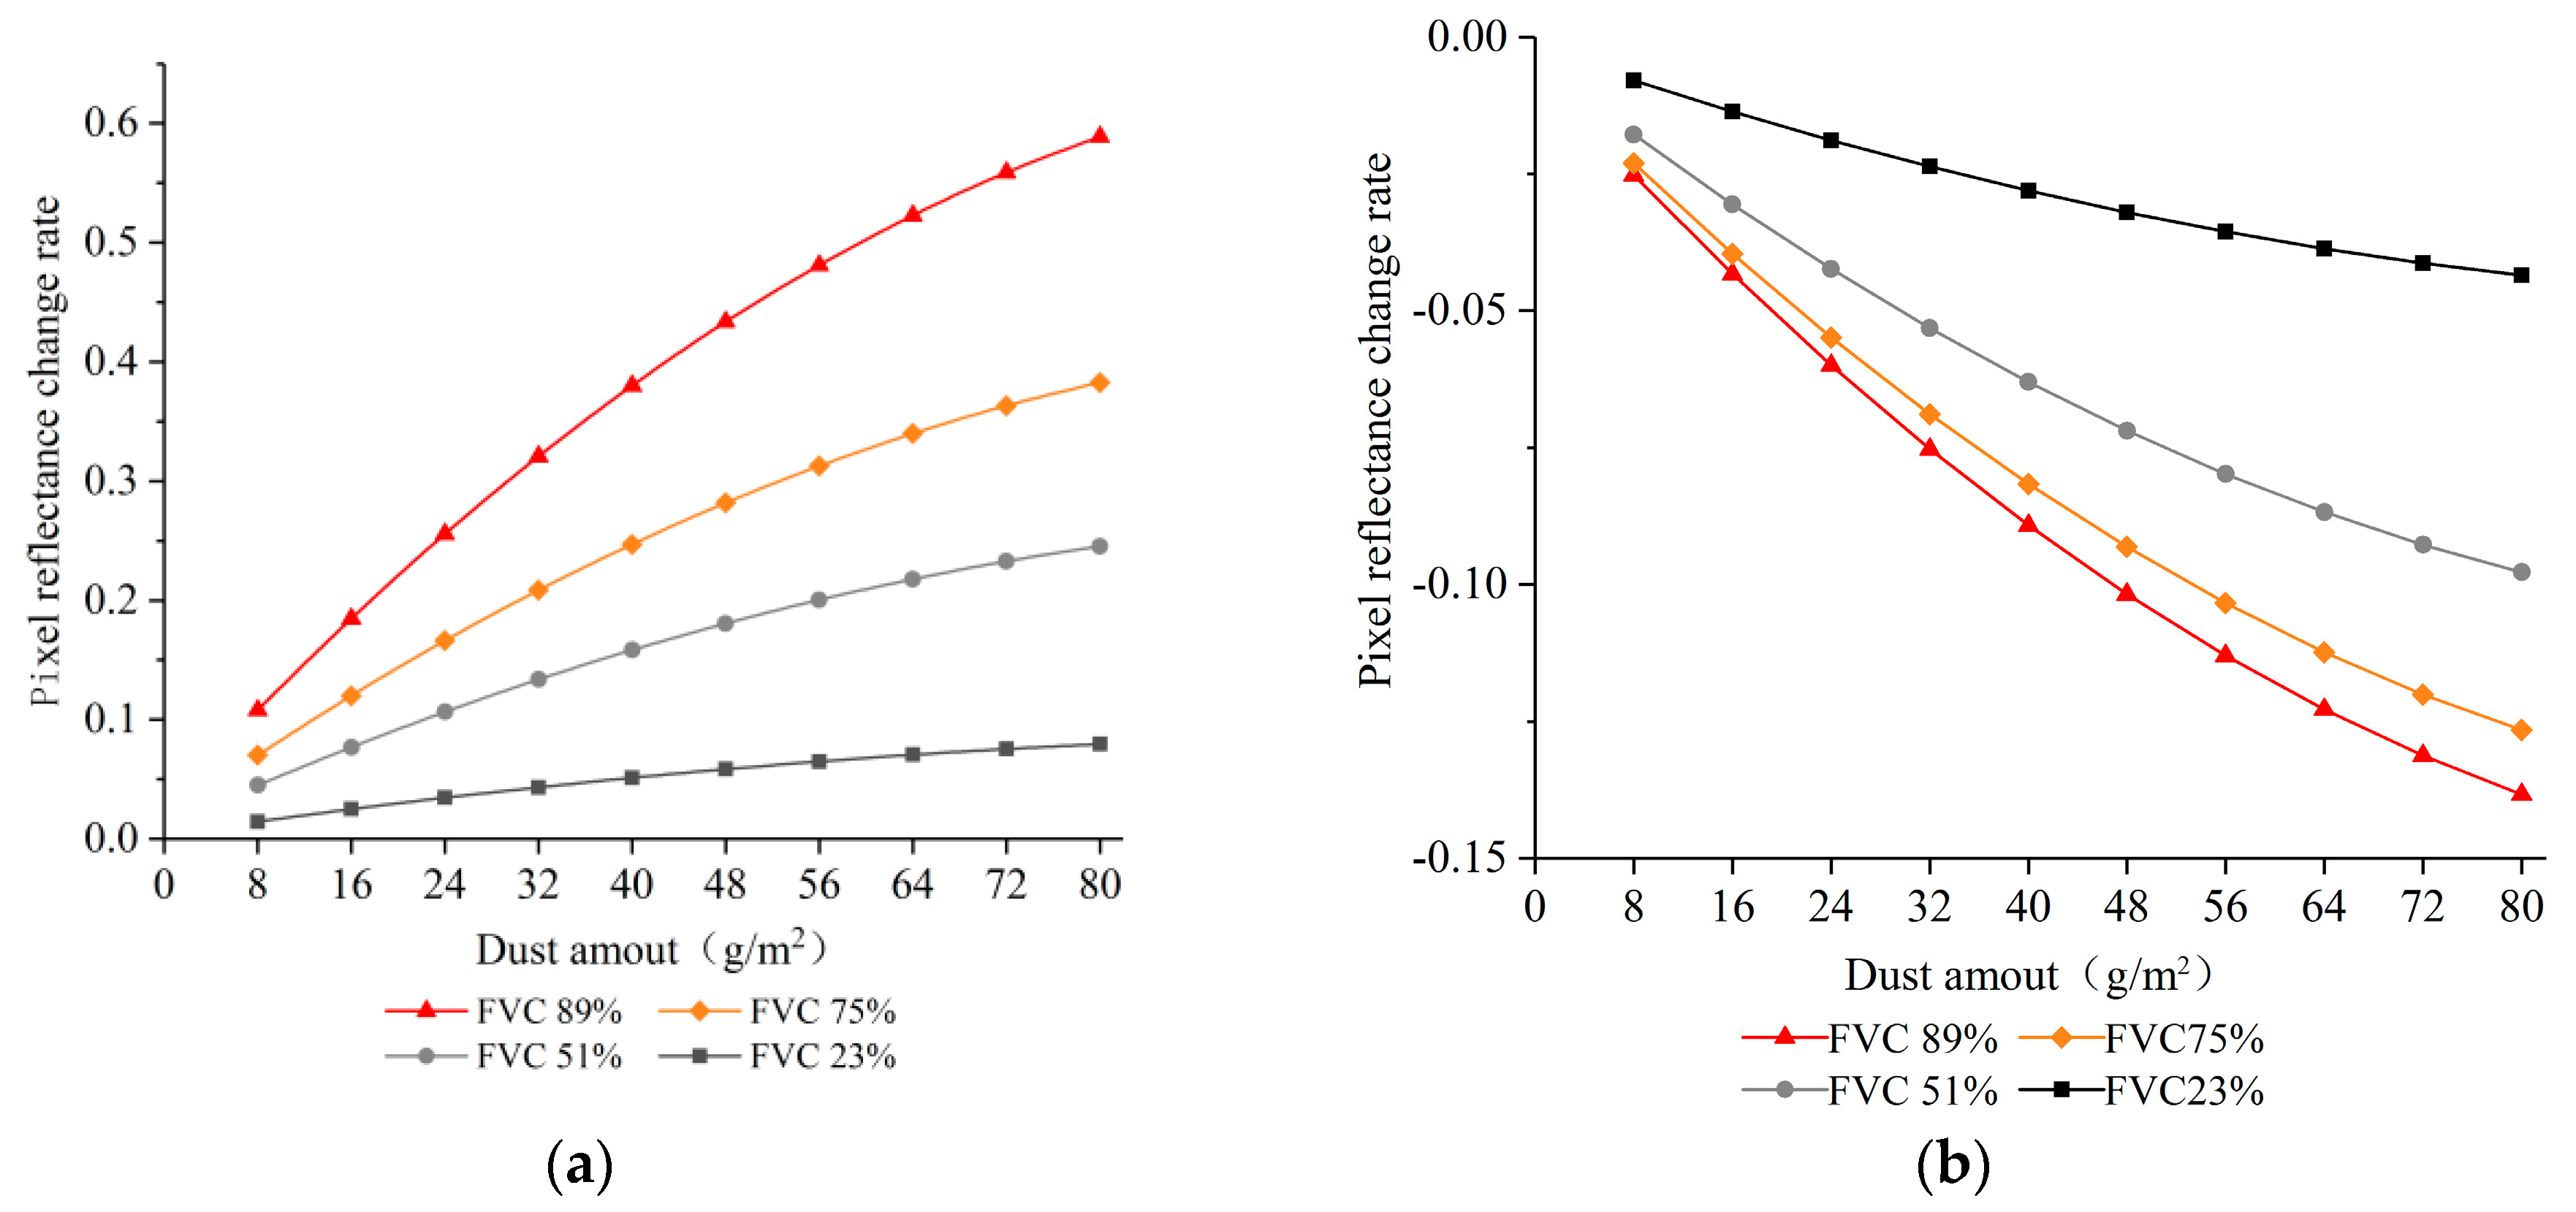
Figure 10.
Reflectance difference in NIR band of Landsat 8 image corresponding to different FVCs (the pixels are spot in the map in Figure 1).
Figure 10.
Reflectance difference in NIR band of Landsat 8 image corresponding to different FVCs (the pixels are spot in the map in Figure 1).
Publisher’s Note: MDPI stays neutral with regard to jurisdictional claims in published maps and institutional affiliations. |
© 2020 by the authors. Licensee MDPI, Basel, Switzerland. This article is an open access article distributed under the terms and conditions of the Creative Commons Attribution (CC BY) license (http://creativecommons.org/licenses/by/4.0/).
Share and Cite
MDPI and ACS Style
Ma, B.; Li, X.; Jiang, Z.; Pu, R.; Liang, A.; Che, D. Dust Dispersion and Its Effect on Vegetation Spectra at Canopy and Pixel Scales in an Open-Pit Mining Area. Remote Sens. 2020, 12, 3759. https://doi.org/10.3390/rs12223759
AMA Style
Ma B, Li X, Jiang Z, Pu R, Liang A, Che D. Dust Dispersion and Its Effect on Vegetation Spectra at Canopy and Pixel Scales in an Open-Pit Mining Area. Remote Sensing. 2020; 12(22):3759. https://doi.org/10.3390/rs12223759
Chicago/Turabian StyleMa, Baodong, Xuexin Li, Ziwei Jiang, Ruiliang Pu, Aiman Liang, and Defu Che. 2020. "Dust Dispersion and Its Effect on Vegetation Spectra at Canopy and Pixel Scales in an Open-Pit Mining Area" Remote Sensing 12, no. 22: 3759. https://doi.org/10.3390/rs12223759
Note that from the first issue of 2016, this journal uses article numbers instead of page numbers. See further details here.