Article

Radiometric Degradation Curves for the ASTER VNIR Processing Using Vicarious and Lunar Calibrations

1
Geological Survey of Japan, National Institute of Advanced Industrial Science and Technology, Central 7, Higashi 1-1-1, Tsukuba 305-8567, Japan
2
Artificial Intelligence Research Center, National Institute of Advanced Industrial Science and Technology, 2-4-7 Aomi, Koto-ku, Tokyo 135-0064, Japan
3
Department of Information Science and Technology, Aichi Prefectural University, 1522-3 Ibaragabasama, Nagaute, Aichi 480-1198, Japan
4
Research and Development Division, Japan Space Systems, Tokyo, 3-5-8 Shibakoen, Minato-ku, Tokyo 105-0011, Japan
5
National Institute for Environmental Studies, Tsukuba 305-8506, Japan
6
Saga University, Saga City 840-8502, Japan
7
Remote Sensing Group, College of Optical Sciences, University of Arizona, Tucson, Arizona, 1630 E University Blvd, Tucson, AZ 85721, USA
8
NASA Goddard Space Flight Center, Greenbelt, MD 20771, USA
*
Author to whom correspondence should be addressed.
Remote Sens. 2020, 12(3), 427; https://doi.org/10.3390/rs12030427
Submission received: 16 December 2019 / Revised: 17 January 2020 / Accepted: 26 January 2020 / Published: 29 January 2020
(This article belongs to the Special Issue ASTER 20th Anniversary)

Abstract

:
The Advanced Spaceborne Thermal Emission and Reflection Radiometer (ASTER) onboard Terra platform, which was launched in 1999, has three separate subsystems: a visible and near-infrared (VNIR) radiometer, a shortwave-infrared radiometer, and a thermal-infrared radiometer. The ASTER VNIR bands have been radiometrically corrected for approximately 14 years by the sensor degradation curves estimated from the onboard calibrator according to the original calibration plan. However, this calibration by the onboard calibrator encountered a problem; specifically, it is inconsistent with the results of vicarious calibration and cross calibration. Therefore, the ASTER VNIR processing was applied by the radiometric degradation curves calculated from the results of three calibration approaches, i.e., the onboard calibrator, the vicarious calibration, and the cross calibration since February 2014. Even though the current degradation curves were revised, the inter-band and lunar calibrations show some inconsistencies owing to the different traceability in the bands by different calibration approaches. In this study, the current degradation curves and their problems are explained, and the new curves that are derived from the vicarious calibration with lunar calibration are discussed. The new degradation curves that have the same traceability in the bands will be used for future ASTER VNIR processing.

Graphical Abstract

1. Introduction

The Advanced Spaceborne Thermal Emission and Reflection Radiometer (ASTER) onboard Terra platform, which was launched in 1999, has three separate subsystems: a visible and near-infrared (VNIR) radiometer, a shortwave-infrared (SWIR) radiometer, and a thermal-infrared (TIR) radiometer [1]. The detector temperature of the SWIR radiometer started to increase owing to the degradation of the detector cooling system, which resulted in the progressive deterioration of product quality in 2007, and low-quality SWIR images have been acquired since May 2008 [2]. However, the VNIR and TIR radiometers have been providing good images for approximately 20 years, and several calibration approaches have been applied to the radiometers [3,4,5,6,7,8,9,10,11,12,13,14,15,16,17].
The preflight calibration utilized standard large integrating spheres whose radiance levels were traceable to primary standard fixed-point blackbodies [3]. The VNIR and SWIR radiometers have onboard calibrators that consist of two halogen lamps with photodiode monitors for the onboard calibration [4]. For VNIR, the vicarious calibration using the reflectance-based approach has been conducted by three separate groups [5]. In April 2003 and August 2017, ASTER observed the Moon (and the deep space) to conduct a radiometric calibration (i.e., lunar calibration) that can measure the temporal variation in the sensor sensitivity of the VNIR bands sufficiently accurately (better than 0.1%) [6]. Numerous studies have reported the cross calibration of ASTER and Moderate Resolution Imaging Spectroradiometer (MODIS) VNIR bands [7,8,9,10,11], but the trends in the cross-calibration results are not necessarily consistent [11]. Inter-band radiometric calibration, which can be used to evaluate inter-band consistency, was applied for the ASTER VNIR bands; then, the radiometric degradation curves of ASTER Bands 2 and 3N with a reference to Band 1, which is well calibrated compared with other bands, were calculated [12].
ASTER data were radiometrically corrected by the L1 processing using the radiometric calibration coefficients (RCC) in the radiometric database (DB) [13], which has the information of the degradation curves. For the VNIR radiometer, its degradation curves in the radiometric DB ver. 1 to 3 have been estimated from the onboard calibrator [14] according the original calibration plan [15] for approximately 14 years since Terra’s launch. However, the degradation curves produced by onboard calibration are inconsistent with the results obtained by vicarious and cross calibrations [16]. Therefore, the degradation curves calculated from the results of three calibration approaches (i.e., onboard, vicarious, and cross calibrations) have been applied to the latest version of the radiometric DB (ver. 4) on the L1 processing since February 2014 [17]. Even though the degradation curves have been revised in the radiometric DB ver. 4, the inter-band and lunar calibrations have reported a few inconsistencies [6,12], which is attributed to the different traceability of each band with a different calibration approach.
In this study, the current degradation curves and their problems are explained, and the new curves, which are derived from vicarious and lunar calibrations, are discussed. The new degradation curves that have the same traceability in the bands have been selected to be used for the next radiometric DB ver. 5 in the ASTER VNIR processing.

2. Vicarious and Lunar Calibrations for ASTER VNIR

2.1. ASTER VNIR

The ASTER VNIR radiometer is the multiband sensor with a 15 m spatial resolution and a 60 km swath width; the instrument has three bands (Bands 1, 2, and 3N) with a nadir view and one band (Band 3B) with a backward view. Bands 3N and 3B were used for the topographic interpretation and the digital elevation model (DEM) mapping.
The center wavelength of Bands 1, 2, and 3 are 0.56, 0.66, and 0.81 micrometers, respectively [3]. This VNIR radiometer has three gain modes (high, normal, and low gains). The values of normal and low gains in all bands are 1.0, 0.75, respectively. The value of high gain in Band 1 is 2.5, and the value of high gain in Bands 2 and 3 is 2.0 [1].

2.2. Vicarious Calibration Using the Reflectance-Based Method

Vicarious calibration using the reflectance-based method [18,19] was performed for ASTER VNIR by three separate groups [i.e., Saga University, the University of Arizona, and the National Institute of Advanced Industrial Science and Technology (AIST)]. The method is used by all three groups with differences in the equipment used in the data collection, sampling strategies, and the radiative transfer code results. Although there were differences in the method used by the groups, the results produced by the three groups were in good agreement between each other for four years after the launch [5].
In this study, the RCCs for all ASTER VNIR bands (Bands 1, 2, 3N, and 3B) were calculated from the vicarious calibration by the AIST method [5,12,20,21,22]. The AIST group performed a field campaign for the vicarious calibration for ASTER at six sites in the United States and two sites in Australia. We used the data from all eight sites (the United States six and Australian two sites) to obtain the degradation curves for the current radiometric DB ver. 4. However, to have a more clear traceability with almost the same quality, the new degradation curves for the next ver. 5 of the radiometric DB were derived from the vicarious calibration at only three sites of Ivanpah Playa (35.57N, 115.40W) in California, USA, Railroad Valley Playa (38.50N, 115.69W), and Alkali Lake (37.85N, 117.41W) in Nevada, USA.
At the three sites, which are horizontal planes in clay-dominated dry lakes in semi-arid areas, the field campaigns were carried out with a rectangular target of 90 × 80 m in size and approximately 900 measurements of the surface reflectance factor of the target for one band for each field campaign. However, except these three sites, the field campaigns were performed for the current radiometric DB ver.4 without the abovementioned conditions of ground surface and/or measurements, owing to the convenience of each site.
The solar model for this work is based on the World Radiation Center model, because this model was standard for the Terra sensors and was selected by the ASTER science team [5]. After the Terra lunch, many newer solar models have been proposed, and one of the recent ASTER products, ASTER L1T generated by the United States Geological Survey [23], used a new solar model; however, the effect of this switch of the model is estimated at <0.3% for all VNIR bands [24].
Figure 1 shows the RCCs vs. days since launch (DSL) in ASTER VNIR bands derived from this vicarious calibration from 2000 to 2017.

2.3. Lunar Calibration with the Spectral Profiler Model

Lunar calibration is one of the radiometric calibrations using the Moon that is conducted by comparing the observed Moon brightness with the expected brightness calculated from the lunar surface reflectance model [25,26,27]. Although the absolute accuracy of the lunar calibration method is considered to be insufficient (5–10%), the lunar calibration, temporal variation of relative sensor sensitivity can be accurately measured on the order of 0.1% [6].
In April 2003 (DSL = 1213) and August 2017 (DSL = 6440), ASTER observed the Moon and the deep space to perform lunar calibration with the Robotic Lunar Observatory [25] and spectral profiler (SP) [26,27] models, and the calibration results of the two models were consistent with each other within the error range [6].
In this study, we use the relative sensor sensitivity degradation (RD) from 2003 to 2017, and the RD value is the degradation ratio of RCC (DSL = 6440)/RCC (DSL = 1213). The RDL is the RD value derived from the lunar calibration with the SP model. The values of RDL in Bands 1, 2, 3N, and 3B are shown in Table 1 [6].

3. Radiometric Degradation Curves in the Current Radiometric DB and Its Problems

ASTER data were radiometrically corrected by the L1 processing using the RCC in the Radiometric DB [13], which has the information of the degradation curves. For the VNIR radiometer, the degradation curves in the old radiometric DBs ver. 1 to 3 have been estimated from the onboard calibrator [14] according the original calibration plan [15] for approximately 14 years since the launch. However, the degradation curves produced by onboard calibration are inconsistent with the results from vicarious and cross calibrations [16], especially for Bands 1 and 2.
The radiometric degradation curves in the current radiometric DB ver. 4 have been used for L1 processing since February 2014, and the best curve obtained using a different estimation method of each band was selected as of 2014 by the ASTER science team [17]. However, a problem has occurred using a different traceability of each band as described below.

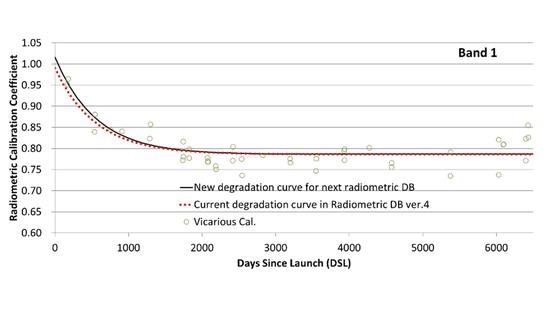
3.1. Radiometric Degradation Curves

The dotted lines in Figure 2 indicate the current degradation curves in the radiometric DB ver. 4 for ASTER VNIR bands estimated from the results of three calibration approaches (i.e., onboard, vicarious, and cross calibrations) from 2000 to 2012. The equations and their parameters are shown in Table 2 and Table 3.
The degradation curve of Band 1 in the radiometric DB ver. 4 [dotted line in Figure 2a] was estimated from the results of three calibration approaches, but the vicarious calibration influences the degradation curve the most among the approaches. The degradation curve is expressed by the following exponential equation in the degradation model for the contamination and/or corrosion [28].
R ( d ) = a 0 c = a 0 × T / T 0 = a 0 ( 1.0 a 1 )   exp ( a 2   d ) + a 0   a 1
where R(d) represents the radiometric calibration coefficient (RCC) of the DSL d, c is the scaled calibration coefficient, T represents the transmittance of DSL d in the radiometer optics (lenses, mirrors and etc.), and T0 represents the transmittance T when d = 0. The degradation parameters, a0, a1, and a2 represent the RCC at launch, the minimum (saturated) transmittance of the contamination/corrosion layer of the sensor lenses, and the degradation rate, respectively. Band 1 has a0 = 0.990, a1 = 0.794, and a2 = 0.00181 coefficients (Table 2).
The a0 coefficient, which equals the R(0), was extrapolated by the RCC trend (i.e., the a0 coefficient was estimated from best-fit with the distribution of RCCs) in the period of 0 < d ≤ 673 by the onboard calibration [4]. That was because the RCC trend in this period by the onboard calibration shows smooth curve [dashed line in Figure 2a] and was consistent with the trend by the vicarious and cross calibrations.
The a1 and a2 coefficients were estimated from the distribution of the RCCs of the vicarious calibration [16] and the RCCs of the cross calibration [29,30] by the least squares method. The RCCs of the cross calibration were obtained from image data with high-gain mode and solar zenith angle limited to 45° or less.
The degradation curve of Band 2 in the radiometric DB ver. 4 [dotted line in Figure 2b] was estimated from the RCCs in the vicarious and cross calibrations, and the curve is also expressed by Equation (1). The coefficients of degradation curve in Band 2 are a0 = 0.949, a1 = 0.886, and a2 = 0.00181 (Table 2). However, Band 2 had a problem with the gain ratio at the time of determining the value of these coefficients; the radiance obtained from the Band 2 image of the high-gain mode shows a 7–11% difference with the normal-gain mode [7,29,30]. In most ASTER images used for the vicarious calibration, the gain modes of Bands 1, 2, 3N, and 3B are set to High, High, Normal, and Normal, respectively. However, the normal-gain mode was used for all ASTER bands in the onboard calibration. Therefore, the large difference (almost 10%) existed in the RCCs between vicarious and onboard calibrations. To determine the degradation coefficients in the radiometric DB ver. 4, the onboard calibration result was not applied to Band 2. It was difficult to use both calibrations together owing to the abovementioned large difference, and the recent RCC from the onboard calibration seemed too small to apply the coefficients. Because the distribution of RCCs of vicarious calibration and cross calibration is highly scattered, it is not desirable to obtain the coefficient of the degradation curve only from this distribution. Therefore, the a2 coefficient that determines the shape of the curve, which is the degradation rate, was assumed to be the same as that of Band 1. The a0-high coefficient, which equals the R(0) in the high-gain mode, was estimated from the best-fit with the distribution of the RCCs by vicarious and cross calibrations using the image in the high-gain mode. The a0 coefficient, which equals the R(0) in the normal-gain mode, was calculated from a0-high and the gain ratio rg of the normal-gain and the high-gain mode (i.e., a0= a0-normal = a0-high × rg). The value of rg was investigated from the two sets of the cross calibration, MODIS Band 1 vs. ASTER Band 2 with the normal-gain mode and MODIS Band 1 vs. ASTER Band 2 with the high-gain mode [29]. The values of a0-high and rg were 0.87 and 1.091, respectively; thus a0 = a0-normal = a0-high × rg = 0.87 × 1.091 = 0.949. Lastly, a1 was estimated from the distribution of the RCCs of the vicarious calibration and the RCCs of the cross calibration by the least squares method. The RCCs of the cross calibration was obtained from image data with a high-gain mode and solar zenith angle limited to 45° or less. The cause of this gain ratio problem is that the ratio after launch changed by almost 10% from the preflight calibration ratio, which was determined from the analysis of the onboard electrical calibration [31]. On the basis of this analysis, in the radiometric DB ver. 4, the Band 2 images in the high-gain mode were radiometrically corrected by +8% [17].
The degradation curve of Band 3N in the radiometric DB ver. 4 [dotted line in Figure 2c] was mainly estimated from the RCCs in the onboard calibration, and this curve is expressed by the following equations [4,14]:
R ( d ) = a 0 + a 1 d + a 2 d 2   in   d   <   673 R ( d ) = a 1   exp ( a 2   d ) + a 0   in   673     d   <   4825 R ( d ) = a 0   in   4825     d
where the values of coefficients (i.e., a0, a1, and a2) of the degradation curve are shown in Table 2 and Table 3.
Band 3N does not have a large difference in the RCCs between onboard and vicarious calibrations but has a small difference in the degradation trend. The degradation trend by the onboard calibration shows a gradual downward slope in all periods (from the launch to the present) [dashed line in Figure 2c]. The trend obtained by the vicarious calibration also shows a downward slope, but the recent trend does not appear to have a slope (Figure 1). Therefore, the degradation curve in d < 4825 was obtained from the onboard calibration, as with the radiometric DB ver. 3. It was assumed that the curve in 4825 ≤ d did not degrade, and the RCCs were then set to be a constant.
Band 3B does not have a correction for the degradation [dotted line in Figure 2d], and the equation is as follows:
R ( d ) = a 0 = 1
In the vicarious calibration, the degradation of Band 3B was observed. However, this degradation is small compared with that of the other bands (Bands 1, 2, and 3N), and Band 3B does not have an onboard calibrator. Therefore, the radiometric DB ver. 4 assumed that Band 3B had no degradation, as with the radiometric DB ver. 3.

3.2. Problems with the Current Radiometric DB

The degradation curves were revised in this current radiometric DB ver. 4, but the inter-band and lunar calibrations have reported problems [6,12], which are probably caused by the different traceability of each band with the different calibration approach.
Inter-band radiometric calibration can be used to evaluate the inter-band consistency. The solid lines in Figure 2b,c are the degradation curves of Bands 2 and 3N calculated from the degradation curve of reference band, Band 1, using the inter-band calibration technique. In this study, Band 1 is set to a reference band, because the three calibration approaches (i.e., onboard, vicarious, and cross calibrations) exhibited good agreement between each other for the Band 1 degradation curve estimation, in the early stage (from launch day to approximately day 673), and Bands 2 an 3N do not have good agreement among three approaches [12]. The degradation curves of Bands 2 and 3N from this inter-band calibration have inconsistencies with the curves from the radiometric DB ver. 4 and the onboard calibration in Figure 2.
The inter-band inconsistency owing to the difference in traceability can also be read on the basis of the lunar calibration results. Figure 3 shows the comparison of the RD in VNIR bands from 2003 to 2017 derived from the RCCs in the radiometric DB ver. 4 and three different calibration methods (i.e., lunar, inter-band, and onboard calibrations) [6]. RD4, RDL, RDI, and RDO are the RD values derived from the radiometric DB ver.4, lunar calibration, inter-band calibration, and onboard calibration, respectively.
The RD4 of Band 1 in the radiometric DB ver. 4 is consistent with RDL in the lunar calibration, but for Bands 2 and 3B, the RD4 of ver. 4 is larger than RDL of the lunar calibration; however, for Band 3N, the RD4 of ver. 4 is smaller than RDL of the lunar calibration. However, the RDI in the inter-band calibration is consistent with the RDL in the lunar calibration for all three bands, and RDO in the onboard calibration shows lower values compared with RDL in the lunar calibration for all bands.
On the basis of the abovementioned points, it was necessary to improve the degradation curve in the current radiometric DB.

4. Radiometric Degradation Curves in the Next Radiometric DB

In the next radiometric DB ver. 5 for ASTER VNIR L1 processing, new radiometric degradation curves with the same traceability among the bands are necessary to obtain good inter-band consistency.

4.1. Selection of the Calibration Approach

In the ASTER science team, several calibration approaches (i.e., preflight, onboard, vicarious, cross, lunar, and inter-band calibrations) have been performed and discussed for the ASTER VNIR radiometers. Vicarious and lunar calibration approaches have been selected [32], and the radiometric degradation curves for ASTER VNIR processing have been derived from the vicarious and lunar calibrations. The basic ideas (i.e., reason and philosophy) of this selection are explained as follows.
For the onboard calibration, the uncertainty of the onboard calibrator typically increases with time in the harsh environment of space [5,33]. In ASTER, as described above, the RCCs of Band 1 obtained from the onboard calibration tended to deviate from the RCCs of other calibration approaches after 673 days since the launch, and Band 3B did not have an onboard calibrator. Therefore, we did not use the ASTER onboard calibrator, which has been in space for a long period of time, to obtain the degradation curves for the next radiometric DB.
Recently, numerous studies have reported the cross calibration of ASTER and Terra-MODIS VNIR bands [7,8,9,10,11], but the trends in the cross-calibration results are not necessarily consistent. This inconsistency may be attributed to the differences between the versions of the radiometric DBs used in the ASTER radiometric calibration [11]. The different corrections of spectral and spatial effects between ASTER and MODIS can also cause inconsistencies. At this point in time, it is difficult to obtain the degradation curves of the ASTER VNIR bands from the cross calibration.
The inter-band calibration appears to be a promising approach, because it was consistent with vicarious and lunar calibrations, as shown in the previous section. However, the inter-band calibration in the current analysis method cannot be applied between bands with different view-angles and observation times, i.e., between nadir-view bands (Bands 1, 2, and 3N) and backward-view bands (Band 3B). Therefore, the degradation curve of Band 3B cannot be obtained from inter-band calibration with reference to Band 1, and the same traceability cannot be given to all bands.
The degradation curve of the sensor cannot be obtained from only the preflight calibration, and its RCC can only be used at the launch. The assumption that the sensor is not damaged at the launch is needed in order to apply the RCC of the preflight calibration to the RCC of the degradation curve at the launch. From the point of view of the onboard and vicarious calibrations in Figure 1 and Figure 2, it appears that there was a small damage at the launch for ASTER VNIR, and thus, the RCC from the preflight calibration is not used.
Therefore, the remaining calibration approaches (i.e., vicarious and lunar calibrations) are selected. Vicarious calibration is an excellent approach to obtain an absolute value of the RCC when the sensor is performing normal observation (observing the earth). Although the absolute accuracy of the lunar calibration is considered to be insufficient (5–10%), the relative accuracy of lunar calibration (i.e., temporal variation of relative sensor sensitivity) is extremely high (the order of 0.1%) [6]. Vicarious calibration in ASTER VNIR has been carried out many times throughout the ASTER operation period; however, lunar calibration has only been conducted twice, in April 2003 (DSL = 1213) and August 2017 (DSL = 6440). Therefore, the base of the degradation curve is obtained from the vicarious calibration, and the result of the lunar calibration with high accuracy against relative changes (relative degradation) is used as the constraint condition.

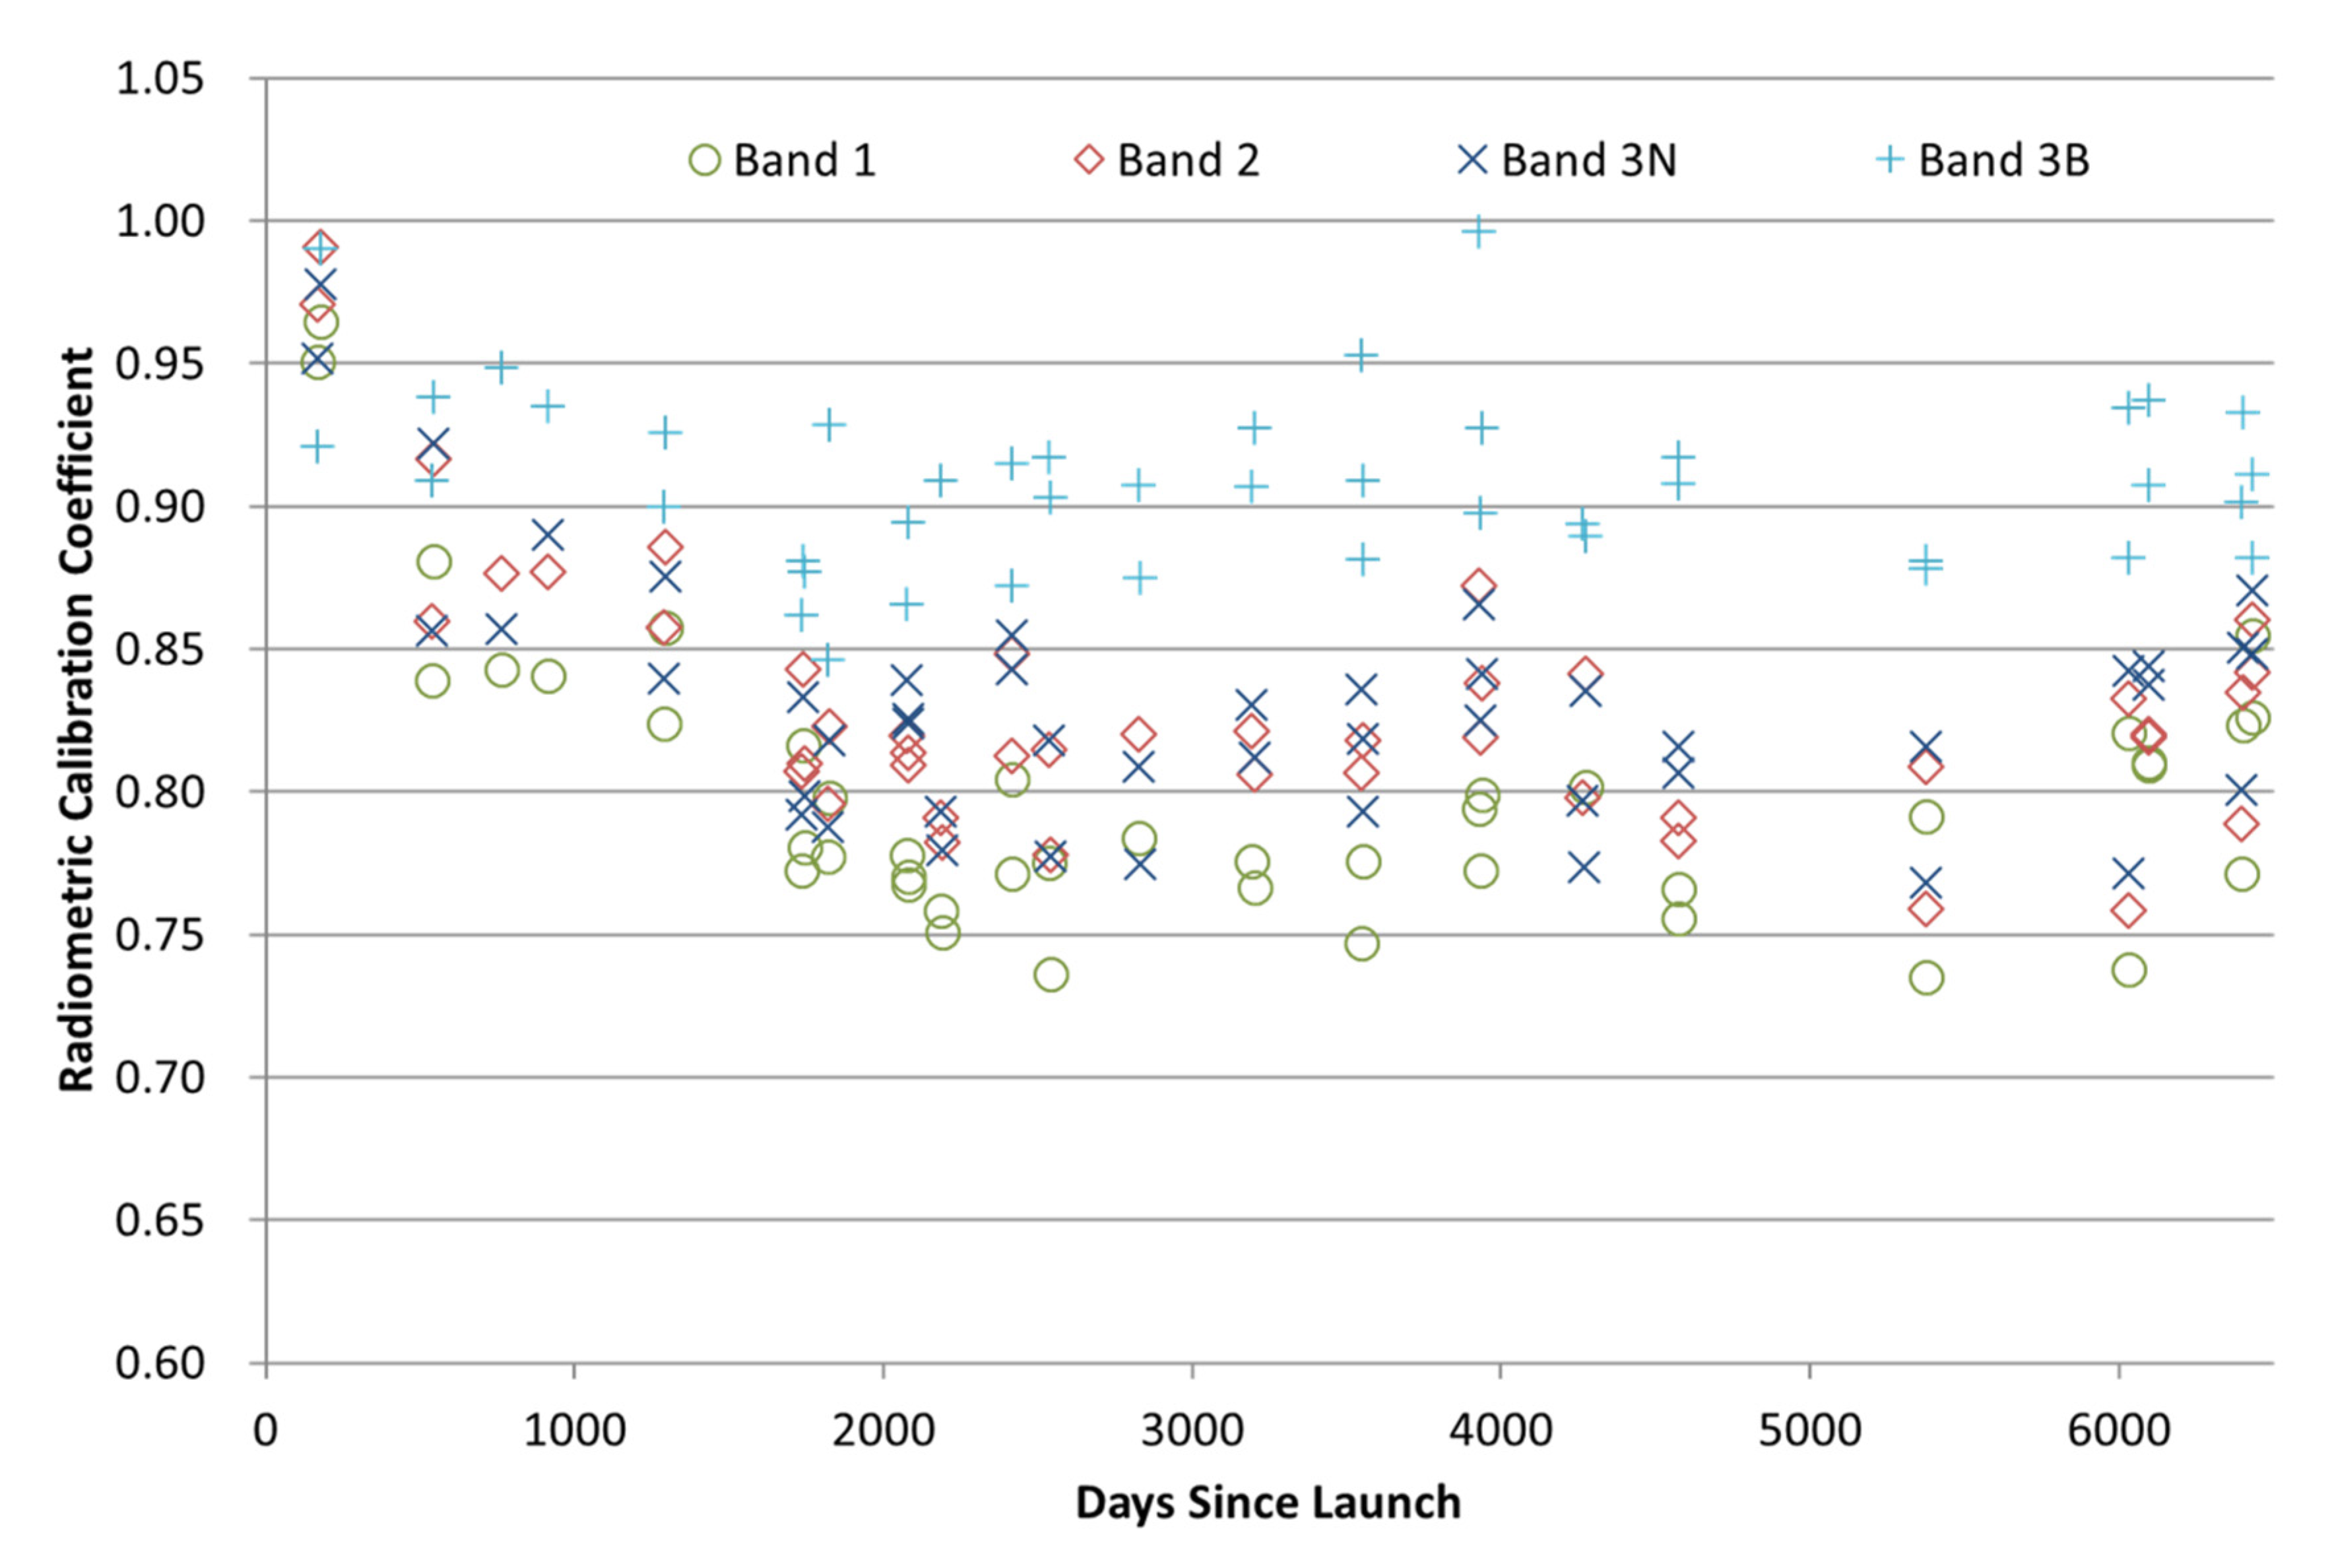
4.2. Radiometric Degradation Curves

Because the uncertainty of the vicarious calibration using the reflectance-based method is not small (Appendix A), it is difficult to correctly obtain the curve parameters of the degradation from the RCC distribution of the vicarious calibration. However, if the degradation stops and the RCC value can be regarded as a constant (or can be regarded to have a linear distribution), a relatively accurate average (or regression line) of RCCs can be obtained even from the vicarious calibration.
In Figure 1, after 3000 DSL, the degradation stops in all bands, and the RCC is almost constant. Thus, the RCC value after 3000 DSL can be set by the average of the RCCs of vicarious calibration. On the other hand, before 3000 DSL, we decided to obtain the degradation curve parameters by the least squares method from the distribution of the RCCs of the vicarious calibration, and the result (the value of relative degradation) from the lunar calibration is used as a constraint for the estimation of the degradation curve parameters as described below.
After 3000 DSL, the degradation is thought to have stopped; the RCC is assumed to be constant and is expressed by the following equation:
R ( d ) = a 0   = x   in   3000   <   d
where x is the average of the RCCs derived from the vicarious calibration over 3000 DSL. For the period before 3000 DSL, the same degradation model [28] as Equation (1) is adopted and expressed by the following equation:
R ( d ) = a 0   c = a 0 × T / T 0 = a 0   ( 1.0 a 1 )   exp ( a 2   d ) + a 0   a 1   in   0     d     3000
where R(d) represents the radiometric calibration coefficient (RCC) of the DSL d, c is the scaled calibration coefficient, T represents the transmittance of DSL d in the radiometer optics (lens, mirror and etc.), and T0 represents the transmittance T when d=0. The degradation parameters a0, a1, and a2 represent the RCC at launch, the minimum (saturated) transmittance of the contamination/corrosion layer of the sensor lenses, and the degradation rate, respectively. The degradation coefficients a0, a1, and a2 are obtained by the least squares method from the RCCs of the vicarious calibration in Figure 1, and the following two constraints are given:
R ( 3000 ) = a 0   ( 1.0 a 1 )   exp ( 3000 × a 2 ) + a 0   a 1 = x
R ( 6440 ) R ( 1213 ) = x a 0   ( 1.0 a 1 )   exp ( 1213 × a 2 ) + a 0   a 1 = y
where y is the value of RDL in Table 1 calculated from the lunar calibration. Equation (6) is used to connect (at 3000 DSL) Equation (4) of the straight line (i.e., constant value) to Equation (5) of the curve; Equation (7) is used to reflect the result of the lunar calibration.
The radiometric degradation curves obtained from the abovementioned equations are shown in Figure 4, and their coefficients are shown in Table 4.

5. Discussion

The shape of the newly obtained degradation curves in Figure 4 for the next radiometric DB is similar between bands. This approach considerably differs from that used in the current radiometric DB ver. 4. The shape of new degradation curves is similar to the curve shape of the inter-band calibration, and the inter-band consistency of new curve shows almost same trend as the inter-band calibration within the uncertainty of the inter-band calibration (Appendix B). In addition, the shape of new degradation curves is also different from the curve shape of the onboard calibration in Figure 2. The onboard calibrator was in the outer space for a long period of time after the launch, and its degradation may have occurred. In all bands, the RCC value at the launch (the RCC value when d = 0) obtained from the new degradation curve slightly differs from 1.00 (by approximately 1–3%). This may indicate that the sensor experienced some changes at the launch, but the difference was small; thus, this discrepancy may be within the uncertainty in the degradation curve.
The new degradation curve of Band 1 is almost the same as that in the current ver. 4. There is only a slight difference in the RCC value at launch. Because Band 1 degraded more rapidly than the other bands, the degradation curve can be accurately obtained from the vicarious calibration, even if there is no constrain from the result of the lunar calibration.
The new degradation curve of Band 2 is very different from that in the current ver. 4. The degradation curve in the current ver. 4 has been calculated from the data in the old radiometric DB ver. 3. The problem of electrical calibration for the gain ratio [31] was not improved in the old radiometric DB. Therefore, the degradation curve of ver. 4 was obtained on the basis of several assumptions, and some of the assumptions may have been inappropriate.
For Band 3N, because the degradation in the current ver. 4 is based on the onboard calibration, the new curve obtained from vicarious and lunar calibrations also considerably differs from the current version. However, after 4825 DSL, the consistency between the current and new curves is higher because the vicarious calibration is also used as a reference for the current curve.
Band 3B in the current ver. 4 was set to have no degradation. However, for the first time, its degradation curve is obtained in this study. In this new degradation curve, approximately 10% degradation exists.
The new degradation curves for the next radiometric DB have the same traceability in the bands, can represent the distribution of the RCCs from the vicarious calibration, and are highly consistent with the lunar calibration.

6. Conclusions

In 2014, the radiometric correction of ASTER VNIR bands was once improved by the current radiometric degradation curves in the radiometric DB ver. 4 [17], compared to the previous DBs ver. 1 to 3. However, the calibration approach applied for each band is different; thus, the traceability is complicated. Therefore, the problem with the radiometric DB ver. 4 was indicated by inter-band and lunar calibrations.
For the next radiometric DB ver. 5, vicarious and lunar calibrations were selected, and the base of the degradation curve was obtained from the vicarious calibration, and the result of the lunar calibration with high accuracy against relative changes (relative degradation) was used as the constraint condition. The shape and format of the calibration function of the newly obtained degradation curves for the next radiometric DB are now similar between bands.
The new degradation curve for Band 1 is almost the same as that in the current radiometric DB ver. 4; however, other bands have curves that differ from the current version. Specifically, for Band 3B, there is no degradation in the current ver. 4, but the degradation of nearly 10% exists in the new degradation curve.
In this study, for the next update of the radiometric DB, new favored degradation curves were obtained. The favored curves have the same traceability in the bands, can represent the distribution of the RCCs from the vicarious calibration, and are consistent with inter-band and the lunar calibrations. However, in order to obtain a better degradation curve in the future, further analysis of other calibration approaches, e.g., cross calibration and pseudo-invariant calibration had better to be conducted (Appendix C).
Such long-term calibration activities for one sensor are rare, and we expect that the experience and knowledge will be useful for the calibration of other sensors in the future.

Author Contributions

Conceptualization, S.T., T.K., K.O., and K.J.T.; methodology for new degradation curve, S.T., H.Y., T.T., and K.J.T.; methodology for the current degradation curve, S.T., K.A., S.F.B., J.S.C.-M., K.J.T., F.S., H.Y., and T.T.; analysis for the AIST vicarious calibration, S.T., A.K., and H.Y.; analysis for the lunar calibration, T.K.; analysis for the inter-band calibration, K.O.; analysis for the onboard calibrator, F.S.; writing—original draft preparation, S.T.; writing—review and editing, S.T., H.Y., K.O. All authors have read and agreed to the published version of the manuscript.

Funding

This research was supported partly by the Ministry of Economy, Trading and Industry of Japan (METI) and National Aeronautics and Space Administration (NASA).

Acknowledgments

The authors appreciate Yasushi Yamaguchi and Michael Abrams for their special support for the ASTER-VNIR calibration activity, and to all members in ASTER science team. The authors also appreciate the Bureau of Land Management offices in Tonopah, NV, and Needles, CA, for their help in accessing the test sites in California and Nevada, and the numerous people for assisting with the field data collections. The authors thank Koki Iwao for providing information of ASTER L1 processing and Yukiko Doyama for assisting with field equipment preparation in AIST. The authors also thank Satoru Yamamoto who provided the onboard calibration trend.

Conflicts of Interest

The authors declare no conflict of interest.

Appendix A

In this study, we have used the legacy vicarious calibration approach based on the reflectance-based method that was established in 1990s, and the uncertainty of this approach is not small, approximately 5%, [34] which is calculated by the analysis of the error sources for one field campaign (or one data). However, the uncertainty of the degradation curve R(d) derived from multiple field campaigns (or multiple data) shows smaller than the uncertainty from one field campaign as described below.
The value uc of the uncertainty in the degradation curve R(d) is expressed by the following equation [35]:
u c = u r 2 + u s 2
where ur and us represent the uncertainty of the degradation curve R(d) for the random and systematic components respectively. The ur value is written by the deviation of the R(d) as a regression curve of the RCC derived from the vicarious calibration.
u r = i = 1 n ( R ( d i ) R i ) 2 n ( n p )
where di represents the DSL of the i-th field data (or field campaign), Ri is the RCC of the DSL di, n is the number of the field data, and the p is the number of the parameters for the function R(d). On the other hand, the error sources of the reference panel and solar irradiance can be set at least as the systematic components. Therefore, the us value is calculated from the error sources of the reference panel (2.0%) [34] and solar irradiance (0.3% or less) [24]. Table A1 shows these uncertainties calculated above equations for ASTER VNIR in this study, and the uncertainty uc is estimated to be approximately 2% or more.
Table A1. The uncertainties of R(d) calculated from the multiple field data for ASTER VNIR bands.
Uncertainty of R(d)Duration
(d:DSL)
Band 1Band 2Band 3NBand 3B
ur0 ≤ d ≤ 30000.00530.00560.00760.0089
3000 < d0.00720.00650.00640.0067
usIndependent to d0.0200.0200.0200.020
uc0 ≤ d ≤ 30000.0210.0210.0220.022
3000 < d0.0210.0210.0210.021
Many of the error sources of the vicarious calibration are assumed to be the random components, however if there are unknown error sources of the systematic components except the reference panel and solar irradiance, the uc value should become larger.

Appendix B

The shape of newly obtained degradation curves is similar to the curve shape of the inter-band calibration, but the shape of the current degradation curve of Band 2 and 3N in the radiometric DB ver.4 is different from it (Figure A1a–c). The RCC difference of Band 1, Band 2, and Band 3N between new degradation curve and the degradation curve from the inter-band calibration are 0.003, 0.016, and 0.018 respectively, which are average values in the period of 0–6500 DSL.
To compare the inter-band consistency among three kinds of degradation curve, Figure A2a–c shows the RCC ratio between bands for each degradation curve. The curve shape of the RCC ratio of new degradation curve is similar to the shape of the RCC ratio curve from the inter-band calibration, but the curve shape of the RCC ratio of current degradation curve is different from the curve from the inter-band calibration. The percent difference of the RCC ratio curve in Band 1 / Band 3N, Band 2 / Band 1, and Band 3N / Band 2 between new degradation curve and the degradation curve from the inter-band calibration are 1.8%, 1.6%, and 0.4% respectively, which are average values in the period of 0–6500 DSL. The uncertainties of the inter-band calibration for ASTER VNIR bands are 3.0, 2.6, and 2.5, respectively, for Bands 1 and 3N, Bands 1 and 2, and Bands 2 and 3N [12]. The inter-band consistency of new curve shows almost same trend as the inter-band calibration within the uncertainty of the inter-band calibration.
Figure A1. Comparison of the shape of the degradation curve calculated from the inter-band calibration, the current radiometric DB ver.4, and the next radiometric DB. Bands (a) 1, (b) 2, and (c) 3N.
Remotesensing 12 00427 g0a1
Figure A2. The RCC ratio between bands for each degradation curve for comparison of inter-band consistency. (a) Band 1/Band 3N, (b) Band 2/Band 1, and (c) Band 3N/Band 2.
Remotesensing 12 00427 g0a2

Appendix C

The cross calibration is a good method that can be carried out frequently and has lower uncertainty than vicarious calibration. However, we have encountered the two problems with applying it to the ASTER VNIR radiometer. One is the large spread (Band 1: almost 10%, Band 2: 5–10%) in the RCC values, which is calculated from the cross-calibration between ASTER and MODIS, among the sites [7,8,9]. The other is the large spread (Band 1: 3–7%, Band 2: 7–11%) in the RCC values, which is calculated from the cross-calibration between ASTER and MODIS, between the normal and high gains [7,29,30]. The Band 2 High/Normal gain problem was corrected from the analysis of the onboard electrical calibration [31] at the current radiometric DB, but the other problem is currently under investigation. Moreover, the onboard electrical calibration showed many kinds of problems [31]. Recent studies of the cross calibration have been conducted at only one site (Railroad Valley), but the results show still the 1–4% difference between the studies [10,11]. We have identified and solved the problems inherent in the ASTER VNIR radiometer one by one using the results from the cross calibration. The studies of the cross calibration for the ASTSER will be continued and eventually reflected in the sensor trends.
The pseudo-invariant calibration [36] is a good method that can be carried out frequently and has high accuracy for monitoring of the relative degradation. However, we could not obtain a sufficient number of ASTER images for the study of the pseudo-invariant calibration. The swath width of ASTER image is 60 km, then the ASTER sensor pointing system in cross-track direction has covered 232 km width. It means that the ASTER does not observe the pseudo-invariant calibration sites (PICSs) at every overpass-time, and its observation has been planned according to the operational mission and user request. For example, in Libya-4 desert site, the number of ASTER-VNIR images for 20 years after the launch is almost 40 scenes in the daytime, and the number of the cloud-free nadir images (i.e., the cloud-free images at the overpass-time) is almost 10. Moreover, 10 cloud-free and nadir observed scenes include different gain modes. The ASTER-VNIR images observed at different targets and/or by the different gain modes sometimes cause the different results as mentioned above in the cross calibration. We hope that these problems will be solved, then pseudo-invariant calibration will finally be applied to the ASTER VNIR.

References

  1. Yamaguchi, Y.; Kahle, A.; Tsu, H.; Kawakami, T.; Pniel, M. Overview of Advanced Spaceborne Thermal Emission and Reflection Radiometer (ASTER). IEEE Trans. Geosci. Remote Sens. 1998, 36, 1062–1071. [Google Scholar] [CrossRef] [Green Version]
  2. ASTER Science Office ASTER SWIR Data Status Report. Available online: http://www.aster.jspacesystems.or.jp/en/about_aster/swir_en.pdf (accessed on 9 December 2019).
  3. Ono, A.; Sakuma, F.; Arai, K.; Yamaguchi, Y.; Fujisada, H.; Slater, P.N.; Thome, K.J.; Palluconi, F.; Kieffer, H. Preflight and in-flight calibration plan for ASTER. J. Atmos. Ocean. Technol. 1996, 13, 321–335. [Google Scholar] [CrossRef] [Green Version]
  4. Sakuma, F.; Ono, A.; Tsuchida, S.; Ohgi, N.; Inada, H.; Akagi, S.; Ono, H. Onboard calibration of the ASTER instrument. IEEE Trans. Geosci. Remote Sens. 2005, 43, 2715–2724. [Google Scholar] [CrossRef]
  5. Thome, K.; Arai, K.; Tsuchida, S.; Biggar, S. Vicarious calibration of ASTER via the reflectance-based approach. IEEE Trans. Geosci. Remote Sens. 2008, 46, 3285–3295. [Google Scholar] [CrossRef]
  6. Kouyama, T.; Kato, S.; Kikuchi, M.; Sakuma, F.; Miura, A.; Tachikawa, T.; Tsuchida, S.; Obata, K.; Nakamura, R. Lunar Calibration for ASTER VNIR and TIR with Observations of the Moon in 2003 and 2017. Remote Sens. 2019, 11, 2712. [Google Scholar] [CrossRef] [Green Version]
  7. Yamamoto, H.; Kamei, A.; Nakamura, R.; Tsuchida, S. Long-term cross-calibration of the Terra ASTER and MODIS over the CEOS calibration sites. Proc. SPIE 2011, 8153, 815318. [Google Scholar]
  8. McCorkel, J. Cross-calibration of Earth Observing System Terra satellite sensors MODIS and ASTER. Proc. SPIE 2014, 9218, 92180X. [Google Scholar]
  9. Thome, K.; McCorkel, J.; Czapla-Myers, J. In-situ transfer standard and coincident-view intercomparisons for sensor cross-calibration. IEEE Trans. Geosci. Remote Sens. 2013, 51, 1088–1097. [Google Scholar] [CrossRef]
  10. Yuan, K.; Thome, K.; Mccorkel, J. Radiometric cross-calibration of Terra ASTER and MODIS. Proc. SPIE 2015, 9607, 1–9. [Google Scholar]
  11. Obata, K.; Tsuchida, S.; Yamamoto, H.; Thome, K. Cross-Calibration between ASTER and MODIS Visible to Near-Infrared Bands for Improvement of ASTER Radiometric Calibration. Sensors 2017, 17, 1793. [Google Scholar] [CrossRef] [Green Version]
  12. Obata, K.; Tsuchida, S.; Iwao, K. Inter-Band Radiometric Comparison and Calibration of ASTER Visible and Near-Infrared Bands. Remote Sens. 2015, 7, 15140–15160. [Google Scholar] [CrossRef] [Green Version]
  13. ASTER Science Team. Algorithm Theoretical Basis Document for ASTER Level-1 Data Processing (Ver. 3.0); ASTER Science Team, Japan: Tokyo, Japan, 1996; Available online: http://www.aster.jspacesystems.or.jp/en/documnts/pdf/1a1b.pdf (accessed on 9 December 2019).
  14. Sakuma, F.; Kikuchi, M.; Inada, H.; Akagi, S.; Ono, H. Onboard calibration of the ASTER instrument over twelve years. Proc. SPIE 2012, 8533, 853305. [Google Scholar]
  15. ASTER User’s Guide Part I General (Ver.4.0). Earth Remote Sensing Data Analysis Center. 2005. Available online: http://www.aster.jspacesystems.or.jp/en/documnts/users_guide/part1/pdf/Part1_4E.pdf (accessed on 9 December 2019).
  16. Tsuchida, S.; Yamamoto, H.; Kamei, A. Long-term vicarious calibration of ASTER VNIR bands. In Proceedings of the 52nd Conference of the Remote Sensing Society of Japan, Tokyo, Japan, 23–24 May 2012; pp. 85–86, (In Japanese with English abstract). [Google Scholar]
  17. Tachikawa, T. ASTER Science Team Meeting. Earth Obs. 2014, 26, 18–21. [Google Scholar]
  18. Slater, P.; Biggar, S.; Holm, R.; Jackson, R.; Mao, Y.; Moran, M.; Palmer, J.; Yuan, B. Reflectance- and radiance-based methods for the in-flight absolute calibration of multispectral sensors. Remote Sens. Environ. 1987, 22, 11–37. [Google Scholar] [CrossRef]
  19. Slater, P.; Biggar, S.; Thome, K.; Gelman, D.; Spyak, P. Vicarious Radiometric Calibration of EOS Sensors. J. Atmos. Oceanic Technol. 1996, 13, 349–359. [Google Scholar] [CrossRef] [Green Version]
  20. Tsuchida, S.; Sato, I.; Yamaguchi, Y.; Arai, K.; Takashima, T. Vicarious calibration in the visible to infrared region based on reflectance-based method at the snow fields in Hokkaido. J. Remote Sens. Soc. Jpn. 1998, 18, 12–31, (In Japanese with English abstract). [Google Scholar]
  21. Liu, C.-C.; Kamei, A.; Hsu, K.-H.; Tsuchida, S.; Huang, H.-M.; Kato, S.; Nakamura, R.; Wu, A.-M. Vicarious calibration of the Formosat-2 remote sensing instrument. IEEE Trans. Geosci. Remote Sens. 2010, 48, 2162–2169. [Google Scholar]
  22. Kamei, A.; Nakamura, K.; Yamamoto, H.; Nakamura, R.; Tsuchida, S.; Yamamoto, N.; Sekiguchi, S.; Kato, S.; Liu, C.C.; Hsu, K.H.; et al. Cross calibration of formosat-2 Remote Sensing Instrument (RSI) using Terra Advanced Spaceborne Thermal Emission and Reflection Radiometer (ASTER). IEEE Trans. Geosci. Remote Sens. 2012, 50, 4821–4831. [Google Scholar] [CrossRef]
  23. Working with ASTER L1T Visible and Near Infrared (VNIR) Data in R. Available online: https://lpdaac.usgs.gov/resources/e-learning/working-aster-l1t-visible-and-near-infrared-vnir-data-r/ (accessed on 9 December 2019).
  24. Thome, K.J.; Biggar, S.F.; Slater, P.N. Effects of assumed solar spectral irradiance on intercomparisons of Earth-observing sensors. In Sensors, Systems, and Next-Generation Satellites V; International Society for Optics and Photonics: Bellingham, WA, USA, 2001; Volume 4540, pp. 260–269. [Google Scholar] [CrossRef]
  25. Kieffer, H.; Stone, T. The spectral irradiance of the Moon. Astron. J. 2005, 129, 2887–2901. [Google Scholar] [CrossRef] [Green Version]
  26. Yokota, Y.; Matsunaga, T.; Ohtake, M.; Haruyama, J.; Nakamura, R.; Yamamoto, S.; Ogawa, Y.; Morota, T.; Honda, C.; Saiki, K.; et al. Lunar photometric properties at wavelengths 0.5-1.6 μm acquired by SELENE Spectral Profiler and their dependency on local albedo and latitudinal zones. Icarus 2011, 215, 639–660. [Google Scholar] [CrossRef]
  27. Kouyama, T.; Yokota, Y.; Ishihara, Y.; Nakamura, R.; Yamamoto, S.; Matsunaga, T. Development of an application scheme for the SELENE/SP lunar reflectance model for radiometric calibration of hyperspectral and multispectral Sensors. Planet. Space Sci. 2016, 214, 76–83. [Google Scholar] [CrossRef]
  28. Tsuchida, S.; Sakuma, F.; Iwasaki, A.; Ogi, N.; Inada, H. Degradation models and functions for ASTER/VNIR sensor. In Proceedings of the 38th Conference of the Remote Sensing Society of Japan, Chiba, Japan, 20 May 2005; pp. 99–100, (In Japanese with English abstract). [Google Scholar]
  29. Yamamoto, H.; Kamai, A.; Nakamura, R.; Tsuchida, S. Radiometric evaluation of ASTER VNIR/SWIR bands be long-term Terra ASTER/MODIS cross-calibration over CEOS Reference Test Sites. In Proceedings of the 52nd Conference of the Remote Sensing Society of Japan, Tokyo, Japan, 23–24 May 2012; pp. 87–88, (In Japanese with English abstract). [Google Scholar]
  30. Yamamoto, H.; Koyama, T.; Nakamura, R.; Tsuchida, S. Status of ASTER/HISUI radiometric calibration—Vicarious calibration and cross-calibration. In CEOS IVOS 25th Meeting; ESA ESRIN: Frascati, Italy, 2013; Available online: http://calvalportal.ceos.org/ceos-wgcv/ivos/ivos25 (accessed on 5 December 2019).
  31. Sakuma, F.; Kikuchi, M.; Inada, H. Onboard electrical calibration of the ASTER VNIR. Proc. SPIE 2013, 8889, 888903. [Google Scholar]
  32. Abrams, M.; Yamaguchi, Y. ASTER Science Team Meeting. Earth Obs. 2019, 31, 21–27. [Google Scholar]
  33. Slater, P.; Biggar, S.; Palmer, J.; Thome, K. Unified approach to absolute radiometric calibration in the solar-reflective range. Remote Sens. Environ. 2001, 77, 293–303. [Google Scholar] [CrossRef]
  34. Biggar, S.; Slater, P.; Gellman, D. Uncertainties in the in-flight calibration of sensors with reference to measured ground sites in the 0.4–1.1 m range. Remote Sens. Environ. 1994, 48, 245–252. [Google Scholar] [CrossRef]
  35. Ono, A.; Arai, K. Radiometric calibration of spaceborne optical sensors, lecture series 5: Integrating analysis of calibration data. J. Remote Sens. Soc. Jpn. 2017, 37, 375–384. (In Japanese) [Google Scholar]
  36. Helder, D.; Thome, K.J.; Mishra, N.; Chander, G.; Xiong, X.; Angal, A.; Choi, T. Absolute Radiometric Calibration of Landsat Using a Pseudo Invariant Calibration Site. IEEE Trans. Geosci. Remote Sens. 2013, 51, 1360–1369. [Google Scholar] [CrossRef]
Figure 1. Radiometric calibration coefficients (RCCs) derived from the vicarious calibration of the reflectance-based method carried out from 2000 to 2017.
Remotesensing 12 00427 g001
Figure 2. Degradation curves of ASTER VNIR bands in the current radiometric DB ver. 4. Bands (a) 1, (b) 2, (c) 3N, and (d) 3B. Dotted lines correspond to the current degradation curve in the current radiometric DB estimated from the results of three calibration approaches (i.e., onboard, vicarious, and cross calibrations) from 2000 to 2012. Dashed lines indicate the degradation curves derived from the onboard calibration, which is almost the same as that in the radiometric DB ver. 3. The solid lines indicate the degradation curves estimated from the inter-band calibration for ASTER VNIR Bands 2 and 3N.
Remotesensing 12 00427 g002
Figure 3. Comparison of the relative sensor sensitivity degradation (RD) in ASTER-VNIR bands from 2003 to 2017 derived from the RCCs in the radiometric DB ver. 4 and three different calibration methods (i.e., lunar, inter-band, and onboard calibrations) [6].
Remotesensing 12 00427 g003
Figure 4. New degradation curves of ASTER VNIR bands for the next radiometric DB ver. 5. Bands (a) 1, (b) 2, (c) 3N, and (d) 3B. Solid lines correspond to the new degradation curves for the next radiometric DB estimated from the vicarious calibration data from 2000 to 2017 with the lunar calibration on April 14, 2003 (DSL = 1213), and August 5, 2017 (DSL = 6440). Dotted lines correspond to the current degradation curves in the current radiometric DB ver. 4. The marks show the RCCs from the vicarious calibration.
Remotesensing 12 00427 g004
Table 1. Relative sensor sensitivity degradation (RDL), which is the degradation ratio of RCCs for VNIR bands from 2003 (DSL = 1213) to 2017 (DSL = 1213) by lunar calibration using the SP model [6].
BandRelative Sensor Sensitivity Degradation (RDL)
Degradation Ratio: RCC (6440)/RCC (1213)
10.969
20.948
3N0.942
3B0.968
Table 2. Equations and parameters of the current radiometric degradation curves in the radiometric DB ver. 4 for ASTER VNIR bands.
BandDuration
(d: DSL)
Equation
(R(d): RCC)
Coefficients
a0a1a2
1whole duration R ( d ) = a 0   ( 1.0 a 1 )   exp ( a 2   d ) + a 0   a 1 0.9900.7940.00181
2whole duration R ( d ) = a 0   ( 1.0 a 1 )   exp ( a 2   d ) + a 0   a 1 0.9490.8860.00181
3Nd < 673 R ( d ) = a 0 + a 1   d + a 2   d 2 0.9817   5.726 × 10 5 9.360 × 10 9
673 ≤ d < 4825See Table 3
4825 ≤ d R ( d ) = a 0 0.8259--
3Bwhole duration R ( d ) = a 0 1.000--
Table 3. Equations and parameters of the current radiometric degradation curves in the radiometric DB ver. 4 for ASTER Band 3N.
BandDuration
(d: DSL)
Equation
(R(d): RCC)
Coefficients
a0a1a2
3N673 ≤ d < 2394 R ( d ) = a 1   exp ( a 2   d ) + a 0 0.85990.21630.0014974
2394 ≤ d < 31230.85900.57500.0019668
3123 ≤ d < 38570.84280.10540.0006679
3857 ≤ d < 44500.83100.11760.0005303
4450 ≤ d < 48250.70860.20510.0001096
Table 4. The equations and parameters of the new radiometric degradation curves in the radiometric DB ver. 5 for ASTER VNIR bands.
BandDuration
(d: DSL)
Equation
(R(d): RCC)
Coefficients
a0a1a2
10 ≤ d ≤ 3000 R ( d ) = a 0   ( 1.0 a 1 )   exp ( a 2   d ) + a 0   a 1 1.0170.77300.001791
3000 < d R ( d ) = a 0   0.7869--
20 ≤ d ≤ 3000 R ( d ) = a 0   ( 1.0 a 1 )   exp ( a 2   d ) + a 0   a 1 1.0080.80160.001114
3000 < d R ( d ) = a 0 0.8152--
3N0 ≤ d ≤ 3000 R ( d ) = a 0   ( 1.0 a 1 )   exp ( a 2   d ) + a 0   a 1 0.98490.81920.0008238
3000 < d R ( d ) = a 0 0.8218--
3B0 ≤ d ≤ 3000 R ( d ) = a 0   ( 1.0 a 1 )   exp ( a 2   d ) + a 0   a 1 0.97620.90090.0003670
3000 < d R ( d ) = a 0 0.9116--

