Applying Deep Learning to Automate UAV-Based Detection of Scatterable Landmines

1
Department of Geological Sciences and Environmental Studies, Binghamton University, 4400 Vestal Pkwy E, Binghamton, NY 13902, USA
2
Department of Computer Science, Binghamton University, 4400 Vestal Pkwy E, Binghamton, NY 13902, USA
*
Author to whom correspondence should be addressed.
Remote Sens. 2020, 12(5), 859; https://doi.org/10.3390/rs12050859
Submission received: 29 January 2020
/
Revised: 22 February 2020
/
Accepted: 1 March 2020
/
Published: 6 March 2020
(This article belongs to the Special Issue Machine Learning Techniques for Remote Sensing and Electromagnetic Applications)
Abstract
:Recent advances in unmanned-aerial-vehicle- (UAV-) based remote sensing utilizing lightweight multispectral and thermal infrared sensors allow for rapid wide-area landmine contamination detection and mapping surveys. We present results of a study focused on developing and testing an automated technique of remote landmine detection and identification of scatterable antipersonnel landmines in wide-area surveys. Our methodology is calibrated for the detection of scatterable plastic landmines which utilize a liquid explosive encapsulated in a polyethylene or plastic body in their design. We base our findings on analysis of multispectral and thermal datasets collected by an automated UAV-survey system featuring scattered PFM-1-type landmines as test objects and present results of an effort to automate landmine detection, relying on supervised learning algorithms using a Faster Regional-Convolutional Neural Network (Faster R-CNN). The RGB visible light Faster R-CNN demo yielded a 99.3% testing accuracy for a partially withheld testing set and 71.5% testing accuracy for a completely withheld testing set. Across multiple test environments, using centimeter scale accurate georeferenced datasets paired with Faster R-CNN, allowed for accurate automated detection of test PFM-1 landmines. This method can be calibrated to other types of scatterable antipersonnel mines in future trials to aid humanitarian demining initiatives. With millions of remnant PFM-1 and similar scatterable plastic mines across post-conflict regions and considerable stockpiles of these landmines posing long-term humanitarian and economic threats to impacted communities, our methodology could considerably aid in efforts to demine impacted regions.

1. Introduction
1.1. Landmine Overview
Today, there are an estimated 100 million remnant landmines in ninety post-conflict countries and despite international efforts to limit their use, there are an estimated twenty landmines placed for every landmine removed in conflict regions [1]. In part, the expanding rift between landmine placement and clearance is driven by a technological disconnect between modern landmine technology and the traditional demining toolkit. Landmine clearance protocols adapted by demining NGOs and various state demining services largely rely on the geophysical principles of electromagnetic induction (EMI), which have demonstrated high effectiveness in the detection of large metallic landmines and buried unexploded ordnance (UXO) [2]. However, EMI-based surveys also produce high numbers of false flags in the presence of metallic debris against mines with reduced metal content [3].
Many modern landmines are designed specifically to avoid detection by EMI methods; they are smaller, have a reduced metal content, and may contain little or no metal shrapnel elements [4]. Further complicating the task of minefield clearance is randomized mine placement, intentional metal and plastic debris spreading, and use of landmines that are deployed aerially across wide areas [3]. Perhaps, the apex of landmine technology designed to hamper landmine clearance are small aerially deployed anti-personnel plastic landmines, such as the American BLU-43 “Dragontooth” and its mass-produced and widely-used Soviet copy, the PFM-1 “Butterfly” (Figure 1) [5]. Due to their largely plastic or polyethylene composition, small size (75 g), and scattering deployment over wide areas, proven EMI-based clearance techniques are largely time and cost prohibitive in the presence of aerially-dispersed landmines [6].
While the PFM-1 was predominantly in active use during the Soviet–Afghan war from 1979–1989, they still remain an active threat in the present day. For example, in 2019, the Russian army modernized and adopted the tracked UMZ-G multipurpose minelayer specifically designed to be compatible with PFM-1-bearing cassettes and capable of dispersing nearly twenty thousand PFM-1 type mines in an hour of operation [7,8]. While modernized PFM-1s variants of the PFM-1 mine are normally designed to self-destruct over time, past studies indicate that only ~50% of the deployed PFM-1s mines go through the self-destruction process upon expiration of deployment time [5]. As such, modernized PFM-1s fail to meet self-destruction criteria set forward by Protocol II the Convention on Prohibitions or Restrictions on the Use of Certain Conventional Weapons and their possible use would be associated with much of the similar short-term and long-term humanitarian concerns as the mass use of the PFM-1 mines in the Soviet–Afghan conflict and other impacted regions [9].
In previous studies, our research team developed a time- and cost-effective protocol to remotely identify randomly distributed PFM-1 landmines in simulated fields. Initially, by analyzing the physical properties and texture of the PFM-1 polyethylene casing, we derived its unique differential apparent thermal inertia (DATI) signature, allowing us to distinguish PFM-1 landmines and cross-correlate them to other elements of the PFM-1 minefield, namely the aluminum KSF-1 case rails and caps in stationary experiments [10]. Following the stationary proof-of-concept phase, we deployed an unmanned aerial vehicle (UAV) with a mounted infrared camera to remotely collect automated time-lapse thermal surveys over simulated minefields seeded with inert PFM-1 mines and aluminum elements of the KSF-1 casing. Dynamic UAV datasets confirmed that PFM-1 mines yielded statistically significant (and remotely detectable) temperature differences between the polyethylene bodies of the landmines and their host environments, both in direct thermal comparisons and in time-lapse DATI datasets [11].
Controlled stationary experiments were conducted to test the impact of different environmental variables, such as moisture content, time of day, and host geology on time-lapse thermal infrared detection of PFM-1 landmines [12]. We found that ideal thermal conditions occur two hours after sunrise for differential apparent thermal inertia (15 min apart) and in the middle of the day (for apparent thermal datasets). Increased moisture content in soils and host geology after a rain event also increased the temperature differential between the plastic mines and the surrounding environment because water has a very high specific heat value of 4.186 J/g °C and is absorbed by the surrounding soils but not the mines [12]. Lastly, finer-grain environments such as sand or clay decreased the number of false positives compared to coarse-grain cobble environments and light vegetation cover [12]. Finally, we proceeded to test the protocol in blind trials under varying conditions and were able to successfully identify majority of the scattered PFM-1 from the UAV datasets [12]. To date, our detection and classification protocols were based on operator in-person visual analysis of the UAV-collected datasets. While this allowed for successful troubleshooting and fine-tuning of the methodology, it was clear that successful adoption of this methodology in wide-area surveying required implementation of an automated detection algorithm to change the role of the operator from data processing and interpretation to detection verification.
1.2. Convolutional Neural Network (CNN) Overview
Neural networks, now the standard for object detection and classification in the field of remote sensing, began to appear contributions to Remote Sensing in 2009 [13,14]. As neural networks rose in popularity, so did other methods of machine learning such as support vector machines [15], decision trees [16], random decision forests [17], and most similar neighbor [17]. Since 2012, neural networks have outperformed all other machine learning methods and have been used successfully in thousands of remote sensing object classification and detection applications [18].
Since the start of 2020, articles have been published using convolutional neural networks (CNNs) to detect patterns in LiDAR (Light Detection and Ranging) data, images in the Google Street View database, video data, UAV data, and NASA’s Earth Observation (EO) data for a variety of purposes from detecting pedestrians at night to mapping landslides [19,20,21,22,23]. There have been successful efforts using CNN’s to detect buried landmines in ground-penetrating radar data, yet there is a lack of research on using CNN to identify surface mines such as the PFM-1 [24,25]. This study focuses on UAV based multispectral and thermal infrared sensing to train a robust CNN to automate detection of the PFM-1 landmines to dramatically decrease the time, cost, and increase accuracy associated with current methods.
In our study, we deployed the Faster Regional-CNN (Faster R-CNN) [26]. This type of CNN has successful applications across the field of remote sensing from detecting maize tassels to airplanes to gravity waves [27,28,29]. We chose this type of CNN because of its superior speed and accuracy in detecting small objects to R-CNNs [30], Fast R-CNNs [31], Spatial Pyramid Pooling-Nets [32], and “You Only Look Once” (YOLO) Networks [33,34,35]. A common measurement of success in a deep learning task is the mean Average Precision (mAP) [26]. To calculate the mAP for a large dataset of images, the precision (how many selected items were correctly selected) and recall (how many items that were supposed to be selected were not) are first calculated for each image using the following formulas: . Then, the relationship between precision and recall is plotted and the area under the curve is the mAP. On an extensive database used for object detection, MS COCO, the Fast R-CNN performed with a testing mAP of 19.3 and processed 0.5 images per second (FPS) while the Faster R-CNN performed with a testing mAP of 21.9, an improvement of 13.4%, and a FPS of 7, 14 times faster than the Fast R-CNN [36]. Although YOLO networks tend to perform better than the Faster R-CNN on the MS COCO dataset, they are found to perform much worse for small objects, so they are not well suited for our application [35]. A Faster R-CNN far surpasses the capabilities of an R-CNN as a Fast R-CNN trains nine times faster than an R-CNN and performs predictions 213 times faster than a R-CNN [34]. The capabilities of an SPP-Net are surpassed as a Fast R-CNN trains three faster than an SPP Net and performs predictions 10 times faster than an SPP Net [34]. Furthermore, the Faster R-CNN is particularly effective because, unlike R-CNNs, which extract 2000 region proposals of a fixed aspect size from an image and use a CNN to perform a basic classification on each region, a Faster R-CNN uses a CNN to predict the region proposals. This allows another CNN, the one doing the final classification, to do much less work because the Region Proposal Network (RPN) has created a smarter list of region proposals [35].
1.3. Region of Interest
While scatterable landmines were used in many conflicts, today the region most impacted by this type of munition is Afghanistan in the aftermath of the Soviet-Afghan conflict. During the Soviet-Afghan War, which lasted from December 1979 to February 1989, up to 16 million landmines were deployed throughout Afghanistan [37], a significant proportion of them being PFM-1 type scatterable landmines. Most of these mines remain in place in areas inaccessible to demining operations and despite many of them deteriorating over time, their presence presents a continuous threat to local communities [10]. The overall number of victims of the PFM-1 landmine crisis in Afghanistan is unclear, but expert estimates suggest that these mines were the cause of hundreds of deaths and resulted in thousands of amputations since the cessation of the conflict in 1989 [38]. Importantly, the majority of PFM-1 victims are civilians, and a disproportionately high percent of them are children [39].
In our research efforts to date, we specifically focused our environmental considerations to mimic environments in which PFM-1 presence has been reported across Afghanistan. The most heavily mined areas in Afghanistan lie in the areas bordering Pakistan (east) and Iran (south, southwest). Only about 2% of Afghanistan is designated as forest, 5% as irrigated cultivation, while about 58% is permanent pasture and agricultural land, and ~35% is comprised of sparse vegetation shown in Figure 2 [40].
2. Materials and Methods
2.1. Proxy Environments
To best simulate environmental conditions in our region of focus, datasets were collected in a sparsely vegetated rubble field at Chenango Valley State Park on 20 October 2019 to represent desert and sparse vegetation environments. On 5 November 2019, additional datasets were collected at a grass field on the Binghamton University campus to represent agricultural and pastoral fields. Lastly, on 13 November 2019 a dataset over the same field at Binghamton University after three inches of snow was taken to simulate winter months (Figure 3). As it is impossible to perfectly simulate a plot of land such as an Afghani minefield due to temporal and spatial variations, and earth surface processes and weather patterns, the chosen “Low Vegetation”, “Grass”, and “Snow” datasets shown in Figure 3, act as proxies with some degree of environmental error, but still provide reliable spectral analogs.
2.2. Instrumentation
The FLIR Vue Pro thermal infrared sensor, Parrot Sequoia multispectral sensor, and a Trimble Geo 7x Handheld Global Navigation Satellite System (GNSS) were used for data collection in this study (Table 1). The FLIR Vue Pro 13 mm has a resolution of 640 × 512 pixels, collects thermal infrared spectral data and is exported as a 14 bit raw TIF file from ThermoViewer export. A previous study on the PFM-1 showed that long wave infrared (LWIR) imagery had an average detection sensitivity rate of 77.88% [11], as well as additional studies [41,42,43,44] demonstrating the effectiveness of thermal infrared sensing for landmine detection. The Parrot Sequoia is equipped with an RGB camera which has a 4.88 mm focal length, a resolution of 4608 × 3456 pixels and is exported as a JPG file. The Parrot Sequoia monochrome sensors collect green (GRE), red (RED), red edge (REG), and near infrared (NIR), with a focal length of 3.98 mm, which it exports as a raw 10-bit TIF file. In recent years, UAV-based photogrammetry has seen a large growth in both academic and commercial applications [45,46], including the implementation of neural networks to identify of surface objects [47,48]. These studies lay the framework for UAV photogrammetry being a promising new technique for surface UXO detection. Additionally, multispectral imaging is now being applied for advanced object detection such as pedestrian detection [49]. This highlights that a relatively simple, stationary, and uniform object such as a landmine should be detectable with an even higher degree of accuracy. The Trimble Geo 7x Handheld GNSS (Global Navigation Satellite System) with Zephyr 3 antenna was used to collect cm accurate coordinates for the randomly scattered mines as well as the ground control points used for georeferencing in post processing. Post processing of GNSS data was conducted using Trible’s GPS Pathfinder Office Software.
2.3. Data Acquisition
All spectral data were collected with a DJI Matrice 600 Pro UAV platform equipped with a Parrot Sequoia multispectral sensor and FLIR thermal sensor (Figure 4). Each mission was flown over the simulated minefields with 28–30 PFM-1 mines at 10 m height over a 10 × 20 m grid with each transverse having an 80% overlapped coverage with the previous transverse, flown at 2 m/s. At the corners and center of each grid, a checkered pattern ground control point (GCP) was placed, and the location collected with the Trimble Geo 7x Handheld GNSS. The drone was flown using the Pix4D mission planner app. At each of the three environments, five flights were repeated to capture mass datasets that will be used as training and test datasets for the CNN. The PFM-1 landmines and KSF landmine casings were aerially dispersed inside of the grid, landing in randomized orientations to simulate real word conditions, as well as diversifying the angles of orientation and landing preference (either face up or face down). Collecting data across three very different environments and randomized mine orientations helps avoid overfitting the classification to our specific minefields by creating a generalized model.
2.4. Image Processing
To process the multispectral data, the extraneous photos from takeoff and landing were clipped for each flight. Then the photos were uploaded into Pix4D Mapper software, where a point cloud was generated from the images (RGB and monochrome images must be processed separately). Once the initial processing was complete, global positioning data from the ground control points (GCPs) in the form of latitude and longitude were used to georeference the point cloud to the cm scale accuracy GCPs, and reoptimize the point cloud. After reoptimization, the point cloud and mesh were reconstructed, and finally a DSM, orthomosaic, and index were created (Figure 5). Once the orthomosaics were generated, they were uploaded as GeoTIFFs into ArcMap, and overlain with the mine coordinates taken by the Trimble. To further improve the location accuracy, the processed GeoTIFFs were again georeferenced in ArcMap using a first order polynomial transformation to connect the raster GCPs to the Trimble GPS shapefile GCPs.
Thermal data required additional processing before it was constructed into an orthomosaic using Pix4D Mapper software. First, the flights were clipped and exported from ThermoViewer as 16 bit TIFFs with standardized gain highs and lows optimized per flight. These raw photos, in turn, needed to be corrected for the cold edges, or vignetting errors, associated with thermal data. To process these out, first vignetting masks were created (from four relatively still images in the drone flight, usually at the end of the flight) by subtracting the highest pixel value from the entire raster image [52]. Next, we clipped out anomalies such as GCPs, rocks, or landmines, and filled the missing data with the nearest neighbor method, so the mask is suitable across the entire flight; if this is not done artifacts are introduced with the mask. Then, the four images’ vignetting masks were averaged to create an average vignette mask. Once the averaged mask was created, a 3 × 3-window moving-average kernel-convolution low-pass filter was employed to smooth the mask. The mask was subtracted from each thermal raster image to mitigate the cold corner vignette effect (Figure 6). After this operation was performed, the thermal images were subsequently processed into georeferenced orthophotos in the same fashion as the RGB and multispectral images.
2.5. CNN Methods
Yang’s implementation of a Faster R-CNN was used for our CNN [53]. There were several modifications that had to be made since Yang’s implementation was built to train and test on the Pascal VOC 2007 dataset and our goal was to train and test on a custom, remotely sensed dataset. The Faster R-CNN implementation had a directory called “data” containing the custom dataset, which had to be in the form of the Pascal VOC 2007 development kit. The “annotations” folder contained xml files corresponding to the training or testing image sharing the same name. These xml files contained metadata for each image describing the location in that image of the objects that the CNN is designed to detect. A tool called LabelImg was used to create these metadata files [54]. Basic instructions to install and create metadata files in the PascalVOC format were followed accordingly. Using LabelImg, boxes were drawn around all the individual landmines and KSF-Casings in the orthophotos. The resulting xml files were included in the “Annotations” folder and the resulting cropped images in png format in the PNGImages folder (any image type works for this step but png files are necessary for the following step).
We used the Images in Python (Impy) tool to create 1032 × 1032 crops of the orthophotos and modify the xml files accordingly [55]; 20 to 25 images and corresponding xmls were created for each orthophoto depending on the original size of the orthophoto. There was no overlap in the cropped images and all images had at least one object (PFM-1, KSF-Casing or KSF-Cap) in it. Impy was also used for further data augmentation to the cropped images. Basic instructions were followed to create sharpened versions of the images (with a weight of 2.0), vertically flipped versions, histogram-equalized versions (type 1), more cropped versions, and rotated versions (with a theta value of 0.5). Impy generated corresponding xml files for all of the images created by these procedures. The augmented images and xml files were added to the PNGImges and Annotations folders respectively.
We split our data into training and testing in two ways and compared the results. To select images for testing and training sets, we added the names of the cropped images we wished to use for testing and training to ImageSets/Main/test.txt and ImageSets/Main/trainval.txt respectively. The first way was by using the images from one drone flight in Fall 2017 over our rubble environment as testing data and six flights in Fall 2019 over our rubble and grass environments as training data. The second way was by compiling the cropped images of seven total flights taken in fall 2017 and 2019, randomly selecting 30% of the images for testing and 70% of them for training. To train and test the CNN and perform the demo, we followed the instructions provided by Jianwei Yang in their repository [53]. To improve our accuracy, we followed the instructions in Yang’s repository to implement transfer learning with the res101 model.
3. Results
Multispectral & Orthophoto Results
Processing the multispectral and thermal infrared imagery resulted in 0.025 m average ground sampling distance and accurately georeferenced simulated minefield orthophotos as seen in Figure 7 and Figure 8.
Figure 9 shows how effective RGB, green, red, red-edge, near infrared (NIR), thermal infrared, and normalized difference vegetation index (NDVI) are for identifying plastic landmines. Interestingly, different bandwidths are effective in different environments. For the grass environment, mines were distinguishable in RGB, green, red, thermal, and NDVI (and unidentifiable in red edge and NIR). In the low vegetation environment, the mines were distinct in every band except red-edge and NIR, which had identifiable mines, but too difficult to distinguish from noise without prior knowledge of the mines. The PFM-1 is difficult to identify from noise in the snow datasets due to thermal muting of mine-associated anomalies for snow- covered mines. Additionally, surfaced mines were largely obscured due to the relatively high reflectance of the snow.
To automate the detection and mapping of the PFM-1 landmines, the CNN was trained and tested two separate times. The first time, the training data consisted of 165 RGB images obtained from different crops of six orthophotos. The orthophotos consisted of three flights over the same 10 × 20 m rubble environment and three flights over the same 10 × 20 m grass environment. Both the grass and rubble datasets were taken in fall 2019 and have 28 PFM-1 mines, four KSF-Casings, and two KSF-Caps scattered throughout the field. All training and testing was done on a Dual Socket Intel(R) Xeon(R) Silver 4114 CPU @ 2.20 GHz with 128 GB of RAM with a Titan V GPU with 12 GB of RAM. The CNN took 37 min to train over 50 epochs. After we obtained our first model, we tested it on a withheld 10 × 20 m rubble environment, the same environment as one of the environments used for training but taken in Fall 2017, two years earlier than the training data. The CNN was tested on 18 images and took 1.87 s to produce a 0.7030 average precision (AP) for the PFM-1, a 0.7273 AP for the KSF-Casing, and a mean AP of 0.7152 (Table 2). The second time, the training data consisted of a randomly selected sample of 70% of the total images (128 RGB images) while the testing data consisted of the remaining 30% (55 RGB images). This model took 29 min to train over 50 epochs (Figure 10). Testing took 5.47 s and produced a 0.9983 AP for the PFM-1, a 0.9879 AP for the KSF-Casing, and a mean AP of 0.9931 as shown in Table 2.
4. Discussion
This study attempted to address two major questions: (1) Can high-resolution multispectral remote sensing be used to detect PFM-1 type scatterable antipersonnel landmines? (2) Can Faster R-CNN be used to automate the detection and map the coordinates of these mines? Previous research has demonstrated the efficacy of thermal imaging to detect the PFM-1 in static and active field trials [10,11,12]. This study expands upon those results by demonstrating the ability of a low-cost plug-and-play multispectral sensor to detect scatterable surface-laid antipersonnel landmines in the visible light, green, red, red-edge, and near-infrared bands of the electromagnetic spectrum. These particular landmines are easily detectable in low vegetation and grassy environments, but not in snowy environments as snow is highly reflective in the nm wavelength portion of the EM spectrum.
While PFM-1 and similar scatterable low-metal mines are known to deteriorate over time in the field and may be rendered inoperative by exposure to the elements, they nevertheless present an ongoing concern in historically impacted areas, such as Afghanistan and in countries with ongoing military conflicts, where warring sides may possess large stockpiles of PFM-1 and similar devices. Furthermore, despite an international effort to end the usage of scatterable landmines, publicly disclosed military research and development activity demonstrates that modernized scatterable landmines and their deployment systems remain in development and production as an important element of modern military strategy.
Rapid UAV-assisted mapping and automated detection of scatterable mine fields would assist in addressing the deadly legacy of widespread use of small scatterable landmines in recent armed conflicts and allow to develop a functional framework to effectively address their possible future use. Importantly, these detection and mapping techniques are generalizable and transferable to other munitions and explosives of concern (MECs) as UAV-based wide-area multispectral and thermal remote sensing survey methodologies can be usefully applied to many scatterable and exposed mines. Moreover, we also envision that thermal and multispectral remote-sensing methods and their automated interpretation could be adapted to detect and map disturbed soil for improvised explosive device (IED) detection and mapping. The use of CNN-based approaches to automated the detection and mapping of landmines is important for several reasons: (1) it is much faster than manually counting landmines from an orthoimage, (2) it is quantitative and reproducible, unlike subjective human-error-prone ocular detection, and (3) CNN-based methods are easily generalizable to detect and map any objects with distinct sizes and shapes from any remotely sensed raster images.
The purpose of dividing our training and testing data in two different ways was to observe the disparity between our model’s performance on a partially withheld dataset and a fully withheld dataset. We believe the mAP of the second model was 28% higher than that of the first model because, in the second model, the images used for training and testing were of the same environments taken at the same times, but the exact same images were not used. In the first model, the images used for testing were captured in the same environment, two years prior to the images captured for training making them subtly but significantly different. The results both models are useful. The results from the first model (six orthophotos for training, one for testing) provide more accurate insight into how a CNN will perform when implemented on an environment that has not been used for training, when only similar environments have been used for training. We can assume this because the testing data consisted of one orthophoto of an environment that looks very similar to the ones used for training but has changed in subtle ways over the two years between capturing the training and testing data. The second model (70% of total for training, 30% for testing) was given three times more testing data than the first method so it gave us a more complete result of how effectively our model trained on the given data. This specific percentage was used to divide our training and testing data to achieve a balance between having enough training data to train our model effectively and having enough testing data to give us an accurate measure of how effectively our model had been trained. Because of the very high accuracy we got with this model while still allotting a generally accepted amount (30%) to testing data, we believe this was an effective split. We can assume this model also gives us accurate insight into how a CNN will perform when implemented on an environment withheld from training because we were able to obtain training images of environments very similar to those prevalent in our region of interest.
Lastly, we decided that 50 epochs was the optimal number of epochs to train on because, for both models, the loss stopped a general decreasing trend at around 50 epochs and we believed a balance was achieved between training time and maximum testing accuracy.
5. Conclusions and Future Work
Our CNN took 1.87 s to detect scattered PFM-1 landmines in a 10 × 20 m minefield equating to 2 h and 36 min ((1.87 s/200 m2) × 1,000,000 m2 = 9350 sec = 2 h and 36 min) to inspect one square kilometer with a 71.5% accuracy of landmine identification with each flight taking 3 min and 30 s for a 10 × 20 m minefield. To push the accuracy of the Faster R-CNN past 71.5% for fully withheld datasets, and past 99.3% for partially withheld datasets, several actions will be taken in future research efforts. The volume of training and testing data will be increased and diversified in terms of environmental conditions, landmine orientation in three-dimensional space, host environments, and presence of clutter. UAV-captured datasets will also be augmented automatically through sharpening, rotating, cropping, and scaling using varying software; current forms of data augmentation only resulted in a 1.69% increase in accuracy, so more extensive augmentation will be implemented. To improve the accuracy of the CNN, graphs will be made plotting training and testing accuracies throughout epochs to ensure a model is not created that is overfit to training data or overgeneralized. This will help us decide a potentially more optimal number of epochs to train on. We will also optimize how we divide our training and testing data by running our model on many different percentages of training and testing data. Our next step is to finalize the Faster R-CNN with each spectral band functioning as a different channel in the CNN (seven in total) that will be cross-referenced with another in order to reduce the number of false positives: two for method one (six orthophotos for training, one for testing) and one for method 2 (70% of total for training, remainder for testing), and optimize detection across different environmental conditions, including active minefields that may have obscured visibility of the mines from soil and eolian processes, that will complicate aerial detection. We anticipate increasing the number of channels and training on additional datasets will increase our testing accuracy well above 71.52% to be an even more robust CNN and useful auxiliary tool in a broad demining strategy. Ultimately, we seek to develop a completely automated processing and interpretation package that would deliver actionable map data to stakeholders within hours of survey acquisition.
Author Contributions
J.B., G.S., and T.S.d.S. developed the methodology used in the study, designed the experiment, and T.S.d.S., A.N., and K.C. supervised the research team. J.B., and G.S. contributed to data curation, analysis and visualization of the results of the experiments. All co-authors contributed to original draft preparation and review and editing. All authors have read and agreed to the published version of the manuscript.
Funding
This project was supported by funds provided by Binghamton University through the Freshman Research Immersion Program and new faculty start-up funds for Alex Nikulin, and Timothy de Smet.
Acknowledgments
Our research team wants to thank the First Year Research Immersion, and Harpur Edge for their support of the project. We also want to thank Olga Petroba and the Office of Entrepreneurship & Innovation Partnerships for their support of this project. This work was conducted under New York State Parks Unmanned Aircraft and Special Use permits and we extend our gratitude to park manager Michael Boyle and all staff of the Chenango Valley State Park for their assistance with this project. All the project data are available at [56,57,58,59,60,61,62] under a Creative Commons Attribution 4.0 license.
Conflicts of Interest
The authors have no conflicts of interest.
References
- Rosenfeld, J.V. Landmines: The human cost. ADF Health J. Aust. Def. Force Health Serv. 2000, 1, 93–98. [Google Scholar]
- Bruschini, C.; Gros, B.; Guerne, F.; Pièce, P.Y.; Carmona, O. Ground penetrating radar and imaging metal detector for antipersonnel mine detection. J. Appl. Geophys. 1998, 40, 59–71. [Google Scholar] [CrossRef]
- Bello, R. Literature review on landmines and detection methods. Front. Sci. 2013, 3, 27–42. [Google Scholar]
- Horowitz, P.; Case, K. New Technological Approaches to Humanitarian Demining; JASON Program Office: McLean, VA, USA, 1996. [Google Scholar]
- Dolgov, R. Landmines in Russia and the former Soviet Union: A lethal epidemic. Med. Glob. Surviv. 2001, 7, 38–42. [Google Scholar]
- Coath, J.A.; Richardson, M.A. Regions of high contrast for the detection of scatterable land mines. In Proceedings of the Detection and Remediation Technologies for Mines and Minelike Targets V, Orlando, FL, USA, 24–28 April 2000; Volume 4038, pp. 232–240. [Google Scholar]
- D’Aria, D.; Grau, L. Instant obstacles: Russian remotely delivered mines. Red Thrust Star. January 1996. Available online: http://fmso.leavenworth.army.mil/documents/mines/mines.htm (accessed on 27 January 2020).
- Army Recognition. Army-2019: New UMZ-G Multipurpose Tracked Minelayer Vehicle Based on Tank Chassis. Available online: https://www.armyrecognition.com/army-2019_news_russia_online_show_daily_media_partner/army-2019_new_umz-g_multipurpose_tracked_minelayer_vehicle_based_on_tank_chassis.html (accessed on 15 January 2020).
- Maslen, S. Destruction of Anti-Personnel Mine Stockpiles: Mine Action: Lessons and Challenges; Geneva International Centre for Humanitarian Demining: Geneva, Switzerland, 2005; p. 191. [Google Scholar]
- De Smet, T.; Nikulin, A. Catching “butterflies” in the morning: A new methodology for rapid detection of aerially deployed plastic land mines from UAVs. Lead. Edge 2018, 37, 367–371. [Google Scholar] [CrossRef]
- Nikulin, A.; De Smet, T.S.; Baur, J.; Frazer, W.D.; Abramowitz, J.C. Detection and identification of remnant PFM-1 ‘Butterfly Mines’ with a UAV-based thermal-imaging protocol. Remote Sens. 2018, 10, 1672. [Google Scholar] [CrossRef] [Green Version]
- DeSmet, T.; Nikulin, A.; Frazer, W.; Baur, J.; Abramowitz, J.C.; Campos, G. Drones and “Butterflies”: A low-cost UAV system for rapid detection and identification of unconventional minefields. J. CWD 2018, 22, 10. [Google Scholar]
- Lakhankar, T.; Ghedira, H.; Temimi, M.; Sengupta, M.; Khanbilvardi, R.; Blake, R. Non-Parametric methods for soil moisture retrieval from satellite remote sensing data. Remote Sens. 2009, 1, 3–21. [Google Scholar] [CrossRef] [Green Version]
- Yuan, H.; Van Der Wiele, C.F.; Khorram, S. An automated artificial neural network system for land use/land cover classification from Landsat TM imagery. Remote Sens. 2009, 1, 243–265. [Google Scholar] [CrossRef] [Green Version]
- Heumann, B.W. An object-based classification of mangroves using a hybrid decision tree—Support vector machine approach. Remote Sens. 2011, 3, 2440–2460. [Google Scholar] [CrossRef] [Green Version]
- Huth, J.; Kuenzer, C.; Wehrmann, T.; Gebhardt, S.; Tuan, V.Q.; Dech, S. Land cover and land use classification with TWOPAC: Towards automated processing for pixel-and object-based image classification. Remote Sens. 2012, 4, 2530–2553. [Google Scholar] [CrossRef] [Green Version]
- Kantola, T.; Vastaranta, M.; Yu, X.; Lyytikainen-Saarenmaa, P.; Holopainen, M.; Talvitie, M.; Kaasalainen, S.; Solberg, S.; Hyyppa, J. Classification of defoliated trees using tree-level airborne laser scanning data combined with aerial images. Remote Sens. 2010, 2, 2665–2679. [Google Scholar] [CrossRef] [Green Version]
- Ma, L.; Liu, Y.; Zhang, X.; Ye, Y.; Yin, G.; Johnson, B.A. Deep learning in remote sensing applications: A meta-analysis and review. ISPRS J. Photogram. Remote Sens. 2019, 1, 166–177. [Google Scholar] [CrossRef]
- Zha, Y.; Wu, M.; Qiu, Z.; Sun, J.; Zhang, P.; Huang, W. Online semantic subspace learning with siamese network for UAV tracking. Remote Sens. 2020, 12, 325. [Google Scholar] [CrossRef] [Green Version]
- Barbierato, E.; Barnetti, I.; Capecchi, I.; Saragosa, C. Integrating remote sensing and street view images to quantify urban forest ecosystem services. Remote Sens. 2020, 12, 329. [Google Scholar] [CrossRef] [Green Version]
- Li, D.; Wang, R.; Xie, C.; Liu, L.; Zhang, J.; Li, R.; Wang, F.; Zhou, M.; Liu, W. A recognition method for rice plant diseases and pests video detection based on deep convolutional neural network. Remote Sens. 2020, 20, 578. [Google Scholar] [CrossRef] [Green Version]
- Prakash, N.; Manconi, A.; Loew, S. Mapping landslides on EO data: Performance of deep learning models vs. traditional machine learning models. Remote Sens. 2020, 12, 346. [Google Scholar] [CrossRef] [Green Version]
- Chen, Y.; Shin, H. Pedestrian detection at night in infrared images using an attention-guided encoder-decoder convolutional neural network. Remote Sens. 2020, 10, 809. [Google Scholar] [CrossRef] [Green Version]
- Lameri, S.; Lombardi, F.; Bestagini, P.; Lualdi, M.; Tubaro, S. Landmine detection from GPR data using convolutional neural networks. In Proceedings of the 2017 25th European Signal Processing Conference (EUSIPCO), Kos, Greece, 28 August–2 September 2017; pp. 508–512. [Google Scholar] [CrossRef] [Green Version]
- Bralich, J.; Reichman, D.; Collins, L.M.; Malof, J.M. Improving convolutional neural networks for buried target detection in ground penetrating radar using transfer learning via pretraining. In Proceedings of the Detection and Sensing of Mines, Explosive Objects, and Obscured Targets XXII, Anaheim, CA, USA, 9–13 April 2017; p. 10182. [Google Scholar] [CrossRef]
- Ren, S.; He, K.; Girshick, R.; Sun, J. Faster r-cnn: Towards real-time object detection with region proposal networks. Adv. Neural Inf. Process. Syst. 2015, 39, 91–99. [Google Scholar] [CrossRef] [Green Version]
- Liu, Y.; Cen, C.; Che, Y.; Ke, R.; Ma, Y.; Ma, Y. Detection of maize tassels from UAV RGB imagery with faster R-CNN. Remote Sens. 2020, 12, 338. [Google Scholar] [CrossRef] [Green Version]
- Alganci, U.; Soydas, M.; Sertel, E. Comparative research on deep learning approaches for airplane detection from very high-resolution satellite images. Remote Sens. 2020, 12, 458. [Google Scholar] [CrossRef] [Green Version]
- Lai, C.; Xu, J.; Yue, J.; Yuan, W.; Liu, X.; Li, W.; Li, Q. Automatic extraction of gravity waves from all-sky airglow image based on machine learning. Remote Sens. 2019, 11, 1516. [Google Scholar] [CrossRef] [Green Version]
- Girshick, R.; Donahue, J.; Darrell, T.; Malik, J. Rich feature hierarchies for accurate object detection and semantic segmentation. In Proceedings of the IEEE Conference on Computer Vision and Pattern Recognition (CVPR), Columbus, OH, USA, 24–27 June 2014; pp. 580–587. [Google Scholar] [CrossRef] [Green Version]
- Girshick, R. Fast r-cnn. In Proceedings of the IEEE International Conference on Computer Vision (ICCV), Santiago, Chile, 7–13 December 2015; pp. 1440–1448. [Google Scholar] [CrossRef]
- He, K.; Zhang, X.; Ren, S.; Sun, J. Spatial pyramid pooling in deep convolutional networks for visual recognition. IEEE Trans. Pattern Anal. Mach. Intell. 2015, 37, 1904–1916. [Google Scholar] [CrossRef] [Green Version]
- Redmon, J.; Divvala, S.; Girshick, R.; Farhadi, A. You only look once: Unified, real-time object detection. In Proceedings of the IEEE Conference on Computer Vision and Pattern Recognition (CVPR), Las Vegas, NV, USA, 26 June–1 July 2016; pp. 779–788. [Google Scholar] [CrossRef] [Green Version]
- Machine-Vision Research Group (MVRG). An Overview of Deep-Learning Based Object-Detection Algorithms. Available online: https://medium.com/@fractaldle/brief-overview-on-object-detection-algorithms-ec516929be93 (accessed on 15 January 2020).
- Gandhi, R. R-CNN, Fast R-CNN, Faster R-CNN, YOLO—Object Detection Algorithms. Available online: https://towardsdatascience.com/r-cnn-fast-r-cnn-faster-r-cnn-yolo-object-detection-algorithms-36d53571365e (accessed on 15 January 2020).
- Hiu, J. Object Detection: Speed and Accuracy Comparison (Faster R-CNN, R-FCN, SSD, FPN, RetinaNet and YOLOv3). Available online: https://medium.com/@jonathan_hui/object-detection-speed-and-accuracy-comparison-faster-r-cnn-r-fcn-ssd-and-yolo-5425656ae359 (accessed on 24 January 2020).
- Pear, R. Mines Put Afghans in Peril on Return. New York Times. 1988. Available online: https://www.nytimes.com/1988/08/14/world/mines-put-afghans-in-peril-on-return.html (accessed on 21 January 2020).
- Dunn, J. Daily Mail. Pictured: The Harrowing Plight of Children Maimed in Afghanistan by the Thousands of Landmines Scattered Across the Country After Decades of War. Available online: https://www.dailymail.co.uk/news/article-3205978/Pictured-harrowing-plight-children-maimed-Afghanistan-thousands-landmines-scattered-country-decades-war.html (accessed on 21 January 2020).
- Strada, G. The horror of land mines. Sci. Am. 1996, 274, 40–45. [Google Scholar] [CrossRef]
- Central Intelligence Agency. Afghanistan Land Use. The World Factbook. Available online: https://www.cia.gov/library/publications/resources/the-world-factbook/geos/af.html (accessed on 7 December 2019).
- Deans, J.; Gerhard, J.; Carter, L.J. Analysis of a thermal imaging method for landmine detection, using infrared heating of the sand surface. Infrared Phys. Technol. 2006, 48, 202–216. [Google Scholar] [CrossRef]
- Thành, N.T.; Sahli, H.; Hào, D.N. Infrared thermography for buried landmine detect: Inverse problem setting. IEEE Trans. Geosci. Remote Sens. 2008, 46, 3987–4004. [Google Scholar] [CrossRef]
- Smits, K.M.; Cihan, A.; Sakaki, T.; Howington, S.E. Soil moisture and thermal behavior in the vicinity of buried objects affecting remote sensing detection. IEEE Trans. Geosci. Remote Sens. 2013, 51, 2675–2688. [Google Scholar] [CrossRef]
- Agarwal, S.; Sriram, P.; Palit, P.P.; Mitchell, O.R. Algorithms for IR-imagery-based airborne landmine and minefield detection. In Proceedings of the SPIE—Detection and Remediation of Mine and Minelike Targets VI, Orlando, FL, USA, 16–20 April 2001; Volume 4394, pp. 284–295. [Google Scholar]
- Laliberte, A.S.; Herrick, J.E.; Rango, A.; Winters, C. Acquisition, orthorectification, and object-based classification of unmanned aerial vehicle (UAV) imagery for rangeland monitoring. Photogramm. Eng. Remote Sens. 2010, 76, 661–672. [Google Scholar] [CrossRef]
- Wigmore, O.; Mark, B.G. Monitoring tropical debris-covered glacier dynamics from high-resolution unmanned aerial vehicle photogrammetry, Cordillera Blanca, Peru. Cryosphere 2017, 11, 2463. [Google Scholar] [CrossRef] [Green Version]
- Metzler, B.; Siercks, K.; Van Der Zwan, E.V. Hexagon Technology Center GmbH. Determination of Object Data by Template-Based UAV Control. U.S. Patent 9,898,821, 20 February 2018. [Google Scholar]
- Cheng, Y.; Zhao, X.; Huang, K.; Tan, T. Semi-Supervised learning for rgb-d object recognition. In Proceedings of the 2014 22nd International Conference on Pattern Recognition, Stockholm, Sweden, 24–28 August 2014; Volume 24, pp. 2377–2382. [Google Scholar]
- Liu, J.; Zhang, S.; Wang, S.; Metaxas, D.N. Multispectral deep neural networks for pedestrian detection. arXiv 2016, arXiv:1611.02644. [Google Scholar]
- Parrot Store Official. Parrot SEQUOIA+. Available online: https://www.parrot.com/business-solutions-us/parrot-professional/parrot-sequoia (accessed on 21 January 2020).
- FLIR. Vue Pro Thermal Camera for Drones. Available online: https://www.flir.com/products/vue-pro/ (accessed on 21 January 2020).
- Pour, T.; Miřijovský, J.; Purket, T. Airborne thermal remote sensing: The case of the city of Olomouc, Czech Republic. Eur. J. Remote Sens. 2019, 52, 209–218. [Google Scholar] [CrossRef]
- Github. Jwyang/Faster-Rcnn.Pytorch. Available online: https://github.com/jwyang/faster-rcnn.pytorch (accessed on 24 January 2020).
- Github. Tzutalin/Labelimg. Available online: https://github.com/tzutalin/labelImg (accessed on 24 January 2020).
- Github. Lozuwa/Impy. Available online: https://github.com/lozuwa/impy#images-are-too-big (accessed on 24 January 2020).
- De Smet, T.; Nikulin, A.; Baur, J. Scatterable Landmine Detection Project Dataset 1. Geological Sciences and Environmental Studies Faculty Scholarship. 4. 2020. Available online: https://orb.binghamton.edu/geology_fac/4 (accessed on 27 January 2020).
- De Smet, T.; Nikulin, A.; Baur, J. Scatterable Landmine Detection Project Dataset 2. Geological Sciences and Environmental Studies Faculty Scholarship. 10. 2020. Available online: https://orb.binghamton.edu/geology_fac/10 (accessed on 27 January 2020).
- De Smet, T.; Nikulin, A.; Baur, J. Scatterable Landmine Detection Project Dataset 3. Geological Sciences and Environmental Studies Faculty Scholarship. 9. 2020. Available online: https://orb.binghamton.edu/geology_fac/9 (accessed on 27 January 2020).
- De Smet, T.; Nikulin, A.; Baur, J. Scatterable Landmine Detection Project Dataset 4. Geological Sciences and Environmental Studies Faculty Scholarship. 8. 2020. Available online: https://orb.binghamton.edu/geology_fac/8 (accessed on 27 January 2020).
- De Smet, T.; Nikulin, A.; Baur, J. Scatterable Landmine Detection Project Dataset 5. Geological Sciences and Environmental Studies Faculty Scholarship. 7. 2020. Available online: https://orb.binghamton.edu/geology_fac/7 (accessed on 27 January 2020).
- De Smet, T.; Nikulin, A.; Baur, J. Scatterable Landmine Detection Project Dataset 6. Geological Sciences and Environmental Studies Faculty Scholarship. 6. 2020. Available online: https://orb.binghamton.edu/geology_fac/6 (accessed on 27 January 2020).
- De Smet, T.; Nikulin, A.; Baur, J. Scatterable Landmine Detection Project Dataset 7. Geological Sciences and Environmental Studies Faculty Scholarship. 5. 2020. Available online: https://orb.binghamton.edu/geology_fac/5 (accessed on 27 January 2020).
Figure 1.
Rendering of an Inert PFM-1 plastic anti-personal landmine considered in this study with small US coin for scale.
Figure 1.
Rendering of an Inert PFM-1 plastic anti-personal landmine considered in this study with small US coin for scale.

Figure 2.
Map of land use in Afghanistan showing sparse vegetation across regions of greatest scatterable mine contamination.
Figure 2.
Map of land use in Afghanistan showing sparse vegetation across regions of greatest scatterable mine contamination.
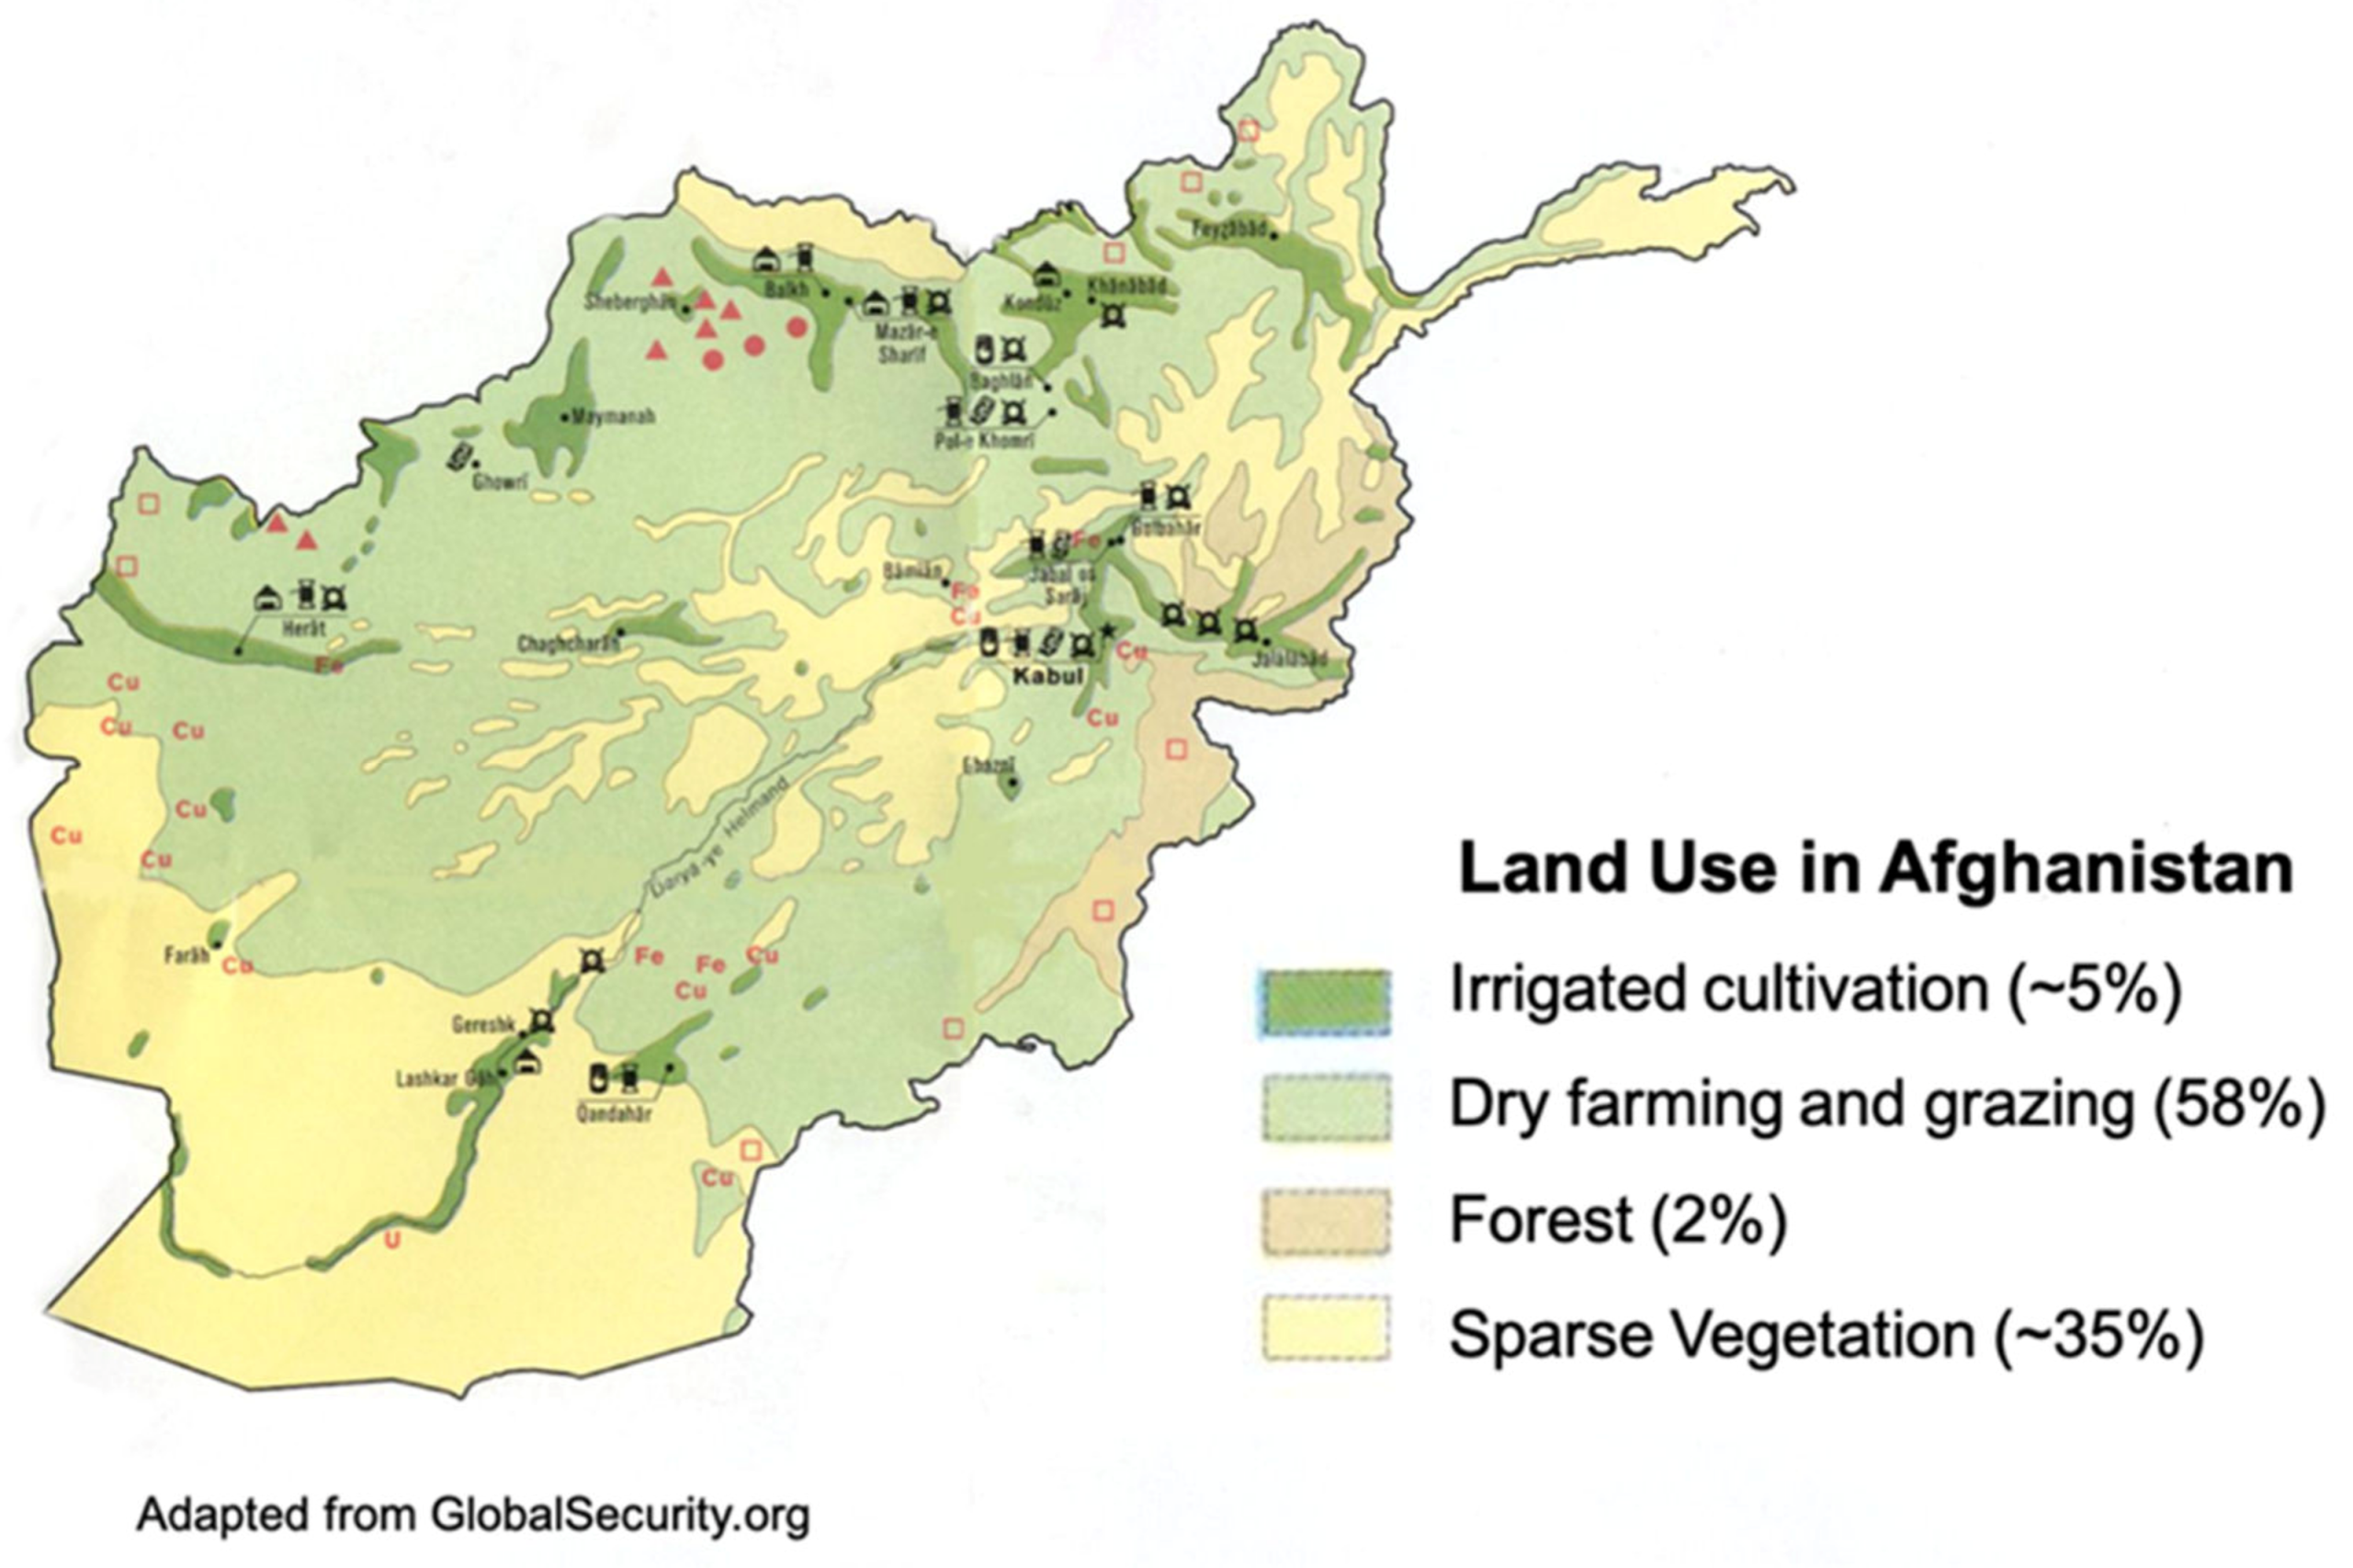
Figure 3.
Environments for collected datasets. (Left) Chenango Valley State Park, low vegetation flights on 20 October 2019. (Middle) Binghamton University, grass field flights on 5 November 2019. (Right) Binghamton University snow flights on 13 November 2019 where half of the mines were covered by snow and half surface lain.

Figure 4.
Illustration of experimental design mid-flight in Afghani terrain, using the Parrot Sequoia multispectral sensor attached to the Matrice 600 Pro UAV (unmanned aerial vehicle). Processed multispectral images of the PFM-1 taken from 10 m height during flight.
Figure 4.
Illustration of experimental design mid-flight in Afghani terrain, using the Parrot Sequoia multispectral sensor attached to the Matrice 600 Pro UAV (unmanned aerial vehicle). Processed multispectral images of the PFM-1 taken from 10 m height during flight.

Figure 5.
Workflow to generate georeferenced orthophotos using Pix4D Mapper.

Figure 6.
Workflow for processing thermal images to remove edge effect using ArcMap raster calculator.
Figure 6.
Workflow for processing thermal images to remove edge effect using ArcMap raster calculator.

Figure 7.
Generated RGB orthophotos from Pix4D Mapper for each environment.

Figure 8.
Georeferenced green bandwidth orthophoto (with RGB picture of PFM-1 landmine shown for comparison), overlaid with cm scale accurate shapefile taken from the Trimble Geo 7x.
Figure 8.
Georeferenced green bandwidth orthophoto (with RGB picture of PFM-1 landmine shown for comparison), overlaid with cm scale accurate shapefile taken from the Trimble Geo 7x.

Figure 9.
Clipped images of orthophotos from six different bandwidths (plus normalized difference vegetation index), showing the success in identifying the plastic PFM-1 landmine and the aluminum KSF casing from the surrounding environment in grass, low vegetation and snow datasets.
Figure 9.
Clipped images of orthophotos from six different bandwidths (plus normalized difference vegetation index), showing the success in identifying the plastic PFM-1 landmine and the aluminum KSF casing from the surrounding environment in grass, low vegetation and snow datasets.

Figure 10.
AP for two PFM-1 landmines, one KSF-Casing, and one KSF-Cap in testing data.


| Sensor | Spectral Band | Pixel Size | Resolution | Focal Length | Frame Rate | Image Format |
|---|---|---|---|---|---|---|
| FLIR Vue Pro R | Thermal Infrared: 7.5–13.5 µm | NA | 640 × 512 pixels | 13 mm | 30 Hz (NTSC); 25 Hz (PAL) | TIFF, 14-bit raw sensor data |
| Parrot Sequoia RGB | Visible light: 380–700 nm | 1.34 μm | 4608×3456 pixels | 4.88 mm | Minimum value: 1 fps | JPG |
| Parrot Sequoia 4× monochrome sensors | Green: 530–570 nm Red: 640–680 nm Red Edge: 730–740 nm Near Infrared: 770–810 nm | 3.75 μm | 1280 × 960 pixels | 3.98 mm | Minimum value: 0.5fps | TIFF, RAW 10-bit files |
Table 2.
Training and testing results for the Faster Regional-Convolutional Neural Network (Faster R-CNN).
Table 2.
Training and testing results for the Faster Regional-Convolutional Neural Network (Faster R-CNN).
| Train Data | Train Time (m) | Test Data | Test Time (s) | AP for PFM-1 | AP for KSF-Casing | Mean AP |
|---|---|---|---|---|---|---|
| Six flights, grass & rubble (Fall 2019) | 37 | One flight rubble (Fall 2017) | 1.87 | 0.7030 | 0.7273 | 0.7152 |
| Random 70% of seven total flights | 29 | Random 30% of seven total flights | 5.47 | 0.9983 | 0.9879 | 0.9931 |
© 2020 by the authors. Licensee MDPI, Basel, Switzerland. This article is an open access article distributed under the terms and conditions of the Creative Commons Attribution (CC BY) license (http://creativecommons.org/licenses/by/4.0/).
Share and Cite
MDPI and ACS Style
Baur, J.; Steinberg, G.; Nikulin, A.; Chiu, K.; de Smet, T.S. Applying Deep Learning to Automate UAV-Based Detection of Scatterable Landmines. Remote Sens. 2020, 12, 859. https://doi.org/10.3390/rs12050859
AMA Style
Baur J, Steinberg G, Nikulin A, Chiu K, de Smet TS. Applying Deep Learning to Automate UAV-Based Detection of Scatterable Landmines. Remote Sensing. 2020; 12(5):859. https://doi.org/10.3390/rs12050859
Chicago/Turabian StyleBaur, Jasper, Gabriel Steinberg, Alex Nikulin, Kenneth Chiu, and Timothy S. de Smet. 2020. "Applying Deep Learning to Automate UAV-Based Detection of Scatterable Landmines" Remote Sensing 12, no. 5: 859. https://doi.org/10.3390/rs12050859
Note that from the first issue of 2016, this journal uses article numbers instead of page numbers. See further details here.