Remote Monitoring of Floating Covers Using UAV Photogrammetry
by
 , ,
, ,
Leslie Wong
1,* ,
,
Benjamin Steven Vien
1,
Yue Ma
1,
Thomas Kuen
2,
Frank Courtney
2,
Jayantha Kodikara
3 and
Wing Kong Chiu
1 1
Department of Mechanical & Aerospace Engineering, Monash University, Clayton, VIC 3168, Australia
2
Melbourne Water Corporation, Docklands, VIC 3008, Australia
3
Department of Civil Engineering, Monash University, Clayton, VIC 3168, Australia
*
Author to whom correspondence should be addressed.
Remote Sens. 2020, 12(7), 1118; https://doi.org/10.3390/rs12071118
Submission received: 27 February 2020
/
Revised: 30 March 2020
/
Accepted: 31 March 2020
/
Published: 1 April 2020
(This article belongs to the Special Issue Unmanned Aerial Vehicles in Geomatics)
Abstract
:High-density polyethylene (HDPE) is commonly the material of choice for covered anaerobic lagoons (CAL) at wastewater treatment plants. The membrane floats on the wastewater, and hence is called a “floating cover”, and is used for odour control and to harvest the methane-rich biogas as a renewable resource to generate electricity. The floating cover is an expensive and high-value asset that demands an efficient methodology for the determination of a set of engineering quantities for structural integrity assessment. Given the dynamics of the anaerobic activities under the floating cover, the state of deformation of the floating cover is an engineering measurand that is useful for its structural health assessment. A non-contact measurement strategy is preferred as it offers practical and safety-related benefits over other methods. In collaboration with Melbourne Water Corporation (MWC), an unmanned aerial vehicle (UAV) assisted photogrammetry approach was developed to address this need. Following the definition of the appropriate flight parameters required to quantify the state of deformation of the cover, a series of periodic flights were operated over the very large floating covers at MWC’s Western Treatment Plant (WTP) at Werribee, Victoria, Australia. This paper aims to demonstrate the effectiveness and practicality of this inspection technique to determine the state of deformation of the floating covers measured over a ten-month period.
1. Introduction
Melbourne Water Corporation’s (MWC) Western Treatment Plant (WTP) at Werribee, Victoria, Australia is a large wastewater treatment facility, see Figure 1. WTP treats more than 50% of Melbourne’s sewage via a combination of lagoon systems and activated sludge plants. WTP includes two deep, 9.7-hectare, covered anaerobic lagoons (CAL) [1] where the raw sewage is broken down via anaerobic digestion. These lagoons are covered by high-density polyethylene (HDPE) membrane [2,3]. The membrane that floats on the wastewater, also called a “floating cover”, helps to provide an anaerobic environment for the bacteria to digest the organic material in sewage and to produce methane-rich biogas. The floating cover performs the function of capturing odor and greenhouse emissions from these lagoons. Each floating cover captures up to 65,000 m3 of biogas per day, which is then used to generate up to 7 MW of electricity.
At the WTP, all the inflow sewage is unscreened and first passes through the anaerobic lagoons, and hence, contains grit, fats, greases, floatable solids (i.e., foams), fibrous, and other solid matter. Some of this material can consolidate at the water surface (under the covers) and form (what has been termed) ‘buoyed scums’ or ‘accumulated scum’, as they also have a variable depth below the water level. The floating scums will impose a vertical force on the floating cover and hence deforms the cover. The scums can also cause lateral (side-to-side) displacement of the floating cover due to the wind loading and hydrodynamic effects resulting from the in-flow of raw sewage. The vertical elevation and lateral displacement will deform the floating cover resulting in a change in the state of stress of the membrane material. Wrinkles on the membrane will also form from this movement and deformation. A knowledge of the state of displacement of the cover, including how this varies with time, is also a useful measurand to determine the extent of the formation and accumulation of the scums beneath the floating cover. Since the scums can block the biogas paths for the harvesting of the biogas from the lagoons, the identification of abnormally elevated regions on the floating cover is a useful indication of regions of trapped biogas. This is all-important for the maintenance and operation of the anaerobic lagoons.
Lightweight unmanned aerial vehicles (UAV) are becoming popular in spatial mapping, survey and remote sensing applications [4]. The advantages of a non-contact flight-based assessment approach for the floating cover (i.e., using the UAV) include the capability to fly at low altitude (hence, obtaining high images resolution), efficient (survey a large area (i.e., Ha – km2) in a short period), and high flexibility (accessible on high risk, difficult, or non-trafficable area). Photogrammetry is used to establish and derive the geometric relationship between the aerial images taken with the UAV and an object at the time of imaging event. With sufficient images forward and side overlap percentage along the flight line, ‘tie-points’ (common points between images) can be used for feature matching and hence facilitate the orthophotos, digital surface model (DSM), and 3-dimensional (3-D) modelling. To date, the majority of UAV mapping projects are related to archaeological documentation [5,6] and vegetation monitoring [7]. Many tests and investigations have been done in the past to verify the accuracy and reliability of UAV aided photogrammetry [8] and other potential applications (i.e., remoting sensing) are also discussed in the literature [9,10].
UAV-aided photogrammetry is a safe and time-efficient assessment technique [11,12], which can be remotely operated to conduct UAV RTK mapping survey without coming into contact with the asset. This paper will report the series of UAV surveillances conducted on one of the floating covers at WTP. This paper aims to demonstrate the effectiveness of this inspection technique to determine the state of the deformation of the cover as measured in 6 subsequent flights over 4 seasons (about 10 months). This work also forms a crucial part of developing the non-contact UAV-based photogrammetry technique to assist with the maintenance and operation of the floating covers. The ability to define the deformation of the floating cover was verified using manual measurements recorded by an independent contractor. The accessibility of the digital model of the floating cover to the operators of WTP and the managers of the floating cover asset provides invaluable information for (a) the overall state of deformation of the cover, (b) detailed analyses of the local deformation of key structural items on the cover, (c) determining the extent of the formation of scum beneath the cover, and (d) the formation of biogas pocket over the floating cover.
2. Unmanned Aerial Vehicle (UAV) Photogrammetry Set Up
The orthophoto of the monitored CAL at the WTP is shown in Figure 2. The dimension of the floating cover over this lagoon is 475 m × 216 m. A total of eight ground control points (GCPs) were marked on the concrete area around the anaerobic lagoon. A Global Navigation Satellite System (GNSS) RTK rover from Leica GS18 T model (using SmartNet CORS network) was used to measure the location of the GCPs twice for 180 seconds and averaged. The accuracy of GCPs measurement typically (at worst), due to GDA94 and AusGeoid09, is 20 mm horizontal and 30 mm vertical [13]. By considering the redundancy, a Hex Rotor UAV - DJI M600 Pro with Zenmuse X5 (15 mm lens) [14], see Figure 3a, was utilised to conduct the UAV survey over the floating cover of this lagoon. A total of six drone surveillances were conducted over a period of 10 months. The details of each flight, or UAV RTK mapping survey, are listed in Table 1. WTP mandates a minimum flight elevation of 20 m from the surface of the covers for safety reasons. A trained and licensed UAV pilot used Pix4DCapture [15] to configure a single grid flight path with more than 70% overlap at 50 m above ground level over the floating cover. Each UAV RTK mapping survey took approximately 30 min.
Metashape Professional by Agisoft [16] was used for post-processing of the images taken from the UAV surveys (photogrammetry). Agisoft Metashape adopts computer vision algorithms as described in [17,18,19] which allows the user to set the quality of image alignment, constructing dense clouds, mesh and capable of generating digital elevation model (DEM). The aerial images obtained are all geo-tagged, compare sensor data from A3 Pro Flight controller (three sets of GNSS units) on DJI M600 Pro, providing centimetre-level accuracy [14]. All the metadata (e.g., GPS location and camera setting) of the images were first imported to Agisoft Metashape Professional for image orientation and alignment purposes. Figure 3b shows the aligned tie-points profile of the covered anaerobic lagoon. The work presented is built on the previous works as described in [20,21], where the optimal flight parameters and aerial images photogrammetry setting were studied. A single grid flight path is chosen with image overlapping percentage set to be more than 70% in both forward and side direction. Most of the region of interest (the cover) are overlapped with at least 9 aerial images as shown in Figure 4. The image orientation alignment and dense clouds construction were set to be “Highest” and “Ultra High” respectively, when post-processing the images acquired from all flights. The GPS (Easting and Northing) of all the GCPs were also loaded to generate a scaled DEM. The GCPs’ residuals can be determined by the room mean square error (RMSE) function obtained from photogrammetry and they are listed in Table 2. The errors (in x, y, and z coordinates) of the GCPs are within a sub-cm accuracy.
3. Validation of the Accuracy of the Constructed Digital Elevation Model (DEM)
Raw sewage flows under gravity into the covered anaerobic lagoon (CAL) via eight inlets and two bypass inlets, as shown in Figure 5a. Since the floating cover traps the biogas generated by anaerobic digestion from the raw sewage, it is expected to harvest biogas underneath the entire floating cover. Biogas paths were integrated with the design of the cover for biogas harvesting. However, hard buoyed scums are forming and accumulating in the vicinity of the sewage inlet (first 150 m from the inlets) due to the composition of the untreated sewage deposited into the CAL. These buoyed scums are hindering the biogas harvesting process by blocking the biogas paths. The ability to determine the extent of the accumulation of these scums and to study the effects of these formations on the deformation of the floating cover is invaluable for the maintenance and management of this critical asset.
The anaerobic lagoon cover has 11 segments (see Figure 5a) with each segment separated by tensioned catenary-shaped flotation (complete with a ballasted gas seal curtain). The scums primarily form under Segment 1, with progressively less scum further down the cover. The formation of large quantities of scums have eventually deform the flotation especially the first 4 segments. This imposes additional stress on the floating cover at the region around the deformed flotations. An ability to define this deformation is crucial to the management of this large asset.
A constructed digital elevation model (DEM) using UAV photogrammetry will provide the required information to define the state of deformation of the floating cover due to the movement of the scums and key engineering features on the floating cover (i.e., movement and deformation of the primary flotation). A DEM constructed using the UAV RTK mapping surveys obtained in Flight 3 is shown in Figure 5b.
The accuracy of the DEM is first established with level survey conducted by a MWC’s independent contractor. A total of 64 points on the cover (see Figure 5a) were measured using IMEX i77R rotating red beam laser [22]. The operating range for the level survey is up to 600 m and 1.5 mm accuracy at 30 m (from manufacturer). The IMEX i77R were first set up on a tripod sitting on the concrete area next to the cover, another surveyor was moving around the cover a laser detector (installed on a pole). A course detector reading (5 mm) was used for the measurement. The surveyor defined Point 33, as shown in Figure 5a, as the datum or reference point (water level) as there is not hard scum underneath the cover. In total, 22 points were measured on the cover and 42 points were measured on the flotations. It is also noted that during the level measurement, the deformation of the cover due to the weight of the surveyor when walking around the cover may affect the accuracy of the cover level measurement. It must be emphasised that the acquisition of the data for the DEM using the UAV is not affected by these operational constraints.
As there is no geo-tag on the results obtained from the levelling survey by MWC’s contractor, an averaged elevation of 10 × 10 pixels at the points in the constructed DEM were compared. For comparison purposes, the same datum, Point 33 (water level) as identified in the DEM, is set as the water level for the constructed DEM. The elevation obtained from constructed DEM (Figure 5b) was compared with the elevation obtained from the survey level. These results are shown in Table 3 and plotted graphically in Figure 6. The difference in measurement has a range of 0.26 m (−0.14 m to 0.09 m) with a standard deviation of 0.05 m. The largest difference in elevation between both measurement methods measured at Point 36 in Segment 8 is −0.14 m. Figure 6 shows that Point 36 is an outlier, which is outside the range of ±1.5 × IQR (Interquartile range). The error can be due to human error (choosing the wrong points for comparison) and it could be due to the change in condition (as both surveys were not conduct on the same day). Nevertheless, the accuracy of the DEM is evident and 71% of the error between the two measurements are within ± 0.05 m, which is small compared to the length-scale expected. The finding highlights the reliability and the confidence of using the constructed DEM to assess the floating cover.
4. Analysis of the DEM
The constructed DEM shows that the covers at the regions in the vicinity of the sewage inlet are highly elevated (large red patches), especially along the middle and bottom sections of Segment 1 (see Figure 5b). These highly elevated regions could potentially be due to the accumulation of buoyant hard scums. In addition, there are multiple biogas pockets (small yellow patches) can also be noted along Segment 10, see Figure 5b.
The cross-section of the flotations 1, 2, 4, 6, 8, and 10 (see Figure 5b) were also plotted in Figure 7. Flotation 1 is in between segments 1 and 2 and flotation 2 is in between segments 2 and 3. Figure 7 shows that floating cover within segments 1–3 had been elevated up to 0.6 m above water level, whereas the other segments are still remaining at water level (elevation = 0 m). It is also noted that the flotations 1 and 2 are tilted by approximately 6 (clockwise) and 10o (anticlockwise) respectively. The tilted flotation will result in a net forcing function on the membrane and give rise to a change in the state of the localised stress on the cover material in the vicinity of the flotations. It is also noted that there is no significant deformation of the flotations 4–6. The UAV-assisted surveillance highlights the strength of this remote inspection and assessment capability for determining the state of deformation. The following sections will describe the novel potential applications of time-lapsed UAV RTK mapping survey of the UAV photogrammetry at CAL.
4.1. Time-Lapse UAV RTK Mapping Surveys to Study the Development and Growth of Scum-Bergs
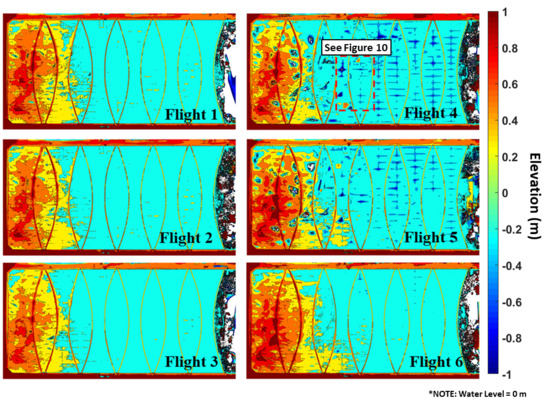
Since the drone surveillances were conducted over 4 seasons (over a period of 10 months), the time-lapse UAV RTK mapping survey become a useful tool to study the development and movement of scums (and accumulation of biogas) beneath the floating cover. Figure 8 and Figure 9 show the orthophotos obtained from the six drone surveillances and their corresponding DEM, respectively.
The orthophotos obtained from UAV photogrammetry are capable of defining the regions with pooled surface water. However, it is still a challenge to measure the depth (or volume) information of the water pools using the UAV photogrammetry method due to the reflective water surface. The water pools (darker green in the orthophotos) are the result of the accumulation of rainwater on the floating cover. The formation of a large volume of water will impose additional loading on the covers and hinder the biogas harvesting process as some of the water pools block the biogas paths under the cover. Figure 10 shows the DEM obtained from Flight 4 (the highlighted region in Figure 9) where the presence of the biogas pockets due to the blockage of the biogas paths. The current inspection process requires personnel to walk on the cover and determine the extent and location of these water pools to activate works to pump the accumulated water away. The advice is that it takes approximately 30 min to an hour to drain each of the large water pools. Flight 4 and Flight 5 were conducted during winter and rainy seasons. The Australian Government Bureau of Meteorology [23] recorded a rainfall of 22.8 mm in a day, one week before the UAV RTK mapping survey obtained in Flight 4. Figure 8 shows that the orthophoto obtained using the UAV photogrammetry can be used to outline the large water pools without even walking on the cover. Most of the large water pools were then drained away before Flight 6 as shown in Figure 9. The ability to use aerial photography to identify the water pools is still one of the immediate benefits of this non-contact assessment of the floating cover.
In Figure 9, the constructed DEMs show that Segment 1 and 2 are a highly elevated region, and Segment 3 and 4 are slightly elevated. Whereas, Segments 5–11 remain at the water level (elevation = 0 m). The elevated cover at Segment 1 and 2 identify the formation and accumulation of the largely buoyed scums. From the scum depth surveyed conducted by MWC’s independent contractor (Apr 2019), Segment 1 and 2 are the region with a large area of consolidated sludge and scums. The total height of the scum (including buoyed and submerged scum) were measured physically at ten different access ports distributed along Segment 1. The total height (including the buoyed and submerged scum) were measured and ranged from 1.8 m to 4.5 m. The total scum height measured at other segments ranged from 0.1 m to 0.5 m and no scum were found when surveying the portholes at Segment 11.
The qualitative findings provided by the independent contractor correlates with the DEM results shown in Figure 9. It is shown that the regions of significant accumulation of scums are associated with an elevation of the floating cover above the water level. This elevation is most significant in Segment 1 of the floating cover. This result suggests that the elevation of the floating cover above water level can potentially be used to identify the regions of significant scums accumulation.
4.2. Time-Lapse UAV RTK Mapping Surveys to Study the Wrinkles Formation Arising from the Lateral Deformation of the Floating Cover
Wrinkles can be observed on the floating cover at the WTP. Often, the formation of wrinkles in thin sheets can be due to subject to a variety of loading conditions [24,25,26]. Two types of wrinkles can form on the cover, (1) tension and shear wrinkles, and (2) compression wrinkles. It is thus important to monitor and understand the mechanics of wrinkling in a global scale for reliable control of surface wrinkles. It is impossible to document the formation of these wrinkles on the floating cover with the current cover walk inspection. With the available DEM, this section of the paper will discuss the results from an attempt to document the progression of wrinkle formation on the floating cover. A 2-dimensional (2-D) median filter [27] is proposed to monitor the wrinkles profile. An open-source 2-D smoothing function written by G. Reeves [28] is first applied on the DEM profile with a window size of 1 m × 1 m to remove the shorter wavelength deformation (i.e., wrinkles). The wrinkles profile can then be calculated by subtracting the smoothed DEM profile from the raw DEM profile (original without applied smoothing function). The wrinkle profiles for each drone surveillances are presented in Figure 11.
Figure 11 shows that the wrinkles can be identified from these wrinkle profiles. Multiple short-wavelength wrinkles deformation can be found gathered in particular regions in Segments 1–4. From the overview, the wrinkles tend to form perpendicular to the direction of the incoming flow (left to right in Figure 11). For better illustration purposes, the front-line of the wrinkles for all the wrinkles profile obtained from each surveillance are drawn manually in red lines in Figure 11.
In addition, multiple smaller wavelength wrinkles were also noted around the water pools during the raining seasons (Flight 4 and 5). The front-line of wrinkles are noted to have shifted significantly in the wrinkles profile obtained in Flight 6 (comparing with Flight 3). In Flight 6, the wrinkles profiles are approaching Segment 5 and 6.
By following the time-lapsed of the wrinkle profiles, it can be noticed that the wrinkles were noted to have moved towards right (East) especially in the top section (North) of Segment 4. The movement of wrinkles can be an indicator for the development of scum beneath the cover. MWC has also confirmed that due to the change in operation at WTP, only the two bypass inlets (top left the lagoon), see Figure 5a are operating within the UAV surveillances period. The change in operations led to the growth of scums concentrated on the top section (North) of Segments 1–4. The wrinkles profile agrees with the information provided by MWC. These time-lapsed wrinkles profiles are capable of showing the progression and development of wrinkles. The movement of wrinkles may indicate the movement of scums beneath the cover. Hence, the progression of the wrinkle-front can be an indicator of movement caused by the accumulation of the scum.
4.3. Time-Lapse UAV RTK Mapping Surveys to Study the Accumulation of Scums under the Floating Cover
A baseline subtraction method is also used to determine the change in elevation over the UAV RTK mapping surveys shown in Figure 9. The aim for performing the baseline subtraction is to investigate the use of digital information to quantify the scums accumulation and movement. The constructed DEM for Flight 1 is used as a baseline. The difference in elevation for each UAV survey is calculated by subtracting the DEM obtained from each flight with the baseline (Flight 1). The baseline subtraction DEM results are presented in Figure 12. The observations from this study are as follows:
- Segment 2 shows an elevation of more than 0.4 m since Flight 4.
- Flotation 2 has also noted to move laterally, which correlates with the progression of wrinkle profile (see Figure 11).
- From the baseline subtraction DEM (Figure 12), there is suggestion of biogas pockets along Segment 5 and 6 in Flight 4 and 5, which cannot be determined from orthophoto as presented in Figure 8. The formation of these biogas pockets is due to the blockage of biogas paths due to the water pools on the cover. After draining away the water pools around the biogas pockets, the elevation returns to normal level in Flight 6 – 1, see Figure 12.
Figure 12 also shows that there is a change in elevation in the middle region of flotation 2 as indicated in Flight 5 – 1. For verification purposes, the time-lapsed elevation profiles along with Flotations 2, 3, and 7 as indicated in Figure 12 (Flight 4 – 1) are plotted in Figure 13 (a–c) respectively. Figure 13a shows that flotation 2 was initially at 0.4 m above water level (Flights 1 to 4) and subsequently increased to 0.7 m above water level (Flights 5 and 6). The increase of 0.3 m in elevation indicates that the scums have been accumulating or moving beneath the cover to elevate the flotation 2 and the floating cover at this region. The flotation is also displaced to the right by 1.5 to 2 m and rotated anticlockwise (with difference in elevation of 0.2 m), see Flight 5 and 6 in Figure 13a. This can impose a significant amount of localised stress on the cover.
Figure 13b shows the elevation profile along flotation 3. The initial elevation above water level is approximately 0.3 m. There is no significant change in elevation with time at flotation 3, however, the flotation 3 is tilted clockwise and lifted the cover on the left region of flotation 3, see Flights 5 and 6 in Figure 13b. This indicates the scums beneath the flotation 3 are accumulating loading on the flotation. This will need to be further investigated with a future UAV RTK mapping survey. Figure 13c shows no observable change in the elevation profile along flotation 7. This is consistent with the fact that scums are unlikely to propagate into this region.
The results thus far have shown that the UAV photogrammetry can provide a significant contribution to the overall maintenance and operation of the floating covers at the WTP. Time lapsed UAV photogrammetry offers unique features to remotely monitor the development and growth of the scums. This will help inform proactive decisions that can benefit the operation of the anaerobic lagoon. This non-contact remote sensing technique is superior and safer than the current inspection procedure of the floating cover. In addition, the DEM constructed using UAV photogrammetry are capable of quantifying the geometry with the accuracy as described in above sub-sections.
5. Conclusions
This paper shows the viability of using an efficient UAV photogrammetry inspection methodology to monitor the state of deformation of the floating cover at the covered anaerobic lagoon (CAL) at Melbourne Water Cooperation’s (MWC) Western Treatment Plant (WTP). The digital information derived from the UAV RTK mapping surveys provided information that can be used for the displacement assessment, operation and maintenance planning at the WTP. This leads to an efficient maintenance and operation strategy of this high-value asset. The following dot points summarised the findings of the work presented.
- Six drone surveillances were conducted over four seasons (10 months) to remotely monitor the condition of HDPE floating cover at the anaerobic lagoon at the WTP.
- UAV photogrammetry techniques were used to construct the time-lapsed orthophoto and digital elevation model (DEM).
- The accuracy of the constructed DEM is validated by comparing with the level survey at the CAL by MWC’s contractor.
- DEM shows the highly elevated region in Segment 1 of the CAL which is in the vicinity of the sewage inlet. The finding is supported by the field access port survey which shows that the total depth of the submerged and buoyed scums beneath the cover in Segment 1 and 2 ranged from 1.8 m to 4.5 m.
- Wrinkles and baseline subtraction model were demonstrated which provide additional values to using UAV photogrammetry for remotely monitoring of the CAL. Both wrinkles and baseline subtraction model are capable of indicating the development, growth and movement of scums beneath the floating cover.
- The development of scums can elevate and deform the flotation. The deformation (lateral movement and rotation) of flotation can be quantified using the DEM obtained from time-lapsed surveillances. The cover around the deformed flotation may be stretched and impose high localised stress. However, more work has to be done to be able to perform stress analysis.
Author Contributions
Conceptualization, L.W., B.S.V., Y.M., T.K. and W.K.C.; methodology, L.W., F.C., W.K.C.; software, L.W.; validation, L.W.; formal analysis, L.W.; investigation, F.C.; resources, T.K., J.K., F.C. and W.K.C.; data curation, F.C.; writing—original draft preparation, L.W. and W.K.C.; writing—review and editing, B.S.V., and T.K.; visualization, L.W. and W.K.C.; supervision, J.K. and W.K.C.; project administration, T.K. and W.K.C.; funding acquisition, T.K., J.K. and W.K.C. All authors have read and agreed to the published version of the manuscript.
Funding
This research was funded by Australian Research Council Linkage Grant (ARC), grant number LP170100108”
Acknowledgments
This research is also financially supported by Melbourne Water Cooperation and Monash University. Their in-kind contributions are also gratefully acknowledged.
Conflicts of Interest
The authors declare no conflict of interest.
References
- “Sewage Treatment Process at Western Treatment Plant”, Melbourne Water, 30 October 2019. Available online: https://www.melbournewater.com.au/community-and-education/about-our-water/sewerage/western-treatment-plant/sewage-treatment-process (accessed on 17 December 2019).
- Rowe, R.; Sangam, H. Durability of HDPE geomembranes. Geotext. Geomembr. 2002, 20, 77–95. [Google Scholar] [CrossRef]
- Scheirs, J. A Guide to Polymeric Geomembranes: A Practical Approach; John Wiley & Sons: Hoboken, NJ, USA, 2009. [Google Scholar]
- Hinge, L.; Gundorph, J.; Ujang, U.; Azri, S.; Anton, F.; Abdul Rahman, A. Comparative analysis of 3D photogrammetry modelling software packages for drones survey. In Proceedings of the 5th International Conference on Geoinformation Science—GeoAdvances 2018, Casablanca, Morocco, 10–11 October 2018. [Google Scholar]
- Eisenbeiss, Z. The potential of unmanned aerial vehicles for mapping. In Photogrammetric Week’11; Fritsch, D., Ed.; Wichmann/VDE Verlag: Berlin, Germany; Offenbach, Germany, 2011; pp. 135–145. [Google Scholar]
- Verhoeven, G. Providing an archaeological bird’s-eye view—And overall picture of ground-based means to execute low-altitude aerial photography (LAAP) in Archaeology. Archaeol. Prospect. 2009, 10, 233–243. [Google Scholar] [CrossRef]
- Sugiura, R.; Noguchi, N. Remote-sensing technology for vegetation monitoring using an unmanned helicopter. Biosyst. Eng. 2005, 90, 369–379. [Google Scholar] [CrossRef]
- Lo Brutto, M.; Borruso, A.; Argenio, A. UAV systems for photogrammetric data acquisition of archaeological sites. Int. J. Herit. Digit. Era 2012, 1, 7–13. [Google Scholar] [CrossRef] [Green Version]
- Remondino, F.; Barazzetti, L.; Nex, F.; Scaioni, M.; Sarazzi, D. UAV photogrammetry for mapping and 3D modelling—Current status and future perspectives. In International Archives of the Photogrammetry, Remote Sensing and Spatial Information Sciences; International Society of Photogrammetry and Remote Sensing: Zurich, Switzerland, 2011; Volume 38. [Google Scholar]
- Gerke, M. Developments in UAV-photogrammetry. J. Digit. Landsc. Archit. 2018, 3, 262–272. [Google Scholar]
- Ong, W.H.; Chiu, W.K.; Kuen, T.; Kodikara, J. Determination of the state of strain of large floating covers using unmanned aerial vehicle (UAV) aided photogrammetry. Sensors 2017, 17, 1731. [Google Scholar] [CrossRef] [PubMed] [Green Version]
- Eisenbeiss, H.; Sauerbier, M. Investigation of UAV systems and flight modes for photogrammetric applications. Photogramm. Rec. 2011, 26, 400–421. [Google Scholar] [CrossRef]
- Leica. Leica GS18 T Data Sheet; Leica Geosystems AG: St. Gallen, Switzerland, 2020. [Google Scholar]
- DJI. Matrice 600 PRO User Manual V1.0; DJI: Shenzhen, China, 2018. [Google Scholar]
- “Pix4Dcapture,” Pix4D S.A. 2019. Available online: https://www.pix4d.com/product/pix4dcapture (accessed on 10 December 2019).
- Agisoft. Agisoft Metashape User Manual: Professional Edition, Version 1.5; Agisoft: St. Petersburg, Russia, 2019. [Google Scholar]
- Barazzetti, L.; Forlani, G.; Remondino, F.; Roncella, R.; Scaioni, M. Experiences and achievements in automated image sequence orientation for close-range photogrammetric projects. In Proceedings of the SPIE 8085, Videometrics, Range Imaging and Applications XI, 80850F, Munich, Germany, 23–26 May 2011. [Google Scholar]
- Westoby, M.; Brasington, J.; Glasser, N.; Hambrey, M.; Reynolds, J. Structure-from-motion photogrammetry: A low-cost, effective tool for geoscience applications. Geomorphology 2012, 179, 300–314. [Google Scholar] [CrossRef] [Green Version]
- Triggs, B.; Zisserman, A.; Szeliski, R. Bundle adjustment. A modern synthesis, Vision Algorithms: Theory and Practice. In Proceedings of the International Workshop on Vision Algorithms, Corfu, Greece, 21–22 September 1999; Springer: Berlin, Germany, 2000. [Google Scholar]
- Wong, L.; Courtney, F.; Vien, B.S.; Kuen, T.; Douglas, P.; Ma, Y.; Kodikara, J.; Chiu, W.K. Structural Assessment of Large Membrane Structures using an Unmanned Aerial Vehicle aided Photogrammetry: Determination of Flight Parameters and Trials at the Western Treatment Plant. J. Nondestruct. Eval. Diagn. Progn. Eng. Syst. 2019, 2, 1–8. [Google Scholar] [CrossRef]
- Chiu, W.K.; Ong, W.H.; Kuen, T.; Courtney, F. Large structures monitoring using unmanned aerial vehicles. In Procedia Engineering, Proceedings of the 6th Asia Pacific Workshop on Structural Health Monitoring (APWSHM), Hobart, Australia, 7–9 December 2016; Curran Associates, Inc.: Red Hook, NY, USA, 2017; Volume 188, pp. 415–423. [Google Scholar]
- Imex. i77R-Rotating-Laser-Data Sheet; Imexlasers: Molong, Australia, 2020. [Google Scholar]
- “Australian Government Bureau of Meteorology,” Australian Government. 2020. Available online: http://www.bom.gov.au/climate/dwo/IDCJDW3033.latest.shtml (accessed on 8 January 2020).
- Jenkins, C.; Haugen, F.; Spicher, W. Experimental measurement of wrinkling in membranes undergoing planar deformation. Exp. Mech. 1998, 38, 147–152. [Google Scholar] [CrossRef]
- Leifer, J.; Belvin, W. Prediction of wrinkle amplitudes in thin-film membranes using finite element modelling. In Proceedings of the 44th AIAA/ASME/ASCE/AHS/ASC Structures, Structural Dynamics and Material Conference, Norfolk, VA, USA, 7–10 April 2003. [Google Scholar]
- Nayyar, V.; Ravi-Chandar, R.H.K. Stretch-induced stress patterns and wrinkles in hyperelastic thin sheets. Int. J. Solids Struct. 2011, 48, 3471–3483. [Google Scholar] [CrossRef] [Green Version]
- Lim, J. Two-Dimensional Signal and Image Processing; Prentice Hall: Englewood Cliffs, NJ, USA, 1990. [Google Scholar]
- Reeves, G. “Smooth2a Ver 1,” 13 March 2009. Available online: https://au.mathworks.com/matlabcentral/fileexchange/23287-smooth2a (accessed on 4 June 2019).
Figure 1.
Aerial view of the covered anaerobic lagoon (CAL) at Western Treatment Plant (WTP).

Figure 2.
Orthophoto obtained from unmanned aerial vehicle (UAV) RTK mapping survey at covered anaerobic lagoon (CAL).
Figure 2.
Orthophoto obtained from unmanned aerial vehicle (UAV) RTK mapping survey at covered anaerobic lagoon (CAL).

Figure 3.
(a) Hex Rotor - DJI M600 Pro with Zenmuse X5 and (b) aligned tie-points of the covered anaerobic lagoon at the WTP.
Figure 3.
(a) Hex Rotor - DJI M600 Pro with Zenmuse X5 and (b) aligned tie-points of the covered anaerobic lagoon at the WTP.

Figure 4.
Quality of image overlapping from UAV photogrammetry (obtained from Agisoft Metashape).

Figure 5.
(a) Orthophoto of the covered anaerobic lagoon with 11 Segments and its corresponding (b) digital elevation model (DEM).
Figure 5.
(a) Orthophoto of the covered anaerobic lagoon with 11 Segments and its corresponding (b) digital elevation model (DEM).

Figure 6.
Difference in measurement obtained from level survey and UAV photogrammetry.

Figure 7.
Cross-section view of different flotation at CAL (as indicated in Figure 5b).
Figure 7.
Cross-section view of different flotation at CAL (as indicated in Figure 5b).

Figure 8.
Orthophoto of the six drone surveillances over four seasons at CAL.

Figure 9.
Corresponding DEM of six drone surveillances over four seasons at CAL.

Figure 10.
Comparison between orthophoto and constructed DEM at the region highlighted in Figure 9 (Flight 4) to identify biogas pockets (due to blockage of biogas paths).
Figure 10.
Comparison between orthophoto and constructed DEM at the region highlighted in Figure 9 (Flight 4) to identify biogas pockets (due to blockage of biogas paths).

Figure 11.
Corresponding wrinkle profiles of six drone surveillances over four seasons at CAL.

Figure 12.
Baseline subtraction DEM for each drone surveillances using Flight 1 as baseline.

Figure 13.
Cross-section view of flotations (a) 2, (b) 3, and (c) 7 above water level, see Figure 12 (Flight 4 – 1) for the location of each flotation.
Figure 13.
Cross-section view of flotations (a) 2, (b) 3, and (c) 7 above water level, see Figure 12 (Flight 4 – 1) for the location of each flotation.


Table 1.
Flight parameters and Photogrammetry configurations for the UAV RTK mapping survey.
| Equipment | M600 Pro with Zenmuse X5 camera (15 mm lens) | |||||
|---|---|---|---|---|---|---|
| Mapped area | 475 m × 216 m | |||||
| UAV RTK mapping survey | Flight 1 | Flight 2 | Flight 3 | Flight 4 | Flight 5 | Flight 6 |
| Season | Summer | Summer | Autumn | Winter | Winter | Spring |
| Total images taken | 655 | 793 | 912 | 928 | 928 | 929 |
| Flight method | Automatic* | |||||
| Overlap (%) | ||||||
| Forward overlap | 70 | 80 | 80 | 80 | 80 | 80 |
| Side overlap | 70 | 70 | 80 | 80 | 80 | 80 |
| Flight altitude | 50 m AGL** | |||||
| Alignment and Dense cloud configuration (photogrammetry) | “Highest” and “Ultra High” | |||||
| Spatial resolution for DEM (photogrammetry) | 1.14 cm/pixel (acquired information from Agisoft) | |||||
Note: * Automatic: Single-grid flight path controlled by Pix4DCapture; ** AGL: Above ground level.
Table 2.
Root mean square error of control points resulting from photogrammetry.
| X Error (mm) | Y Error (mm) | Z Error (mm) | Error (pix) | |
|---|---|---|---|---|
| Point 1 | 4.54 | 19.28 | −19.17 | 0.44 |
| Point 2 | −18.94 | −10.88 | 18.43 | 0.40 |
| Point 3 | −4.86 | −19.88 | −10.75 | 0.33 |
| Point 4 | −5.17 | −10.37 | −4.69 | 0.41 |
| Point 5 | 25.43 | −6.76 | 5.09 | 0.37 |
| Point 6 | 3.90 | 21.10 | −4.15 | 0.37 |
| Point 7 | −0.18 | 6.07 | 0.19 | 0.31 |
| Point 8 | −5.68 | 1.71 | 18.04 | 0.49 |
Table 3.
Comparison of the accuracy of elevation measurements between the constructed DEM and level measurement (LM) obtained from Melbourne Water Corporation’s (MWC’s) contractor with the datum set at water level (Point 41).
Table 3.
Comparison of the accuracy of elevation measurements between the constructed DEM and level measurement (LM) obtained from Melbourne Water Corporation’s (MWC’s) contractor with the datum set at water level (Point 41).
| Elevation, cm | ||||
|---|---|---|---|---|
| Point | LM | DEM | Δh | |
| Segment 4 | 1 | 57.5 | 56.1 | −1.4 |
| 2 | 53.0 | 47.3 | −5.7 | |
| 3 | 51.5 | 52.8 | 1.3 | |
| 4 | 72.5 | 73.0 | 0.5 | |
| 5 | 52.5 | 64.2 | 11.7 | |
| Segment 5 | 6 | 12.5 | 8.4 | −4.1 |
| 7 | 9.5 | 0.7 | −8.8 | |
| 8 | 3.5 | 6.7 | 3.2 | |
| 9 | 1.5 | 11.8 | 10.3 | |
| 10 | 58.5 | 48.9 | −9.6 | |
| 11 | 52.0 | 50.8 | −1.2 | |
| 12 | 51.5 | 46.7 | −4.8 | |
| 13 | 63.0 | 59.7 | −3.3 | |
| 14 | 49.5 | 50.9 | 1.4 | |
| Segment 6 | 15 | 10.5 | 10.1 | −0.4 |
| 16 | 10.5 | 3.8 | −6.7 | |
| 17 | 3.5 | 2.6 | −0.9 | |
| 18 | 1.5 | 8.6 | 7.1 | |
| 19 | 53.5 | 53.5 | 0.0 | |
| 20 | 62.5 | 59.2 | −3.3 | |
| 21 | 51.5 | 48.9 | −2.6 | |
| 22 | 52.0 | 45.0 | −7.0 | |
| 23 | 47.5 | 49.5 | 2.0 | |
| Segment 7 | 24 | 0.5 | 2.0 | 1.5 |
| 25 | 1.5 | 3.4 | 1.9 | |
| 26 | −1.5 | 2.6 | 4.1 | |
| 27 | 48.5 | 49.0 | 0.5 | |
| 28 | 52.5 | 45.5 | −7.0 | |
| 29 | 54.5 | 49.6 | −4.9 | |
| 30 | 52.5 | 49.8 | −2.7 | |
| 31 | 50.0 | 51.2 | 1.2 | |
| Segment 8 | 32 | 6.5 | 6.2 | −0.3 |
| 33 | 0.0 | 0.0 | 0.0 | |
| 34 | −0.5 | 3.2 | 3.7 | |
| 35 | 46.5 | 49.7 | 3.2 | |
| 36 | 63.5 | 49.3 | −14.2 | |
| 37 | 54.5 | 50.1 | −4.4 | |
| 38 | 46.5 | 47.3 | 0.8 | |
| 39 | 53.5 | 49.1 | −4.4 | |
| 40 | 50.5 | 46.5 | −4.0 | |
| Segment 9 | 41 | 0.0 | 2.4 | 2.4 |
| 42 | 5.0 | 1.2 | −3.8 | |
| 43 | −2.5 | 3.1 | 5.6 | |
| 44 | 50.5 | 51.8 | 1.3 | |
| 45 | 56.5 | 51.7 | −4.8 | |
| 46 | 48.0 | 50.8 | 2.8 | |
| 47 | 47.5 | 50.1 | 2.6 | |
| 48 | 49.5 | 46.4 | −3.1 | |
| Segment 10 | 49 | 8.0 | −0.1 | −8.1 |
| 50 | 0.5 | 7.2 | 6.7 | |
| 51 | −1.5 | 1.7 | 3.2 | |
| 52 | 51.5 | 53.7 | 2.2 | |
| 53 | 52.0 | 46.4 | −5.6 | |
| 54 | 50.5 | 54.8 | 4.3 | |
| 55 | 47.5 | 40.9 | −6.6 | |
| 56 | 46.0 | 45.8 | −0.2 | |
| Segment 11 | 57 | 1.5 | −1.4 | −2.9 |
| 58 | 0.5 | 9.9 | 9.4 | |
| 59 | −3.5 | 3.2 | 6.7 | |
| 60 | 50.5 | 50.1 | −0.4 | |
| 61 | 48.5 | 43.1 | −5.4 | |
| 62 | 48.5 | 46.9 | −1.6 | |
| 63 | 48.5 | 49.4 | 0.9 | |
| 64 | 46.5 | 47.3 | 0.8 | |
© 2020 by the authors. Licensee MDPI, Basel, Switzerland. This article is an open access article distributed under the terms and conditions of the Creative Commons Attribution (CC BY) license (http://creativecommons.org/licenses/by/4.0/).
Share and Cite
MDPI and ACS Style
Wong, L.; Vien, B.S.; Ma, Y.; Kuen, T.; Courtney, F.; Kodikara, J.; Chiu, W.K. Remote Monitoring of Floating Covers Using UAV Photogrammetry. Remote Sens. 2020, 12, 1118. https://doi.org/10.3390/rs12071118
AMA Style
Wong L, Vien BS, Ma Y, Kuen T, Courtney F, Kodikara J, Chiu WK. Remote Monitoring of Floating Covers Using UAV Photogrammetry. Remote Sensing. 2020; 12(7):1118. https://doi.org/10.3390/rs12071118
Chicago/Turabian StyleWong, Leslie, Benjamin Steven Vien, Yue Ma, Thomas Kuen, Frank Courtney, Jayantha Kodikara, and Wing Kong Chiu. 2020. "Remote Monitoring of Floating Covers Using UAV Photogrammetry" Remote Sensing 12, no. 7: 1118. https://doi.org/10.3390/rs12071118
Note that from the first issue of 2016, this journal uses article numbers instead of page numbers. See further details here.