Article

Analysis of Spatial and Temporal Variability of the PAR/GHI Ratio and PAR Modeling Based on Two Satellite Estimates

by
Francisco Ferrera-Cobos
1,2,*,
Jose M. Vindel
1,
Rita X. Valenzuela
1 and
José A. González
3
1
Renewable Energy Division–CIEMAT, 28040 Madrid, Spain
2
E.T.S.I. Agronómica, Alimentaria y de Biosistemas, Universidad Politécnica de Madrid, 28040 Madrid, Spain
3
CRETUS Institute, Department of Chemical Engineering, University of Santiago de Compostela, 15782 Santiago de Compostela, Spain
*
Author to whom correspondence should be addressed.
Remote Sens. 2020, 12(8), 1262; https://doi.org/10.3390/rs12081262
Submission received: 2 March 2020 / Revised: 13 April 2020 / Accepted: 14 April 2020 / Published: 16 April 2020
(This article belongs to the Special Issue Satellite Images for Assessing Solar Radiation at Surface)

Abstract

:
The main objectives of this work are to address the analysis of the spatial and temporal variability of the ratio between photosynthetically active radiation (PAR) and global horizontal irradiance (GHI), as well as to develop PAR models. The analysis was carried out using data from three stations located in mainland Spain covering three climates: oceanic, standard Mediterranean, and continental Mediterranean. The results of this analysis showed a clear dependence between the PAR/GHI ratio and the location; the oceanic climate showed higher values of PAR/GHI compared with Mediterranean climates. Further, the temporal variability of PAR/GHI was conditioned by the variability of clearness index, so it was also higher in oceanic than in Mediterranean climates. On the other hand, Climate Monitoring Satellite Facility (CM-SAF) and Moderate-Resolution Imaging Spectroradiometer (MODIS) data were used to estimate PAR as a function of GHI over the whole territory. The validation with ground measurements showed better performance of the MODIS-estimates-derived model for the oceanic climate (root-mean-square error (RMSE) around 5%), while the model obtained from CM-SAF fitted better for Mediterranean climates (RMSEs around 2%).

1. Introduction

Photosynthetically active radiation (PAR) is the part of the solar spectrum included in the 400–700 nm range. PAR is a source of energy responsible for photosynthesis. Depending on the number of photons that plants can absorb, photosynthesis rate is affected, that is, specifically the quanta of energy necessary to create the products of photochemical reactions used in the process of CO2 assimilation [1].
The radiation intensity changes along the daytime and plants try to keep a balance between converting radiation energy, and protecting the photosynthetic system against photoinhibition or fixing possible plant damage.
At lower radiation intensities, the photosynthetic rate increases proportionally to the light intensity, until reaching a maximum value. At higher radiation conditions, the mechanism responsible for light collecting is supplied with an excessive number of photons, producing photoinhibition over light-dependent photosynthesis.
Measurement and characterization of PAR are interesting for different applications, such as gross primary production (GPP) [2], terrestrial net primary production (NPP) [3], and PAR use efficiency [4]. Due to its importance, and because of the lack of PAR surface direct measurements, its estimation from satellite measurements is usually required [5,6]; this estimation is usually based on empirical correlation models between satellite measurements and global horizontal radiation (GHI) surface direct measurements [7], as GHI is usually available at quite common radiometric stations. Then, modeling of PAR/GHI ratio is also required, as the portion of global irradiance that corresponds to the PAR spectrum.
However, different features affect PAR/GHI ratio. GHI is the total solar irradiance that reaches the Earth’s surface measured on a horizontal plane, as the sum of the diffuse and direct horizontal irradiance. Diffuse horizontal irradiance is the solar irradiance scattered and reflected by the atmosphere, while direct horizontal irradiance is the solar irradiance coming directly from the sun; therefore, atmospheric processes affecting both irradiances are different, and those processes effects depend on each irradiance spectrum and the atmospheric conditions. The PAR/GHI ratio represents the portion of global irradiance that corresponds to the PAR spectrum, but diffuse and direct global irradiance contribution to PAR depends on the atmospheric conditions in a region.
Typically, the PAR spectrum can be estimated from the Kato bands included in the corresponding part of the solar spectrum [8]. Indeed, the spectrum can be divided into 32 bands (Kato bands) [9] of different widths, in each of which the absorption coefficient of different gases is almost constant. The solar spectrum region corresponding to PAR includes the Kato bands interval from 7 to 16, as shown in Table 1.
As PAR and GHI spectrums are different, the PAR/GHI ratio is affected by various atmospheric parameters [10,11,12], with regional dependence: relative humidity, water vapor pressure, and, especially, the clearness index (kt) [13]. This index is defined as the quotient between the GHI that reaches the Earth’s surface and the extraterrestrial global irradiance at the top of the atmosphere; its range goes from 0 to 1, so that clear atmospheric conditions corresponded to values close to 1.
In all PAR/GHI ratio models, kt is a recurrent input variable, as it allows removing the deterministic component of the solar radiation due to astronomical influences and, also because of its significant cloudiness dependence, like the PAR/GHI ratio. Indeed, spectral attenuation due to clouds follows two different processes: scattering and absorption. Scattering attenuation is independent of the spectrum band (nonselective attenuation) and consequently the PAR/GHI ratio is not significantly affected by scattering in clouds. However, clouds’ water absorption is strong in the infrared range, which increases GHI attenuation but not that of PAR. Accordingly, typical PAR/GHI ratios should be higher in cloudy areas (with a lower kt) than in low cloudiness areas.
Therefore, both the PAR/GHI ratio and the index kt are clearly influenced by the location and along the time as, they are strongly associated with the cloudiness, which is linked to the meteorological conditions. In PAR/GHI ratio estimation, the climate of a region is relevant.
Apart from cloudiness, solar irradiation spectral attenuation also depends on the presence of aerosols [14]. Aerosol optical depth (τ) measures the extinction of solar irradiation due to aerosols, following Ångström’s Law [15],
τ(λ) = βλα
where λ is the wavelength, and β and α are adjustment parameters, which are dependent on the aerosol’s concentration and size. According to this equation, irradiance extinction due to aerosols is higher for shorter wavelengths. Further, the most affected solar spectrum bands by aerosols are ultraviolet and visible [16]. About PAR/GHI ratio, global irradiance is more affected by aerosols than PAR. Therefore, in regions with higher aerosols levels, GHI is reduced more than PAR, so PAR/GHI ratio increases.
Solar irradiance variability is well known [17], and also the PAR/GHI ratio shows spatial and temporal variability [18]. These PAR/GHI ratio variations can be easily observed in experimental time series at different locations during several time periods. However, a PAR/GHI constant ratio is frequently assumed, but modeling of PAR/GHI ratio variation is also developed.
PAR models are based on the recorded dataset at radiometric stations, several data analysis techniques such as statistical regressions and neural networks can be used. Indeed, in [19] multilinear models that apply different parameters, such as sky clearness, skylight brightness, solar elevation angle, and dew point temperature, were developed. In [20], two models were developed to estimate PAR in Beijing from global irradiance, including atmospheric parameters such as brightness, sky clearness, and path length. In [21], hourly and daily GHI datasets for PAR modeling at Botucatu, Brazil were applied. In [22], a model was developed for estimating PAR at Central China under different sky conditions, based on the PAR dependence on the cosine of solar zenith angle and clearness index. Additionally, similar PAR modeling was addressed in [23] at Lhassa, China, using a power law of the clearness index and the cosine of the solar zenith angle. In [24], ten non-linear models were developed for seven locations at the U.S.A. using variables such as clearness index, diffuse fraction, skylight brightness, dew point, temperature, and cosine of solar zenith angle. Both hourly and daily PAR models were developed in [25] for two land uses (pasture and forest), with GHI and clearness index as inputs. The clearness index was also used in [26] as input, where PAR modeling was addressed over China, dividing the Chinese territory into several physical geographic regions. Linear models were also developed in [27], from data collected in Athens, using the ratio between the global PAR and extraterrestrial global PAR and the ratio between diffuse and global PAR. A multilinear model using aerosol optical depth, solar zenith angle cosine, total ozone column, total precipitable water, and cloud index to estimate the PAR broadband radiation ratio was developed over Thailand in [28]. In [29], another multilinear model was proposed for different places in Japan from the clearness index, water vapor, and optical air mass. Another PAR modeling was addressed in [30] at Larnaca, Cyprus, comparing six models including different inputs, such as clearness index, global irradiance, azimuth angle, water vapor pressure, saturation water vapor pressure, and air mass.
As mentioned, other authors proposed using artificial neural networks (ANN) for PAR modeling. In [31], variables such as GHI, global extraterrestrial irradiance, sunshine fraction, air temperature, and relative humidity were input data to train several ANNs, producing PAR models over Athalassa, Cyprus. On the other hand, in [32], several combinations of input data such as global solar irradiance, solar azimuth cosine, and clearness index were used to develop PAR ANN models. In [33], PAR was estimated by ANNs based on different inputs: global solar irradiance, clearness index, solar azimuth angle, air relative humidity, sky brightness, air dew point temperature, sky clearness, and total precipitable water thickness.
However, these models are only based on surface measurements at each site, and their results are only satisfactory over the site location, because of the spatial variability of the PAR/GHI ratio. Typical applications of PAR datasets in primary production estimation should cover large areas. Collecting PAR and GHI long time series at several sites covering a region of interest is not feasible, because of the high cost, installation, and maintenance of so many sites required. Thus, the use of satellite data to develop PAR modeling is a common approach. Many works [34,35,36,37,38,39] have previously addressed PAR modeling in different regions (from Costa Rica, China, Thailand, Arabian Sea, Spain, and also Spain, respectively) from satellite estimates. [38,39] used a clustering analysis from the datasets provided by the Climate Monitoring Satellite Application Facility (CM-SAF). While in [38] only GHI was used as input, in [39] the PAR results were improved adding more variables such as global extraterrestrial irradiance, relative humidity and temperature. In this spatial modeling, linear regression provided very similar results than more complex techniques, such as neural networks. Moreover, a site-adaptation technique (using both surface and satellite data) was used to achieve better results at the oceanic stations. Additionally, the models developed in [39] with Spain datasets were compared at several stations in Spain with other models from the bibliography, developed for other locations: the results from Spain datasets model were clearly better, as expected.
The use of different surface datasets, including different PAR-related parameters, was deeply considered, but PAR spatial modeling is also dependent on the satellite data accuracy. Therefore in this work, PAR/GHI models obtained from two different satellite-derived datasets (Climate Monitoring Satellite Application Facility (CM-SAF) and Moderate-Resolution Imaging Spectroradiometer (MODIS)) were applied to develop and apply PAR/GHI models, in order to estimate the satellite data accuracy impact in PAR estimation performance. It is assumed that PAR/GHI satellite data estimations can be applied to surface measurements, in order to spatially extend surface PAR estimations. With this assumption, GHI surface measurements can be used to obtain PAR, providing more accurate results. Following this approach, in [38,39] only CM-SAF data were applied, while in this work an alternative satellite dataset (MODIS) was applied, in order to compare both results.
The possible use of MODIS datasets is particularly interesting due to the different schemes applied for obtaining MODIS irradiance products [40]. Indeed, MODIS GHI and PAR data are generated from a look-up table (LUT)-based shortwave irradiance retrieval algorithm. For this LUT, atmospheric radiative properties are estimated by directly taking the satellite top-of-atmosphere (TOA) signature, so the LUT approach is performed at the native resolution of the satellite data, and fewer data gaps are produced. However, this scheme does not take advantage of the multispectral information of the MODIS sensor, so when the difference between the surface reflectance and TOA reflectance is small, MODIS GHI and PAR data accuracy can be compromised.
In this work, PAR models’ results are presented and compared over a geographical territory (mainland Spain) with different climates [41,42,43,44]. According to Figure 1, four main climates (oceanic, continental Mediterranean, standard Mediterranean and mountain climates) can be distinguished in mainland Spain, though the first three ones cover most of the territory. Thus, PAR radiometric station measurements located at those three climatic zones are analyzed. Geographical locations and main characteristics of these climatic zones follow:
  • The oceanic climate is mainly present in the northern and northwestern parts of mainland Spain. This climate is characterized by mild temperatures and the westerlies (prevailing winds from the west in middle latitudes) that bring frequent clouds and precipitation, with precipitation events quite uniformly distributed throughout the year.
  • Mediterranean climates are common in the rest of mainland Spain, including eastern, southern and central areas of the Iberian Peninsula. However, there are no strict boundaries between oceanic and Mediterranean climates, while the transition between them is smooth: the climate gradually shifts as moving toward southern and southeastern Spain. Mediterranean climates have hot summers, and precipitation events are rare, usually as storms. In this climate, two subtypes can be distinguished:
    • Standard Mediterranean climate. This subtype is present in southern and eastern mainland Spain, and it is characterized by dry and hot summers and mild winters due to sea influence.
    • Continental Mediterranean climate. This subtype is typical in central areas of the Iberian Peninsula. In this subtype, the influence of the sea is weaker and the winters are colder. Thus, seasonal variations are more pronounced than in the Standard Mediterranean climate.
As a summary, the main objectives of this work follow:
  • Analyzing the spatial and temporal variability of the PAR/GHI ratio, considering the main different climatic regions in mainland Spain.
  • Comparing PAR/GHI estimates provided by two satellite-derived datasets to determine their best variability.
  • Developing PAR estimation models, using GHI as input, and based on each satellite-derived datasets.
Therefore, the influence of different climate types and different satellite-derived datasets as input data in PAR estimation over a wide territory is investigated.

2. Data

The datasets used in this work were daily measurements of PAR and GHI measured at three locations spread across the Iberian Peninsula (Table 2 and Table 3):
1. Santiago de Compostela (Santiago-EOAS) (42.88°N, 8.56°W, altitude 255 m a.s.l.) from January 1, 2016 until December 31, 2017. Located in the northwest of the Peninsula, it has a clear oceanic climate, characterized by continuous cloudiness and precipitation throughout the year and, therefore, by low solar activity regularly. In this location, the mean annual temperature is 13.7 °C and the annual precipitation is 1896 mm [45].
2. Centre for the Development of Renewable Energies (CEDER-CIEMAT) (41.60°N, 2.51°W, altitude 1095 m a.s.l.) from January 26, 2016 to August 20, 2017. Situated in the peninsular center and having a continental Mediterranean climate, it presents greater variability in terms of cloudiness throughout the year. The mean annual temperature at this site is 10.4 °C and the annual precipitation is 550 mm [45].
3. Plataforma Solar de Almería (PSA-CIEMAT) (37.10°N, 2.36°W, altitude 500 m a.s.l.), from February 24, 2016 to June 22, 2017. Located in the southeast of Spain, its climate is the typical Mediterranean, with warm summers. Additionally, the specific location of this station presents the particular characteristic of being over a desert zone, where the presence of aerosols from the sand is very significant. Here, the mean annual temperature is 17.5 °C and the annual precipitation is 227 mm [45].
At the first two stations, the PAR was measured with an ML-020P (EKO Instruments) and the GHI with a pyranometer CM21 (Kipp and Zonen). At the third station, the PAR was measured with a GUV-2511 multi-band radiometer (Biospherical Instruments Inc.) and the GHI data were taken from the measurements made by MeteoGalicia using a pyrradiometer Type 8111 (PH.SCHENK). The three sites were chosen because they are located in zones with different climatic characteristics [42].
Satellite data were provided by two different sources. First, mean daily data were collected from CM-SAF) [46], which is part of the EUMETSAT Satellite Application Facility network. CM-SAF downloaded data corresponded to the years from 1999 to 2011. As CM-SAF does not provide PAR data directly, the Spectral Resolved Irradiance (SRI) product was used in this work, which contains the Kato bands [9]. From these bands, the GHI was also obtained. MODIS products provided GHI and PAR data as well, in particular data from January 1, 2018, to May 31, 2019, from MCD18A1-MODIS/Terra+Aqua Surface Radiation Daily/3-Hour L3 Global 5 km SIN Grid [47] and MCD18A2-MODIS/Terra+Aqua Photosynthetically Active Radiation Daily/3-Hour L3 Global 5 km SIN Grid [48].
The data downloaded from both CM-SAF and MODIS covered a grid from 35.3°N to 44.0°N in latitude and from 9.5°W to 3.5°E in longitude. The grid from CM-SAF had a resolution of 0.1° × 0.1° (11.1 km × 11.1 km), while the grid of MODIS had a resolution of 5 km (0.045°). These grids corresponded to the location of the Iberian Peninsula where mainland Spain is located.

3. Methodology

The study was carried out in the following steps:
1. Obtaining the clearness index: The clearness index (kt) was obtained at the three study stations from ground measurements. For that, GHI data measured at these stations were converted into a normalized index by dividing GHI by the extraterrestrial radiation, that is, the radiation at the top of the atmosphere. Thus,
k t = G H I G 0
where G0 is the extraterrestrial radiation, which is obtained from
G 0 = G 0 n c o s θ z
where G 0 n is the normal extra-terrestrial radiation and θ z is the zenith angle. G 0 n was obtained, at the same time, from the solar constant and the Julian day, by the following expression:
G 0 n = G s c ( 1 + 0.033 c o s 360   n 365 )
where G s c is the solar constant and n is the Julian day.
2. Analyzing the spatial variability: To analyze the spatial variability, the PAR/GHI ratio was plotted vs. kt at the three study stations from ground measurements and both satellite-derived datasets (CM-SAF and MODIS).
3. Analyzing the temporal variability: To study the temporal variability, the daily evolution of PAR/GHI and kt from ground measurements at the three stations was plotted. The evolution of the monthly means of these variables was also plotted, using ground measurements and satellite estimates. In this section is assumed that for both variables each month of the year constitutes a congruence class of data (modular arithmetic mod12).
4. Collecting satellite estimates: On the other hand, satellite data from two different sources (CM-SAF and MODIS) were collected for the study area (mainland Spain), which included the three analyzed stations. In the case of CM-SAF, it does not provide PAR data directly, but it does provide the SRI product, which contains the irradiance corresponding to each Kato band. Thus, to obtain PAR estimates, we added the irradiance of the bands corresponding to the spectral region of 400–700 nm (from band 7 to 16, according to Table 1). Likewise, though CM-SAF directly provides GHI estimates, the same methodology of adding bands was followed to obtain both products in the same way. This process was not necessary in the case of MODIS data, as it directly provides PAR and GHI estimates.
5. Obtaining the PAR models from CM-SAF and MODIS estimates: PAR and GHI estimates from CM-SAF and MODIS were used to develop linear models that provide PAR estimates from GHI for each point of the study area and each month as well. Indeed, in [39], linear regressions provided very similar results to the use of more complex techniques such as neural networks, consuming less time in computation than other possible PAR models. So, the models used have the following expression:
PAR = α GHI + β
Thus, the coefficients α and β are the regression coefficients obtained from PAR and GHI data collected in each grid point for each month, so these coefficients provide the particular expression of the model which must be used to obtain PAR according to the site and month.
In addition, the determination coefficients for each regression were also calculated to show the correlation degree between PAR and GHI according to the linear regression, following these expressions:
R 2 = σ P A R M o d e l e d   P A R M e a s u r e d 2 σ P A R M o d e l e d 2   σ P A R M e a s u r e d 2
where σ P A R M o d e l e d   P A R M e a s u r e d is the covariance of (PARModeled, PARMeasured), σ P A R M o d e l e d is the variance of PARModeled, σ P A R M e a s u r e d is the variance of PARMeasured.
6. Validation: PAR estimated from CM-SAF- and MODIS-derived models were plotted vs. PAR measured at the three study stations. The accuracy obtained for the models in the different places was assessed by the following statistics: the slope of the regression line, the intercept, the determination coefficient (R2), the mean bias error (MBE), the root-mean-square error (RMSE), and the standard error of the regression (SE). Errors are given as
M B E = 1 n i = 1 n ( P A R M o d e l e d P A R M e a s u r e d )
R M S E = 1 n i = 1 n ( P A R M o d e l e d P A R M e a s u r e d ) 2
S E = 1 n 1 i = 1 n ( P A R M o d e l e d P A R M e a s u r e d ) 2
Finally, the statistics obtained at the three stations were compared with the following models proposed in [43].
  • Considering only GHI as input.
  • Adding more variables, such as GHI, global extraterrestrial irradiance, relative humidity, and temperature.
  • Applying site-adaptation technique (only used for Santiago-EOAS station).

4. Results and Discussion

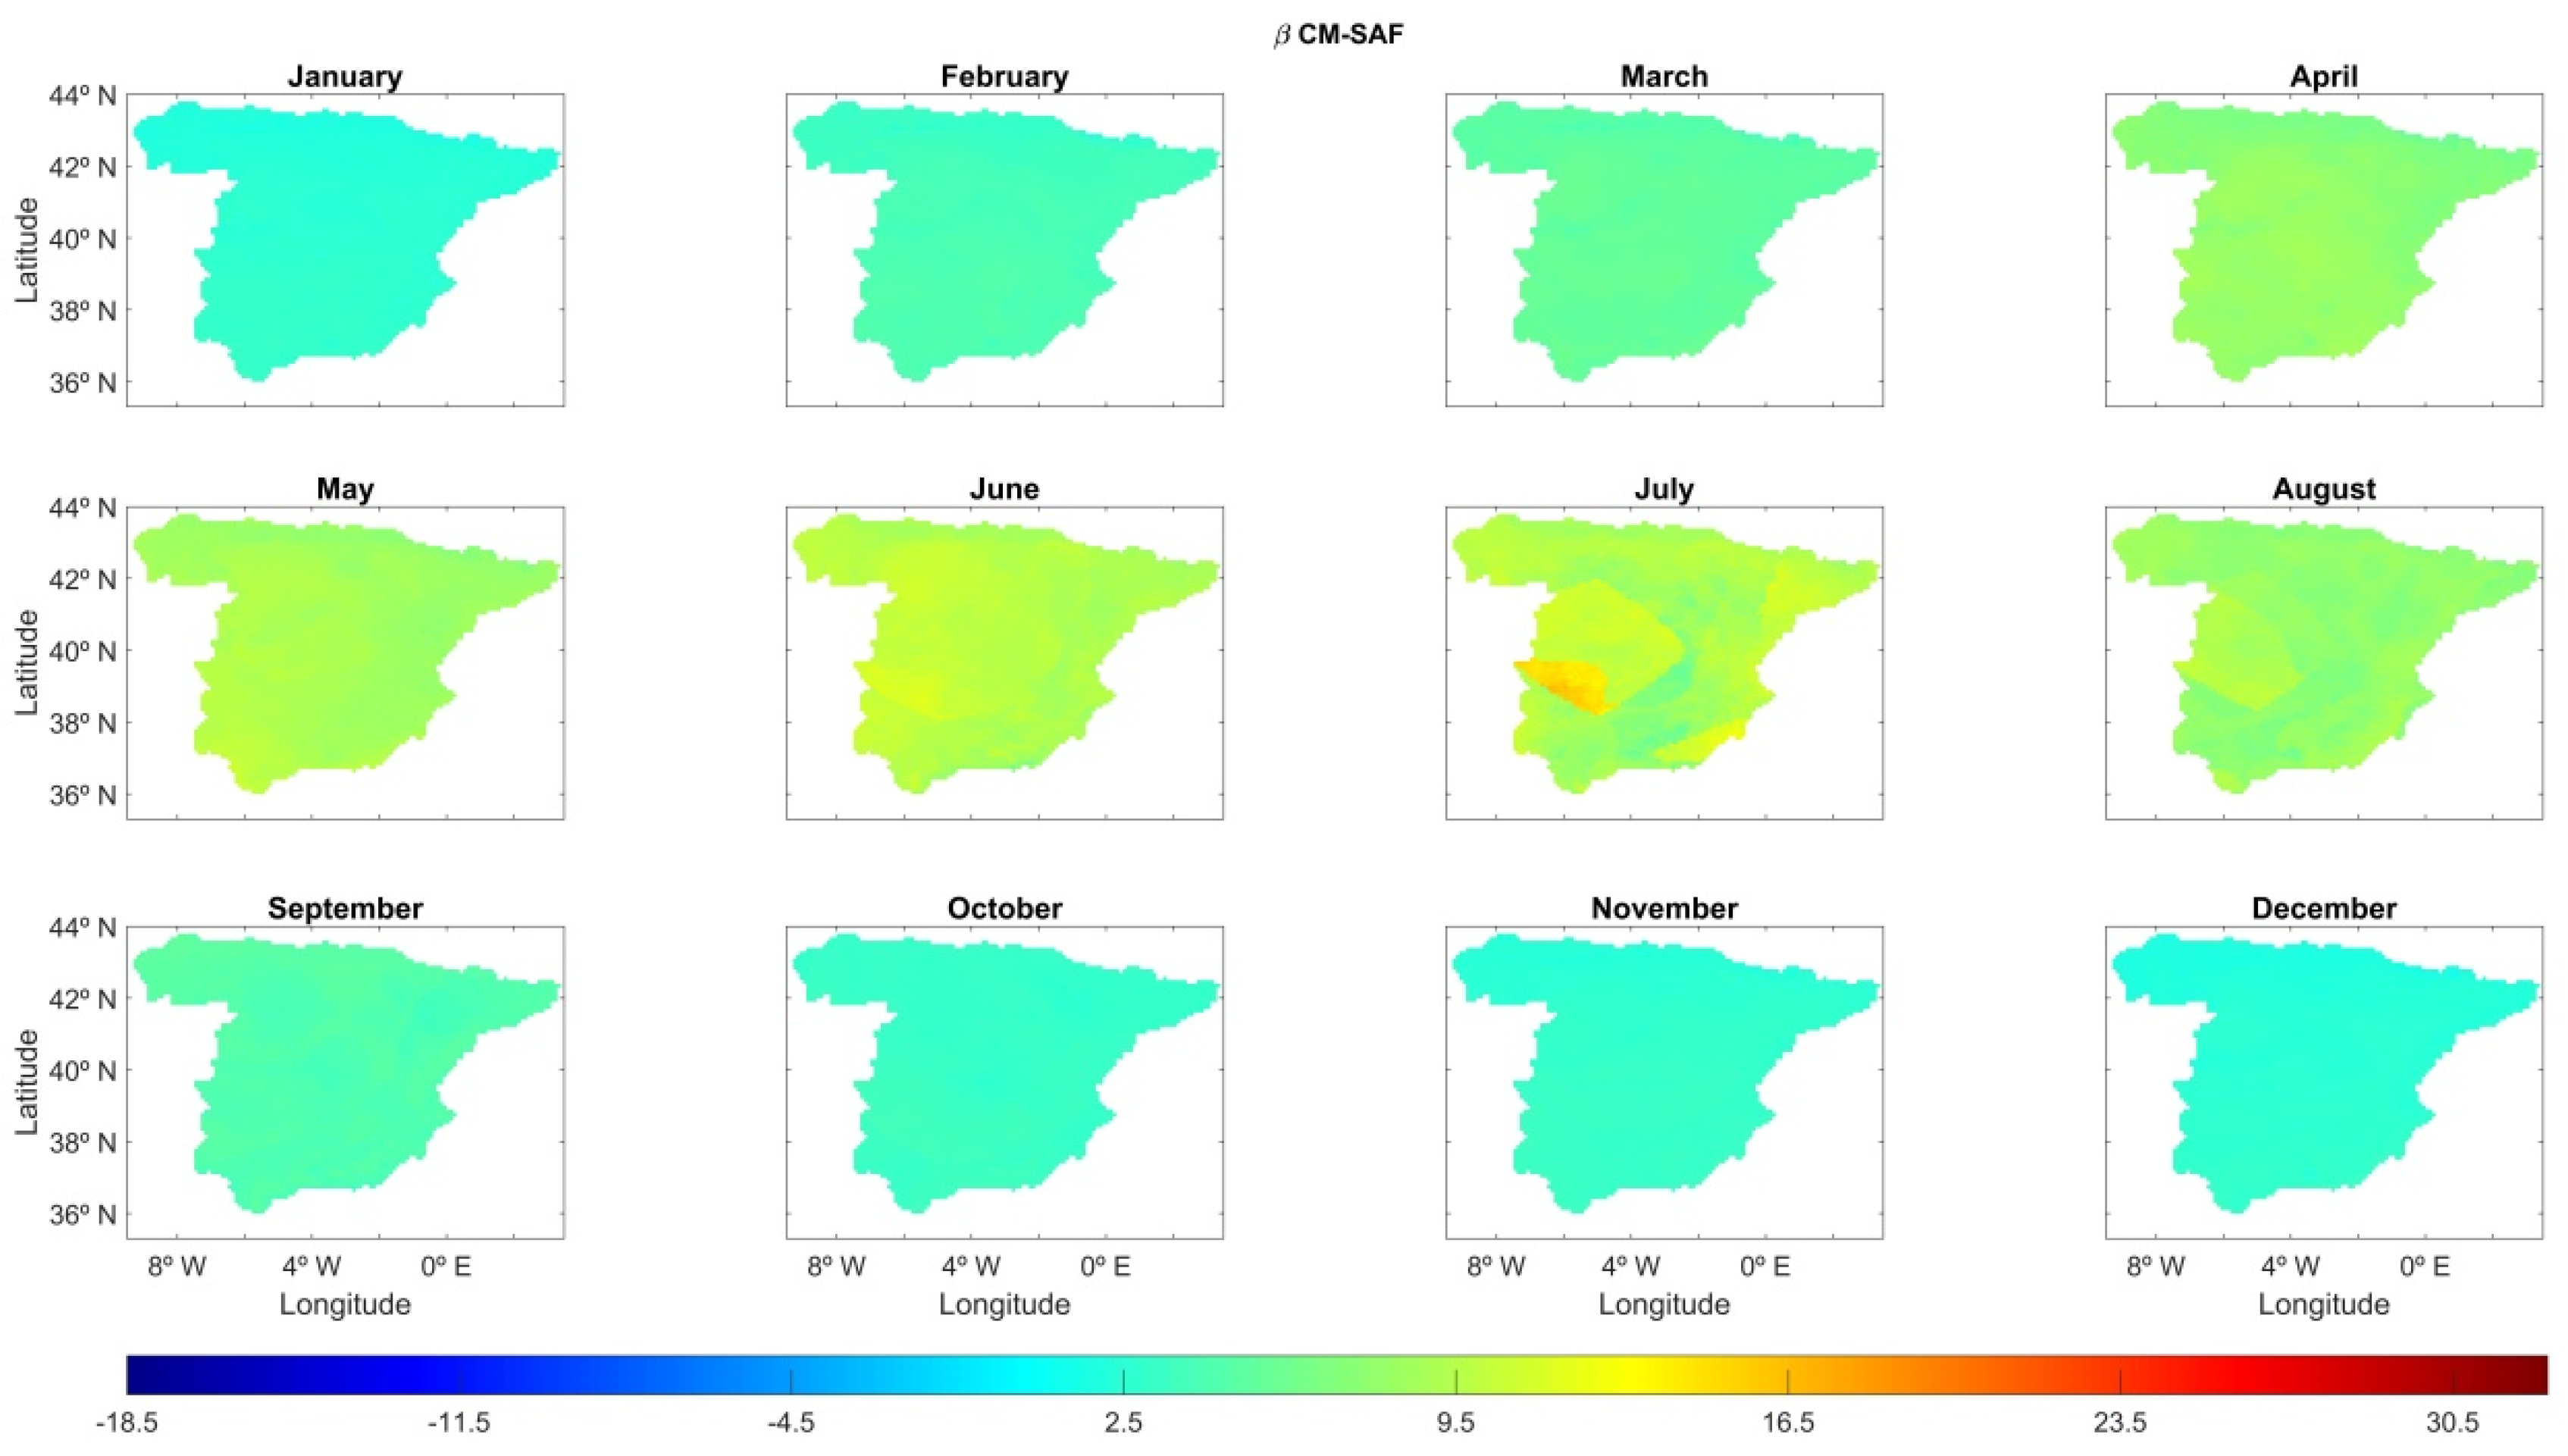
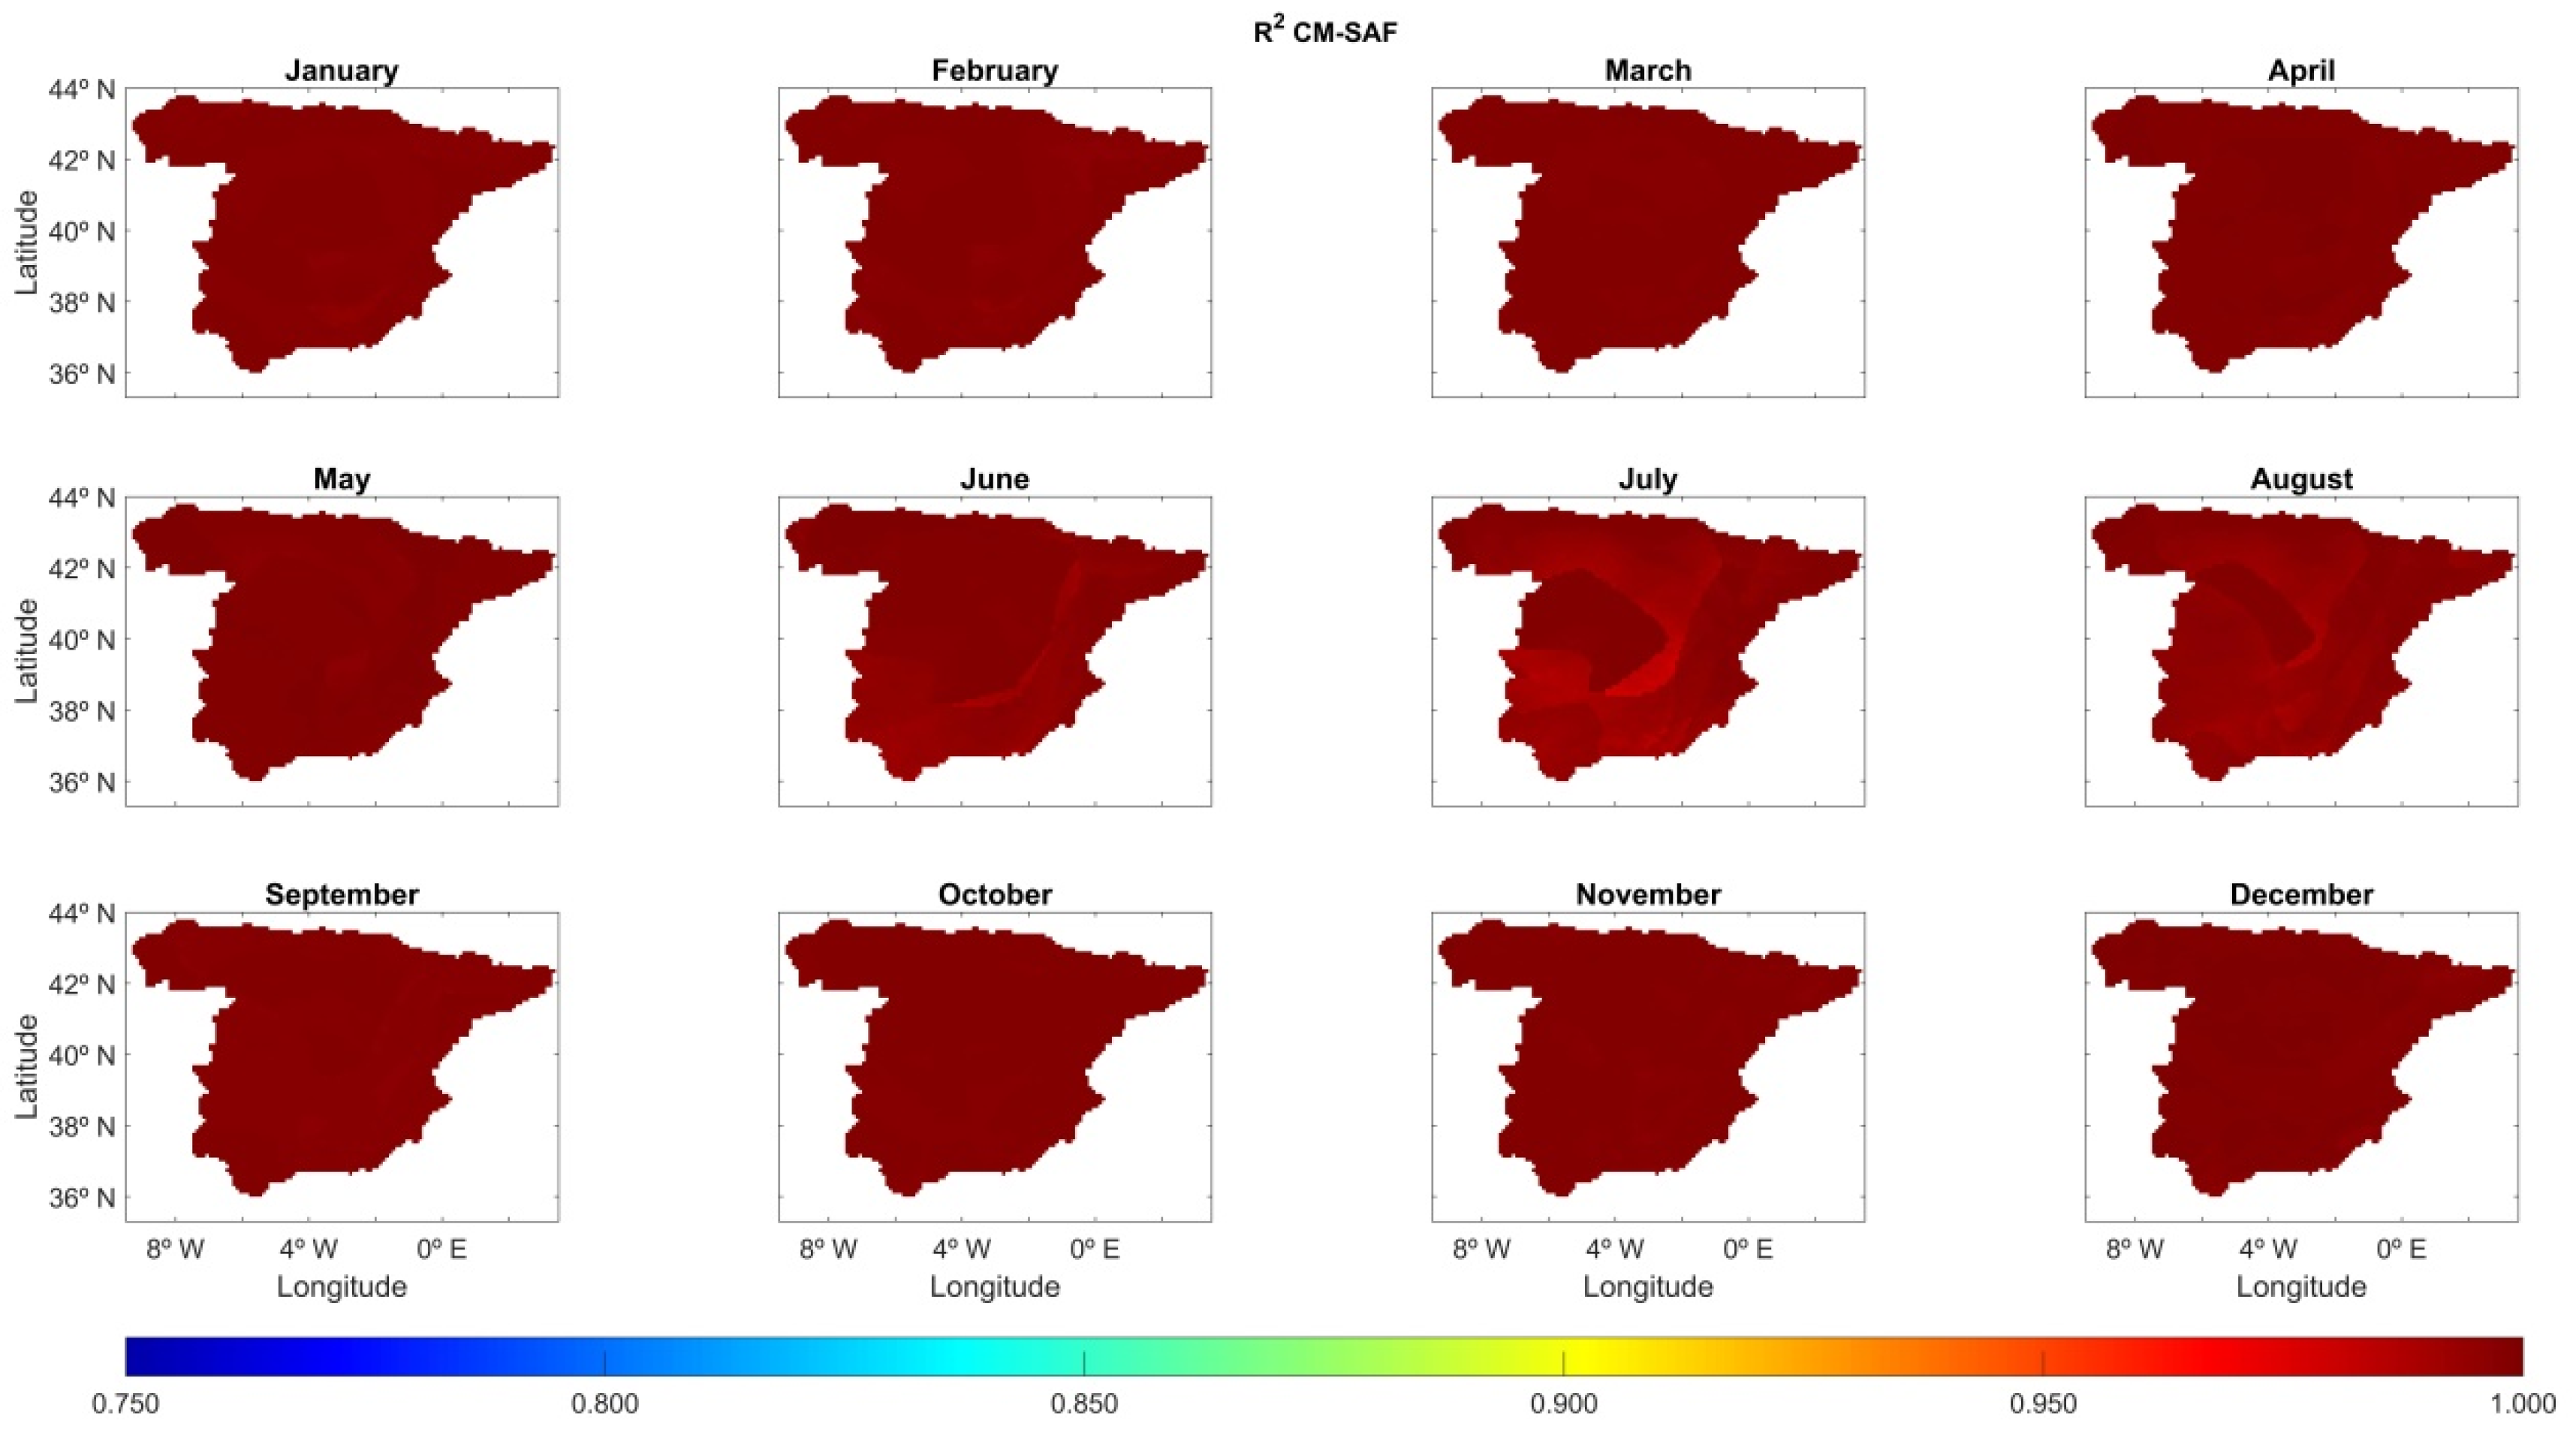
4.1. Spatial Variability from Ground Measurements

Figure 2 shows the relationship between PAR/GHI and kt [49], from both ground measurements and satellite estimates. Focusing on the ground measurements, at the three stations considered, there was a reduction in the relationship of PAR/GHI when kt increased. This decrease was very mild, especially for a higher clearness index, fitting the PAR/GHI ratio from ground measurements to a logarithmic function of kt as proposed by [10,24,26,29]. The fitting expressions obtained for the different stations are included in Figure 2. According to these expressions, the logarithmic term was higher at Santiago-EOAS and, thus, the rate of decrease of the PAR/GHI ratio was higher for this station (the slope of Santiago-EOAS: −0.042; the slope of PSA-CIEMAT: −0.035; the slope of CEDER-CIEMAT: −0.017). Furthermore, the Mediterranean stations (PSA-CIEMAT and CEDER-CIEMAT) had less dispersion than the oceanic one; that is, the PAR/GHI ratio always presented more similar values for a given value of the clearness index. The means and standard deviations as error bars in bins of 0.1 kt are also plotted in the figure to illustrate better the spread of the data. On the other hand, the mean values of PAR/GHI were generally higher at Santiago-EOAS than in the other two stations, especially for lower kt values. Further, high clearness indexes were more abundant in these Mediterranean stations. In addition, the PAR/GHI ratio was slightly lower in the station corresponding to the continental Mediterranean climate (CEDER-CIEMAT) than in that corresponding to the typical Mediterranean climate (PSA-CIEMAT).
These results can be explained according to the climatic characteristics of the zones in which the different stations are located. PSA-CIEMAT and CEDER-CIEMAT presented similar behavior as both are located in zones with a Mediterranean climate (although of different varieties). In the Mediterranean climate, which is less cloudy than the oceanic, the cloudiness indexes were higher, justifying as well the lower values of the PAR/GHI ratio, according to the greater capacity of absorption of water vapor in the infrared spectral area.
On the other hand, the smaller dispersion in this relation, observed in the Mediterranean stations, can be explained by the greater stability in terms of cloudiness, which is characteristic of the Mediterranean climate. This would explain that high levels of clearness were associated with cloudiness situations and lower PAR/GHI ratios. On the contrary, the greater instability of the oceanic climate is advantageous for greater variability of the PAR/GHI ratio. Indeed, the continuous entry of fronts loaded with cloudiness and precipitation generates greater variability of atmospheric conditions and PAR/GHI values, which can give rise to similar situations of clearness. All this would explain the greater dispersion observed at the Santiago-EOAS station.

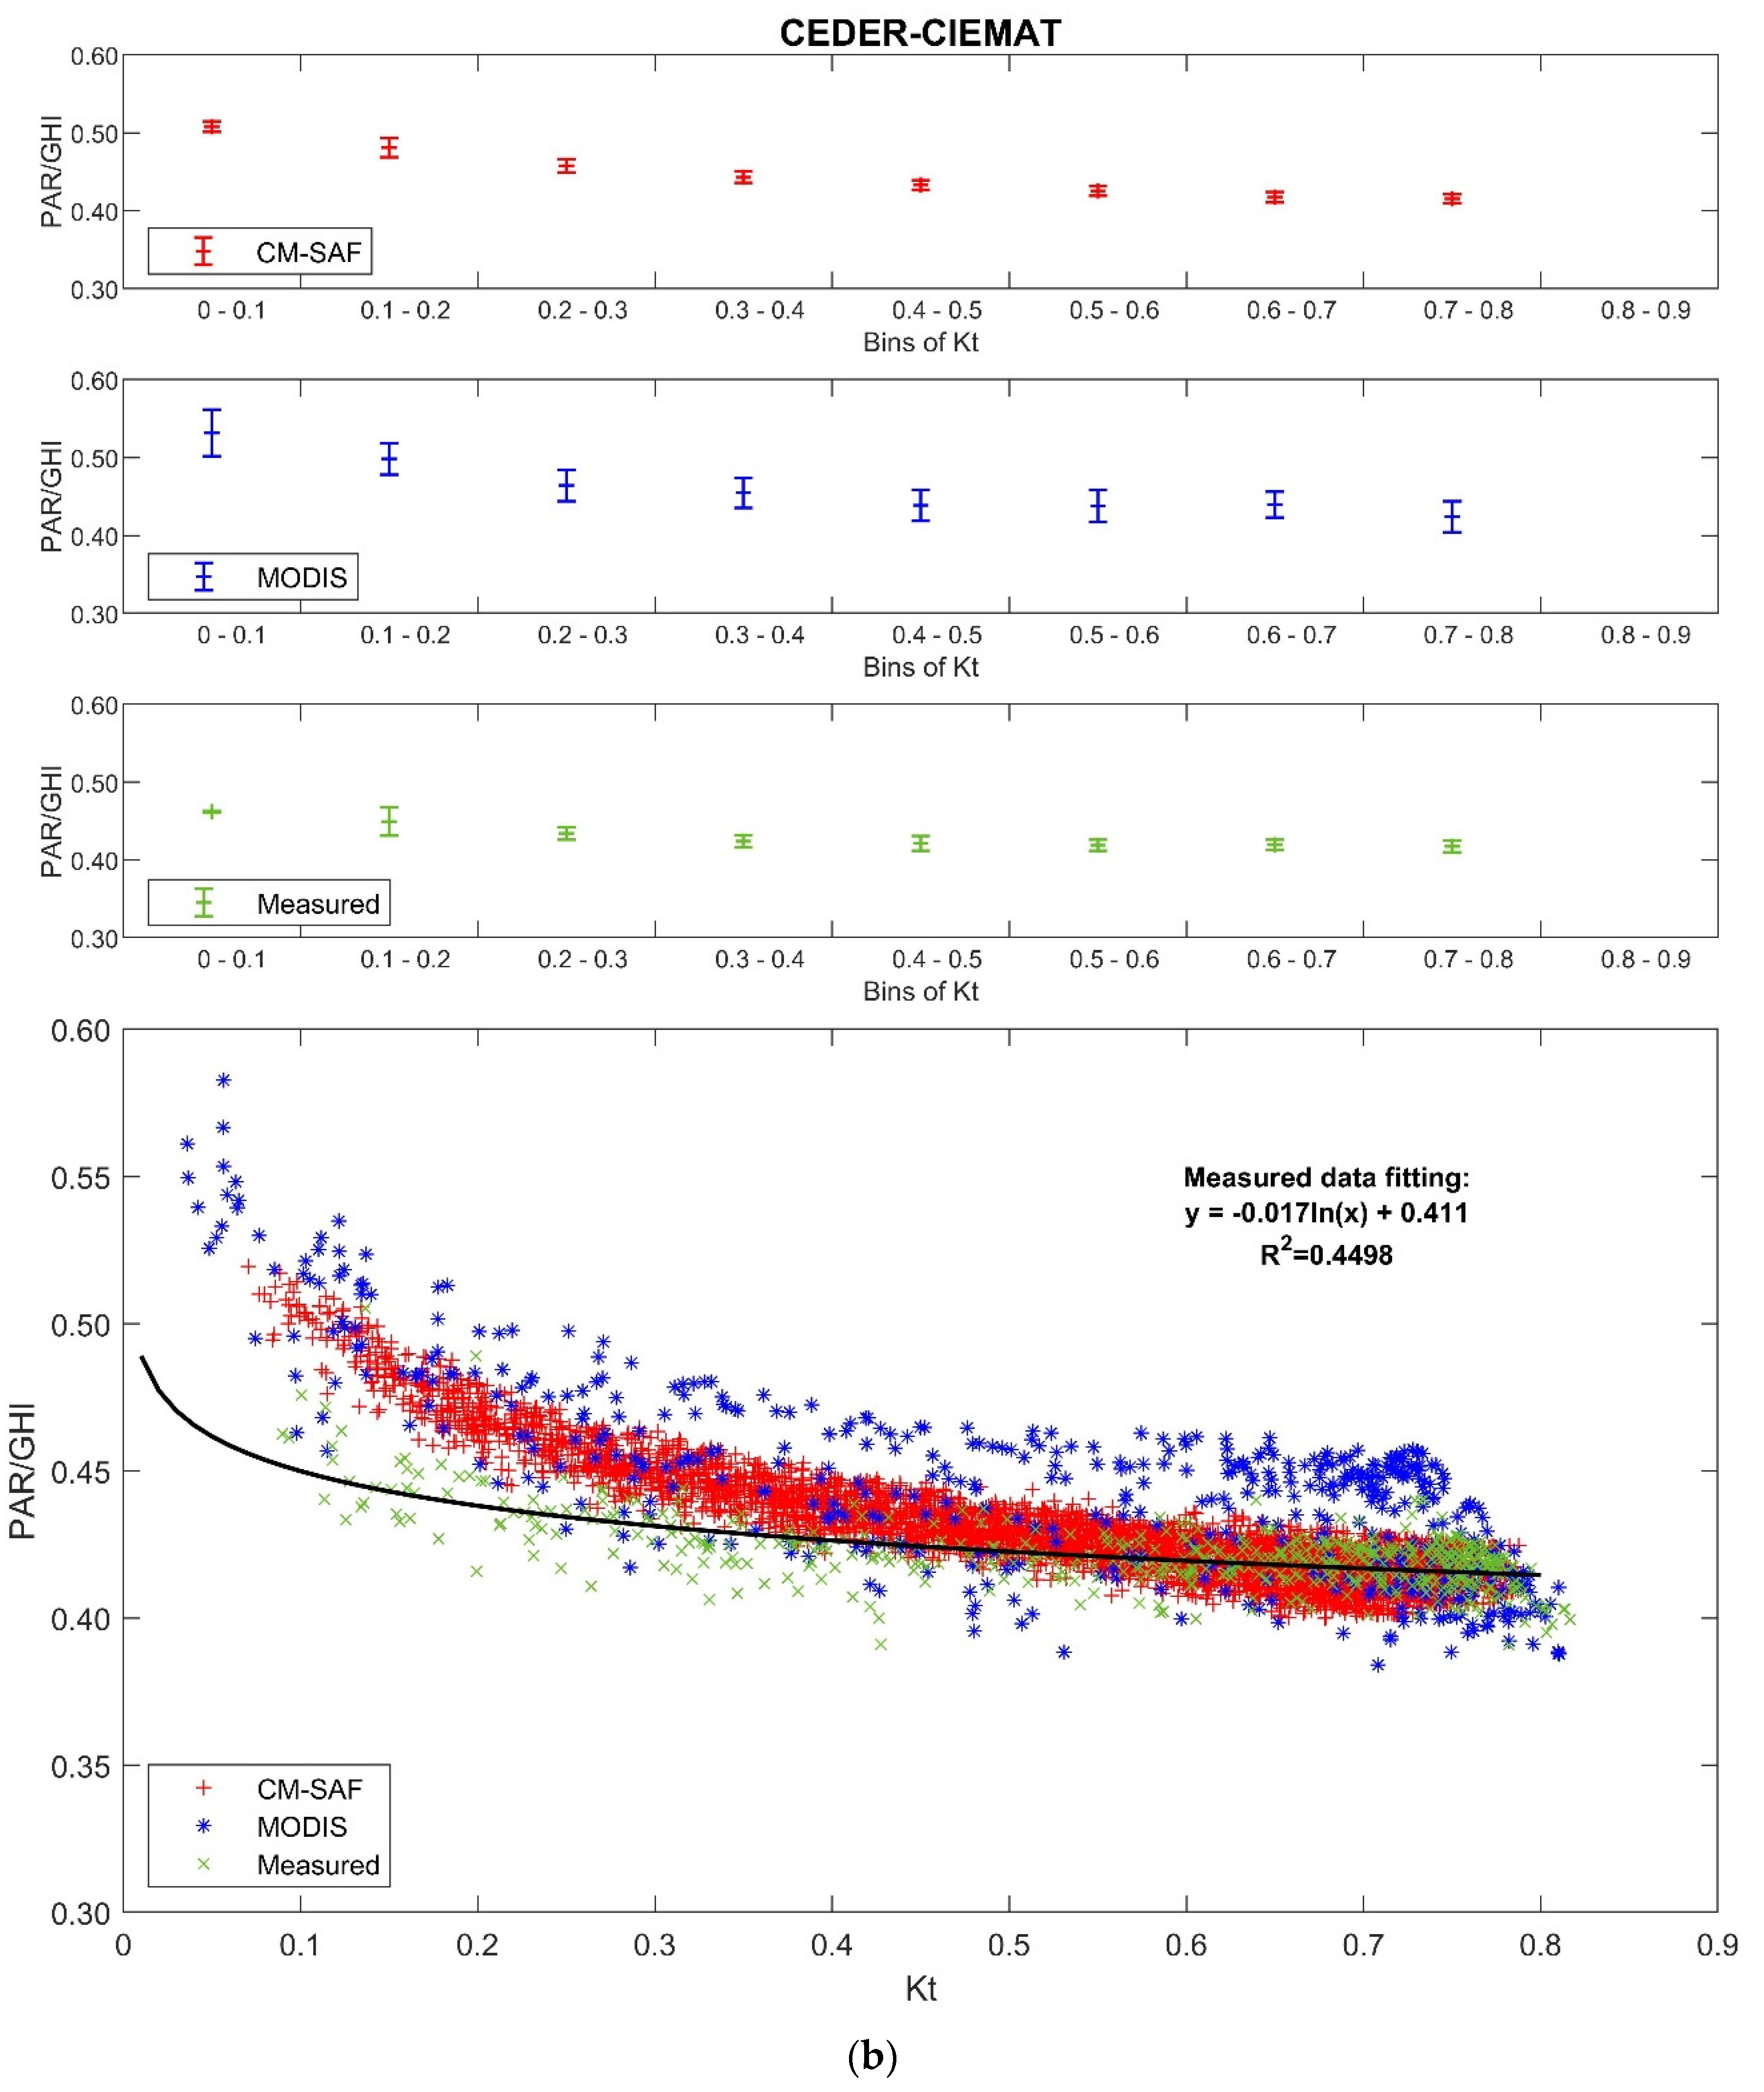
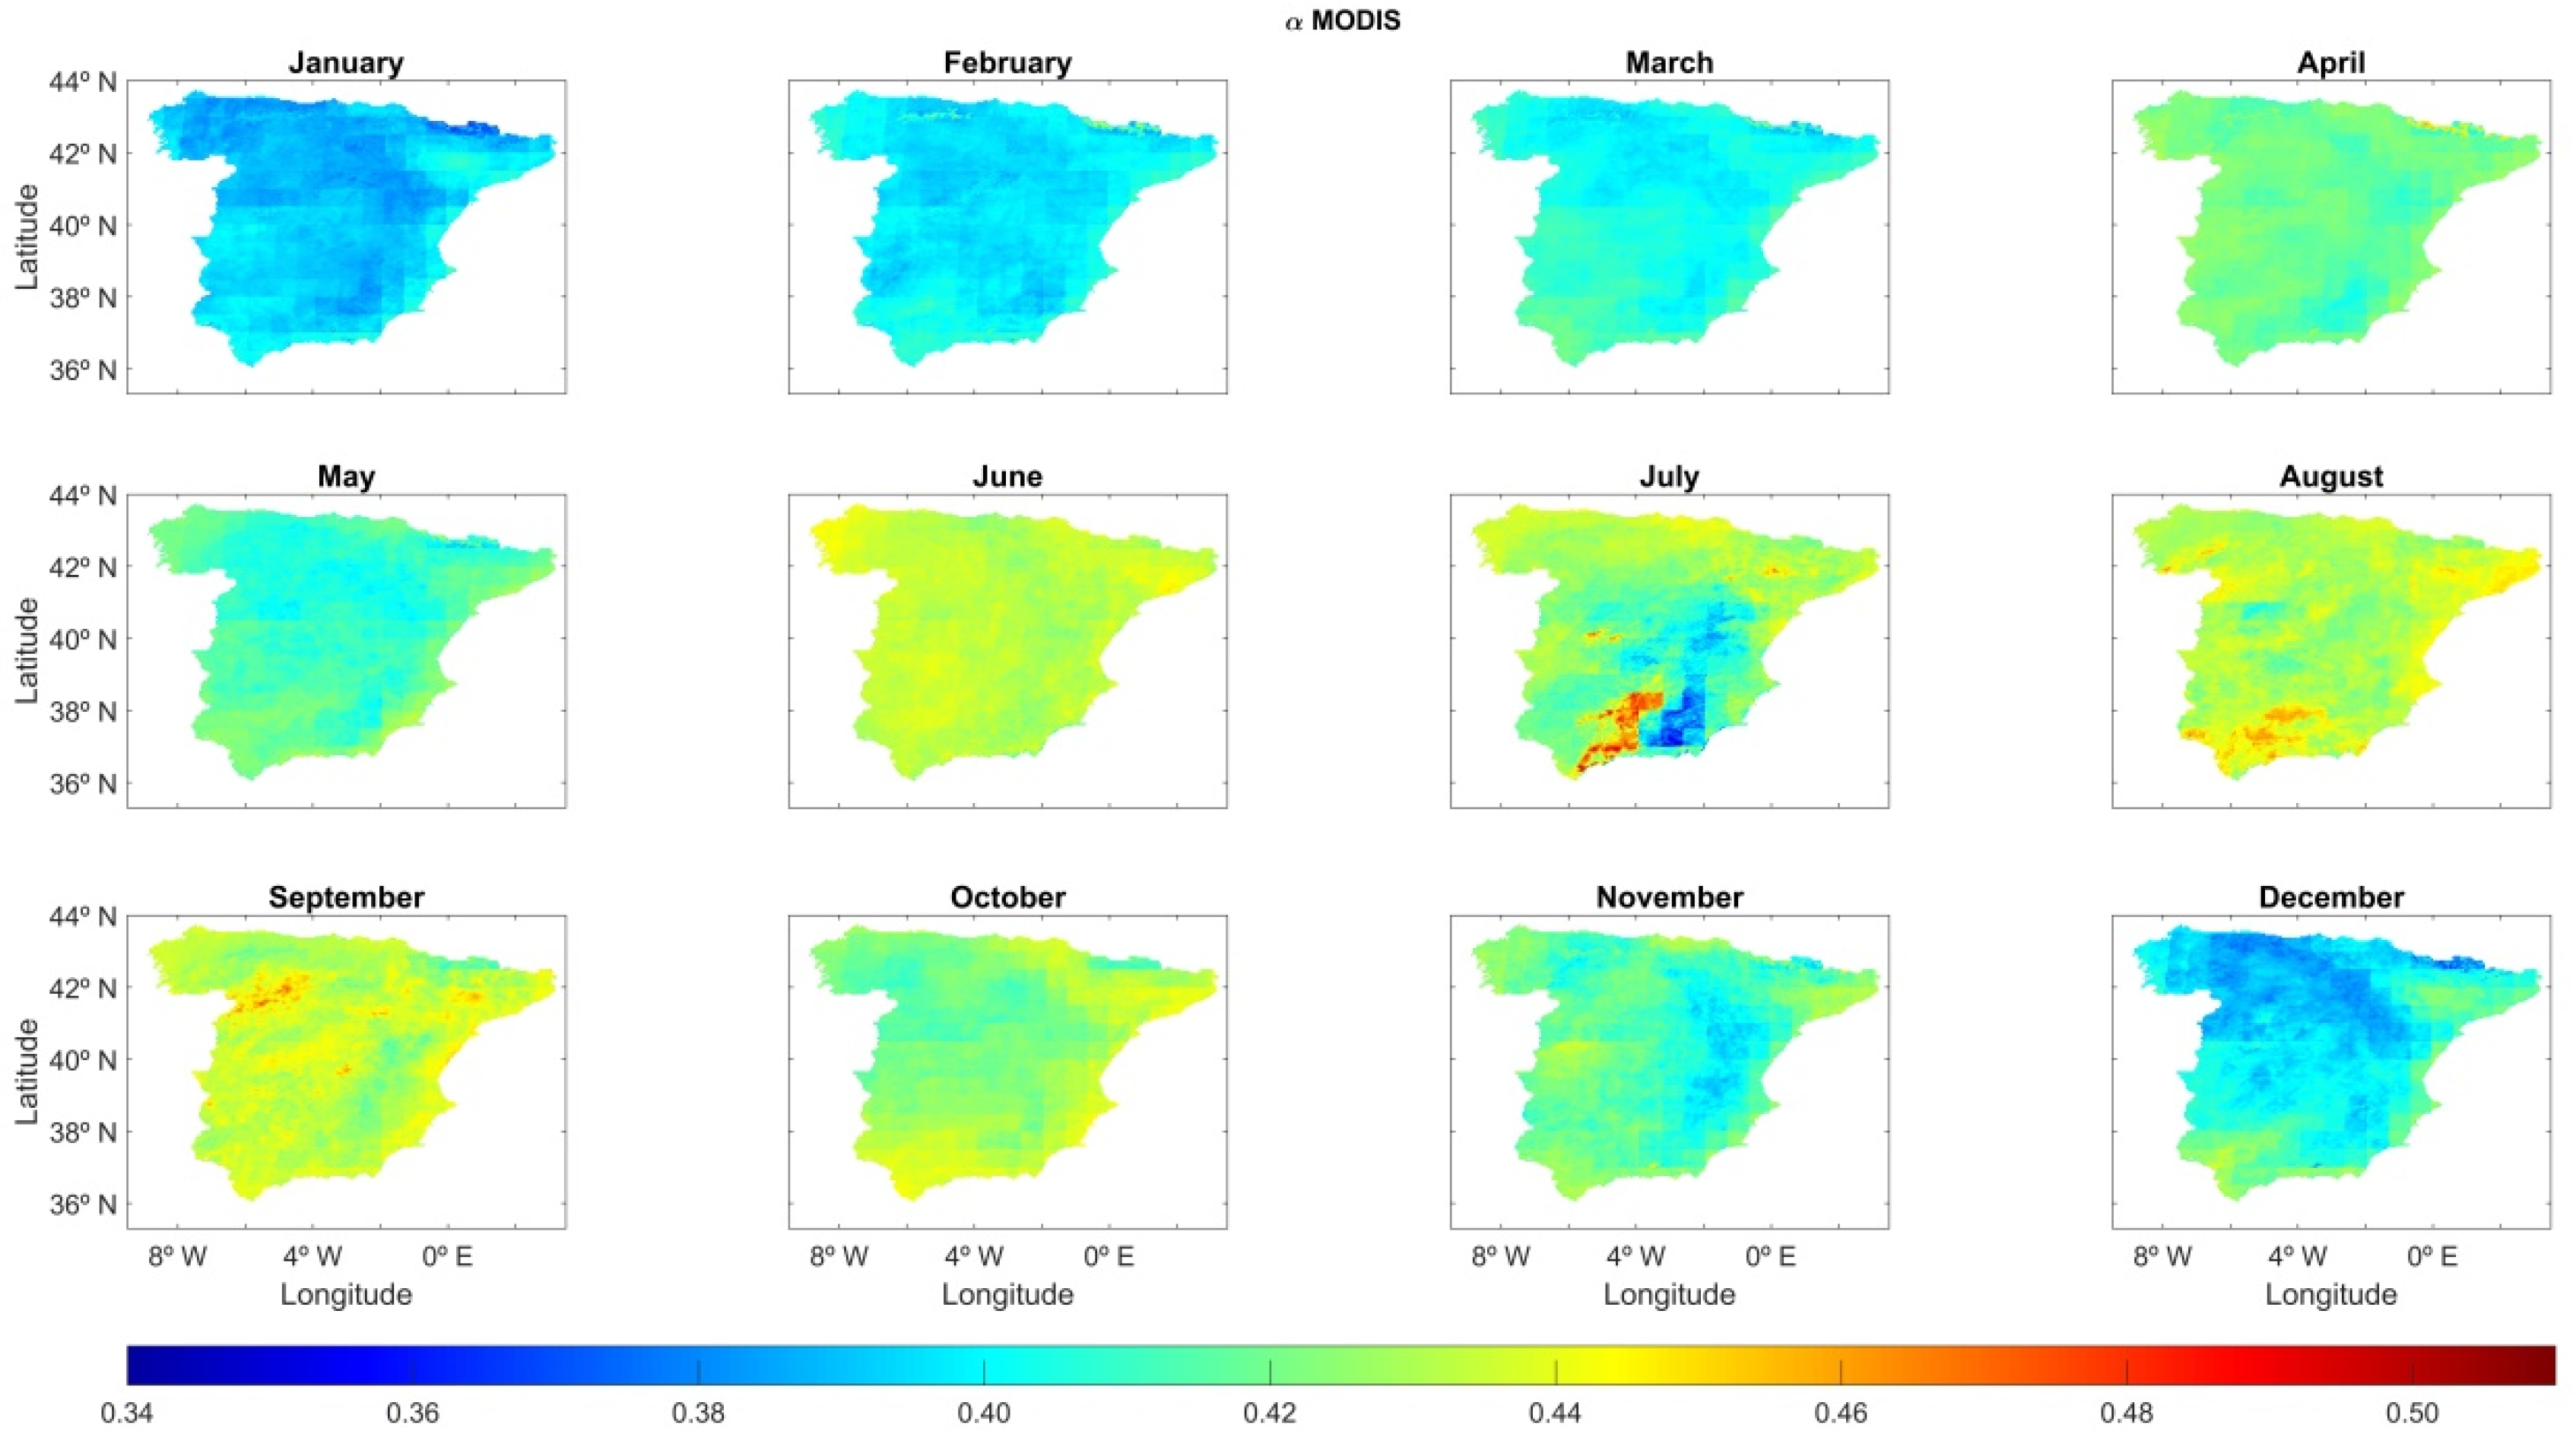
4.2. Temporal Variability

Due to the known relation between the PAR/GHI ratio and kt, the temporal variability of this ratio is also influenced by the temporal variability (by the minute, hour, day, etc.) of kt. In Figure 3 the temporal evolution of measured daily data of kt and PAR/GHI is plotted for the three study stations. The graphs show the high temporal variability of kt at all stations, while the PAR/GHI ratio remained more stable at the Mediterranean stations.
In Table 4 the mean values and the coefficients of variation (CV) for PAR/GHI and kt series were shown. CV is defined as the quotient between the standard deviation and the mean value; thus, it is a normalized index of the degree of variability. According to Table 4, the differences between the Santiago-EOAS PAR/GHI series and the other two series are very clear. Indeed, regarding PAR/GHI mean values, the Santiago-EOAS value was higher than those corresponding to the other two series. Similarly, the highest CV of the PAR/GHI series was also obtained at Santiago-EOAS station.
In the case of kt, the CV is very similar in the three series, though the mean value is clearly higher in Santiago-EOAS and lower in PSA-CIEMAT.
Focusing on the two Mediterranean stations, PAR/GHI mean values were slightly higher (43.44 vs. 42.17) at the station of the standard Mediterranean climate (PSA-CIEMAT) than at the station of the continental Mediterranean climate (CEDER-CIEMAT). This difference can be explained by the greater quantity of aerosols, from the desert and the sea, which is characteristic of the zone where the PSA-CIEMAT station is situated, as it can be seen in [50]. According to this work, the aerosol optical depth (at 550 nm) derived from the MODIS satellite for the 2003–2012 period was clearly higher in the zone of PSA-CIEMAT than in the other two study zones. Thus, this higher level of aerosols at the PSA-CIEMAT station would increase, as we have explained, the PAR/GHI ratio at this location compared with the other Mediterranean station (CEDER-CIEMAT). This higher value of PAR/GHI at the PSA-CIEMAT station located in the Mediterranean coastal zone was observed even though the lower cloudiness in this zone produced clearness indexes slightly higher than those of the continental Mediterranean climate (0.64 vs. 0.58). Indeed, since clear atmospheric conditions corresponding to kt values close to 1, the lower presence of clouds at PSA-CIEMAT entailed higher kt at this station than at CEDER-CIEMAT. Moreover, the higher variability of kt at the CEDER-CIEMAT station (0.33) compared with the PSA-CIEMAT station (0.24) could be counteracted by the influence of aerosols at the PSA-CIEMAT station, bringing less variability of PAR/GHI at CEDER-CIEMAT (0.03 vs. 0.04).
The relationship between the PAR/GHI ratio and kt, again with both ground measurements and satellite estimates, is also shown by the annual evolution of the monthly means (Figure 4), where the features formerly explained can be seen. As expected, the values of kt were higher in the summer months (with more clearness) than in the winter months. In addition, the monthly evolutions of both variables were, in general, complementary at all stations. Indeed, when the clearness index increased/decreased, the PAR/GHI ratio, in general, decreased/increased.

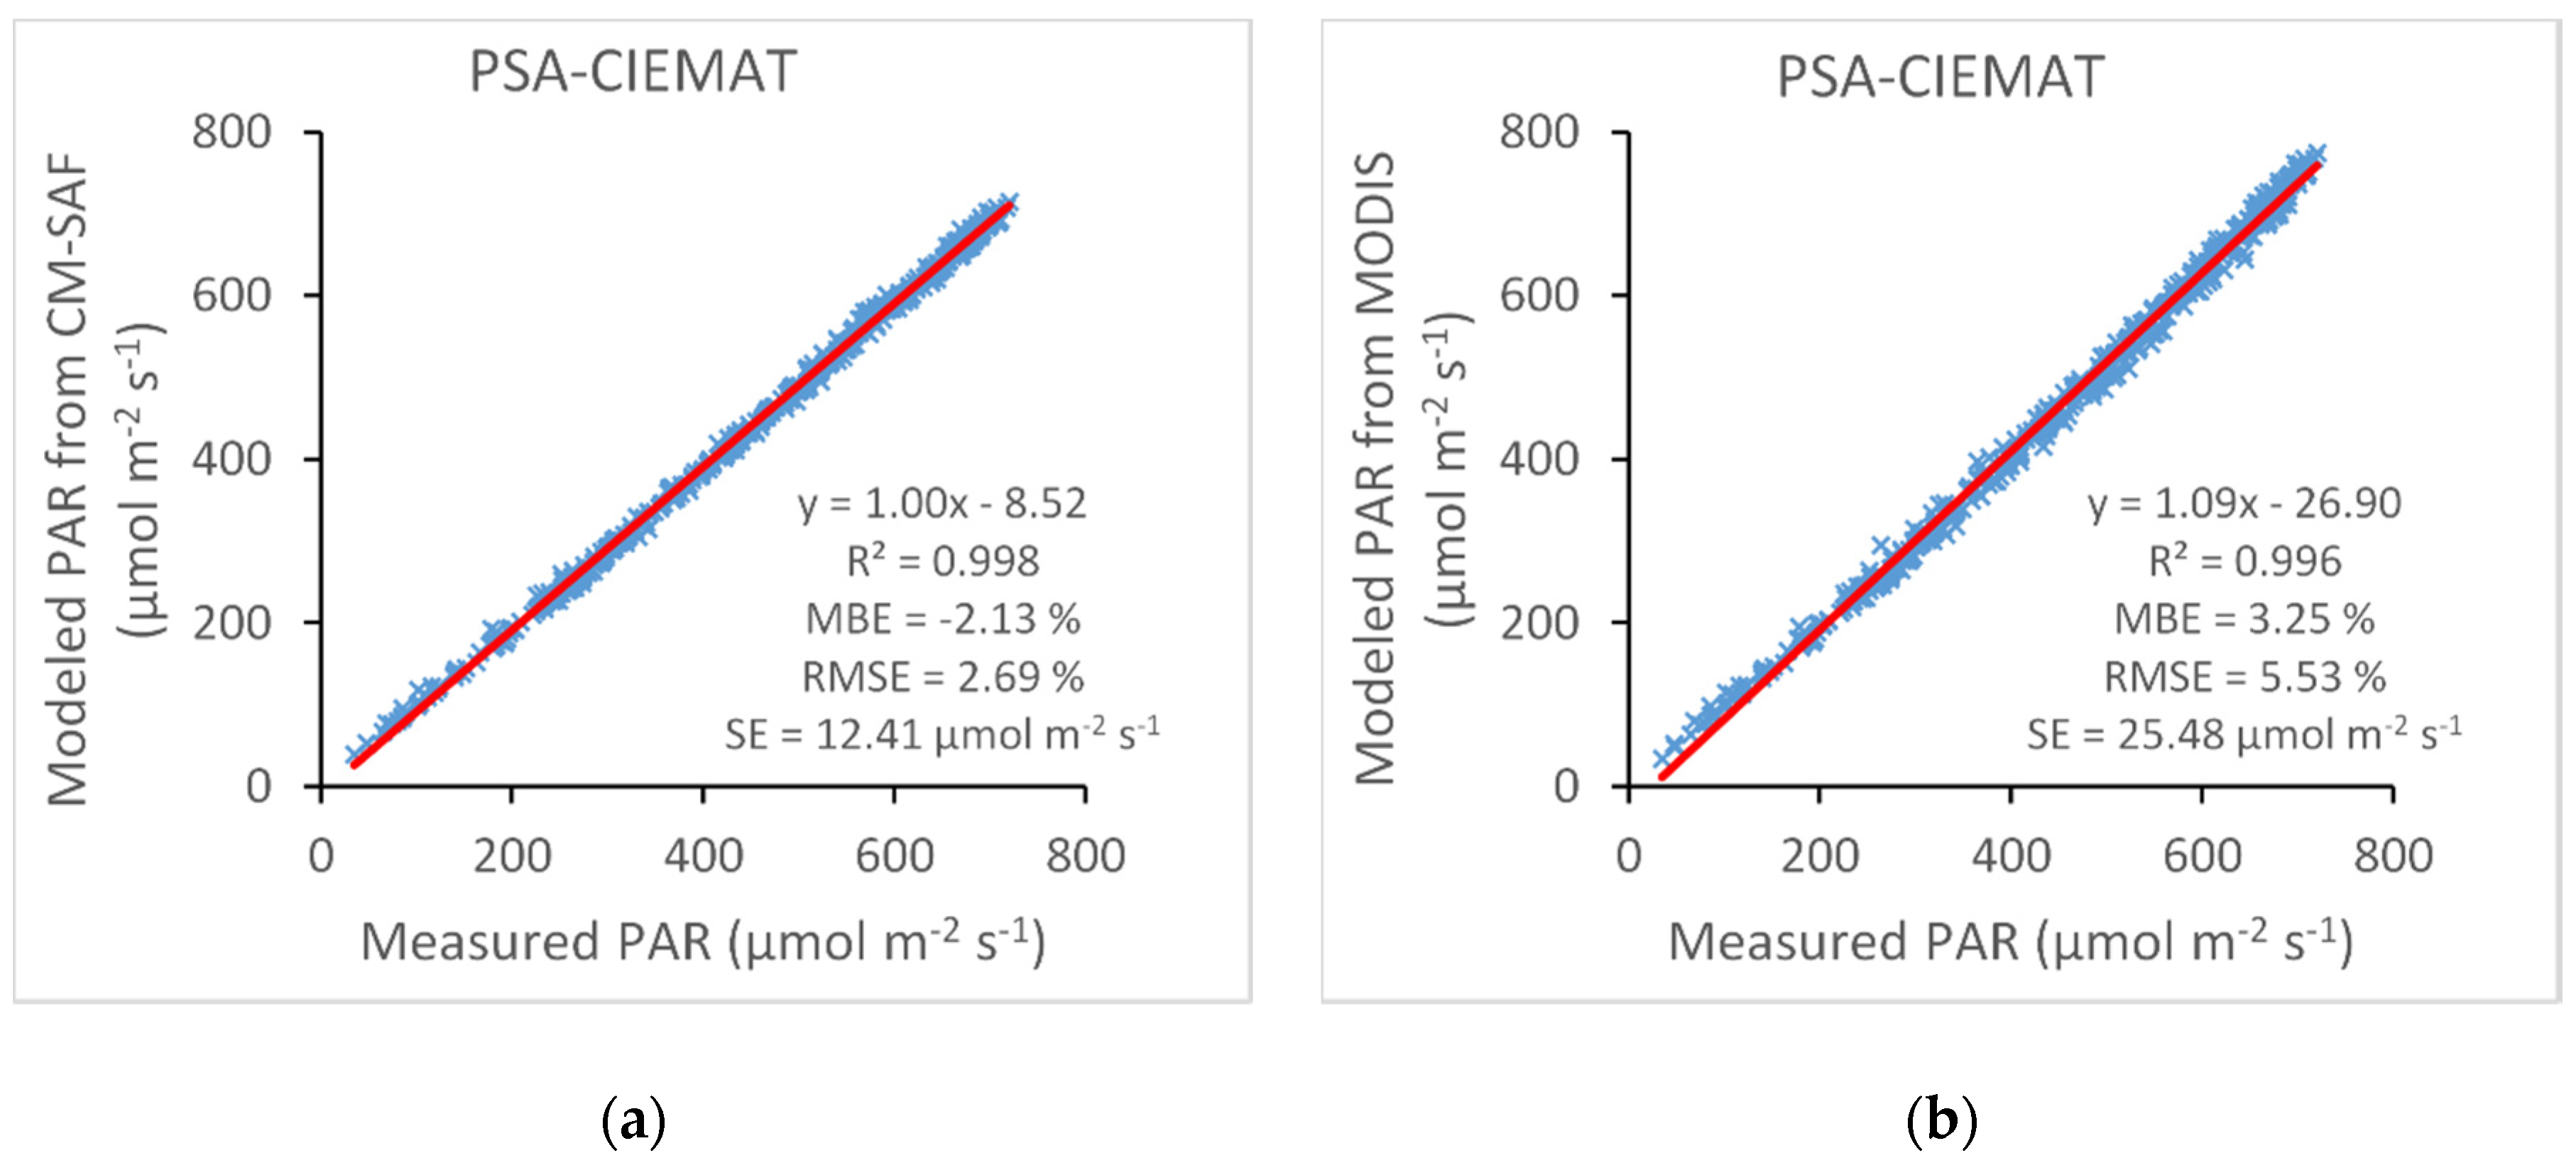
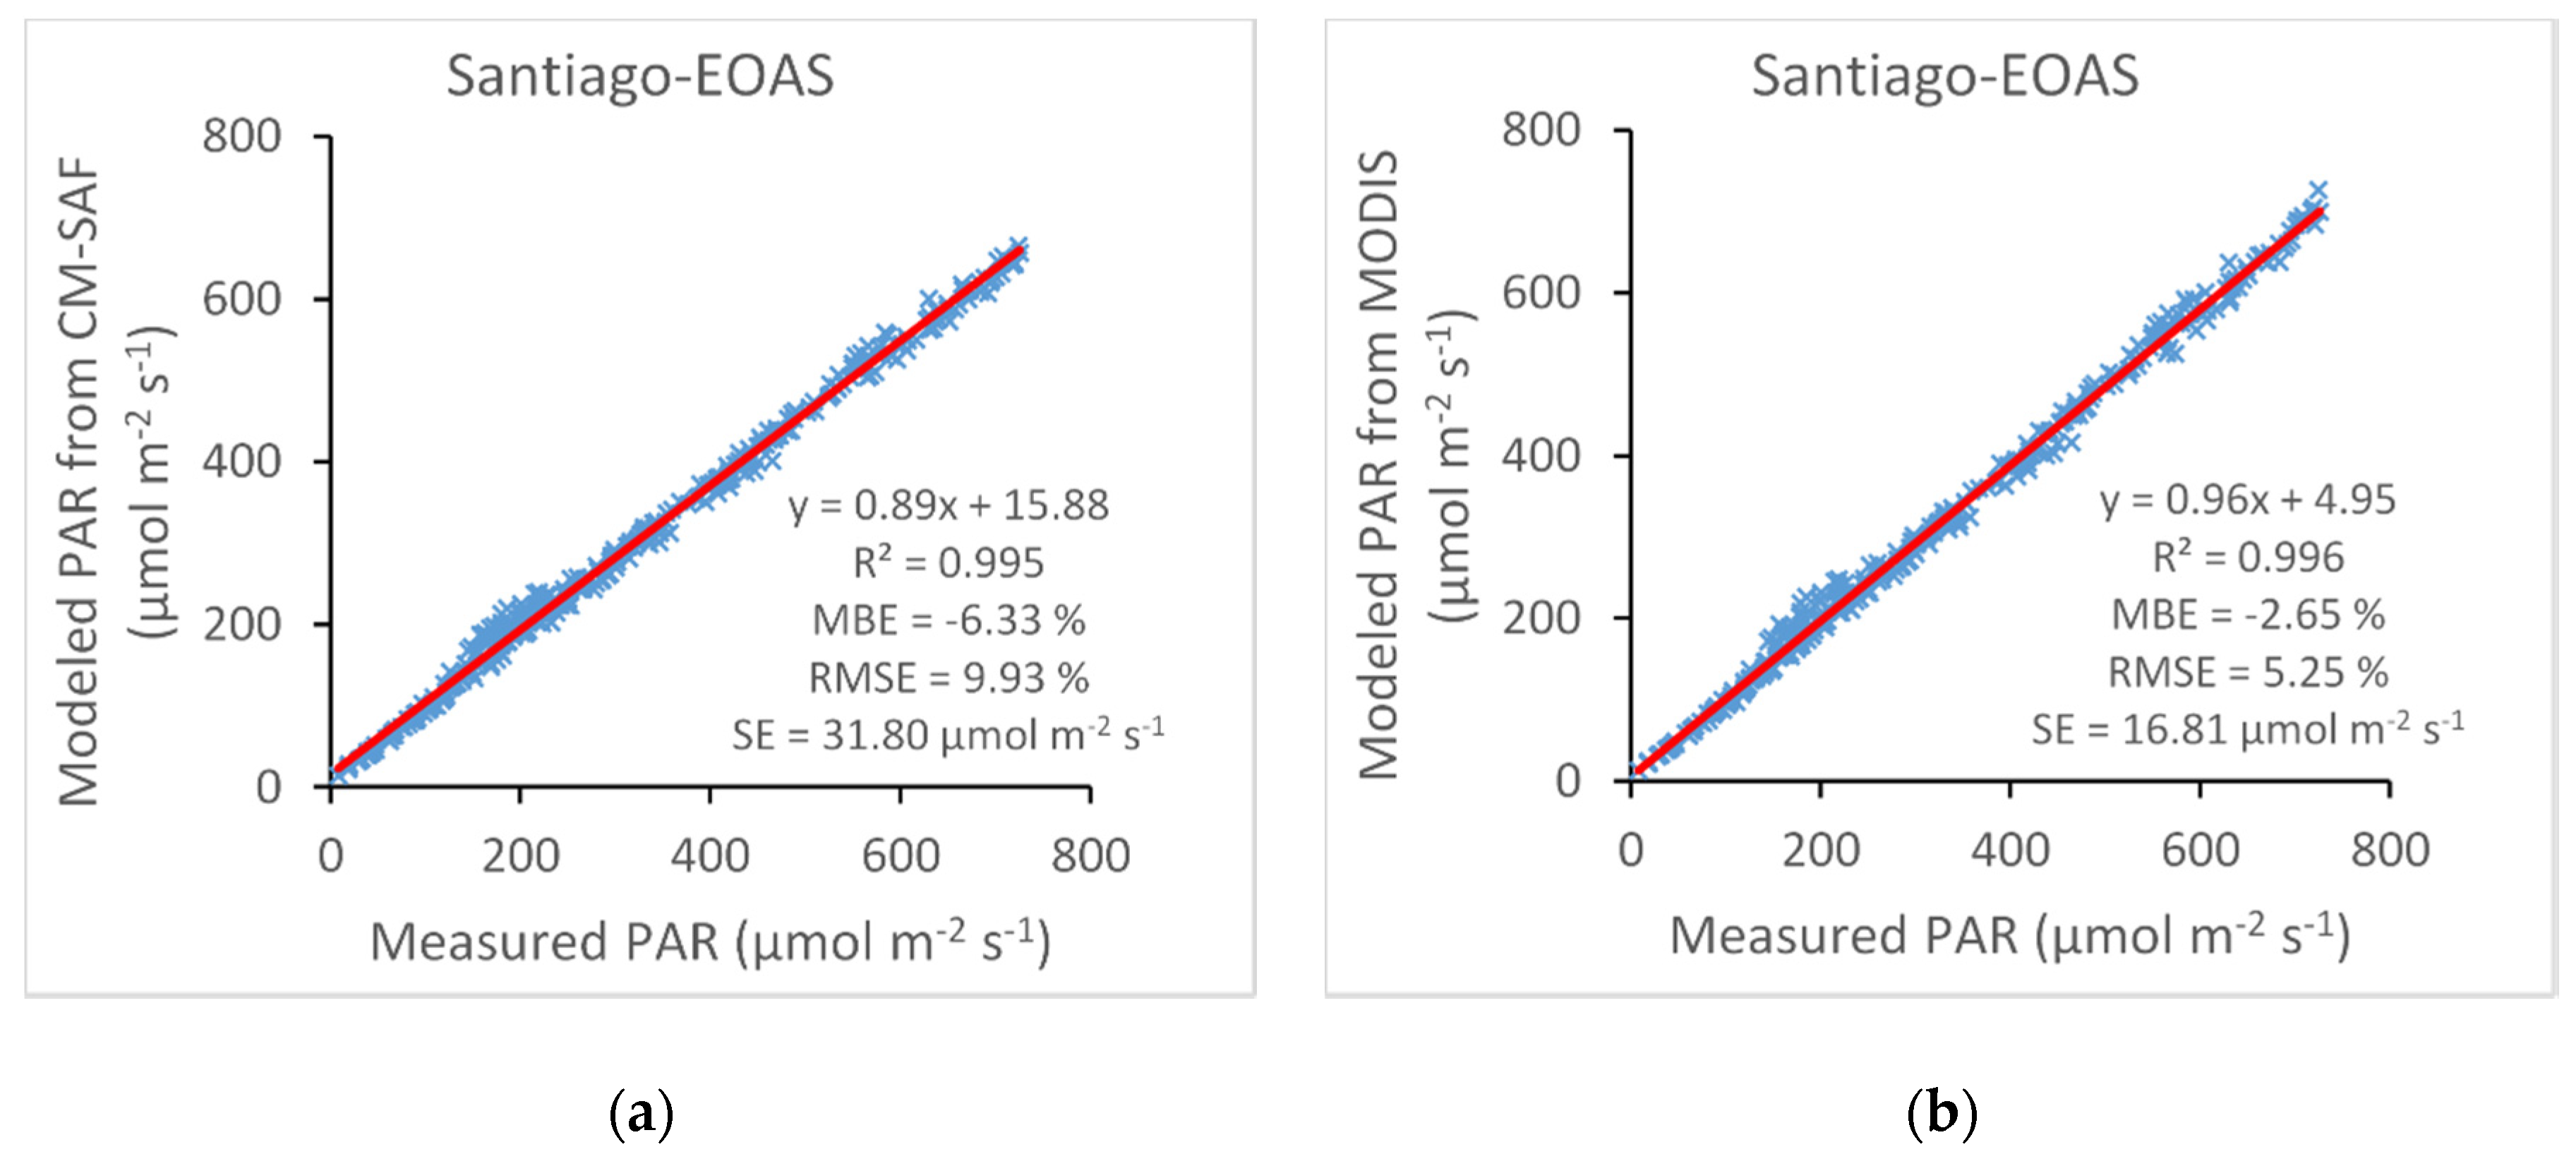
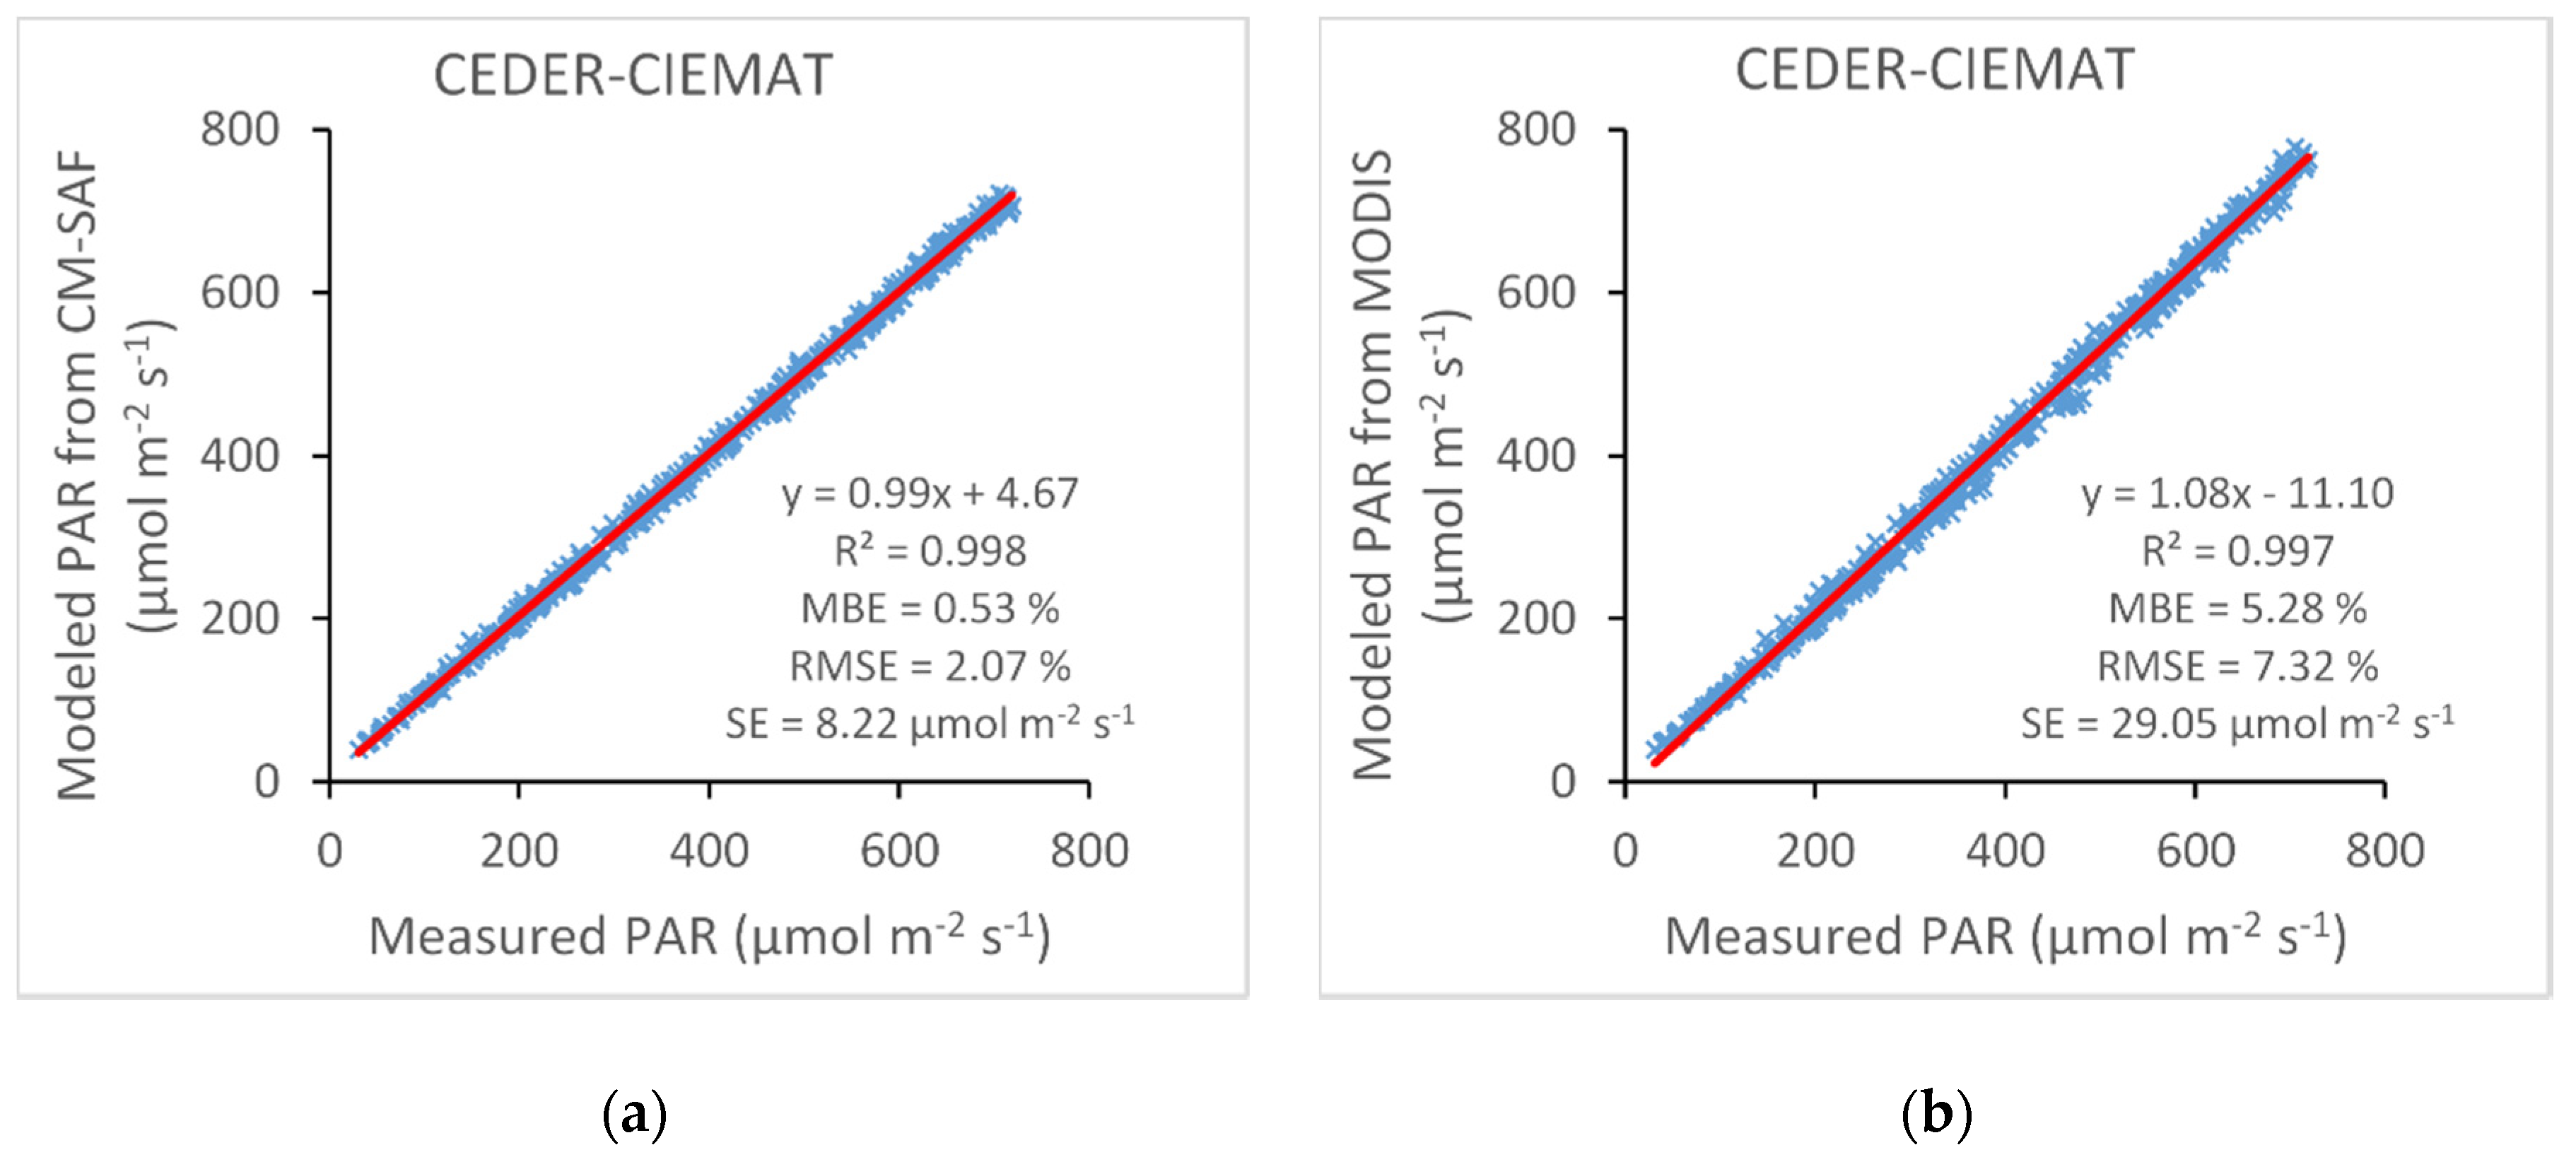
4.3. Performance of the Photosynthetically Active Radiation (PAR) Models

The previous sections showed that PAR models must take into account spatial and temporal variability in their performances. Other previous works [21,24,25,31] conducted PAR modeling for specific locations and, thus, those models did not take into account spatial variability. In this sense, satellite-derived data provide a very suitable tool to develop these models, as they are available with high resolution for wide regions and long periods. As mentioned, two satellite-derived datasets (CM-SAF and MODIS) were used to develop models to estimate PAR as a function of GHI for a region with different climates (oceanic and Mediterranean).
We assumed that the relationships between PAR and GHI obtained from satellite estimations can be applied for ground measurements, so these relationships can be used as models to estimate PAR from GHI ground measurements, as in [38,39]. Thus, PAR and GHI estimates from CM-SAF and MODIS were used to establish linear models that provide PAR from GHI for each spatial point and month, as noted in Equation (5). Thus, this methodology provides two models for each grid point: one from CM-SAF and the other from MODIS.
Figure 5, Figure 6, Figure 7, Figure 8, Figure 9 and Figure 10 show the coefficients α and β, that is, the model corresponding to each point of the study area and each month, from both datasets (CM-SAF and MODIS). Regarding the physical reading of α and β coefficients, α is the percentage of PAR in GHI and thus, it should be higher as kt decreases. While the β coefficient is an adjustment correction term. Figure 7 and Figure 10 show the determination coefficients (R2) for each point, indicating the degree of correlation existing between the satellite-derived PAR estimations and the model for this point. According to these figures, most of the determination coefficients were higher than 0.95, except in July for the MODIS-estimate-derived model, which had lower coefficients in a region of the center and south of the study area. Indeed, in these cases, the correlation between PAR and GHI (measured by the determination coefficient) is quite lower than in the rest of the cases. Thus, the coefficients α and β also showed very different values. MODIS performance characteristics could explain these anomalous results. As it was mentioned, MODIS accuracy to estimate radiation may be compromised in clear sky conditions, so the relation between PAR and GHI could not be captured properly during July in the south and center of mainland Spain.
Thus, by using satellite estimations, these linear models can be suitable tools to estimate PAR from GHI measurements.
To check the degree of accuracy of the proposed models, they were applied at the three stations used in this work, for which we used PAR and GHI ground measurements. Figure 2 (PAR/GHI vs. kt) shows that we added the values provided by CM-SAF and MODIS for comparison with the values obtained from pyranometer measurements, as well as the plots of the error bars in bins of 0.1 kt. In the case of Santiago-EOAS, MODIS estimates showed behavior more similar to the ground measurements than CM-SAF estimates, as these last estimates more poorly captured the high dispersion observed in the ground data. On the other hand, the mean values were very similar for both satellite-derived datasets, although MODIS provided a better estimate for lower kt. At CEDER-CIEMAT, according to the mean values, MODIS usually overestimated more than CM-SAF, while CM-SAF was in good agreement with the ground measurements for values of kt higher than 0.5. According to the error bars, the spread obtained from CM-SAF estimates was less than that from MODIS estimates and more similar to that obtained from measurements. At PSA-CIEMAT, MODIS overestimated the dispersion of the measured data more than CM-SAF, the mean values of which were, in general, more similar to those of the ground measurements. The LUT approach used to obtain MODIS products can explain its worse performance for the Meditteranean case. Indeed, as explained, for this LUT, the atmospheric radiative properties were estimated by directly taking the satellite TOA signature. Therefore, the performance at the native resolution of the satellite data was obtained and, thus, fewer data gaps were produced, which improved the estimates. However, in zones where the contrast between TOA reflectance and surface reflectance is more limited, as in the Mediterranean case, the lack of discrimination can result in worse estimates.
Additionally, the monthly evolutions of kt and PAR/GHI at the study stations determined by using the models obtained from both datasets are included in Figure 4, along with the corresponding evolutions of measured data. According to this figure, at the Mediterranean stations (CEDER-CIEMAT and PSA-CIEMAT) the monthly evolution of both variables was better captured by CM-SAF estimates than those from MODIS. However, in the case of the Santiago-EOAS station (oceanic climate), regarding the PAR/GHI ratio, MODIS behaved more similarly to ground measurements than CM-SAF did, due to the LUT approach used, which provided greater performance accuracy.
In addition, to establish more clearly the accuracy of the two models, PAR values estimated from CM-SAF- and MODIS-data-derived models are plotted vs. PAR measured in Figure 11, Figure 12 and Figure 13. The statistics used to assess the accuracy were the slope, the intercept, the R2, the MBE, the RMSE, and the SE. According to the results, for the oceanic station, the MODIS-data-derived model provided better results than the model developed from CM-SAF estimates. On the contrary, the model developed from CM-SAF provided better results at the two Mediterranean stations. Indeed, the statistics obtained for the best models can be considered to be of high quality, especially in the Mediterranean stations, since the slopes of the scatterplots were 0.99 and 1 and the RMSE was around 2% for both stations. In the case of the oceanic station, the statistics were slightly worse, which was expected due to the high variability of this climate, and yet, its MBE was similar to that of PSA-CIEMAT, its R2 was higher than 0.99, and its slope was 0.96. Regarding the standard errors of the regression, its value for the model from CM-SAF is lower clearly at Mediterranean stations (8.22 and 12.41 µmol m−2 s−1 respectively) than in the oceanic one (31.80 µmol m−2 s−1). The opposite occurred with the model from MODIS, where the oceanic station obtained lower SE (16.81 µmol m−2 s−1) than the Mediterranean ones (29.05 and 25.48 µmol m−2 s−1). This fact is in agreement with the previous results according to which MODIS works better at the oceanic station and CM-SAF at the Mediterranean ones. In this sense, these errors can help to know more exactly the accuracy of the different models.
Finally, in Table 5, these statistics at the three stations can be seen and compared with three of the proposed models in [39].
  • Considering only GHI as input (model F-C1)
  • Adding more variables, such as GHI, global extraterrestrial irradiance, relative humidity, and temperature (model F-C2)
  • Applying site-adaptation technique (only used for Santiago-EOAS station) (model F-C3)
For Mediterranean stations, F-C1 and CM-SAF obtained similar results and both were clearly better than those of MODIS. It was necessary to add more variables as inputs (F-C2) to slightly improve the results. In the case of the oceanic station, MODIS provides much better results than CM-SAF, F-C1, and F-C2 models. It was necessary to apply a site-adaptation technique, using ground data in addition to satellite data, to improve the performances.

5. Conclusions

The spatial and temporal variability of the PAR/GHI ratio is conditioned, in part, by the kt index. Indeed, the PAR/GHI ratio decreased, in general, as kt increased. The dispersion of PAR/GHI for any given value of kt and the decrease of this ratio as kt increased were both higher in the oceanic case than in the Mediterranean ones. Regarding the differences within the zones with the Mediterranean climate, the continental variety showed, in general, lower values of the PAR/GHI ratio.
The temporal evolutions of PAR/GHI showed a higher mean value and variability of this ratio for the oceanic case. Within Mediterranean climates, the standard variety can have higher mean values of PAR/GHI than the continental, in spite of the standard variety usually also having higher clearness indexes due to the presence of aerosols at stations situated in deserts or close to the sea, as in the case of the PSA-CIEMAT station.
Spatial and temporal variability must be taken into account in PAR model performances; so, satellite-derived data are a suitable tool to develop these models.
The validation at the three study stations of the models proposed, demonstrated the better performance of the MODIS-data-derived model for the case of Santiago-EOAS, while the model obtained from CM-SAF was better for the Mediterranean stations.

Author Contributions

Conceptualization and methodology, J.M.V., R.X.V. and F.F.-C.; software and validation, F.F.-C.; formal analysis, J.M.V. and F.F.-C.; data curation, R.X.V. and J.A.G.; writing—original draft preparation, J.M.V. and F.F.-C.; writing—review and editing, F.F.-C., J.M.V., R.X.V. and J.A.G.; funding acquisition, J.A.G., R.X.V. and J.M.V. All authors have read and agreed to the published version of the manuscript.

Funding

This work was funded by the Ministry of Economy, Industry and Competitiveness (MINECO) [Project CGL2016-79284-P AEI/FEDER/UE and F.F.-C. was founded by PhD Contract Number BES-2017-082043].

Acknowledgments

The authors thank MeteoGalicia (Department of the Environment and Territory Planning, Xunta de Galicia) for the data provided on global irradiance at the Santiago-EOAS station and at the University of Santiago de Compostela for the data provided by PAR at that station. We are also grateful for the SRI product of CM-SAF provided by EUMETSAT. Likewise, we acknowledge the use of data products from NASA Level-1 and Atmosphere Archive and Distribution System (LAADS) Distributed Active Archive Center (DAAC), located in the Goddard Space Flight Center in Greenbelt, Maryland (https://ladsweb.nascom.nasa.gov/).

Conflicts of Interest

The authors declare no conflict of interest.

References

  1. Björkman, O.; Demmig-Adams, B. Regulation of Photosynthetic Light Energy Capture, Conversion, and Dissipation in Leaves of Higher Plants. In Ecophysiology of Photosynthesis; Schulze, E.D., Caldwell, M.M., Eds.; Springer Study Edition; Springer: Berlin/Heidelberg, Germany, 1995; Volume 100. [Google Scholar]
  2. Wu, C.; Niu, Z.; Tang, Q.; Huang, W.; Rivard, B.; Feng, J. Remote estimation of gross primary production in wheat using chlorophyll-related vegetation indices. Agric. For. Meteorol. 2009, 149, 1015–1021. [Google Scholar] [CrossRef]
  3. Pinker, R.T.; Zhao, M.; Wang, H.; Wood, E.F. Impact of satellite based PAR on estimates of terrestrial net primary productivity. Int. J. Remote Sens. 2010, 31, 5221–5237. [Google Scholar] [CrossRef]
  4. Leblon, B.; Guerif, M.; Baret, F. The use of remotely sensed data in estimation of PAR use efficiency and biomass production of flooded rice. Remote Sens. Environ. 1991, 38, 147–158. [Google Scholar] [CrossRef]
  5. Liang, S.; Zheng, T.; Liu, R.; Fang, H.; Tsay, S.-C.; Running, S. Estimation of incident photosynthetically active radiation from Moderate Resolution Imaging Spectrometer data. J. Geophys. Res. Atmos. 2006, 111, D15208. [Google Scholar] [CrossRef] [Green Version]
  6. Zheng, T.; Liang, S.; Wang, K. Estimation of incident photosynthetically active radiation from GOES visible imagery. J. Appl. Meteorol. Climatol. 2008, 47, 853–868. [Google Scholar] [CrossRef]
  7. Nwokolo, S.; Amadi, S. A Global Review of Empirical Models for Estimating Photosynthetically Active Radiation. Trends Renew. Energy 2018, 4, 236–327. [Google Scholar] [CrossRef] [Green Version]
  8. Wandji, W.; Espinar, B.; Blanc, P.; Wald, L. Estimating the photosynthetically active radiation under clear skies by means of a new approach. Adv. Sci. Res. 2015, 12, 5–10. [Google Scholar] [CrossRef] [Green Version]
  9. Kato, S.; Ackerman, T.P.; Mather, J.H.; Clothiaux, E.E. The k-distribution method and correlated-k approximation for a shortwave radiative transfer model. J. Quant. Spectrosc. Radiat. Transf. 1999, 62, 109–121. [Google Scholar] [CrossRef]
  10. Wang, L.; Gong, W.; Ma, Y.; Hu, B.; Zhang, M. Photosynthetically active radiation and its relationship with global solar radiation in Central China. Int. J. Biometeorol. 2014, 58, 1265–1277. [Google Scholar] [CrossRef]
  11. Akitsu, T.; Kume, A.; Hirose, Y.; Ijima, O.; Nasahara, K.N. On the stability of radiometric ratios of photosynthetically active radiation to global solar radiation in Tsukuba, Japan. Agric. For. Meteorol. 2015, 209, 59–68. [Google Scholar] [CrossRef]
  12. Wang, L.; Gong, W.; Hu, B.; Zhu, Z. Analysis of photosynthetically active radiation in Northwest China from observation and estimation. Int. J. Biometeorol. 2015, 59, 193–204. [Google Scholar] [CrossRef] [PubMed]
  13. Iqbal, M. An Introduction to Solar Radiation; Academic Press: Toronto, Japan, 1983. [Google Scholar]
  14. Xia, X.; Li, Z.; Wang, P.; Chen, H. Estimation of aerosol effects on surface irradiance based on measurements and radiative transfer model simulations in northern China. J. Geophys. Res. Atmos. 2007, 112, D22S10. [Google Scholar] [CrossRef]
  15. Ångström, A. On the atmospheric transmission of Sun radiation and on dust in the air. Geogr. Ann. 1929, 11, 156–166. [Google Scholar]
  16. Kidder, Q.; Vonder Haar, T.H. Satellite Meteorology: An Introduction; Academic Press: San Diego, CA, USA, 1995. [Google Scholar]
  17. McCandless, T.C.; Haupt, S.E.; Young, G.S. A model tree approach to forecasting solar irradiance variability. Sol. Energy 2015, 120, 514–524. [Google Scholar] [CrossRef] [Green Version]
  18. Hu, B.; Wang, Y.; Liu, G. Spatiotemporal characteristics of photosynthetically active radiation in China. J. Geophys. Res. Atmos. 2007, 112, D14106. [Google Scholar] [CrossRef] [Green Version]
  19. Alados, I.; Foyo-Moreno, I.; Alados-Arboledas, L. Photosynthetically active radiation: Measurement and modelling. Agric. For. Meteorol. 1996, 78, 121–131. [Google Scholar] [CrossRef]
  20. Hu, B.; Wang, Y.; Liu, G. Measurements and estimations of photosynthetically active radiation in Beijing. Atmos. Res. 2007, 85, 361–371. [Google Scholar] [CrossRef]
  21. Escobedo, J.F.; Gomes, E.N.; Oliveira, A.P.; Soares, J. Modeling hourly and daily fractions of UV, PAR and NIR to global solar radiation under various sky conditions at Botucatu, Brazil. Appl. Energy 2008, 86, 299–309. [Google Scholar] [CrossRef]
  22. Wang, L.; Gong, W.; Li Ch Lin, A.; Hu, B.; Ma, Y. Measurement and estimation of photosynthetically active radiation from 1961 to 2011 in Central China. Appl. Energy 2013, 111, 1010–1017. [Google Scholar] [CrossRef]
  23. Peng, S.; Du, Q.; Lin, A.; Hu, B.; Xiao, K.; Xi, Y. Observation and estimation of photosynthetically active radiation in Lhasa (Tibetan Plateau). Adv. Space Res. 2015, 55, 1604–1612. [Google Scholar] [CrossRef]
  24. Yu, X.; Wu, Z.; Jiang, W.; Guo, X. Predicting daily photosynthetically active radiation from global solar radiation in the Contiguous United States. Energy Convers. Manag. 2015, 89, 71–82. [Google Scholar] [CrossRef]
  25. Aguiar, L.J.G.; Fischer, G.R.; Ladle, R.J.; Malhado, A.C.M.; Justino, F.B.; Aguiar, R.G.; da Costa, J.M.N. Modeling the photosynthetically active radiation in South West Amazonia under all sky conditions. Theor. Appl. Climatol. 2012, 108, 631–640. [Google Scholar] [CrossRef]
  26. Ren, X.; He, H.; Zhang, L.; Yu, G. Global radiation, photosynthetically active radiation, and the diffuse component dataset of China, 1981–2010. Earth Syst. Sci. Data 2018, 10, 1217–1226. [Google Scholar] [CrossRef] [Green Version]
  27. Jacovides, C.P.; Boland, J.; Asimakopoulos, D.N.; Kaltsounides, N.A. Comparing diffuse radiation models with one predictor for partitioning incident PAR radiation into its diffuse component in the eastern Mediterranean basin. Renew. Energy 2010, 35, 1820–1827. [Google Scholar] [CrossRef]
  28. Janjai, S.; Wattan, R.; Sripradit, A. Modeling the ratio of photosynthetically active radiation to broadband global solar radiation using ground and satellite-based data in the tropics. Adv. Space Res. 2015, 56, 2356–2364. [Google Scholar] [CrossRef]
  29. Mizoguchi, Y.; Yasuda, Y.; Ohtani, Y.; Watanabe, T.; Kominami, Y.; Yamanoi, K. A practical model to estimate photosynthetically active radiation using general meteorological elements in a temperate humid area and comparison among models. Theor. Appl. Climatol. 2014, 115, 583–589. [Google Scholar] [CrossRef]
  30. Pashiardis, S.; Sa, K.; Pelengaris, A. Characteristics of Photosynthetic Active Radiation (PAR) Through Statistical Analysis at Larnaca, Cyprus. SM J. Biom. Biostat. 2017, 2, 1–16. [Google Scholar]
  31. Jacovides, C.; Tymvios, F.S.; Boland, J.; Tsitouri, M. Artificial Neural Network models for estimating daily solar global UV, PAR and broadband radiant fluxes in an eastern mediterranean site. Atmos. Res. 2015, 152, 138–145. [Google Scholar] [CrossRef]
  32. Foyo-Moreno, I.; Alados, I.; Alados-Arboledas, L. A new conventional regression model to estimate hourly photosynthetic photon flux density under all sky conditions. Int. J. Climatol. 2017, 37, 1067–1075. [Google Scholar] [CrossRef] [Green Version]
  33. López, G.; Rubio, M.A.; Martínez, M.; Batlles, F.J. Estimation of hourly global photosynthetically active radiation using artificial neural network models. Agric. For. Meteorol. 2001, 107, 279–291. [Google Scholar] [CrossRef]
  34. Van Laake, P.E.; Sanchez-Azofeifa, G.A. Simplified atmospheric radiative transfer modeling for estimating incident PAR using MODIS atmosphere products. Remote Sens. Environ. 2004, 91, 98–113. [Google Scholar] [CrossRef]
  35. Chen, L.; Gao, Y.; Yang, L.; Liu, Q.; Gu, X.; Tian, G. MODIS-derived daily PAR simulation from cloud-free images and its validation. Sol. Energy 2008, 82, 528–534. [Google Scholar] [CrossRef]
  36. Janjai, S.; Wattan, R. Development of a model for the estimation of photosynthetically active radiation from geostationary satellite data in a tropical environment. Remote Sens. Environ. 2011, 115, 1680–1693. [Google Scholar] [CrossRef]
  37. Tripathy, M.; Raman, M.; Chauhan, P. Estimation of photosynthetically available radiation (PAR) from OCEANSAT-I OCM using a simple atmospheric radiative transfer model. Adv. Space Res. 2015, 56, 1441–1452. [Google Scholar] [CrossRef]
  38. Vindel, J.M.; Valenzuela, R.X.; Navarro, A.A.; Zarzalejo, L.F.; Paz-Gallardo, A.; Souto, J.A.; Méndez-Gómez, R.; Cartelle, D.; Casares, J.J. Modeling Photosynthetically Active Radiation from Satellite-Derived Estimations over Mainland Spain. Remote Sens. 2018, 10, 849. [Google Scholar] [CrossRef] [Green Version]
  39. Ferrera-Cobos, F.; Vindel, J.M.; Valenzuela, R.X.; González, J.A. Models for estimating daily photosynthetically active radiation in oceanic and mediterranean climates and their improvement by site adaptation techniques. Adv. Space Res. 2020, 65, 1894–1909. [Google Scholar] [CrossRef]
  40. Wang, D.; Liang, S.; Zhang, Y.; Gao, X.; Brown, M.G.L.; Jia, A. A New Set of MODIS Land Products (MCD18): Downward Shortwave Radiation and Photosynthetically Active Radiation. Remote Sens. 2020, 12, 168. [Google Scholar] [CrossRef] [Green Version]
  41. Agencia Estatal de Meteorología (AEMET); Instituto de Meteorología de Portugal (IM). Iberian Climate Atlas; AEMET-Ministerio de Medio Ambiente y Medio Rural y Marino & IM: Madrid, Spain, 2011; ISBN 978-84-7837-079-5.
  42. Linés-Escardó, A. The Climate of the Lberian Peninsula. In Climates of Northern and Western Europe; Elsevier Publishing: Amsterdam, The Netherlands; London, UK; New York, NY, USA, 1970; Volume 5, pp. 195–240. [Google Scholar]
  43. Capel, J.J. El Clima de la Península Ibérica; Ariel: Barcelona, Spain, 2000. [Google Scholar]
  44. Bladé, I.; Cacho, I.; Castro-Díez, Y.; Gomis, D.; González-Sampériz, P.; Miguez-Macho, G.; Perez, F.F.; Rodríguez-Fonseca, B.; Rodríguez-Puebla, C.; Sánchez, E.; et al. Climate in Spain: Past, Present and Future. Regional Climate Change Assessment Report of Clivar Spain; Pérez, F.F., Boscolo, R., Eds.; Ministerio de Medio Ambiente y Medio Rural y Marino; Ministerio de Ciencia e Innovación: Madrid, Spain, 2010; ISBN 978-84-614-8115-6.
  45. Atlas Climático. Available online: http://agroclimap.aemet.es (accessed on 29 January 2020).
  46. Müller, R.; Pfeifroth, U.; Träger-Chatterjee, C.; Cremer, R.; Trentmann, J.; Hollmann, R. Surface Solar Radiation Data Set-Heliosat (SARAH)-Edition 1; EUMETSAT Satellite Application Facility on Climate Monitoring (CM SAF). 2015. Available online: https://wui.cmsaf.eu/safira/action/viewDoiDetails?acronym=SARAH_V001 (accessed on 11 December 2019). [CrossRef]
  47. Wang, D. MODIS/Terra+Aqua Surface Radiation Daily/3-Hour L3 Global 5km SIN Grid V006 [Data set]. NASA EOSDIS Land Process. DAAC; 2017. Available online: https://lpdaac.usgs.gov/products/mcd18a1v006 (accessed on 10 November 2019). [CrossRef]
  48. Wang, D. MODIS/Terra+Aqua Photosynthetically Active Radiation Daily/3-Hour L3 Global 5 km SIN Grid V006 [Data set]. NASA EOSDIS Land Process. DAAC; 2017. Available online: https://lpdaac.usgs.gov/products/mcd18a2v006 (accessed on 10 November 2019). [CrossRef]
  49. Vindel, J.M.; Valenzuela, R.X.; Navarro, A.A.; Zarzalejo, L.F.; Souto, J.A.; Méndez-Gómez, R.; Cartelle, D.; Casares, J.J. Variabilidad Espacial y Temporal en la Relación PAR/GHI de Acuerdo con el índice de Claridad. In Proceedings of the Libro de Actas del XVI Congreso Ibérico y XII Congreso Iberoamericano de Energía Solar, Madrid, Spain, 20–22 June 2018; pp. 747–752. [Google Scholar]
  50. Mallet, M.; Dulac, F.; Formenti, P.; Nabat, P.; Sciare, J.; Roberts, G.; Pelon, J.; Ancellet, G.; Tanré, D.; Parol, F.; et al. Overview of the Chemistry-Aerosol Mediterranean Experiment/Aerosol Direct Radiative Forcing on the Mediterranean Climate (ChArMEx/ADRIMED) summer 2013 campaign. Atmos. Chem. Phys. 2016, 16, 455–504. [Google Scholar] [CrossRef] [Green Version]
Figure 1. Climates present in mainland Spain and the locations of the stations used in this work.
Remotesensing 12 01262 g001
Figure 2. In the bottom plots, the ratio between photosynthetically active radiation and global horizontal irradiance (PAR/GHI) vs. clearness index (kt) is represented, while in the three upper graphs, means and standard deviations as error bars in bins of 0.1 kt are plotted for Santiago-EOAS (a), CEDER-CIEMAT (b), and PSA-CIEMAT (c).
Remotesensing 12 01262 g002aRemotesensing 12 01262 g002bRemotesensing 12 01262 g002c
Figure 3. Temporal evolution of daily kt and PAR/GHI at the study stations.
Remotesensing 12 01262 g003
Figure 4. Monthly means of kt and PAR/GHI at the study sites. The error bars represent the standard deviations of each month.
Remotesensing 12 01262 g004
Figure 5. α coefficients of Climate Monitoring Satellite Facility (CM-SAF)-estimate-derived model for each location and month.
Remotesensing 12 01262 g005
Figure 6. β coefficients of CM-SAF-estimate-derived model for each location and month.
Remotesensing 12 01262 g006
Figure 7. Determination coefficients of the CM-SAF-estimate-derived model for each location and month.
Remotesensing 12 01262 g007
Figure 8. α coefficients of the Moderate-Resolution Imaging Spectroradiometer (MODIS)-estimate-derived model for each location and month.
Remotesensing 12 01262 g008
Figure 9. β coefficients of the MODIS-estimate-derived model for each location and month.
Remotesensing 12 01262 g009
Figure 10. Determination coefficients of the MODIS-estimate-derived model for each location and month.
Remotesensing 12 01262 g010
Figure 11. Scatterplot of measured PAR and modeled PAR (blue cross) corresponding to the Santiago-EOAS station. The fitting line is represented in red and the statistics of the fitting are also included. (a) CM-SAF-estimate-derived model; (b) MODIS-estimate-derived model.
Remotesensing 12 01262 g011
Figure 12. Scatterplot of measured PAR and modeled PAR (blue cross) corresponding to the CEDER-CIEMAT station. The fitting line is represented in red and the statistics of the fitting are also included. (a) CM-SAF-estimate-derived model; (b) MODIS-estimate-derived model.
Remotesensing 12 01262 g012
Figure 13. Scatterplot of measured PAR and modeled PAR (blue cross) corresponding to the PSA-CIEMAT station. The fitting line is represented in red and the statistics of the fitting are also included. (a) CM-SAF-estimate-derived model; (b) MODIS-estimate-derived model.
Remotesensing 12 01262 g013
Table 1. Kato bands in the photosynthetically active radiation (PAR) solar spectrum region.
Kato BandWavelength Region (µm)
70.408–0.452
80.452–0.518
90.518–0.540
100.540–0.550
110.550–0.567
120.567–0.605
130.605–0.625
140.625–0.667
150.667–0.684
160.684–0.704
Table 2. Summary of the main features of each station.
StationLatitudeLongitudeAltitudePeriodClimate
SANTIAGO-EOAS42.88°N8.56°W255 m a.s.l.01/01/2016–31/12/2017Oceanic
CEDER-CIEMAT41.60°N2.51°W1095 m a.s.l.26/01/2016–20/08/2017Continental Mediterranean
PSA-CIEMAT37.10°N2.36°W500 m a.s.l.24/02/2016–22/06/2017Standard Mediterranean
Table 3. Instruments deployed at each station.
StationOwnerSensorModelManufacturerRange
SANTIAGO-EOASSANTIAGO-EOASPARGUV-2511Biospherical Instruments Inc.305, 313, 320, 340, 380, 395 (nm), and PAR (400–700 nm)
MeteoGaliciaGHIPyrradiometer 8111SCHENK300–3000 (nm)
CEDER-CIEMATCEDER-CIEMATPARML-020PEKO0–3000
CEDER-CIEMATGHICM21Kipp and Zonen305–2800 (nm)
PSA-CIEMATPSA-CIEMATPARML-020PEKO0–3000
PSA-CIEMATGHICM21Kipp and Zonen305–2800 (nm)
Table 4. Mean and coefficient of variation at the three measurement stations in this study.
Santiago-EOASCEDER-CIEMATPSA-CIEMAT
ktPAR/GHIktPAR/GHIktPAR/GHI
Mean0.5145.910.5842.170.6443.44
CV0.390.080.330.030.240.04
Table 5. Statistics of the models proposed in this work (CM-SAF and MODIS) and of the proposed models in [43] (F-C1, F-C2, and F-C3) for each validation station.
StationModelSlopeInterceptR2MBE (%)RMSE (%)
Santiago-EOASF-C10.919.150.992−6.569.97
F-C20.8820.670.996−5.049.16
F-C31.000.000.993−0.004.99
CM-SAF0.8915.880.995−6.339.93
MODIS0.964.950.996−2.655.25
CEDER-CIEMATF-C11.01−2.210.9990.601.98
F-C21.000.410.9990.291.86
CM-SAF0.994.670.9980.532.07
MODIS1.08−11.100.9975.287.32
PSA-CIEMATF-C11.02−16.030.999−1.892.71
F-C21.00−6.050.998−1.782.44
CM-SAF1.00−8.520.998−2.132.69
MODIS1.09−26.900.9963.255.53

