
Assessing Past Climate Biases and the Added Value of CORDEX-CORE Precipitation Simulations over Africa


1
Binjiang College, Nanjing University of Information Science & Technology, Wuxi 214105, China
2
Collaborative Innovation Center on Forecast and Evaluation of Meteorological Disasters/Key Laboratory of Meteorological, Disaster, Ministry of Education, Nanjing University of Information Science and Technology, Nanjing 210044, China
3
National Meteorological Centre, China Meteorological Administration, Beijing 100081, China
4
School of Geographical Sciences, Nanjing University of Information Science & Technology, Nanjing 210044, China
*
Author to whom correspondence should be addressed.
Remote Sens. 2021, 13(11), 2058; https://doi.org/10.3390/rs13112058
Submission received: 20 March 2021
/
Revised: 17 May 2021
/
Accepted: 20 May 2021
/
Published: 23 May 2021
(This article belongs to the Special Issue Remote Sensing of Water Cycle Essential Climate Variables and Their Applications)
Abstract
:The present study investigates the skills of CORDEX-CORE precipitation outputs in simulating Africa’s key seasonal climate features, emphasizing the added value (AV) of the dynamical downscaling approach from which they were derived. The results indicate the models’ good skills in capturing African rainfall patterns and dynamics at satellite-based observation resolutions, with up to 65.17% significant positive AV spatial coverage for the CCLM5 model and up to 55.47% significant positive AV spatial coverage for the REMO model. Unavoidable biases are however present in rainfall-abundant areas and are reflected in the AV results, but vary based on the season, the sub-area, and the Global Climate Model–Regional Climate Models (GCM-RCM) combination considered. The RCMs’ ensemble mean generally performs better than individual GCM–RCM simulations. A further analysis of the GCM–RCM model chain indicates a strong influence of the dynamical downscaling approach on the driving GCMs. However, exceptions are found in some seasons for specific RCMs’ outputs, where GCMs are influential. The findings also revealed that observational uncertainties can influence AV and contribute to a 6 to 34% difference in significant positive AV spatial coverage results. An analysis of these results suggests that the AV by CORDEX-CORE simulations over Africa depend on how well the GCM physics are integrated to those of the RCMs and how these features are accommodated in the high-resolution setting of the downscaling experiments. The deficiencies of the CORDEX-CORE simulations could be related to how well key processes are represented within the RCM models. For Africa, these results show that CORDEX-CORE products could be adequate for a wide range of high-resolution precipitation data applications.
1. Introduction
Regional Climate Models (RCMs) are the cornerstones of regional climate change, vulnerability, impacts and adaptation studies, and climate service activities (VIA-CS) [1]. Being the key ingredient of successful applications for actionable and usable regional information, RCMs should be subjected to some quality prerequisites. This pivotal issue has been recently addressed by the robustness, reliability, and relevance framework (3R framework) [2], which aims at providing a systematic way of insuring data quality and consistency for actionable regional climate change information. The 3R framework defines robustness as a feature reflecting a multi-model and multi-method ensembles-based significantly consistent change signal from a statistical point of view. The reliability element captures the ability of the models to reproduce key features of the climate system at different scales while being produced based on a good understanding of the physical process driving the change signals. The relevance aspect targets the extent of applicability of climate models under the VIA-CS activities context and proper characterization of uncertainties.
From an RCM standpoint, the 30 years of research and development in regional climate modeling [1,3], recently celebrated, suggest relatively good progress regarding the relevance aspect of the 3R framework. However, crucial issues such as the added value (AV) by RCMs need greater attention. The need to understand AV by RCMs is moreover essential for better compliance to the relevance aspect of the 3R framework [2], as it strongly suggests not to use regional climate information off the shelf from many databanks without a clear understanding of best use and limitations. The search and justification of the presence of AV by RCMs therefore represents a crucial effort toward the issue of RCMs’ misuses, but contributes on a larger spectrum to a better understanding of the improvement or degradation introduced by regional climate modeling approaches, and constitutes a robust basis for user application choices, especially when choosing between GCMs and RCMs [4].
However, attributing the AV by RCMs can be challenging due to the complexity of GCM–RCM model chains, from which dynamically downscaled climate fields are obtained [5]. The attribution of AV by RCMs is important and useful, especially from a modeling standpoint, as it can pinpoint the aspect of the downscaling experiment that could be improved to increase the overall quality of RCMs. In principle, using the AV as a metric that reflects the improvement introduced by RCMs is not bad. Still, it should be complemented by other methods to ensure that at least a positive AV, for example, is observed for the right reason such as if the AV observed is really driven by the RCMs. This further analysis can give users confidence on whether the AV they are observing is there for the right reasons and if those underlying reasons fit their applications. To solve these intricacies that may occur while analyzing or using RCMs, recent studies [6,7] have introduced a new metric that compares the driving GCM biases to the difference between the RCMs and the GCMs known as the RCM increment (RCMI), using the correlation coefficient. A positive correlation indicates that the GCM biases dominate the observed added value, while a negative correlation suggests that the RCM counteracts the GCM biases.
In recent years, the AV debate was made possible by a series of regional climate modeling projects around different parts of the world [8,9,10,11,12], and was further revived by the launch of the Coordinated Regional Downscaling Experiment (CORDEX) [13,14], under the auspices of the World Climate Research Program (WRCP).The CORDEX project’s first phase carried out a set of experiments, where reanalysis data from ERA-INTERIM and the Coupled Model Intercomparison Project phase 5 (CMIP5) [15] Global Climate Models (GCMs) were dynamically downscaled to produce historical and projection simulations of at least 50 km resolution, over various domains, from which Africa was given the highest priority.
The availability of CORDEX data over Africa has been of great interest to the African climate community as it has given rise to various studies [16,17,18,19,20,21] over the continent. Although most of these studies adopted direct assessment of RCMs with observations, they have been instrumental in showing the ability of RCMs to reproduce key features of the African climate system. Studies over Africa targeting and discussing the AV issue have been scarce in the literature, but a few recent studies [22,23,24,25,26] have discussed and addressed some aspects. This is particularly due to the lack of African scientists training on these emerging and robust assessment methods, but more generally owing to the variable, incomplete, and inhomogeneous availability of CORDEX phase I simulations from different modelling centers [27]. These studies found that CORDEX RCM precipitation simulations capture African rainfall characteristics; however, unavoidable biases are still present and majorly due to process misrepresentation and observational uncertainties. The findings also revealed the presence of AV by dynamically downscaled outputs.
The aforementioned challenges related to data availability have been integrated into the guidelines of the second phase of the CORDEX project, under the Common Regional Experiment framework (CORDEX-CORE) [28,29]. The particularity of the CORDEX-CORE project is the unprecedented high-resolution of its RCM outputs [30], with resolutions ranging from 10–25 km and therefore reaching common satellite-based products’ resolutions. With these high-resolution datasets, the availability of satellite-based observational datasets with similar resolutions could be instrumental for better regional information distillation over Africa, where such activities are often affected by the scarce and uneven density of measurement networks [31].
In the present study, we investigate past climate seasonal precipitation biases reported by CORDEX-CORE dynamically downscaled outputs, compared to their driving GCMs over Africa, while accounting for observational uncertainties. We then extend the bias analysis to the investigation of potential AV by the CORDEX-CORE RCMs to their driving GCMs. The results are further regionalized based on African climate zones, for which a statistical attribution is carried out to understand the origins of the locally observed AV at the model level.
2. Materials and Methods
2.1. Study Area
This study investigates the possibility of AV by CORDEX-CORE RCMs over Africa, which is known for its important fingerprint in the global climate system, and its insufficient capacity to adapt to climate change impacts. Africa is also known for its heterogeneous topographic features (see Figure 1) and its monsoonal climate system, making the area ideal for investigating the AV by RCMs, as they usually integrate such local and fine-scaled features.
The inhomogeneous aspect of global climate features and the difficulty of converging and consistently comparing results across studies have recently triggered the need to specify climatologically consistent and coherent subcontinental zones and regions. The Intergovernmental Panel for Climate Change (IPCC) regions for subcontinental climate analysis have been recently updated to address this problem [32]. This update has an impact on how we understand the African climate zones with well-defined new climate regions such as the Sahara (SAH), West Africa (WAF), Central Africa (CAF), Northern East Africa (NEAF), Southern East Africa (SEAF), Western South Africa (WSAF), and Eastern South Africa (ESAF) as shown on Figure 1. This new repartition has been recently employed in one of the first papers [33] concerning CORDEX-CORE data assessment. It is employed in the context of this study to provide a continuum of efforts towards consistently investigating RCMs’ potentialities and applications.
2.2. Climate Simulation and Observation Datasets
Two RCMs, produced at an unprecedented high resolution (0.22° ≈ 25 km grid size) are used in this study, to assess if they add some value to the driving GCMs. The set of RCMs used as a testbed includes the REMO2015 Regional Climate Model [34,35] and the COSMO-CLM Regional Climate Model (CCLM) [36]. The two RCMs were chosen out of the CORDEX-CORE ensemble because they share the same driving data. For instance, the CCLM and REMO2015 RCMs are driven by ERA-INTERIM for the evaluation run (1979–2016) and three GCMs for the historical runs and projections. Further information about the two RCMs and their driving datasets are given in Table 1. Moreover, the high resolution of the CORDEX-CORE simulations makes the evaluation exercise more challenging, because of the scarcity of gauge networks, and the resulting high uncertainties and resolution variety within the set of available gridded rainfall products over Africa.
To account for observational uncertainty while employing datasets with highly similar resolutions to those of the CORDEX-CORE simulations, we chose the Climate Hazard Infrared Precipitation with Stations (CHIRPS) [37] daily product at 0.25°, and the Global Precipitation Climatology Centre (GPCC) full data monthly product version 2018 at 0.25° [38]. The GPCC product is purely gauge measurement-based, while the CHIRPS product is satellite and gauge measurement blending-based. The CHIRPS data are available from 1981 to 2020 at daily temporal resolution, and the GPCC data are available from 1891 to 2016 at monthly temporal resolution.
2.3. Methodology
The precipitation regional simulations and their driving GCMs were acquired from the Earth System Grid Federation (ESGF) website through the German node [39]. The GPCC dataset was acquired from the Deutscher Wetterdienst (DWD) website [40] and the CHIRPS dataset from the UC Sancta Barbara Climate Hazard Group’s website [41]. In order to allow grid-wise comparison, the driving GCM and the RCM datasets are interpolated to the observational datasets grid (0.25°) using the bilinear remapping functions from the Climate Data Operators version 1.9.7 (CDO 1.9.7), developed by the Max Plank Institute of Meteorology. The daily CHIRPS precipitation data are aggregated to a monthly total using the monthly sum function from CDO 1.9.7.
Both observational and modeled datasets from 1981 to 2005 are aggregated to the seasonal timescale considering December-January-February (DJF), March-April-May (MAM), June-July-August (JJA), and September-October-November (SON) seasons. To investigate discrepancies that may be inherent to the climate simulations and picture the effectiveness of the RCMs in reducing the GCM ones, the mean seasonal bias is computed and plotted for all the climate simulations using the following formula:
where is the seasonal mean of the GCM or the RCM being considered and is the seasonal mean of the observational reference.
To further quantify the extent to which the RCMs add value to the GCMs, we approach the AV based on suggestions by [5] where the AV is calculated as a comparison of the distance between a chosen statistic of the GCMs and observations, and the distance between the same statistic of the RCMs and observations. The AV formula using the mentioned approach is given as follow:
where the and the respectively represent the chosen statistic for the GCM and the RCM, and represents the same statistic for the observational reference. For this study, the seasonal mean is used as the statistic and the distance metrics chosen to be the mean squared error, with a normalization factor as proposed by [22] in the following formula:
where the AV values are restricted to values between −1 and 1. The AV values greater than zero are considered positive AV values, while AV values less than zero are considered negative AV values. The AV calculations and plotting are carried out on a grid-wise basis for each season over Africa. A 10% significance level threshold corresponding to AV values between −0.1 and 0.1 is used to distinguish positive AV and negative AV from non-significant AV values. Significant positive AV values are greater than 0.1 and significant negative AV values are lower than −0.1. These thresholds therefore allow a better quantification of the proportion of positive, negative, and non-significant AV.
To allow better usage of the RCMs for regional to local decision making and other related applications, we classify the seasonal AV results by regions, using the updated IPCC reference regions for subcontinental climate analysis. For each region, the AV spatial coverage (AVC) of positive, negative, and non-significant AV at a 10% significance level is introduced based on the following formula:
where represents the positive, the negative, and the non-significant AV coverage for a given region, considering a specific season; represents the number of pixels or grids exhibiting a positive, a negative, or a non-significant AV for the given region; and represents the total number of pixels or grids for the considered region.
To understand how the driving GCM and the dynamical downscaling process impact the AV results, we calculate the correlation coefficient between the GCM biases and the RCM increment (RCMI). A positive correlation suggests an impact of the GCM biases on the AV, while a negative one suggests that the RCM counteracts the GCM biases. The different equations are given as follow:
where the represents the RCM increment; and , the seasonal mean of the RCM and the GCM, respectively; the number of grids over the considered region; the mean bias at each grid point; the overall average of the mean biases at each grid point of the region; the RCM increment at each grid point of the region; and the overall average of the RCM increment at each grid point of the considered region.
3. Results
3.1. Spatial Seasonal Bias and Added Value
Figure 2 depicts the spatial seasonal biases of both the driven GCMs and the RCMs outputs for the DJF season, considering CHIRPS data as the reference. The spatial seasonal bias results in DJF (Figure 2), show a southern-wise shift of the observed rain belt by CHIRPS, resulting in wet biases over South Africa for all the driving GCMs (Figure 2d–f), although pronounced with NorESM1-M (Figure 2f). These biases are also present in all the downscaled outputs (Figure 2g–l), with a higher coverage by REMO outputs (Figure 2j–l) compared to those of CCLM (Figure 2g–i) depending on the driving GCMs. Dry biases are found in HADGEM2-ES, MPI-ESM-LR, and all CCLM-based results over Southern Central Africa and are extended to Eastern South Africa for CCLM outputs. Dry biases remain dominant in the driving GCMs and result in an average bias ranging from −12.66 mm/month to 1.08 mm/month, while wet biases are major in the downscaled output with an average bias ranging from −10.24 mm/month to 96.24 mm/month. As reported in Table 2, REMO tends to report a higher wet average bias compared to CCLM when HADGEM2-ES and NorESM1-M are used as driving data. The error amplitude results tend to show an average error increase in the downscaled output, which is in the order of 10 to 20 mm/month, thus showing that the averaged bias results may have been subjected to positive and negative bias cancellation. The results from Table 2 for the DJF season also show the effect of observational uncertainties on the error amplitude, as CHIRPS-based results tends to be different from GPCC-based results by an additive factor of roughly 10 mm/month.
Figure S1 reports the AV by REMO and CCLM downscaling schemes to the driving GCMs in the DJF season, while using CHIRPS and GPCC data as references. The results show a noticeable bias reduction by CCLM (Figure S1a–f) and REMO (Figure S1g–l) RCMs over South Africa, as high AV values are reported throughout the RCMs ensemble. The systematic reduction of pronounced NorESM1-M biases is evident with a consistent positive AV pattern covering the DJF rain-belt area and the Southern part of Africa, for all the RCMs. Moreover, results by Figure S1 suggest the presence of observational uncertainties, especially over the Sahel and differences in the AV pattern, depending on the driving GCMs. These results are in line with the AV coverage (AVC) results reported in Table 3, where positive and negative AVC differences ranging from 10 to 34% are observed between CHIRPS and GPCC-based results, depending on the driving GCM.
Figure 3 reports spatial seasonal biases of both the driving GCMs and the dynamically downscaled output for the MAM season with CHIRPS data as reference. MAM season’s results (Figure 3), majorly indicate an underestimation tendency in reproducing the observed rain belt by CHIRPS. MPI-ESM-LR (Figure 3e) slightly overestimates observed precipitation over Western Central Africa and South Africa, while pronounced overestimation tendencies by NorESM1-M (Figure 3f) are persistent over Central and South Africa. Results by CCLM outputs show a typical underestimation of the MAM season’s rain belt by both ERA-INT and GCM-driven results (see Figure 3b,c,g–l), which tend to be pronounced compared to driving GCMs HADGEM2-ES (Figure 3d) and MPI-ESM-LR (Figure 3e). REMO dynamically downscaled structural biases (Figure 3c) report an overestimation pattern over Western Central Africa, the West Africa coast, and South Africa, which is evident in all the GCM-driven outputs (Figure 3g–l), with higher amplitudes over South Africa for NorESM1-M based outputs (Figure 3i,l). Underestimation tendencies are generally observed in the driving GCMs, while overestimation tendencies are depicted by the downscaled outputs as Table 2 reports an average bias ranging from −12.84 to −1.26 mm/month for the GCMs, and values ranging from 8.81 to 70.43 mm/month for the downscaled outputs.
Figure S2 depicts the AV by CCLM and REMO RCMs to the driving GCMs with CHIRPS and GPCC as reference data. In the MAM season, AV results (Figure S2) are consistent with the bias patterns from Figure 3, highlighting the net reduction of the GCM biases by NorESM1-M for the two RCMs. AV differences between CCLM (Figure S2a–f) and REMO (Figure S2g–l) are mainly found over Western Central Africa for all the simulations, and over South Africa when HADGEM2-ES (Figure S2a,d,g,j) is used as forcing. Observation-related uncertainties are also observed, especially over the Sahel region for HADGEM2-ES (Figure S2a,d,g,j) and MPI-ESM-LR (Figure S2b,e,h,k) driven RCMs’ outputs. The AVC results reported in Table 3 indicate observation-based AVC differences ranging from 6 to 30% for the coverage of positive AV over Africa. Differences between CCLM and REMO-based outputs tend to vary depending on the driving GCM. However, CCLM-based downscaled precipitation shows a higher positive AVC and a lower negative AVC compared to REMO results, regardless of the driving GCM and the reference data used.
Figure 4 shows the spatial biases of the driving GCMs and the dynamically downscaled outputs using CHIRPS data as the reference. In the JJA season (Figure 4), the observed monsoonal belt is underestimated by the driving GCMs (Figure 4d–f) with overestimation exceptions for MPI-ESM-LR (Figure 4e) and NorESM1-M (Figure 4f) over the West Africa coast and Western Central Africa. The mentioned wet biases are depicted in both CCLM and REMO simulations driven by the GCMs. However, they are marked in REMO simulations (Figure 4j–l) as a result of structural biases of the same nature which are compounded with those of the GCMs. By the same token, dry and wet biases are found along the rain belt, especially over coastal West Africa, Northern Central and East Africa, with CCLM-based outputs (Figure 4g–i). The dry biases are also present in REMO simulations (Figure 4j–l) with high amplitudes over East Africa in accordance with its reanalysis-driven results (Figure 4c). Dry biases in the driving GCMs remain present with an averaged bias ranging from −57.15 to −30.29 mm/month, which is relatively higher than the DJF and MAM season results. Table 2 reports a significant reduction of the averaged bias observed with the driving GCMs in CCLM dynamically downscaled outputs, while a slight increase is observed with REMO outputs, except for NorESM1-M-driven results. However, the spatially averaged errors by the dynamically downscaled outputs remain higher than the driving GCM ones. This contrast between the errors and the bias results is mainly due to the balance between underestimation and overestimation tendencies in downscaled outputs and particularly in CCLM-based outputs.
Figure S3 depicts AV by CCLM and REMO dynamical downscaling schemes to the driving GCMs for the JJA season, considering CHIRPS and GPCC data as references. The AV results by Figure S3 converge with findings by Figure 4 and suggest that dynamical downscaling by CCLM (Figure S3a–f) and REMO (Figure S3g–i) result in a degradation of biases by the driving GCMs, alongside the monsoonal rain belt, although sub-areas with positive AV exist. Sub-regional observational uncertainties and RCMs’ specific fingerprints are still observed; however, the general negative AV tendency is evident along the monsoonal rain belt. The AVC for positive AV is however closed or greater than 50%, especially for RCMs driven by HADGEM2-ES and MPI-ESM-LR as reported by Table 3. Observational uncertainties’ impacts on the AV results are typically observed for NorESM1-M-driven RCM results (nearly 30%) as reported in Table 3, and generally participate in the 8 to 30% difference in the AVC results.
Figure 5 shows the spatial bias of the GCMs and their dynamically downscaled outputs in the SON season, while using CHIRPS as the reference data. In the SON season (Figure 5), the observed rain band is majorly overestimated in all the simulations. Among the driving GCMs (Figure 5d–f), a misplacement of the rain belt, similar to DJF and MAM seasons, is observed with NorESM1-M (Figure 5f), while HADGEM2-ES (Figure 5d) and MPI-ESM-LR (Figure 5e) depict a less pronounced wet bias pattern. These wet biases are also present in REMO-based outputs (Figure 5j–l) but slightly reduced in CCLM-based outputs (Figure 5g–i). Dry structural biases by ERA-INT-driven CCLM (Figure 5b) and REMO outputs (Figure 5c) are persistent in the GCM driven simulations. However, for REMO downscaled outputs (Figure 5j–l), the persistence of structural biases seems to be GCM dependent. The dominance of dry biases in the GCMs’ results is further confirmed by the average bias results (Table 2) ranging from −24.28 to −4.36 mm/month. The downscaled outputs report a positive average bias ranging from −0.98 to 85.63 mm/month suggesting the dominance of wet biases. Averaged error amplitudes by CCLM and REMO in the SON season are the highest, especially when HADGEM2-ES and MPI-ESM-LR are used as boundary conditions.
Figure S4 depicts the AV by CCLM and REMO simulations to the driving GCMs, with CHIRPS and GPCC as reference data in the SON season. According to Figure S4’s results, the reduction of the driving GCMs’ biases by both REMO (Figure S4a–f) and CCLM (Figure S4g–l) is evident, particularly when driven by NorESM1-M (Figure S4c,f,i,l). GCM-driven CCLM simulations show a slightly better positive AV than REMO over coastal West Africa, especially when HADGEM2-ES and MPI-ESM-LR are used as boundary conditions. Observational uncertainties are also persistent in the SON season, especially over the Sahel and contribute to about 10 to 33% differences in AVC results for positive AV as reported in Table 3. The uncertainties’ effects on the AVC results are particularly higher (more than 30% difference) in NorESM1-M-driven results.
Overall, the results obtained for the ensemble mean of the observations products (Figure S5a,e,i,m), the driving GCMs (Figure S5b,f,j,n), and the RCMs outputs (Figure S5c,g,k,o) suggest a general improvement of the RCMs’ ensemble mean compared to the individual simulations. The RCMs’ dry and wet biases are persistent at the monsoonal rain-belt positions in MAM (Figure S5g) and JJA (Figure S5k). Such biases are pronounced over East Africa in the MAM season (Figure S5g), and over Northern Central Africa in the JJA season (Figure S5k). These findings are further confirmed in the AV results (Figure S5d,h,l,p), which depict the reduction of GCM-driven biases in the DJF (Figure S5b) and SON (Figure S5n) season in the dynamically downscaled outputs, especially over South Africa.
3.2. Sub Regional Annual Cycles, Interannual Variability and Added Value
In this section, sub-regional climatic features reproducibility by the RCMs and their driving GCMs is investigated. The analysis is performed by considering the recent subcontinental regions updates by the IPCC provided in Figure 1, with a focus on the annual cycle (Figure 6), the seasonal interannual variability (Figure 7), and the regional AV (Figure 8 and Figure 9). For the annual cycle results, only the GCMs’ ensemble mean, the individual RCMs’ ensemble mean, and the overall RCMs’ ensemble mean are considered alongside the observations and the evaluation runs driven by ERA-INT.
Over the SAH region (Figure 6a), the unimodal distribution of rainfall is well captured by most climate simulations. Observational uncertainties are depicted mainly in July, August, and September, thus explaining the observational sensitivities found over the region in the previous section. CCLM dynamically downscaled outputs overestimate the annual cycle, while REMO-based outputs underestimate it. The ensemble of all the RCMs tends to improve the individual RCMs results.
The annual cycle of rainfall over the WAH region, reported in Figure 6b, indicates that the driving GCMs show better performances in capturing the observed unimodal rainfall pattern and the related quantities. CCLM and REMO outputs driven by ERA-INT overestimate monthly rainfall quantities and tend to depict a bimodal distribution, which results in a displacement of the rainfall peak. The August peak is, however, captured by GCM-driven REMO outputs but missed in CCLM ones. The unimodal distribution is improved by the RCMs’ ensemble mean although it depicts a peak earlier in July.
The Central African cycle (Figure 6c) depicts rainfall throughout the year with higher quantities in the MAM season and the SON season. All the climate simulations capture to some extent the monthly rainfall quantities. The driving GCMs satisfactorily capture the April and the October peak, but show some deviations in the rainfall quantities. GCM-driven CCLM outputs show better performances compared to REMO. The ensemble mean of the RCMs tends to improve REMO results, and remains better than CCLM results.
Over NEAF (Figure 6d), all the climate simulations capture the annual cycle. The simulations mostly underestimate the observed monthly rainfall. For the ERA-INT-driven outputs, CCLM tends to depict better results compare to REMO. This tendency is also observed in the GCM-driven results, especially in the JJAS season, where CCLM outputs outperform REMO ones. The RCMs’ ensemble mean tends to be better than REMO simulations, but not as good as the CCLM output as it was found over CAH.
The annual cycle results in SEAF (Figure 6e) depict a good reproduction of the overall cycle and specific peaks by ERA-INT-driven simulations. Major deviations by both the driving GCMs and their dynamically downscaled outputs are observed in the MAM season and the OND season. The highest biases are observed in October. Consequently, the RCMs’ ensemble mean remains highly biased, although better than CCLM results.
Over WSAF (Figure 6f), the ensemble of simulations captures the overall annual cycle despite some discrepancies. This is true over the DJFMA season, where the peaks in January and March are not well captured. Thus, this results in a rainfall peak misplacement in March. The RCMs’ ensemble mean also misses the March peak but tends to show better results compared to both CCLM and REMO.
Similar to WSAF, ESAF’s annual cycle (Figure 6g) is well captured by all the simulations, but biases still exist in the DJFMA season. For instance, all the simulations and the RCMs’ ensemble mean miss the January peak.
The seasonal year-to-year variability results (Figure 7) further confirm the annual cycle results. As for the seasons with rainfall peaks, each sub-area tends to show higher variability in the downscaled results compared to the driving GCMs. This is the case over the SAH (Figure 7a) and WAF (Figure 7b) regions for the JJA season, over NEAF (Figure 7d) for the SON season, and over SEAF (Figure 7e), WSAF (Figure 7f), and ESAF (Figure 7g) for the DJF season. Observational uncertainties in terms of interannual variability are found over all the regions except CAF (Figure 7c) and NEAF (Figure 7d). Underestimation and overestimation of the variability is observed for the climate simulations compared to the reference datasets. The RCMs generally show higher variability compared to the driving GCMs, although some exceptions exist based on the GCM–RCM combination. This might be due to the relatively high resolution of the RCMs, compared to the GCMs.
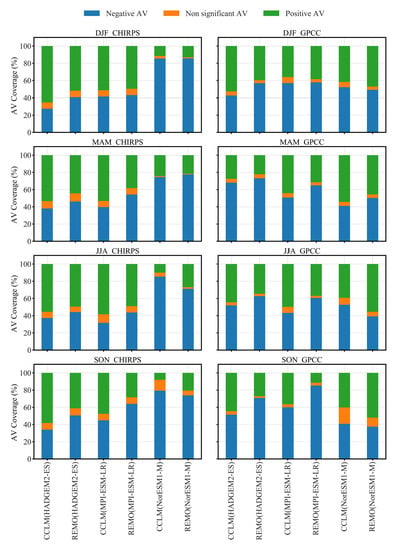
The AV coverage (AVC) results for each region and season compared to GPCC and CHIRPS datasets (Figure 8 and Figure 9) indicate observational uncertainty-related sensitivity, especially over SAH (Figure 8a–d and Figure 9a–d) and WAF (Figure 8e–h and Figure 9e–h). The AVC generally depends on the season; the driving GCM and the RCM model used. It is, however, worth mentioning the higher coverage (AVC > 50%) over SEAF (Figure 8q–t and Figure 9q–t), WSAF (Figure 8u–x and Figure 9u–x), and ESAF (Figure 8y–ab and Figure 9y–ab), for almost all the seasons. Over these regions, RCMs driven by NorESM1-M remain mostly lower (AVC<50%). REMO-based simulations tend to have the best performances over SAH (Figure 8a–d and Figure 9a–d), WAF (Figure 8e–h and Figure 9e–h), and CAF (Figure 8i–l and Figure 9i–l), while CCLM seems to be better over NEAF (Figure 8m–p and Figure 9m–p), SEAF (Figure 8q–t and Figure 9q–t), WSAF (Figure 8u–x and Figure 9u–x), and ESAF (Figure 8y–ab and Figure 9y–ab). The relatively higher number of zones where CCLM-based simulations tend to show superior results, confirm global AV results presented in Table 3, and suggest better positive AVC by CCLM-based output compared to REMO. Figure 8 and Figure 9 results, however, reinforce the Table 3 results on the fact that REMO-based simulations remain superior when driven by NorESM1-M.
3.3. Seasonal Model Contribution Analysis
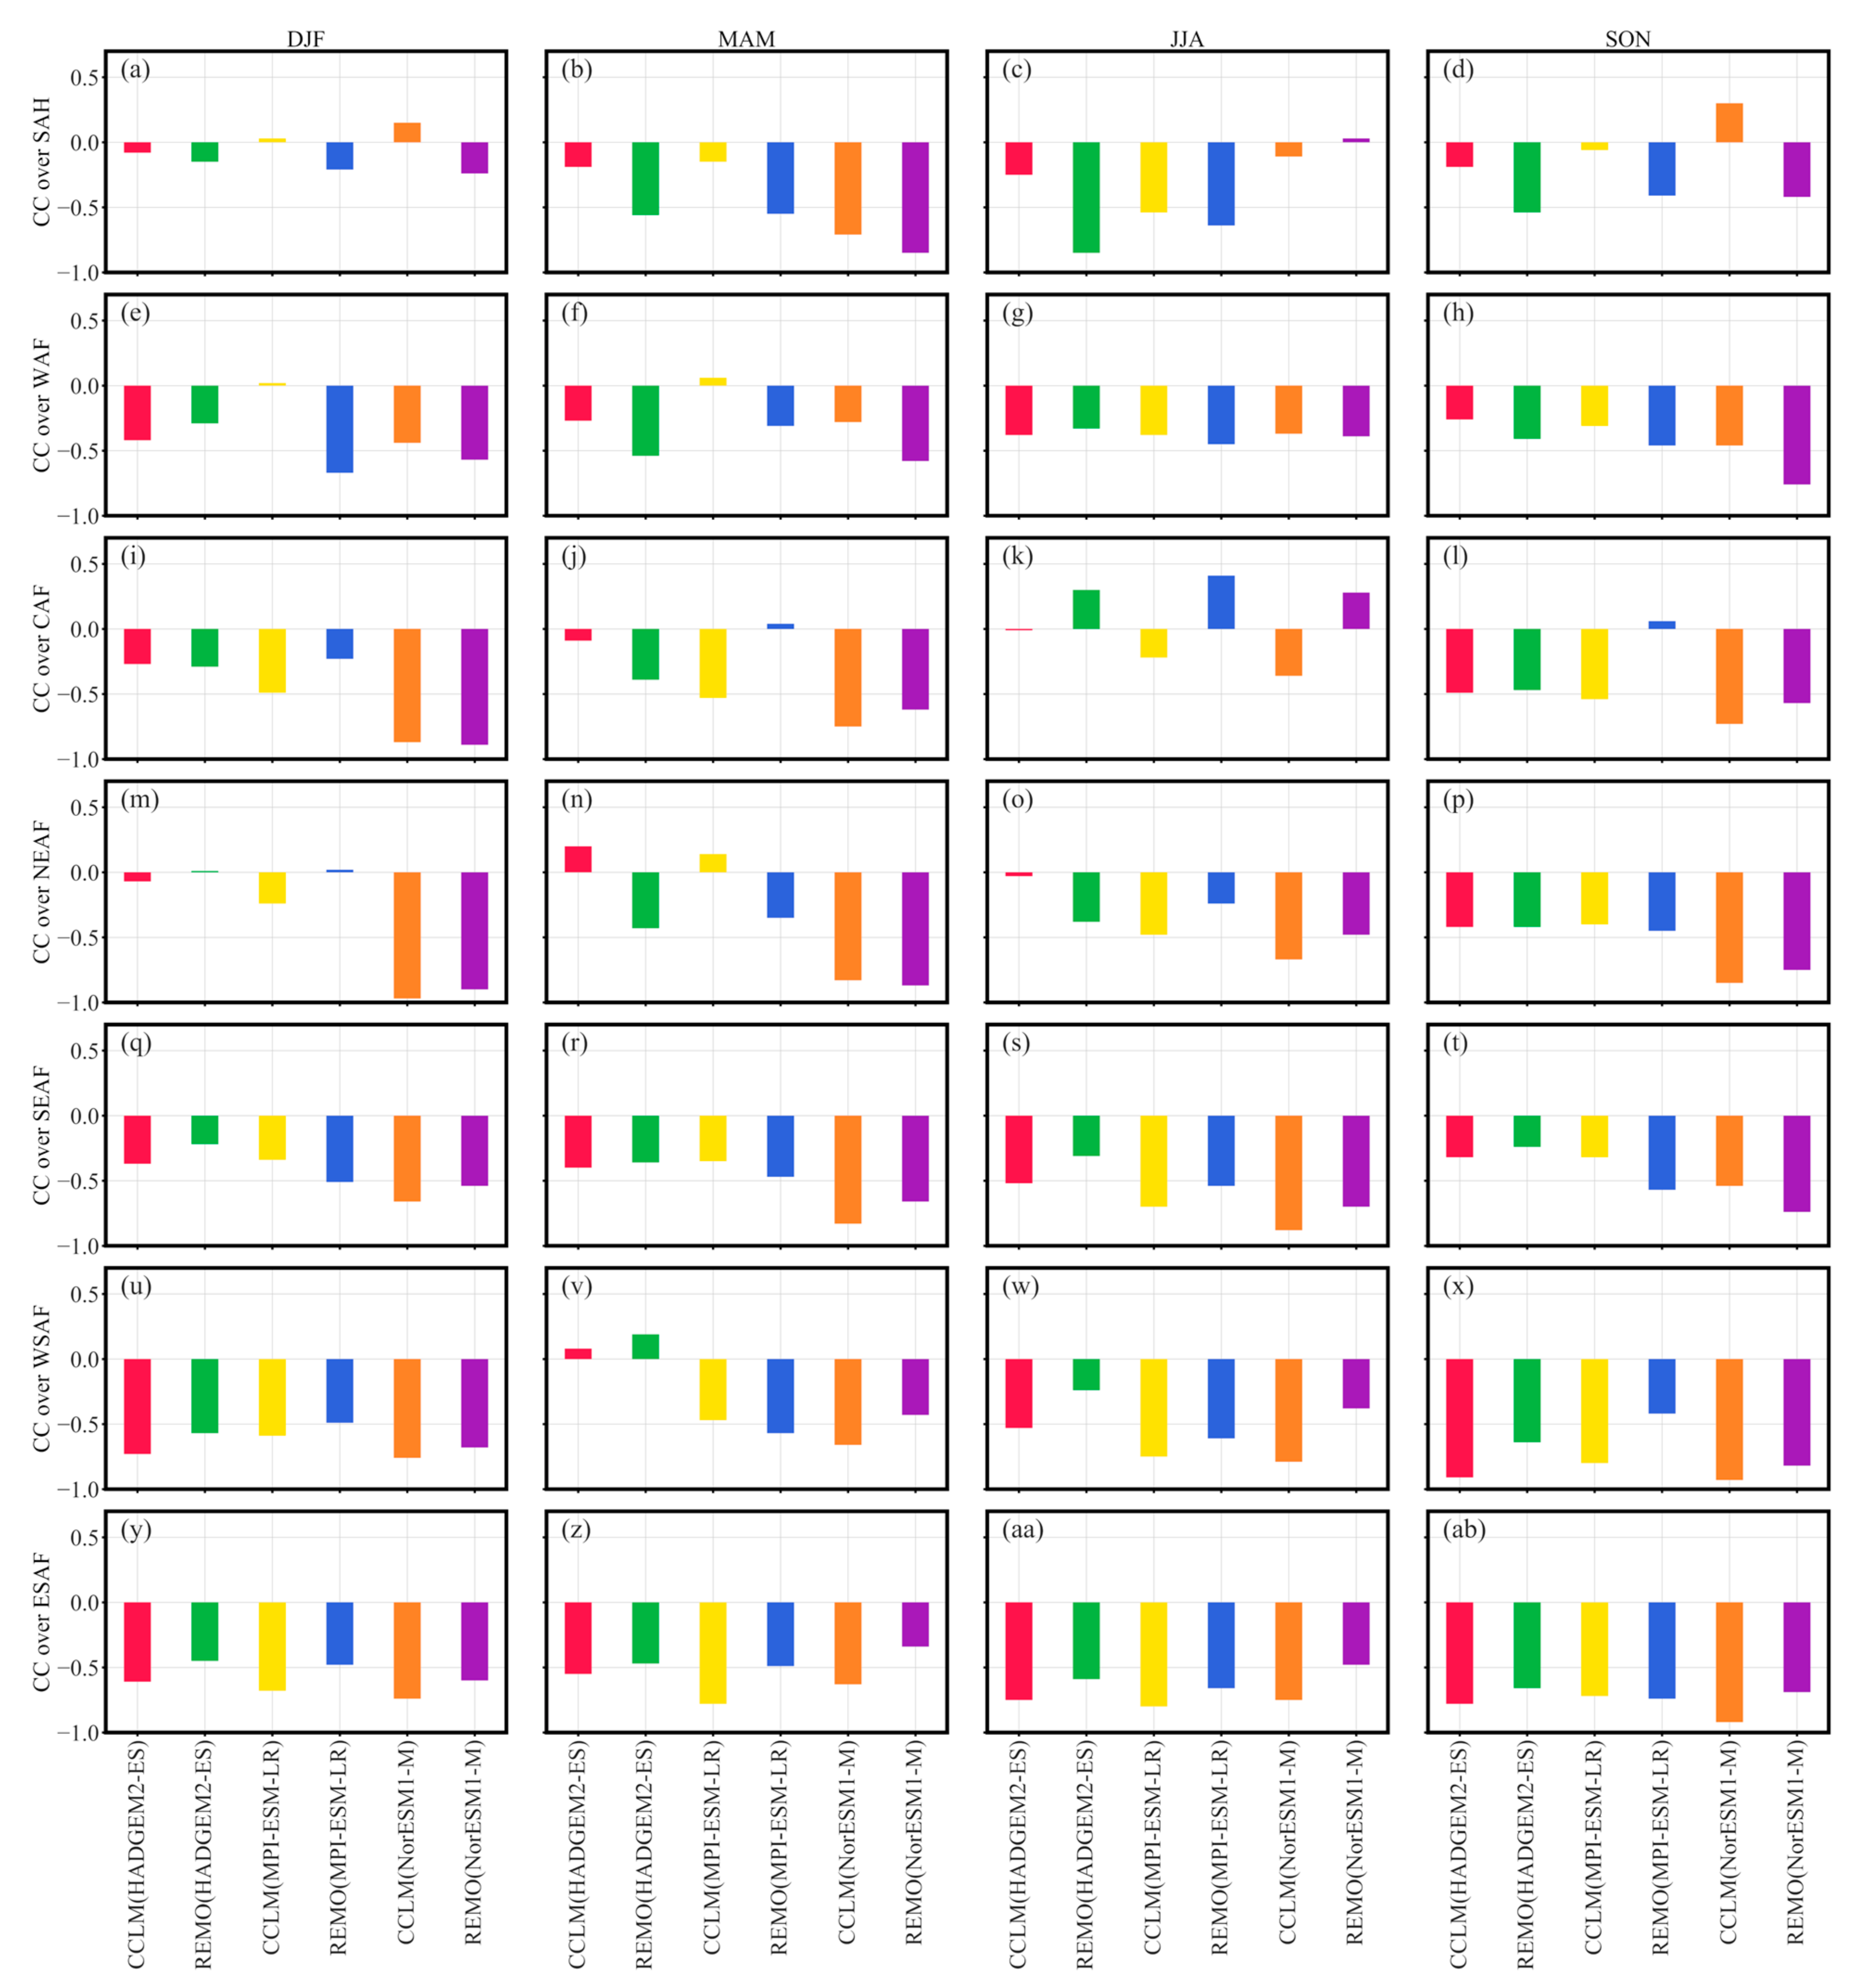
In this section, the contribution of the GCMs and the dynamical downscaling process is investigated by the means of the sign of the correlation coefficient between the GCM biases and RCM increment (RCMI). The results per seasons, RCMs, sub-regions, and reference data are shown in Figure 10 and Figure 11.
The key noticeable feature, revealed by Figure 10 and Figure 11 is the significant contribution of the dynamical downscaling to the AV results. Slight differences are found depending on the reference data used, but the relatively high impact of the RCMs on the driving GCMs is evident in all the results. This feature is predominant over SEAF (Figure 10q–t and Figure 11q–t), WSAF (Figure 10u–x and Figure 11u–x), and ESAF (Figure 10y–ab and Figure 11y–ab) sub-regions, where relatively high AVC (>50%) is observed (see Figure 8 and Figure 9). An exception to this general feature is the findings in the MAM season over WSAF (Figure 10v and Figure 11v), where HADGEM2-ES tends to influence the RCMs’ results with a positive correlation.
The influencing impact of GCMs on the RCMs’ results is frequent over NEAF, CAF, WAF, and SAH. This is the case, especially in the DJF and MAM seasons when NEAF (Figure 10m,n and Figure 11m,n), CAF (Figure 10j and Figure 11j), and WAF (Figure 10f and Figure 11f) are considered, and in JJA and SON when CAF (Figure 10k,l and Figure 11k,l) and SAH (Figure 10c,d and Figure 11c,d) are considered. These findings are, however, highly dependent on the GCM–RCM combination. Beyond the GCMs’ influencing factor, observational sensitivities are also present, especially regarding every reference data specific correlation amplitude.
Cases with zero or near zero correlation coefficients are also present, although very rare in terms of occurrences. This scenario is observed in GPCC (Figure 10) and CHIRPS (Figure 11) observational products-based results and indicates different and uncorrelated trajectories of the GCMs’ biases and the dynamically downscaled ones. However, this typical result should be taken with caution because, in the case of the HADGEM2-ES-driven CCLM result in DJF over the SAH region (Figure 10a and Figure 11a), the correlation is sensitive to the reference data used. A zero correlation is observed when GPCC is used as the reference (Figure 10a), but a negative correlation is observed when CHIRPS is used (Figure 11a). Although the interpretation of the impact of observational uncertainties on the correlation coefficient results remains difficult, one fundamental aspect that may be under looked in such a scenario is the fact that the correlation we are looking for is linear, and knowing the non-linear nature of some processes within the climate system suggest that a non-linear correlation may exist.
4. Discussion
The recent release of the CORDEX-CORE project datasets, as the response to the need for high-resolution climate data supply, is timely as the conclusions from 30 years’ worth of research in regional climate modeling [1,42] emphasized such a crucial demand. In this study, we focused on evaluating CORDEX-CORE precipitation datasets and their potential in reproducing observed Africa’s climate features and adding value to the coarse GCMs from which they have been downscaled. The mean seasonal biases from CORDEX-CORE datasets indicated a relatively good skill in capturing spatial and temporal precipitation characteristics over Africa. Unavoidable biases have been encountered depending on the different seasons and sub-areas of Africa; the relative amplitudes of the biases depicted a good caption of the seasonal African rain bands over Africa. Compared to the driving GCMs, CCLM and REMO outputs depicted a good correction of spatially misplaced rainfall bands by the GCMs, especially over South Africa, resulting in a higher AV. The spatially averaged bias results suggest a dominance of dry biases in the GCMs and wet biases in the dynamically downscaled outputs.
Dry and wet biases by the RCMs were observed in each season, especially at the rain bands positions. For these rain abundant areas, the RCMs tended to show worsened results compared to the driving GCMs, resulting in negative AV values. These dry and wet spatial biases were visible in the sub-regional annual cycles, and probably contributed to major misplacement of rainfall peaks, depending on the GCM–RCM combination. The ensemble mean of the dynamically downscaled outputs generally depicted slightly improved results compared to individual GCM–RCM simulations; although, exceptions were found in certain areas.
The sub-regional results reported year-to-year rainfall variability features in line with annual cycle results. The year-to-year variability by RCM outputs tended to be generally higher than the driving GCMs, as one could have expected, given the differences in resolutions. The variability features also depicted, in line with the annual cycle results and the spatial biases, the presence of uncertainties between GPCC and CHIRPS datasets reflected in the global and regional AV results, especially in the DJF and MAM seasons. Similar conclusions on the spatiotemporal biases, the annual cycle’s peak misplacement, the negative AV by RCMs over rain abundant areas and seasons, and the presence of observational uncertainties over Africa were previously reported in the literature [22]. The same study concluded, however, on the absence of information, on the origin of the biases especially as to whether the biases where inherited from the GCMs or introduced by the RCM signal.
The extension of the present study, to the understanding of the possible reason for such biases, by following the correlation coefficient sign-based approach by Kerkhoff et al., 2015 and Sørland et al., 2018, led to the conclusion that the AV results obtained for both CCLM and REMO are mostly the result of a significant modification of GCMs’ signals by the RCM ones, thus explaining the dry bias and wet bias gap observed from the GCMs to RCMs’ outputs. As the study proceeded by region and seasons, it appeared that the GCM signals could drive the AV results in some regions and seasons. These conclusions are, however, not exempted from the effect of observational uncertainties as the GCM bias component used for the analysis depends on the observational data, and differences in CHIRPS and GPCC data appeared to contribute to the 6 to 34% differences in positive AV coverage results by the same RCM outputs depending on the season and the forcing data.
The correlation coefficient-based attribution results could explain the strong similarities observed between the GCM-driven RCM biases and structural biases from reanalysis-driven RCM outputs, over some areas and seasons. This explanation is also valid for seasons and sub-regions where the GCM-driven RCMs tended to correct structural biases by reanalysis-driven RCM outputs, as such improvements may be due to the influence of the driving GCMs. Moreover, the variety of correlation coefficient results by the statistical attribution approach depending on the GCM–RCM matrix suggest that the AV by the RCMs may be related to how well the driving GCMs’ physics are integrated with the RCM ones, and how well the GCMs and RCMs interact in the high-resolution setting of the dynamical downscaling experiment [43].
Concerning the dynamical downscaling models used in this study, their contribution to the observed biases may be due to missing or misrepresented processes such as flow regimes, environmental effects, and land-atmosphere-ocean processes [35]. For Africa, these missing or misrepresented processes may include the monsoon processes and the deep convection [44,45].
However, it is worth mentioning that the AV discussed in this paper is specifically related to the seasonal mean and should not serve as a conclusion on the general quality of CCLM and REMO RCMs. Further AV studies targeting other key features will be crucial to infer a general conclusion. Quantitative approaches such as the one used in this study are essential. Still, as emphasized by Di Luca et al., 2015, there is a need to devote efforts towards searching for meaningful processes that are worth quantifying, especially in terms of AV.
5. Conclusions
This paper has investigated the potential of CORDEX-CORE simulations in reproducing the historical climate features observed by gauge and satellite-based observational precipitation products over Africa. We then explored the potential of CORDEX-CORE RCMs to add value to the driving GCMs from which they are derived. Beyond the AV metrics often used, we introduced a statistical attribution method to study the contribution of the driving GCMs and the dynamical downscaling approach to the AV observed. The findings of the present study suggest that CORDEX-CORE simulations CCLM and REMO can capture the rain-belt dynamics over Africa. However, unavoidable biases exist both in terms of seasonal mean quantities and year-to-year seasonal variability, and can lead to zonal misplacement of rainfall peaks, especially when considering gauge and satellite-based observational annual cycles. The results of the present studies can be summarized as follow:
- AV by CCLM and REMO simulations can be positive, negative, or non-significant (10% significance level), based on the season, the sub-area, and the GCM–RCM combination. The biases observed over rain abundant areas result in the dominance of negative AV over such areas. CCLM and REMO have shown a systematic correction potential to spatially misplaced rain bands, which contribute to a high AV, especially over Central and South Africa in some seasons.
- The regional result revealed that REMO RCM outputs reported the best performances over SAH, WAF, and CAF, while CCLM results were superior over NEAF, SEAF, WSAF, and ESAF, in terms of spatial AV coverage for all the seasons. As AV results were proven to be highly influenced by the RCM signals in the model contribution analysis, one could be confident when using this RCM for local studies and applications, where good seasonal performances are needed.
- Beyond the meaning of the model contribution analysis for the choice between RCMs and GCMs, further implications for the GCM–RCM model chains were found. For instance, the GCMs were influential to the RCMs’ outputs AV, especially in the DJF and MAM seasons. The analysis also revealed the impact of observational uncertainty on such statistical attribution approaches. It indicated, based on the mixed results obtained per season, regions, and GCM–RCM combination, that the good integration of the GCMs’ physics and the RCM ones, as well as how they both accommodate the high-resolution settings of the downscaling experiments, could be major factors of AV. However, missing and misrepresented processes in the RCMs should not be discarded.
- It is important to recall that the AV results obtained in this study are exclusively targeting seasonal mean statistics and that these results cannot be generalized. We recommend that the AV studies for climate features and statistics relevant for VIA-CS applications should be carried out both at the continental and regional level as a continuum of the AV debate. It remains important to investigate AV concerning key processes as a first step toward going beyond AV targeting general statistics.
For Africa, the unprecedented high-resolution of CORDEX-CORE RCMs, reaching satellite observational data resolutions, is a window of opportunity for more thorough assessment studies for the continent, as the availability of consistent and dense measurement networks is lacking. The generally accepted satellite-based precipitation products such as CHIRPS and other products could be used for post-processing activities such as bias correction to help correct intensity and year-to-year variability biases found in this study. Such data distillation activities at high-resolution will be of great use for climate change projections and VIA-CS applications to serve regional to local decisions.
Supplementary Materials
The following are available online at https://www.mdpi.com/article/10.3390/rs13112058/s1.
Author Contributions
Conceptualization, G.T.G., R.N. and G.T.; methodology, G.T.G., R.N. and G.T.; software, G.T.G., R.N. and G.T.; validation, R.N. and G.T.; formal analysis, G.T.G.; investigation, G.T.G. and R.N.; resources, R.N. and G.T.; data curation, G.T.G.; writing—original draft preparation, G.T.G.; writing—review and editing, I.K.N. and R.N.; visualization, G.T.G. and I.K.N.; supervision, R.N. and G.T.; project administration, R.N. and G.T.; funding acquisition, R.N. and G.T. All authors have read and agreed to the published version of the manuscript.
Funding
National Key Research and Development Program of China (2018YFC1507703 and 2016YFA0600702) and the National Natural Science Foundation of China (41575070 and 41575085) supported this work.
Institutional Review Board Statement
Not applicable.
Informed Consent Statement
Not applicable.
Data Availability Statement
Data will be provided upon request from the corresponding author.
Acknowledgments
We acknowledge the producers of CMIP5 and CORDEX-CORE precipitation datasets from the Earth System Grid Federation (ESGF) and the GPCC dataset from Deutscher Wetterdienst (DWD) and the CHIRPS dataset from the UC Sancta Barbara Climate Hazard Group. These datasets were used in accordance with their respective terms and conditions.
Conflicts of Interest
The authors declare no conflict of interest.
References
- Giorgi, F. Thirty Years of Regional Climate Modeling: Where Are We and Where Are We Going next? J. Geophys. Res. Atmos. 2019, 124, 5696–5723. [Google Scholar] [CrossRef] [Green Version]
- Giorgi, F. Producing actionable climate change information for regions: The distillation paradigm and the 3R framework. Eur. Phys. J. Plus 2020, 135, 1–15. [Google Scholar] [CrossRef]
- Tapiador, F.J.; Navarro, A.; Moreno, R.; Sánchez, J.L.; García-Ortega, E. Regional climate models: 30 years of dynamical downscaling. Atmos. Res. 2020, 235, 104785. [Google Scholar] [CrossRef]
- Rummukainen, M. Added value in regional climate modeling. Wiley Interdiscip. Rev. Clim. Chang. 2015, 7, 145–159. [Google Scholar] [CrossRef]
- Di Luca, A.; De Elía, R.; Laprise, R. Challenges in the Quest for Added Value of Regional Climate Dynamical Downscaling. Curr. Clim. Chang. Rep. 2015, 1, 10–21. [Google Scholar] [CrossRef]
- Kerkhoff, C.; Kunsch, H.R.; Schär, C. A Bayesian Hierarchical Model for Heterogeneous RCM–GCM Multimodel Ensembles. J. Clim. 2015, 28, 6249–6266. [Google Scholar] [CrossRef]
- Sørland, S.L.; Schär, C.; Luethi, D.; Kjellström, E. Bias patterns and climate change signals in GCM-RCM model chains. Environ. Res. Lett. 2018, 13, 074017. [Google Scholar] [CrossRef]
- Takle, E.S.; Gutowski, W.J.; Arritt, R.W.; Pan, Z.; Anderson, C.J.; Da Silva, R.R.; Caya, D.; Chen, S.-C.; Giorgi, F.; Christensen, J.H.; et al. Project to Intercompare Regional Climate Simulations (PIRCS): Description and initial results. J. Geophys. Res. Atmos. 1999, 104, 19443–19461. [Google Scholar] [CrossRef]
- Mearns, L.O.; Arritt, R.; Biner, S.; Bukovsky, M.S.; McGinnis, S.; Sain, S.; Caya, D.; Correia, J.; Flory, D.; Gutowski, W.; et al. The North American Regional Climate Change Assessment Program: Overview of Phase I Results. Bull. Am. Meteorol. Soc. 2012, 93, 1337–1362. [Google Scholar] [CrossRef]
- Christensen, J.H.; Carter, T.R.; Rummukainen, M.; Amanatidis, G. Evaluating the performance and utility of regional climate models: The PRUDENCE project. Clim. Chang. 2007, 81, 1–6. [Google Scholar] [CrossRef]
- van der Linden, P.; Mitchell, J.F.B. ENSEMBLES: Climate Change and its Impacts: Summary of Research and Results from the ENSEMBLES Project; Met Office Hadley Centre: Exeter, UK, 2009; ISBN 2003505539. [Google Scholar]
- Redelsperger, J.-L.; Thorncroft, C.D.; Diedhiou, A.; Lebel, T.; Parker, D.J.; Polcher, J. African Monsoon Multidisciplinary Analysis: An International Research Project and Field Campaign. Bull. Am. Meteorol. Soc. 2006, 87, 1739–1746. [Google Scholar] [CrossRef] [Green Version]
- Giorgi, F.; Jones, C.; Asrar, G. Addressing climate information needs at the regional level: The CORDEX framework. WMO Bull. 2009, 58, 175–183. [Google Scholar]
- Jones, C.; Giorgi, F.; Asrar, G. The Coordinated Regional Downscaling Experiment: CORDEX an International Downscaling Link to CMIP5; World Climate Research Programme: Geneva, Switzerland, 2011. [Google Scholar]
- Taylor, K.E.; Stouffer, R.J.; Meehl, G.A. An Overview of CMIP5 and the Experiment Design. Bull. Am. Meteorol. Soc. 2012, 93, 485–498. [Google Scholar] [CrossRef] [Green Version]
- Sylla, M.B.; Coppola, E.; Mariotti, L.; Giorgi, F.; Ruti, P.M.; Dell’Aquila, A.; Bi, X. Multiyear simulation of the African climate using a regional climate model (RegCM3) with the high resolution ERA-interim reanalysis. Clim. Dyn. 2009, 35, 231–247. [Google Scholar] [CrossRef]
- Buontempo, C.; Mathison, C.; Jones, R.; Williams, K.; Wang, C.; McSweeney, C. An ensemble climate projection for Africa. Clim. Dyn. 2014, 44, 2097–2118. [Google Scholar] [CrossRef] [Green Version]
- Akinsanola, A.; Ajayi, V.; Adejare, A.; Adeyeri, O.; Gbode, I.; Ogunjobi, K.; Nikulin, G.; Abolude, A. Evaluation of rainfall simulations over West Africa in dynamically downscaled CMIP5 global circulation models. Theor. Appl. Clim. 2018, 132, 437–450. [Google Scholar] [CrossRef]
- Gbobaniyi, E.; Sarr, A.; Sylla, M.B.; Diallo, I.; Lennard, C.; Dosio, A.; Diedhiou, A.; Kamga, A.; Klutse, N.A.B.; Hewitson, B.; et al. Climatology, annual cycle and interannual variability of precipitation and temperature in CORDEX simulations over West Africa. Int. J. Clim. 2013, 34, 2241–2257. [Google Scholar] [CrossRef]
- Ajibola, F.; Zhou, B.; Gnitou, G.T.; Onyejuruwa, A. Evaluation of the Performance of CMIP6 HighResMIP on West African Precipitation. Atmosphere 2020, 11, 1053. [Google Scholar] [CrossRef]
- Ayugi, B.; Tan, G.; Gnitou, G.T.; Ojara, M.; Ongoma, V. Historical evaluations and simulations of precipitation over East Africa from Rossby centre regional climate model. Atmospheric Res. 2020, 232, 104705. [Google Scholar] [CrossRef]
- Dosio, A.; Panitz, H.-J.; Schubert-Frisius, M.; Lüthi, D. Dynamical downscaling of CMIP5 global circulation models over CORDEX-Africa with COSMO-CLM: Evaluation over the present climate and analysis of the added value. Clim. Dyn. 2014, 44, 2637–2661. [Google Scholar] [CrossRef] [Green Version]
- Dosio, A.; Panitz, H.-J. Climate change projections for CORDEX-Africa with COSMO-CLM regional climate model and differences with the driving global climate models. Clim. Dyn. 2016, 46, 1599–1625. [Google Scholar] [CrossRef] [Green Version]
- Dosio, A.; Turner, A.G.; Tamoffo, A.T.; Sylla, M.B.; Lennard, C.; Jones, R.G.; Terray, L.; Nikulin, G.; Hewitson, B. A tale of two futures: Contrasting scenarios of future precipitation for West Africa from an ensemble of regional climate models. Environ. Res. Lett. 2020, 15, 064007. [Google Scholar] [CrossRef]
- Gibba, P.; Sylla, M.B.; Okogbue, E.C.; Gaye, A.T.; Nikiema, M.; Kebe, I. State-of-the-art climate modeling of extreme precipitation over Africa: Analysis of CORDEX added-value over CMIP5. Theor. Appl. Clim. 2018, 137, 1041–1057. [Google Scholar] [CrossRef]
- Gnitou, G.T.; Ma, T.; Tan, G.; Ayugi, B.; Nooni, I.K.; Alabdulkarim, A.; Tian, Y. Evaluation of the Rossby Centre Regional Climate Model Rainfall Simulations over West Africa Using Large-Scale Spatial and Temporal Statistical Metrics. Atmosphere 2019, 10, 802. [Google Scholar] [CrossRef] [Green Version]
- Giorgi, F.; Gutowski, W.J. Coordinated Experiments for Projections of Regional Climate Change. Curr. Clim. Chang. Rep. 2016, 2, 202–210. [Google Scholar] [CrossRef] [Green Version]
- Giorgi, F.; Gutowski, W.J. Regional Dynamical Downscaling and the CORDEX Initiative. Annu. Rev. Environ. Resour. 2015, 40, 467–490. [Google Scholar] [CrossRef]
- Gutowski, W.J., Jr.; Giorgi, F.; Timbal, B.; Frigon, A.; Jacob, D.; Kang, H.-S.; Raghavan, K.; Lee, B.; Lennard, C.; Nikulin, G.; et al. WCRP COordinated Regional Downscaling EXperiment (CORDEX): A diagnostic MIP for CMIP6. Geosci. Model Dev. 2016, 9, 4087–4095. [Google Scholar] [CrossRef] [Green Version]
- Ciarlo, J.M.; Coppola, E.; Fantini, A.; Giorgi, F.; Gao, X.; Tong, Y.; Glazer, R.H.; Alavez, J.A.T.; Sines, T.; Pichelli, E.; et al. A new spatially distributed added value index for regional climate models: The EURO-CORDEX and the CORDEX-CORE highest resolution ensembles. Clim. Dyn. 2020, 1–22. [Google Scholar] [CrossRef]
- Washington, R.; Harrison, M.; Conway, D.; Black, E.; Challinor, A.; Grimes, D.; Jones, R.; Morse, A.; Kay, G.; Todd, M. African Climate Change: Taking the Shorter Route. Bull. Am. Meteorol. Soc. 2006, 87, 1355–1366. [Google Scholar] [CrossRef]
- Iturbide, M.; Gutiérrez, J.M.; Alves, L.M.; Bedia, J.; Cerezo-Mota, R.; Cimadevilla, E.; Cofiño, A.S.; Di Luca, A.; Faria, S.H.; Gorodetskaya, I.V.; et al. An update of IPCC climate reference regions for subcontinental analysis of climate model data: Definition and aggregated datasets. Earth Syst. Sci. Data 2020, 12, 2959–2970. [Google Scholar] [CrossRef]
- Teichmann, C.; Jacob, D.; Remedio, A.R.; Remke, T.; Buntemeyer, L.; Hoffmann, P.; Kriegsmann, A.; Lierhammer, L.; Bülow, K.; Weber, T.; et al. Assessing mean climate change signals in the global CORDEX-CORE ensemble. Clim. Dyn. 2020, 1–24. [Google Scholar] [CrossRef]
- Jacob, D.; Elizalde, A.; Haensler, A.; Hagemann, S.; Kumar, P.; Podzun, R.; Rechid, D.; Remedio, A.R.; Saeed, F.; Sieck, K.; et al. Assessing the Transferability of the Regional Climate Model REMO to Different COordinated Regional Climate Downscaling EXperiment (CORDEX) Regions. Atmosphere 2012, 3, 181–199. [Google Scholar] [CrossRef] [Green Version]
- Remedio, A.R.; Teichmann, C.; Buntemeyer, L.; Sieck, K.; Weber, T.; Rechid, D.; Hoffmann, P.; Nam, C.; Kotova, L.; Jacob, D. Evaluation of New CORDEX Simulations Using an Updated Köppen–Trewartha Climate Classification. Atmosphere 2019, 10, 726. [Google Scholar] [CrossRef] [Green Version]
- Panitz, H.-J.; Dosio, A.; Büchner, M.; Lüthi, D.; Keuler, K. COSMO-CLM (CCLM) climate simulations over CORDEX-Africa domain: Analysis of the ERA-Interim driven simulations at 0.44° and 0.22° resolution. Clim. Dyn. 2013, 42, 3015–3038. [Google Scholar] [CrossRef]
- Funk, C.; Peterson, P.; Landsfeld, M.; Pedreros, D.; Verdin, J.; Shukla, S.; Husak, G.; Rowland, J.; Harrison, L.; Hoell, A.; et al. The climate hazards infrared precipitation with stations—A new environmental record for monitoring extremes. Sci. Data 2015, 2, 1–21. [Google Scholar] [CrossRef] [Green Version]
- Schneider, U.; Becker, A.; Finger, P.; Meyer-Christoffer, A.; Ziese, M. GPCC Full Data Monthly Product Version 2018 at 0.25°: Monthly Land-Surface Precipitation from Rain-Gauges Built on GTS-Based and Historical Data; Federal Ministry of Transport and Digital Infrastructure: Bonn, Germany, 2018.
- Earth System Grid Federation (ESGF). Available online: https://esgf-data.dkrz.de/projects/esgf-dkrz/ (accessed on 30 January 2021).
- Deutscher Wetterdienst (DWD). Available online: https://opendata.dwd.de/climate_environment/GPCC/html/fulldatamonthly_v2018_doi_download.html (accessed on 12 December 2020).
- Climate Hazard Infrared Precipitation with Stations (CHIRPS). Available online: https://data.chc.ucsb.edu/products/CHIRPS-2.0/ (accessed on 12 December 2020).
- Gutowski, W.J.; Ullrich, P.A.; Hall, A.; Leung, L.R.; O’Brien, T.A.; Patricola, C.M.; Arritt, R.W.; Bukovsky, M.S.; Calvin, K.V.; Feng, Z.; et al. The Ongoing Need for High-Resolution Regional Climate Models: Process Understanding and Stakeholder Information. Bull. Am. Meteorol. Soc. 2020, 101, E664–E683. [Google Scholar] [CrossRef] [Green Version]
- Hong, S.-Y.; Kanamitsu, M. Dynamical downscaling: Fundamental issues from an NWP point of view and recommendations. Asia-Pac. J. Atmos. Sci. 2014, 50, 83–104. [Google Scholar] [CrossRef]
- Sylla, M.B.; Giorgi, F.; Ruti, P.M.; Calmanti, S.; Dellaquila, A. The impact of deep convection on the West African summer monsoon climate: A regional climate model sensitivity study. Q. J. R. Meteorol. Soc. 2011, 137, 1417–1430. [Google Scholar] [CrossRef]
- Nikulin, G.; Jones, C.; Giorgi, F.; Asrar, G.; Büchner, M.; Cerezo-Mota, R.; Christensen, O.B.; Déqué, M.; Fernandez, J.; Hänsler, A.; et al. Precipitation Climatology in an Ensemble of CORDEX-Africa Regional Climate Simulations. J. Clim. 2012, 25, 6057–6078. [Google Scholar] [CrossRef] [Green Version]
Figure 1.
Topographical map of the African domain, overlaid with the updated IPCC key regions for subcontinental climate analysis [32].
Figure 1.
Topographical map of the African domain, overlaid with the updated IPCC key regions for subcontinental climate analysis [32].
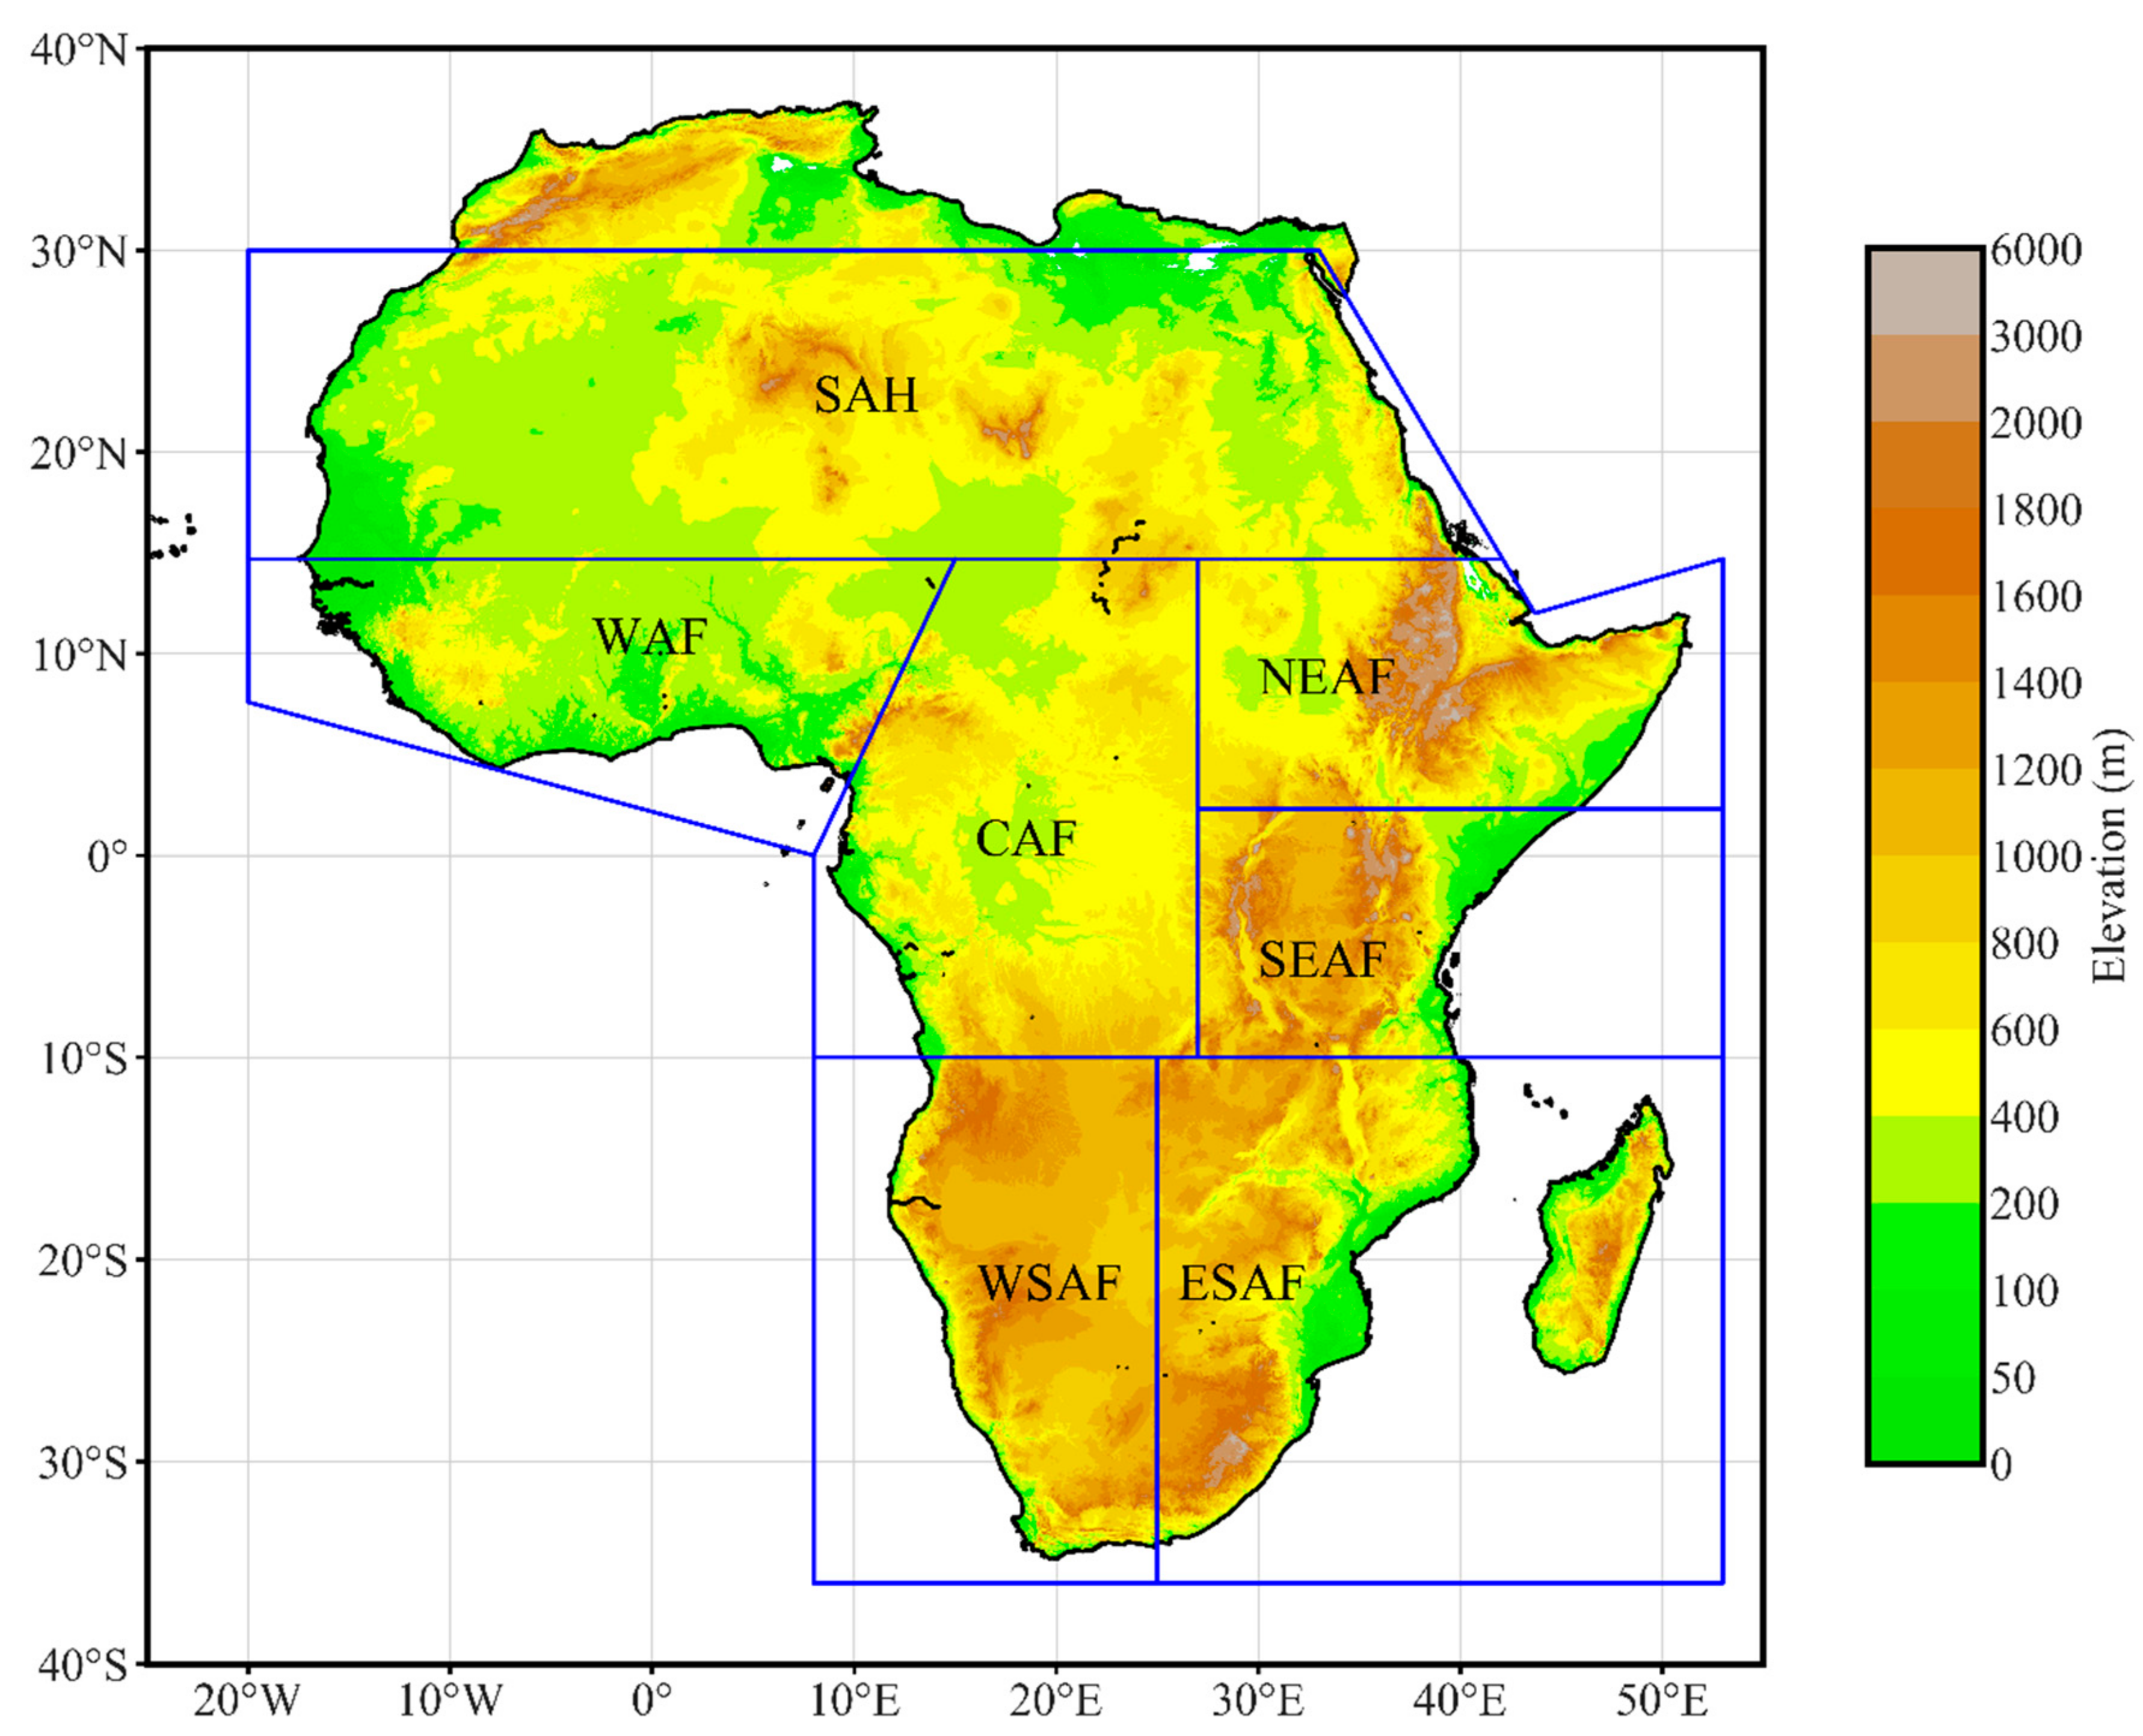
Figure 2.
Bias of monthly precipitation in DJF, compared to CHIRPS, for GCMs, CCLM, and REMO: (a) CHIRPS (b) CCLM (ERA-INT)–CHIRPS, (c) REMO (ERA–INT)-CHIRPS, (d) HadGEM2–ES–CHIRPS, (e) MPI-ESM–LR–CHIRPS, (f) NorESM1–M-CHIRPS, (g) CCLM (HadGEM2–ES)-CHIRPS, (h) CCLM (MPI–ESM–LR)–CHIRPS, (i) CCLM (NorESM1–M)–CHIRPS, (j) REMO (HadGEM2–ES)–CHIRPS, (k) REMO (MPI–ESM–LR)–CHIRPS, (l) REMO (NorESM1–M)–CHIRPS.
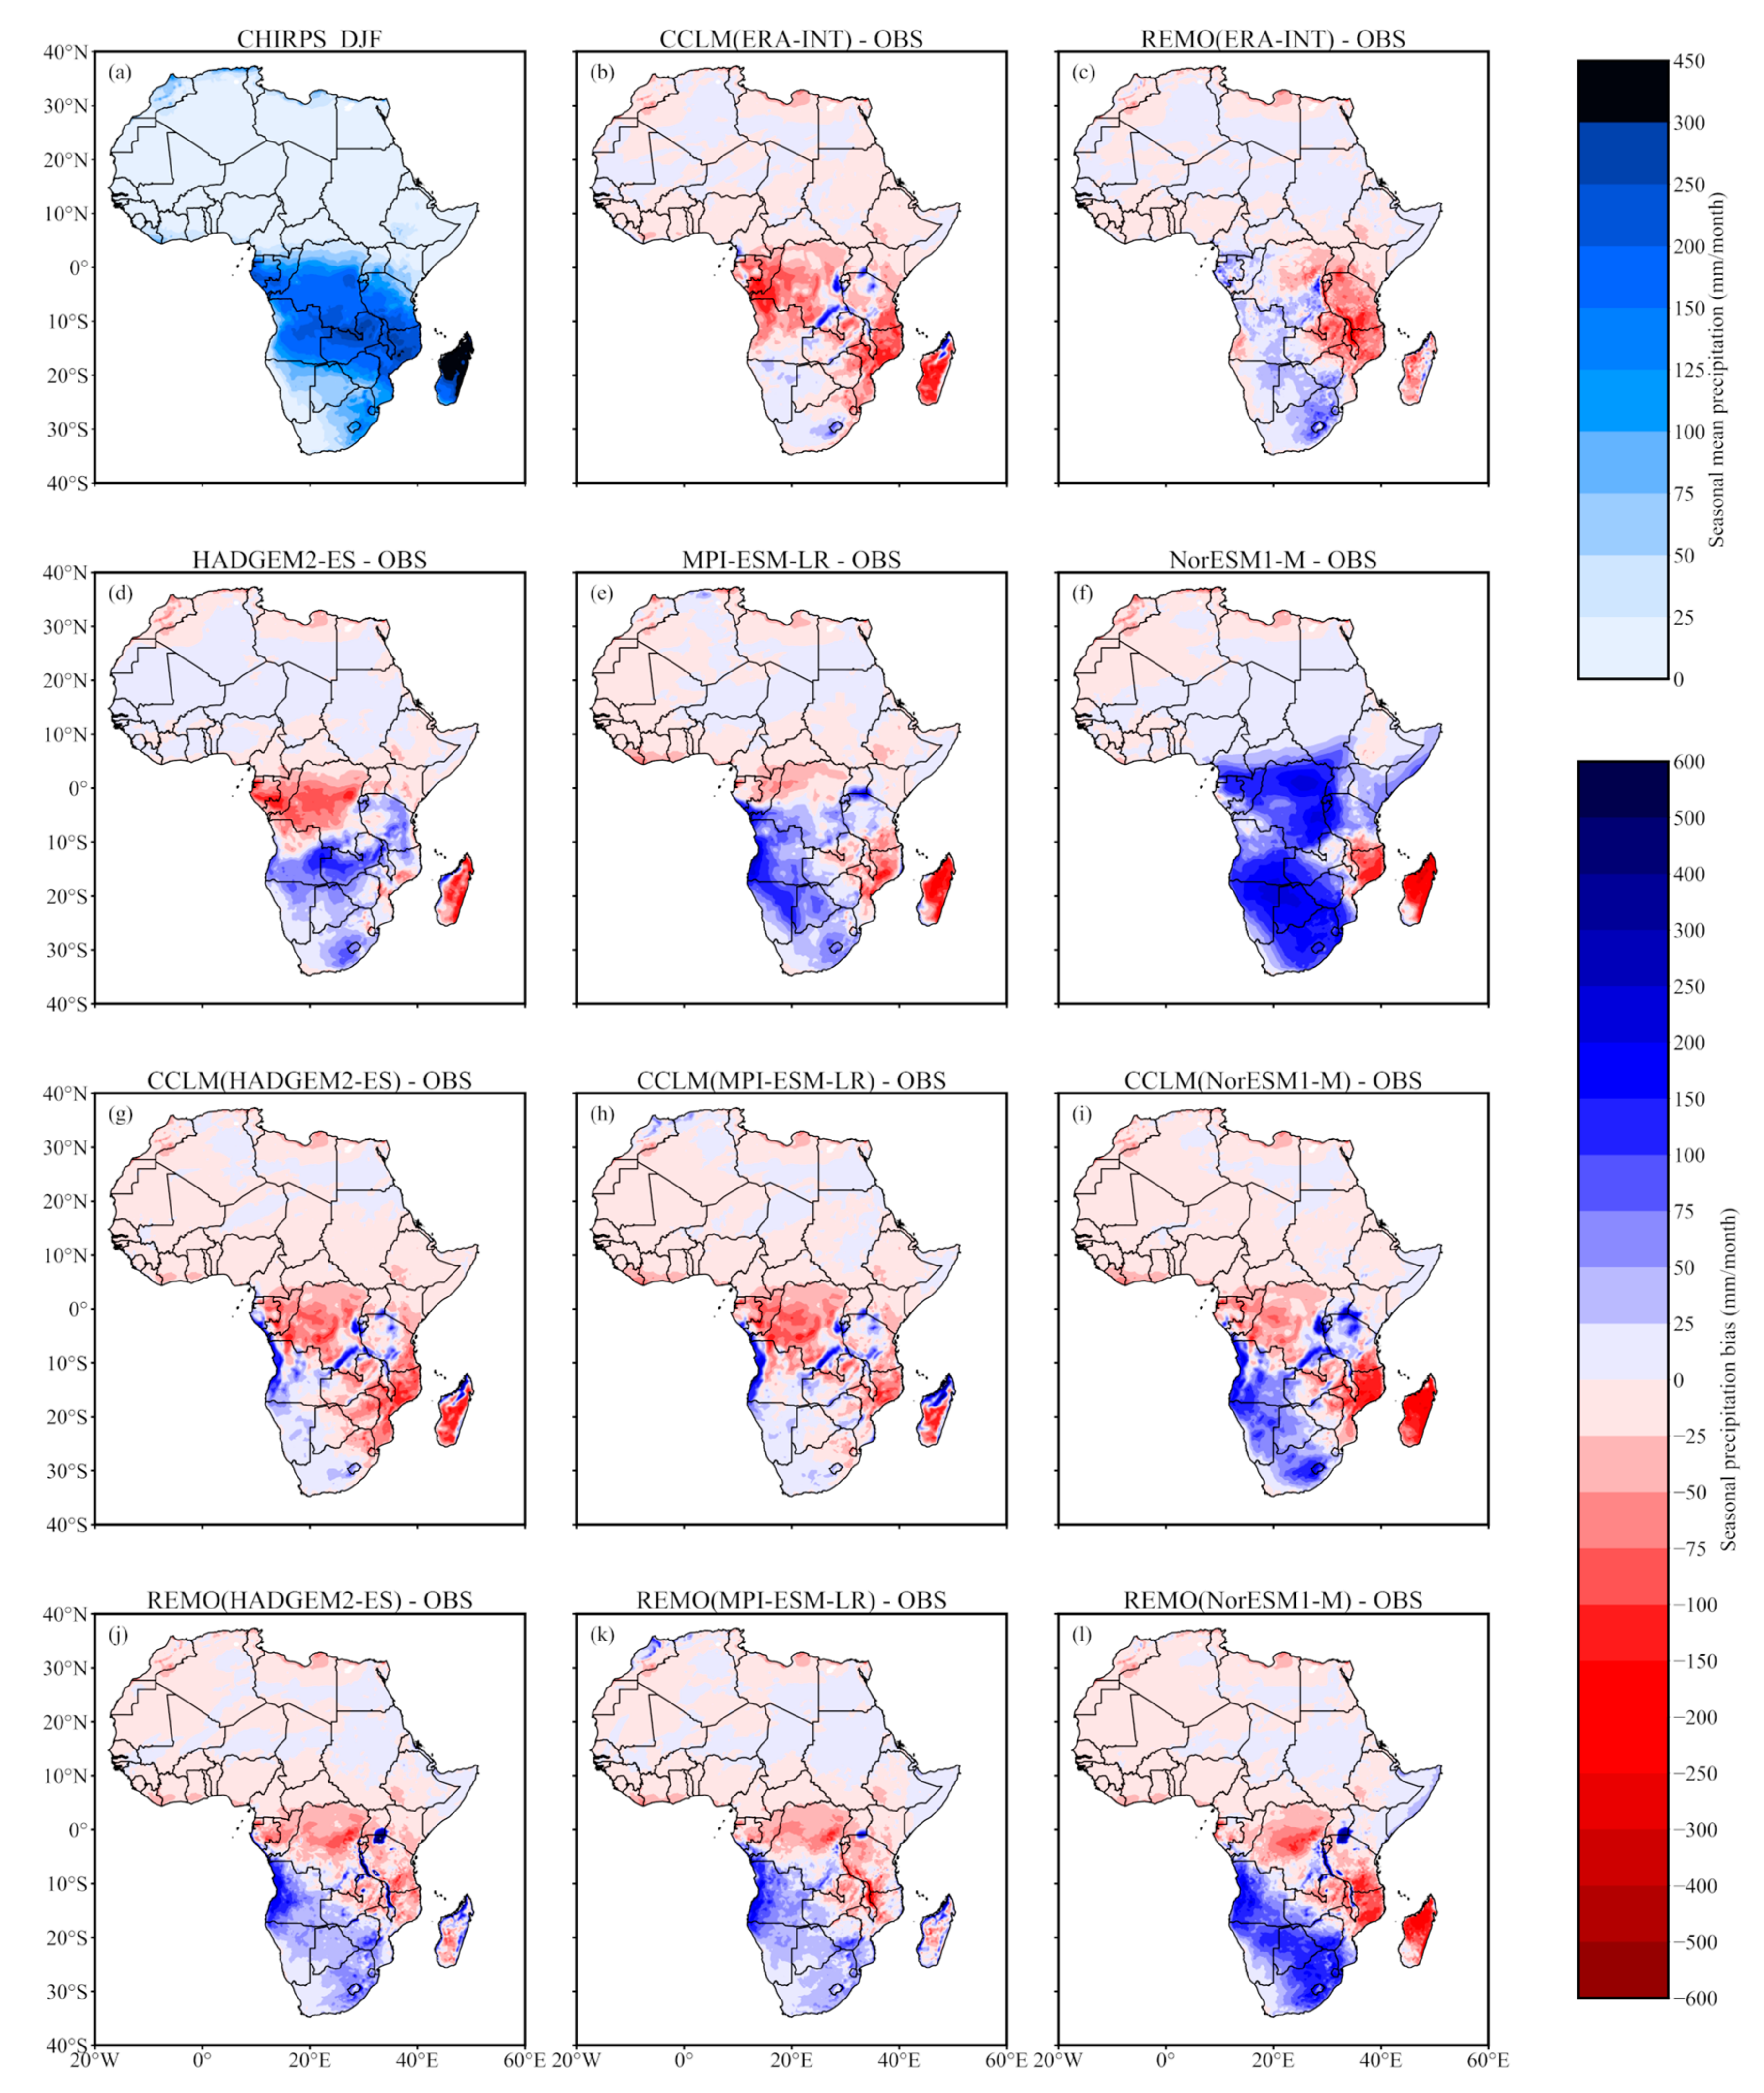
Figure 3.
Bias of monthly precipitation in MAM, compared to CHIRPS, for GCMs, CCLM, and REMO: (a) CHIRPS (b) CCLM (ERA–INT)–CHIRPS, (c) REMO (ERA-INT)-CHIRPS, (d) HadGEM2-ES-CHIRPS, (e) MPI-ESM-LR-CHIRPS, (f) NorESM1-M-CHIRPS, (g) CCLM (HadGEM2–ES)-CHIRPS, (h) CCLM (MPI–ESM–LR)-CHIRPS, (i) CCLM (NorESM1–M)–CHIRPS, (j) REMO (HadGEM2–ES)-CHIRPS, (k) REMO (MPI–ESM–LR)–CHIRPS, (l) REMO (NorESM1–M)–CHIRPS.
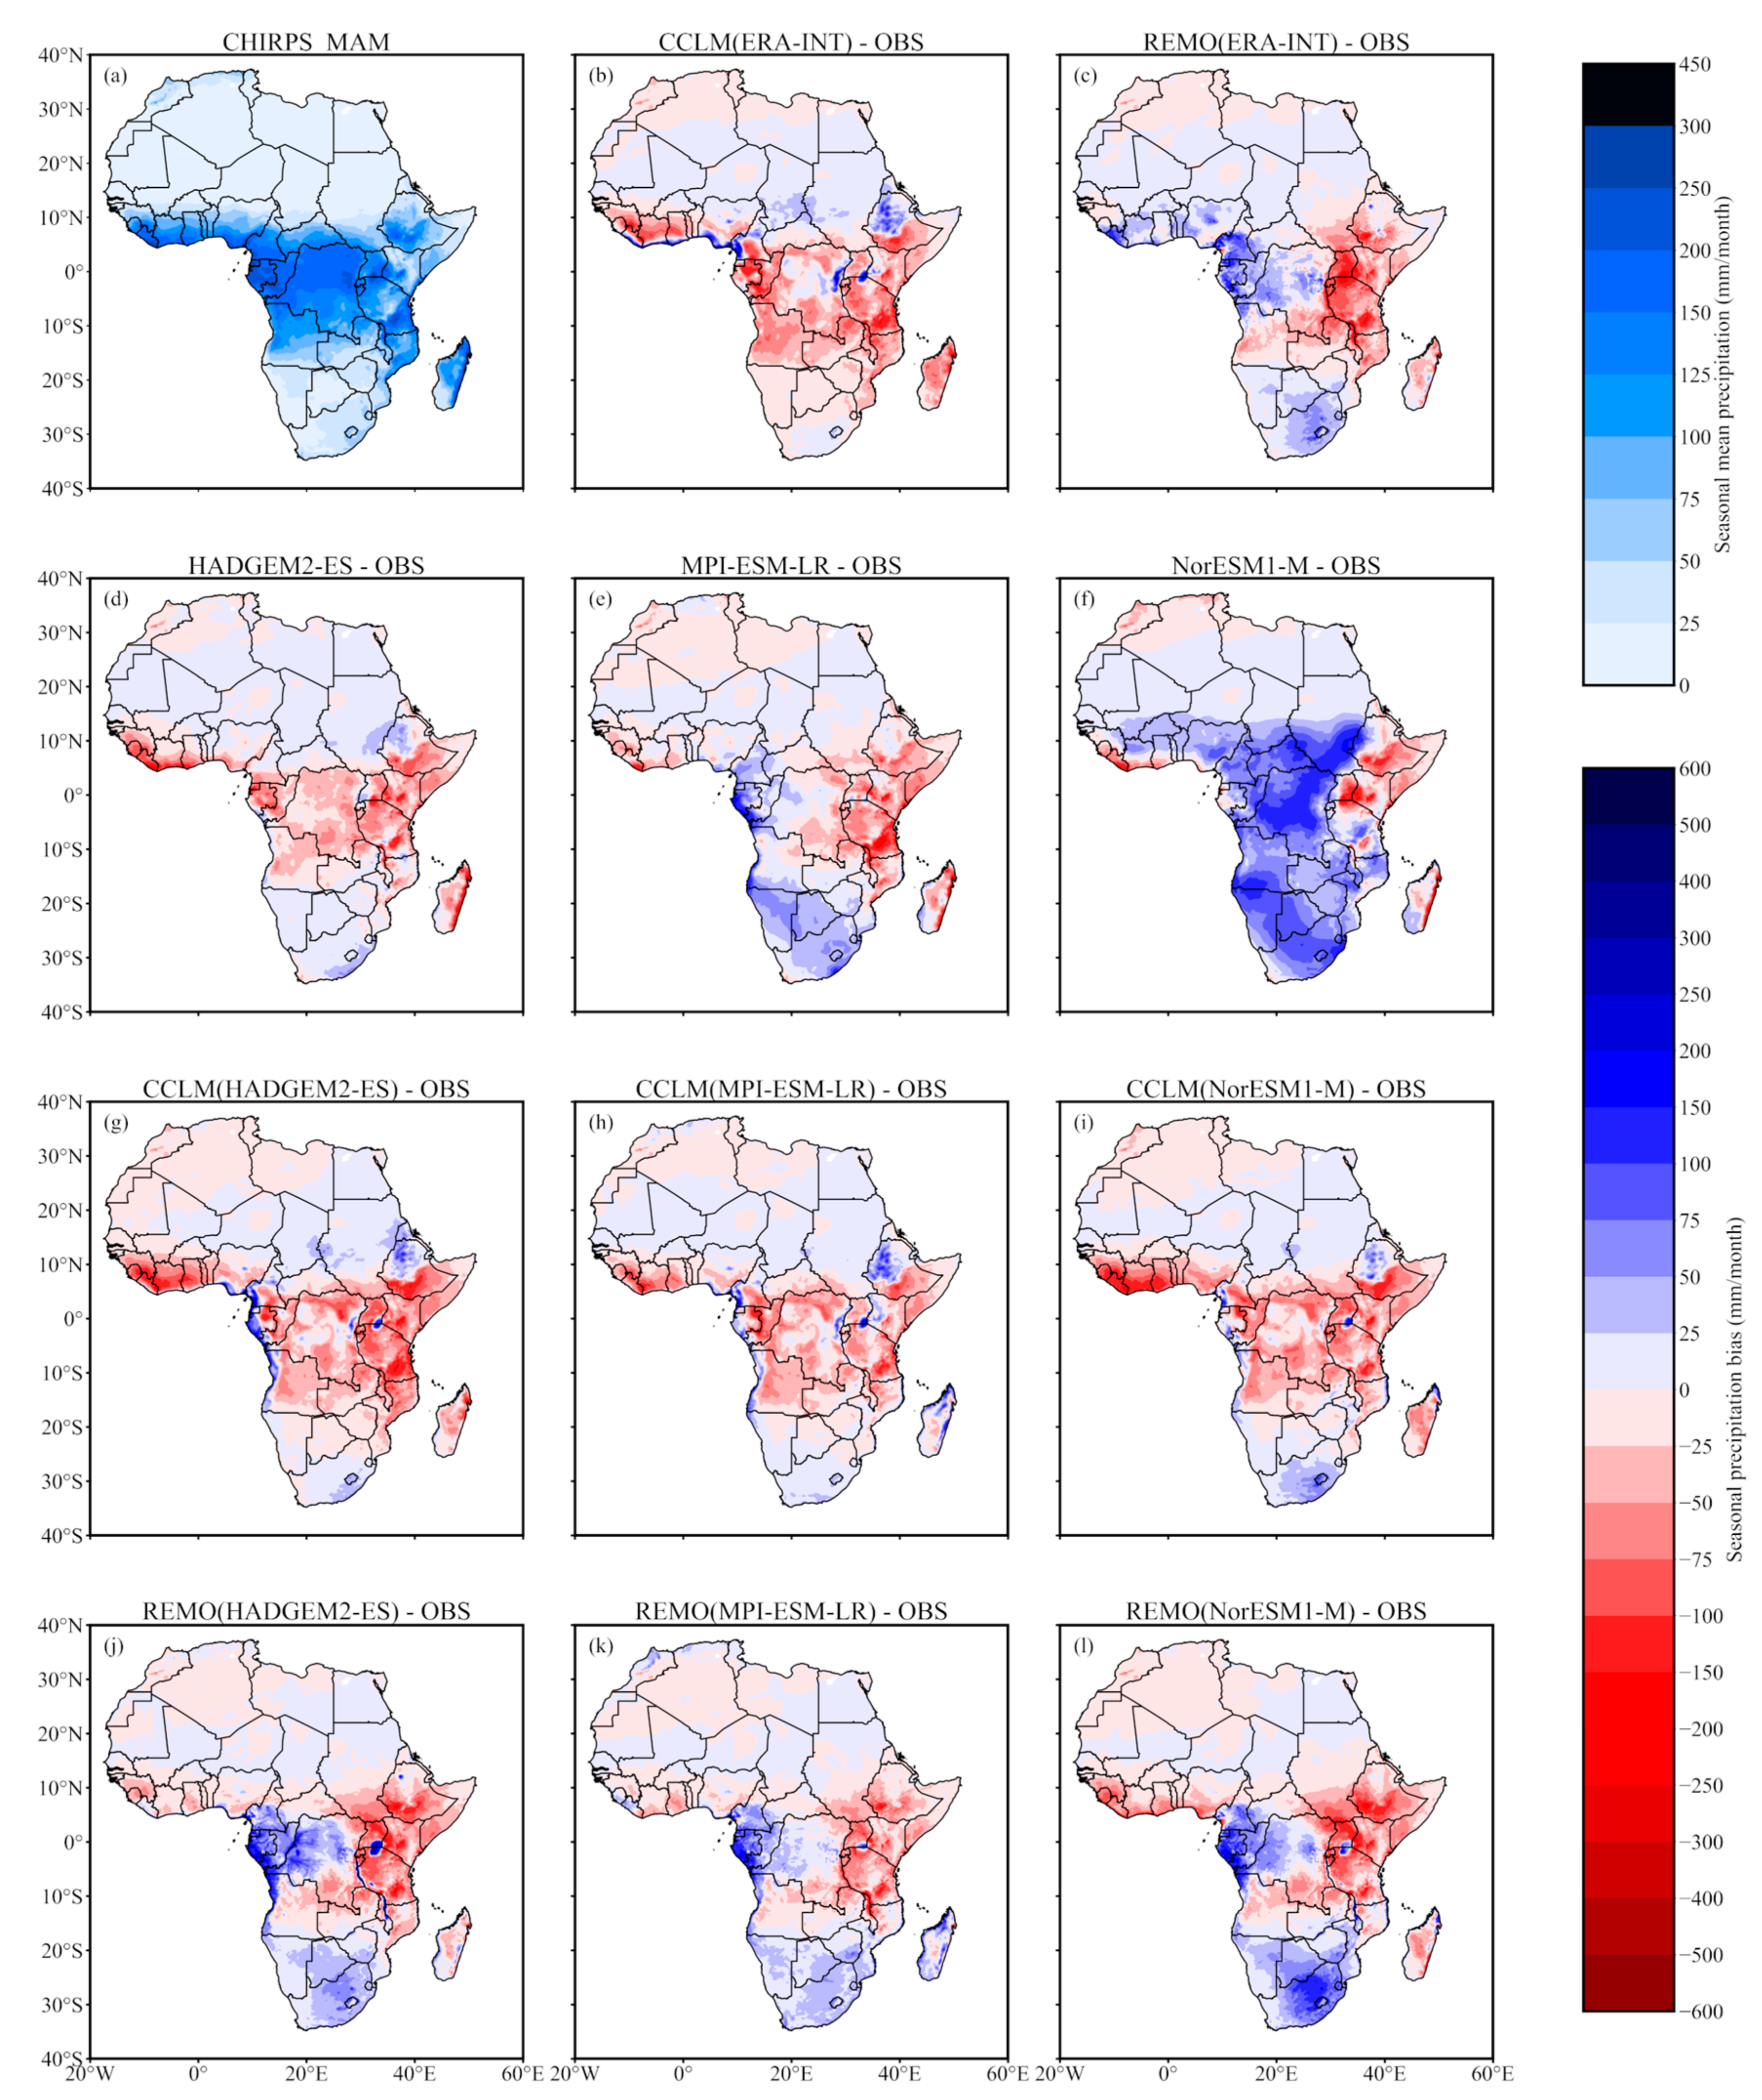
Figure 4.
Bias of monthly precipitation in JJA, compared to CHIRPS, for GCMs, CCLM, and REMO: (a) CHIRPS (b) CCLM (ERA–INT)–CHIRPS, (c) REMO (ERA–INT)-CHIRPS, (d) HadGEM2–ES–CHIRPS, (e) MPI-ESM–LR–CHIRPS, (f) NorESM1–M-CHIRPS, (g) CCLM (HadGEM2–ES)-CHIRPS, (h) CCLM (MPI–ESM–LR)-CHIRPS, (i) CCLM (NorESM1–M)–CHIRPS, (j) REMO (HadGEM2–ES)–CHIRPS, (k) REMO (MPI–ESM–LR)–CHIRPS, (l) REMO (NorESM1–M)–CHIRPS.

Figure 5.
Bias of monthly precipitation in SON, compared to CHIRPS, for GCMs, CCLM, and REMO: (a) CHIRPS (b) CCLM (ERA–INT)-CHIRPS, (c)REMO (ERA–INT)-CHIRPS, (d) HadGEM2–ES–CHIRPS, (e) MPI–ESM–LR–CHIRPS, (f) NorESM1–M-CHIRPS, (g) CCLM (HadGEM2–ES)-CHIRPS, (h) CCLM (MPI–ESM–LR)–CHIRPS, (i) CCLM (NorESM1–M)–CHIRPS, (j) REMO (HadGEM2–ES)–CHIRPS, (k) REMO (MPI–ESM–LR)–CHIRPS, (l) REMO (NorESM1–M)–CHIRPS.
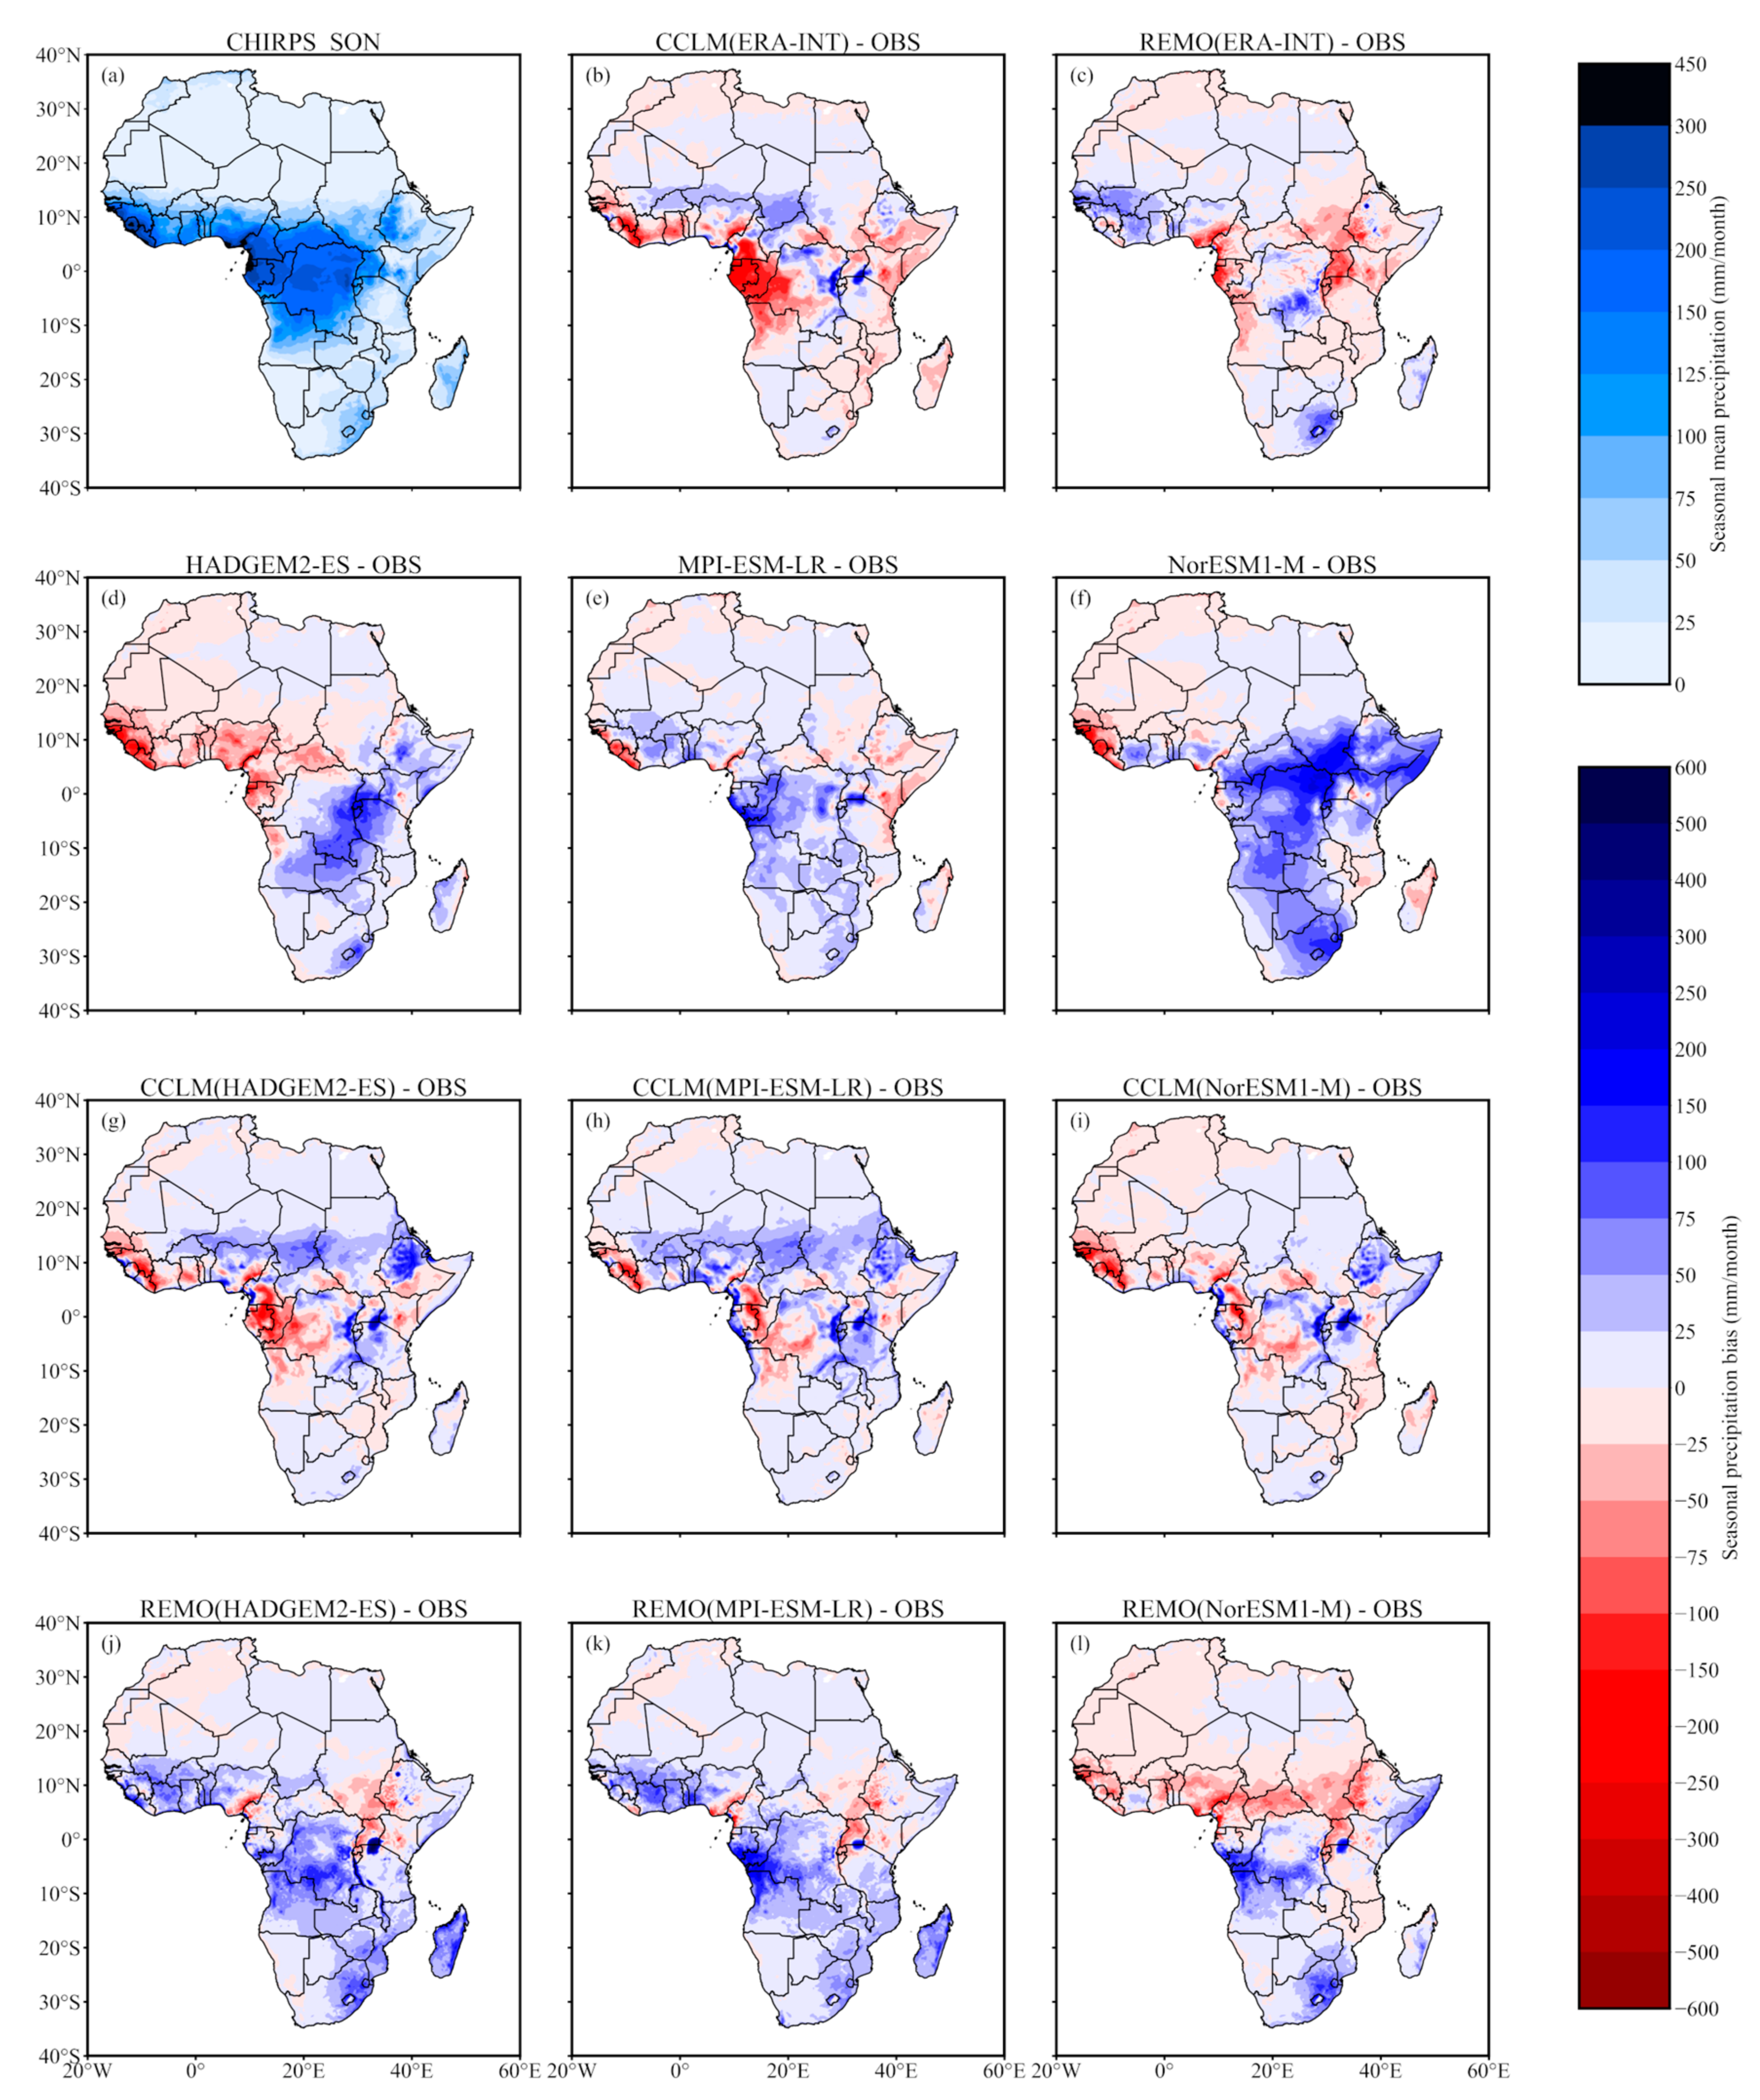
Figure 6.
Annual cycles of mean monthly precipitation (mm/month) over the regions indicated in Figure 1: (a) Sahara (SAH) region, (b) West Africa (WAF) region, (c) Central Africa (CAF) region, (d) Northern East Africa (NEAF), (e) Southern East Africa (SEAF), (f) Western South Africa, (g) Eastern South Africa (ESAF).

Figure 7.
Seasonal variability (mm/month) over the regions indicated in Figure 1: (a) Sahara (SAH) region, (b) West Africa (WAF) region, (c) Central Africa (CAF) region, (d) Northern East Africa (NEAF), (e) Southern East Africa (SEAF), (f) Western South Africa, (g) Eastern South Africa (ESAF).
Figure 7.
Seasonal variability (mm/month) over the regions indicated in Figure 1: (a) Sahara (SAH) region, (b) West Africa (WAF) region, (c) Central Africa (CAF) region, (d) Northern East Africa (NEAF), (e) Southern East Africa (SEAF), (f) Western South Africa, (g) Eastern South Africa (ESAF).
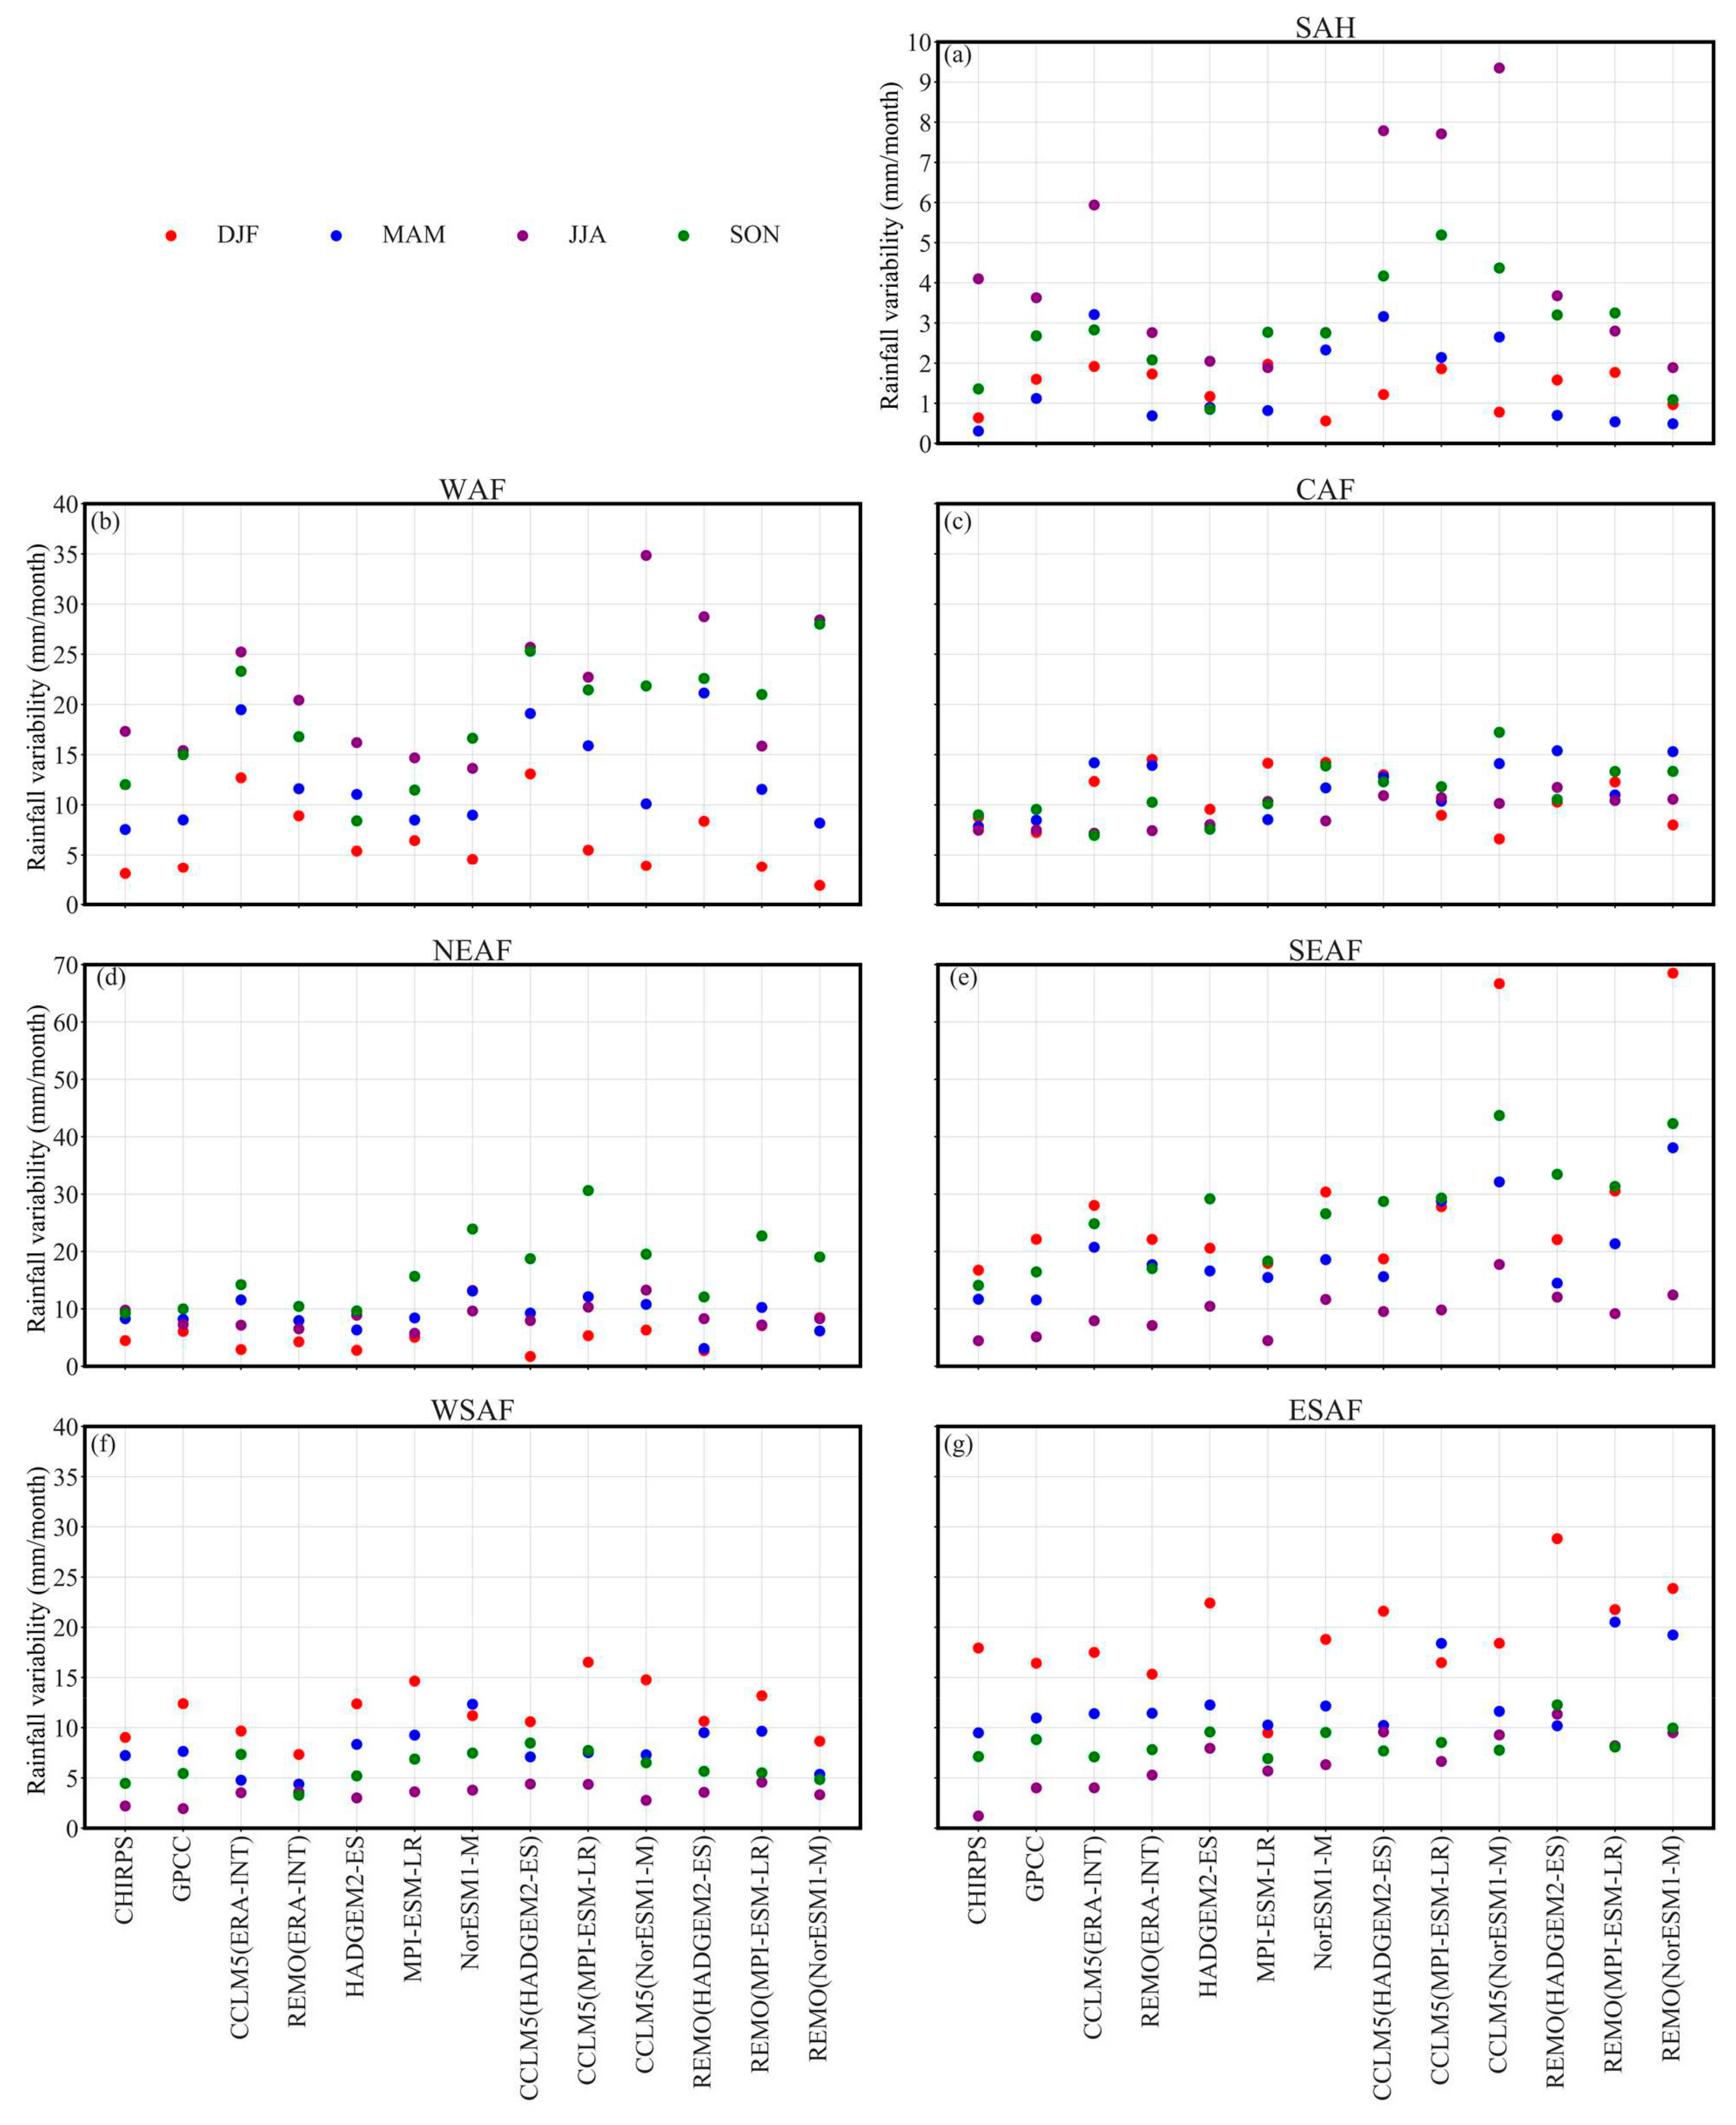
Figure 8.
Added value coverage percentage per sub-region indicated in Figure 1 with GPCC as the observational reference. (a–d) Sahara (SAH) region, (e–h) West Africa (WAF) region, (i–l) Central Africa (CAF) region, (m–p) Northern East Africa (NEAF), (q–t) Southern East Africa (SEAF), (u–x) Western South Africa, (y–ab) Eastern South Africa (ESAF).

Figure 9.
Added value coverage percentage per sub-region indicated in Figure 1 with CHIRPS as the observational reference. (a–d) Sahara (SAH) region, (e–h) West Africa (WAF) region, (i–l) Central Africa (CAF) region, (m–p) Northern East Africa (NEAF), (q–t) Southern East Africa (SEAF), (u–x) Western South Africa, (y–ab) Eastern South Africa (ESAF).

Figure 10.
Correlation coefficient between the GCM/GPCC biases and the RCM increments over the regions indicated in Figure 1: (a–d) Sahara (SAH) region, (e–h) West Africa (WAF) region, (i–l) Central Africa (CAF) region, (m–p) Northern East Africa (NEAF), (q–t) Southern East Africa (SEAF), (u–x) Western South Africa, (y–ab) Eastern South Africa (ESAF).
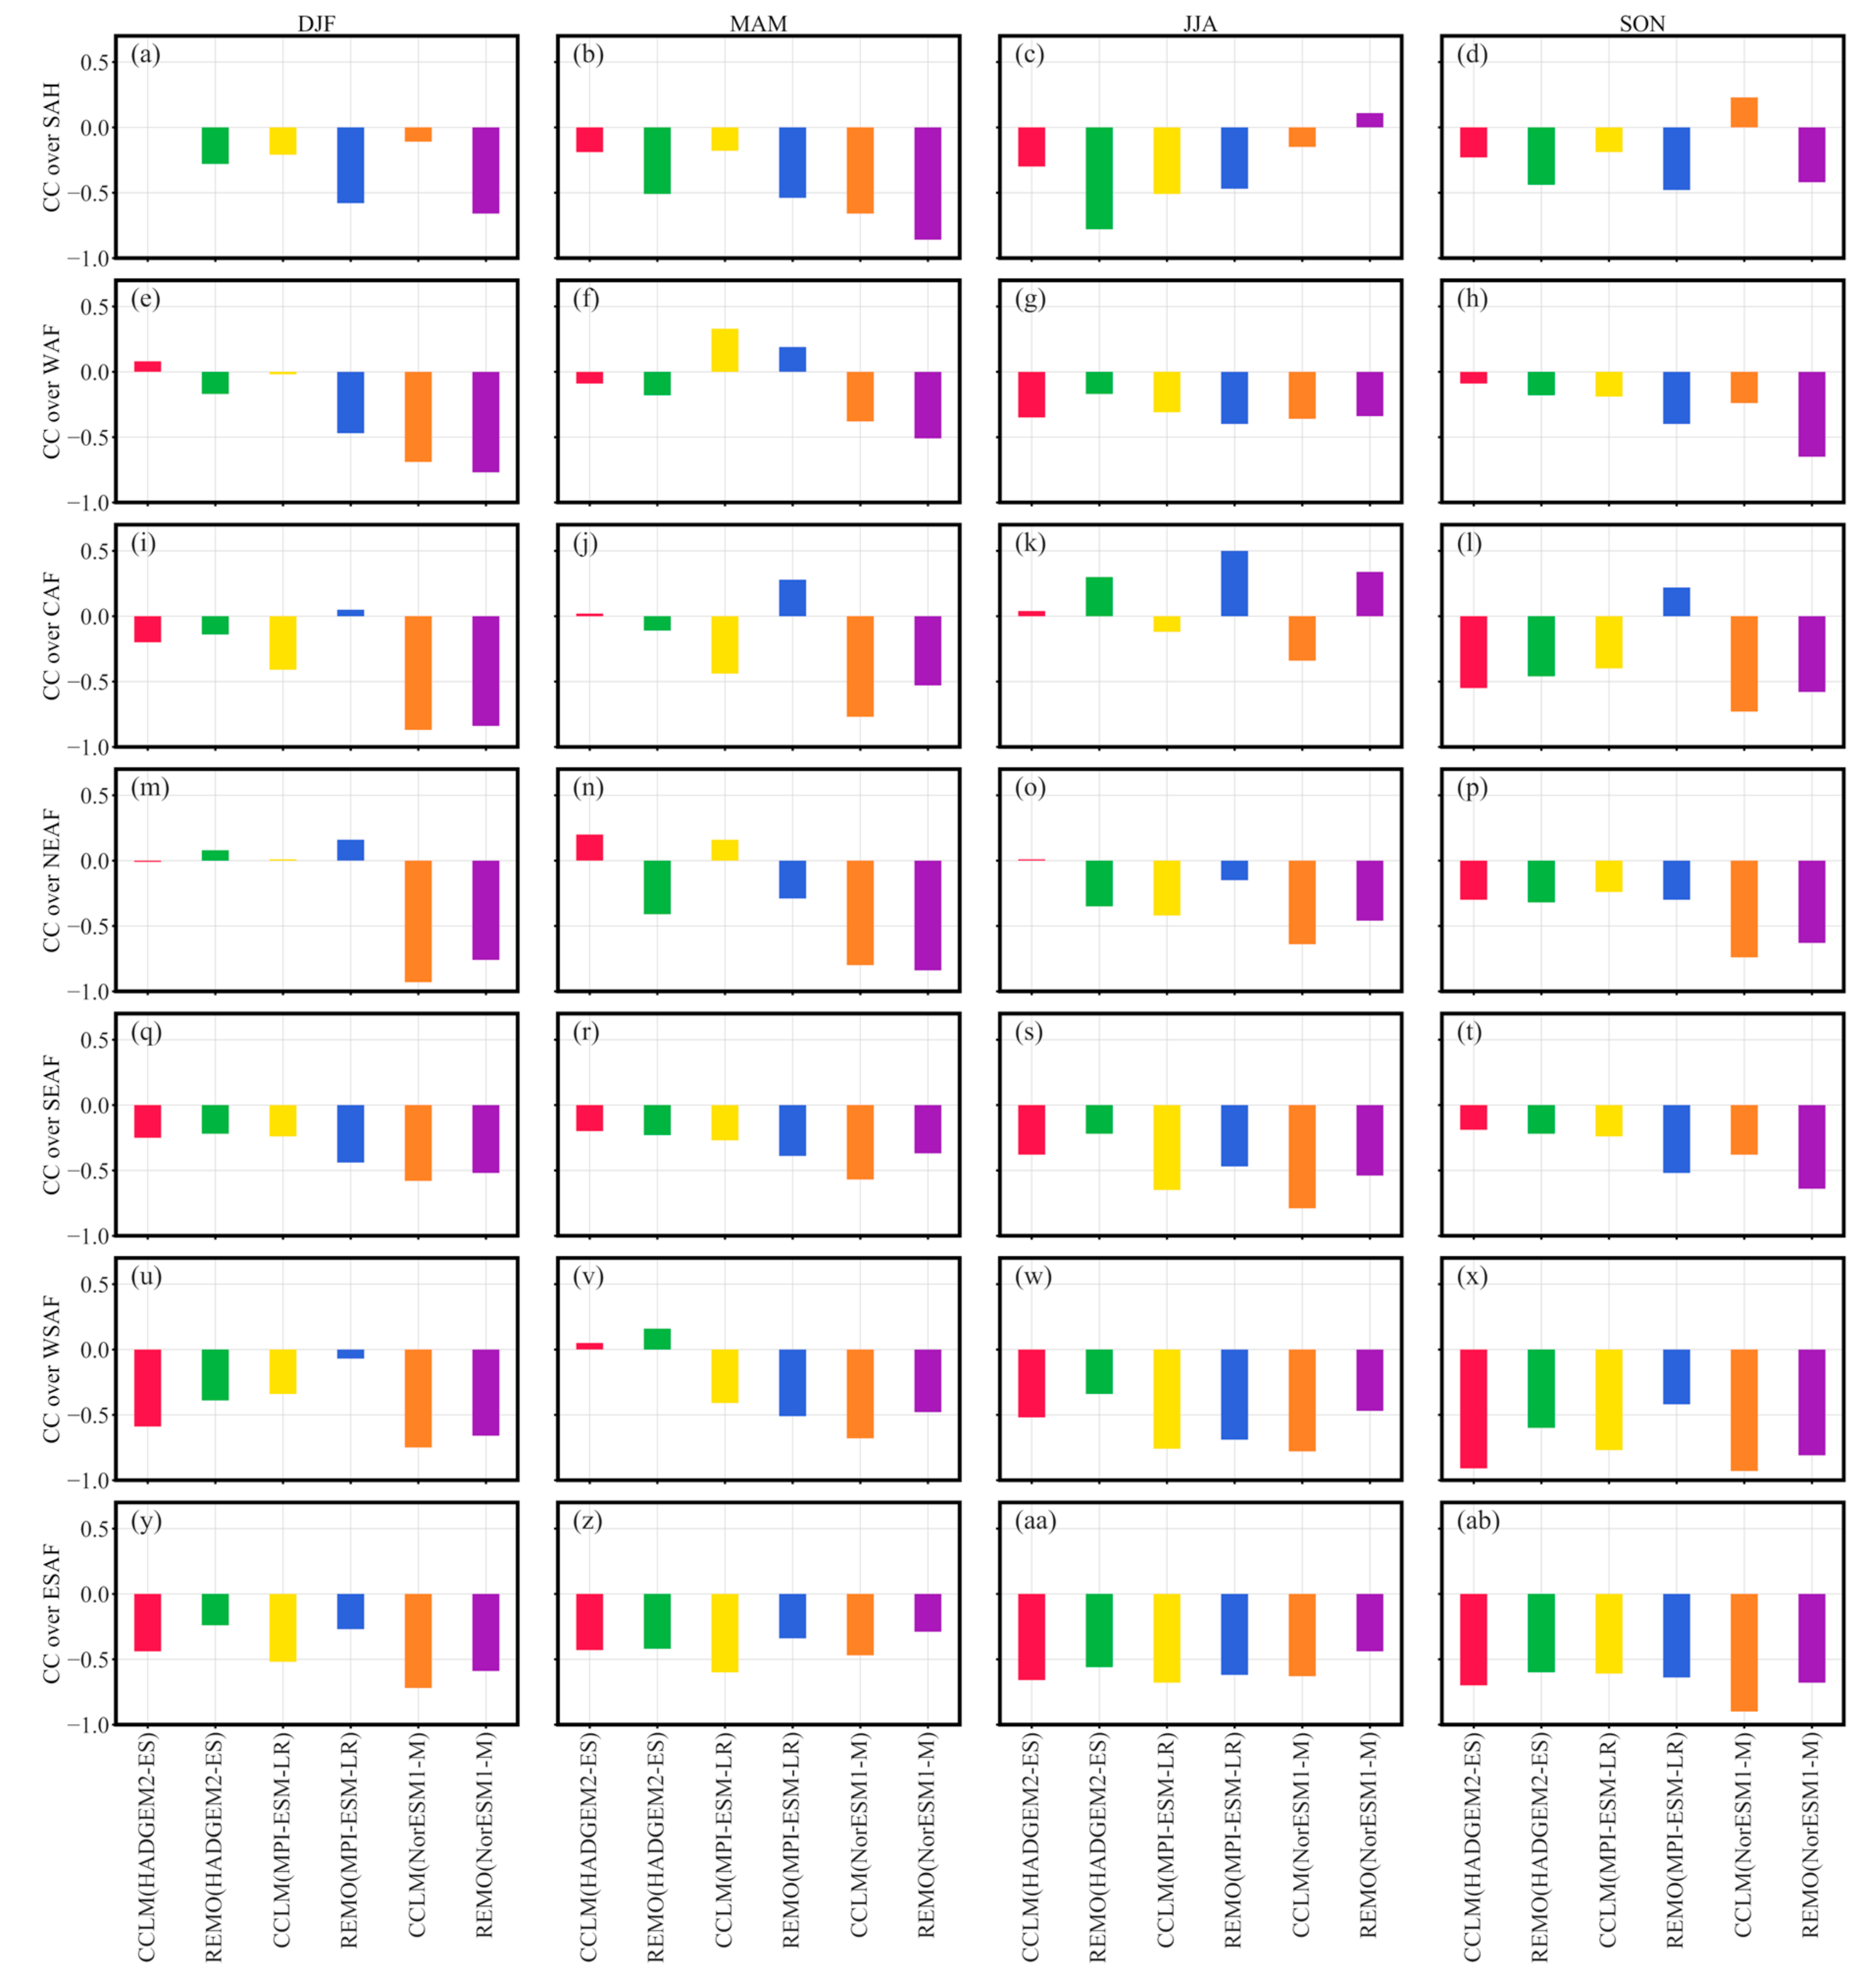
Figure 11.
Correlation coefficient between the GCM/CHIRPS biases and the RCM increments over the regions indicated in Figure 1. (a–d) Sahara (SAH) region, (e–h) West Africa (WAF) region, (i–l) Central Africa (CAF) region, (m–p) Northern East Africa (NEAF), (q–t) Southern East Africa (SEAF), (u–x) Western South Africa, (y–ab) Eastern South Africa (ESAF).

Table 1.
Regional Climate Models (RCMs) of the CORDEX-CORE ensemble, and their driving Global Climate Models (GCM) and reanalysis used in this study.
Table 1.
Regional Climate Models (RCMs) of the CORDEX-CORE ensemble, and their driving Global Climate Models (GCM) and reanalysis used in this study.
| Model Type | Name | Institution | Spatial Resolution | Vertical Levels |
|---|---|---|---|---|
| GCM | HadGEM2-ES | Met Office Hadley Centre (MOHC) | 1.25° × 1.85° | 38 |
| GCM | MPI-ESM-LR | Max Plank Institute for Meteorology (MPI-M) | 1.8653° × 1.875° | 47 |
| GCM | NorESM1-M | Norwegian Climate Centre (NCC) | 1.8947° × 2.5° | 26 |
| REANALYSIS | ERA-INTERIM | European Centre for Medium-Range Weather Forecasts (ECMWF) | 0.75° × 0.75° | 60 |
| RCM | REMO2015 | Climate Service Center Germany (GERICS) | 0.22° × 0.22° | 27 |
| RCM | CCLM5-0-15 | KIT, Karlsruhe, Germany in collaboration with the CLM-Community (CLMcom-KIT) | 0.22° × 0.22° | 35 |
Table 2.
Spatial statistics averaged over the whole African domain, considering land grid points. The statistics are provided in mm/month.
Table 2.
Spatial statistics averaged over the whole African domain, considering land grid points. The statistics are provided in mm/month.
| DJF | HadGEM2-ES | CCLM5/REMO | MPI-ESM-LR | CCLM5/REMO | NorESM1-M | CCLM5/REMO | ||||||
|---|---|---|---|---|---|---|---|---|---|---|---|---|
| CHIRPS | GPCC | CHIRPS | GPCC | CHIRPS | GPCC | CHIRPS | GPCC | CHIRPS | GPCC | CHIRPS | GPCC | |
| BIAS | −2.83 | −0.32 | 18.26/85.84 | 21.2/88.6 | −1.2 | 1.08 | 29.2/90.07 | 32.34/96.24 | −12.66 | −12.12 | −10.24/11.81 | −8.66/14.15 |
| RMSE | 47.56 | 56.02 | 53.27/58.61 | 61.61/70.49 | 46.83 | 53.73 | 54.3/60.37 | 62.56/70.96 | 60.38 | 65.98 | 55.31/64.37 | 62.58/72 |
| MAM | ||||||||||||
| BIAS | −12.84 | −12.77 | 22.35/54.77 | 26.24/58.34 | −2.7 | −2.15 | 24.47/65.24 | 28.66/70.43 | −1.26 | −1.76 | 8.81/34.52 | 11.39/38.54 |
| RMSE | 47.43 | 55.17 | 74.01/66.92 | 86.57/81.7 | 49.2 | 55.87 | 62.31/65.23 | 74.33/78.94 | 55.98 | 63.24 | 64.55/66.94 | 73.57/81.13 |
| JJA | ||||||||||||
| BIAS | −57.15 | −51.13 | −3.53/54.43 | 4.88/64.11 | −34 | −30.29 | 6.93/55.1 | 14.78/61.63 | −46.57 | −42.06 | −25.8/1.23 | −17.19/11.35 |
| RMSE | 35.43 | 37.98 | 79.36/68.68 | 93.73/82.72 | 36.79 | 41.1 | 62.89/53.09 | 72.51/61.92 | 59.35 | 60.05 | 64.16/54.69 | 70.47/62.8 |
| SON | ||||||||||||
| BIAS | −24.28 | −21.64 | 38.2/79.96 | 45.15/85.63 | −4.36 | −4.45 | 29.61/56.1 | 33.53/58.26 | −22.11 | −21.15 | −1.66/−3.55 | 2.2/−0.98 |
| RMSE | 40.75 | 48.6 | 88.16/73.29 | 105.35/90.68 | 38.28 | 46.55 | 65.26/57.44 | 77.13/69.15 | 54.63 | 58.08 | 56.47/47.86 | 65.64/55.81 |
Table 3.
Added value coverage in percentage for Africa’s land grid points at 10% significance level.
Table 3.
Added value coverage in percentage for Africa’s land grid points at 10% significance level.
| RCM Output | Negative AV | Non-Significant AV | Positive AV | |
|---|---|---|---|---|
| DJF | ||||
| CHIRPS | CCLM5/REMO(HadGEM2-ES) | 27.49/40.59 | 7.34/7.54 | 65.17/51.87 |
| CCLM5/REMO(MPI-ESM-LR) | 41.38/43.03 | 7.26/7.33 | 51.36/49.64 | |
| CCLM5/REMO(NorESM1-M) | 85.52/85.59 | 2.95/1.33 | 11.53/13.08 | |
| GPCC | CCLM5/REMO(HadGEM2-ES) | 42.52/56.87 | 4.8/3.38 | 52.68/39.75 |
| CCLM5/REMO(MPI-ESM-LR) | 56.97/57.76 | 6.96/3.71 | 36.07/38.53 | |
| CCLM5/REMO(NorESM1-M) | 52.12/49.13 | 6.16/3.82 | 41.72/47.05 | |
| MAM | ||||
| CHIRPS | CCLM5/REMO(HadGEM2-ES) | 38.02/46.13 | 8.58/9.56 | 53.39/44.31 |
| CCLM5/REMO(MPI-ESM-LR) | 39.67/54.24 | 7.08/7.43 | 53.24/38.33 | |
| CCLM5/REMO(NorESM1-M) | 74.61/77.65 | 1.12/0.86 | 24.27/21.49 | |
| GPCC | CCLM5/REMO(HadGEM2-ES) | 68.06/73.12 | 4.5/4.69 | 27.44/22.19 |
| CCLM5/REMO(MPI-ESM-LR) | 50.79/64.97 | 5.05/3.54 | 44.16/31.49 | |
| CCLM5/REMO(NorESM1-M) | 41.03/50.24 | 4.7/4.17 | 54.27/45.6 | |
| JJA | ||||
| CHIRPS | CCLM5/REMO(HadGEM2-ES) | 37.29/49.34 | 7.26/6.49 | 55.45/49.34 |
| CCLM5/REMO(MPI-ESM-LR) | 31.59/43.67 | 10.01/7.36 | 58.4/48.98 | |
| CCLM5/REMO(NorESM1-M) | 85.29/71.2 | 4.74/1.81 | 9.97/26.99 | |
| GPCC | CCLM5/REMO(HadGEM2-ES) | 51.91/62.72 | 3.6/2.78 | 44.49/35.51 |
| CCLM5/REMO(MPI-ESM-LR) | 43.17/60.63 | 7.01/2.47 | 49.82/36.9 | |
| CCLM5/REMO(NorESM1-M) | 52.68/39.13 | 8.08/5.4 | 39.25/55.47 | |
| SON | ||||
| CHIRPS | CCLM5/REMO(HadGEM2-ES) | 34.02/50.59 | 7.75/8.24 | 58.23/41.17 |
| CCLM5/REMO(MPI-ESM-LR) | 44.56/63.98 | 7.62/7.62 | 47.56/28.39 | |
| CCLM5/REMO(NorESM1-M) | 79.35/73.88 | 12.6/5.63 | 8.05/20.49 | |
| GPCC | CCLM5/REMO(HadGEM2-ES) | 51.47/70.9 | 4.03/1.93 | 44.49/27.17 |
| CCLM5/REMO(MPI-ESM-LR) | 59.99/85.27 | 3.63/3.32 | 36.38/11.41 | |
| CCLM5/REMO(NorESM1-M) | 40.81/37.42 | 19.05/10.62 | 40.14/51.95 |
Publisher’s Note: MDPI stays neutral with regard to jurisdictional claims in published maps and institutional affiliations. |
© 2021 by the authors. Licensee MDPI, Basel, Switzerland. This article is an open access article distributed under the terms and conditions of the Creative Commons Attribution (CC BY) license (https://creativecommons.org/licenses/by/4.0/).
Share and Cite
MDPI and ACS Style
Gnitou, G.T.; Tan, G.; Niu, R.; Nooni, I.K. Assessing Past Climate Biases and the Added Value of CORDEX-CORE Precipitation Simulations over Africa. Remote Sens. 2021, 13, 2058. https://doi.org/10.3390/rs13112058
AMA Style
Gnitou GT, Tan G, Niu R, Nooni IK. Assessing Past Climate Biases and the Added Value of CORDEX-CORE Precipitation Simulations over Africa. Remote Sensing. 2021; 13(11):2058. https://doi.org/10.3390/rs13112058
Chicago/Turabian StyleGnitou, Gnim Tchalim, Guirong Tan, Ruoyun Niu, and Isaac Kwesi Nooni. 2021. "Assessing Past Climate Biases and the Added Value of CORDEX-CORE Precipitation Simulations over Africa" Remote Sensing 13, no. 11: 2058. https://doi.org/10.3390/rs13112058
Note that from the first issue of 2016, this journal uses article numbers instead of page numbers. See further details here.