Technical Note

Optimization of Topdressing for Winter Wheat by Accurate Growth Monitoring and Improved Production Estimation

1
Institute of Soil Science, Chinese Academy of Sciences, Nanjing 210008, China
2
University of the Chinese Academy of Sciences, Beijing 100049, China
3
School of Plant and Environmental Sciences, Virginia Tech University, Blacksburg, VA 24061, USA
*
Author to whom correspondence should be addressed.
Remote Sens. 2021, 13(12), 2349; https://doi.org/10.3390/rs13122349
Submission received: 6 May 2021 / Revised: 11 June 2021 / Accepted: 12 June 2021 / Published: 16 June 2021
(This article belongs to the Special Issue Advances in Remote Sensing for Crop Monitoring and Yield Estimation)

Abstract

:
Topdressing accounts for approximately 40% of the total nitrogen (N) application of winter wheat on the Huang-Huai-Hai Plain in China. However, N use efficiency of topdressing is low due to the inadaptable topdressing method used by local farmers. To improve the N use efficiency of winter wheat, an optimization method for topdressing (THP) is proposed that uses unmanned aerial vehicle (UAV)-based remote sensing to accurately acquire the growth status and an improved model for growth potential estimation and optimization of N fertilizer amount for topdressing (NFT). The method was validated and compared with three other methods by a field experiment: the conventional local farmer’s method (TLF), a nitrogen fertilization optimization algorithm (NFOA) proposed by Raun and Lukina (TRL) and a simplification introduced by Li and Zhang (TLZ). It shows that when insufficient basal fertilizer was provided, the proposed method provided as much NFT as the TLF method, i.e., 25.05% or 11.88% more than the TRL and TLZ methods and increased the yields by 4.62% or 2.27%, respectively; and when sufficient basal fertilizer was provided, the THP method followed the TRL and TLZ methods to reduce NFT but maintained as much yield as the TLF method with a decrease of NFT by 4.20%. The results prove that THP could enhance crop production under insufficient N preceding conditions by prescribing more fertilizer and increase nitrogen use efficiency (NUE) by lowering the fertilizer amount when enough basal fertilizer is provided.

1. Introduction

Winter wheat is a main crop on the Huang-Huai-Hai Plain in China. Its planting area covered approximately 1.7 × 10⁷ ha between 2001 and 2016 and has shown an increasing trend in recent years [1]. In winter wheat cultivation, topdressing is a widely adopted operation to boost production in the area. Currently, the nitrogen fertilizer amount for topdressing (NFT) is still mostly decided through past experience or arbitrarily without quantitative consideration of the crop growth status [2]. Topdressing usually works well to maintain high production by providing additional nutrition for the following growing stages when the basal fertilizer is insufficient. However, there is a risk of fertilizer waste and low nitrogen use efficiency (NUE) when enough basal fertilizer has already been applied because farmers tend to apply excessive NFT to lower the risk of yield reduction due to fertilizer deficiency [3].
Given the rate uncertainty, it might be better to consider the growth status of the winter wheat crop across fields and provide an NFT based on the estimation of final yield and the NUE [2]. Some precious studies used ground-based devices to monitor crop growing status [4,5], for example, using chlorophyll meters to obtain leaf chlorophyll content, canopy analyzers to obtain canopy size, and some specialized devices such as GreenSeekerTM (Trimble Navigation Limited, Sunnyvale, CA, USA) to obtain normalized difference vegetation index (NDVI), and then developed matched topdressing methods based on the monitored crop parameters [6,7,8,9,10]. These methods greatly improve the efficiency of topdressing management, but when applied to a large area, intensive monitoring is needed to obtain detailed regional data. It is therefore labor-intensive [11].
Unmanned aerial vehicle (UAV)-based remote sensing provides a convenient approach to diagnose crop growing conditions in a quick and nondestructive way with high-quality data. Users can obtain various required infield data due to the flexibility of the UAV platform and ease of operation [12]. UAVs can be integrated with sensors of different types, such as RGB cameras, multispectral/hyperspectral cameras and LiDAR sensors, to meet different needs of monitoring [11]. In recent decades, it has been increasingly applied in nutrient monitoring and yield prediction. Matsumura [13] used two different images taken before and after the harvest period of the blue Normalized Difference Vegetation Index (BNDVI) to detect possible overfertilized areas of grassland. Zhang et al. [14] used Excess Green (ExG) colour feature extracted from a UAV-based visible image to estimate the grain yield of maize which received variable-rate N application. These researches indicated the potential of using UAV-based remote sensing in fertilizer management. Moreover, with the development in data processing, generating 3D point clouds from UAV-based images using the structure from motion (SfM) technology provides a new option to acquire height data, and it is a trend to use plant height to improve crop monitoring and yield prediction [15]. Bendig et al. [16] combined selected vegetation indices (VIs) and plant height information obtained from UAV-based multi-temporal crop surface models (CSMs) to estimate the biomass of summer barley using multiple linear regression or multiple non-linear regression models and found that the estimation performed better than using VIs alone. Furukawa et al. [17] used the corn height generated by 3D photogrammetry based on SfM to predict grain yield of corn, and achieved an R2 of 0.51 at the beginning of August, which solves the problem of NDVI saturation in the late growing stages. Therefore, it is a promising way for the wide application of topdressing optimization methods to adopt crop growth data acquired by UAV-based remote sensing [11].
After determining the crop growth status at topdressing, a potential growth trend and final production need to be predicted based on the current status, and then a suggested NFT is calculated in consideration of both the maximum possible yield and the NUE. Following this logic, numerous studies have provided optimization methods for topdressing. In researches using chlorophyll meter readings to guide topdressing, thresholds for specific cultivar in specific areas are usually pre-defined from previous experience, below which a reduction in yield occurs. When the monitored readings are below the thresholds, topdressing is applied at empirical amount [8,18,19]. Canopy size is another widely used indicator to guide topdressing. Wood et al. [9] used a target canopy green area index (GAI) to represent the growth potential, and the NFT was determined by multiplying the difference between the monitored GAI and target GAI by a canopy nitrogen requirement (CNR), where CNR is the amount of N fertilizer needed to produce unit GAI acquired from the previous research. These methods are concise and easy to operate with elimination in the calculation processes; however, to precisely evaluate the N requirements of crops, more details about the process of N uptake are needed.
The nitrogen fertilization optimization algorithm (NFOA) thoroughly presents the accumulation of N in crops and is a widely used optimization method of topdressing [20]. In this method, NFT is determined by the difference in N accumulation at topdressing and harvest, and the former is estimated from the NDVI monitored at topdressing, while the latter is estimated from a predicted grain yield (PGY). However, the prediction of grain yield has always been difficult. In previous research, PGY was replaced by the best achievable grain yields in the last 4 to 5 years within a region; however, there is a risk of overestimation and excessive topdressing [21]. Subsequent studies used in-season estimates of grain yield (INSEY) to calculate PGY. INSEY is the ratio of NDVI readings collected between Feekes 4 to 6 stages, divided by the number of days from planting where growing degree days (GDD) > 0, and it has a good exponential relationship with yield [20]. The introduction of INSEY in topdressing of winter wheat, corn and other crops improved NUE or grain yield or profit [22]. Nevertheless, these studies tend to underestimate the PGY of crops that suffered preceding nutrient stress, as they accept the assumption that N deficiency occurring in the early stages will continue to influence future development [21]. More appropriate estimation of growth potential is needed to take the increment that can be generated by topdressing into consideration.
The objectives of this study are to: (1) acquire accurate winter wheat growth status data at high spatial resolution for topdressing optimization using UAV-based remote sensing and (2) modify the assessment of the growth potential of winter wheat for topdressing optimization by precisely evaluating the increment of grain yield, which can be generated from the improvement in nutrition conditions.

2. Materials and Methods

In this study, a new topdressing method (THP) with modified assessment of the growth potential of winter wheat was proposed. THP was validated and compared with the local farmer’s method (TLF), the NFOA method (TRL), and the simplified method (TLZ) in a field experiment using real-time, high- resolution UAV-based information.

2.1. Topdressing Methods

THP is a modified topdressing method which uses a new parameter, the relative volume (RV), to estimate the growth potential. RV is a direct indicator of above-ground biomass (AGB) that makes it possible to predict the accumulation of AGB. The THP method provides more basis for the management of topdressing than methods using NDVI alone.
The calculation steps of the four topdressing methods used in this study are shown in Figure 1. For TLF, 76 kg∙N∙ha−1, fertilizer is applied to the whole field regardless of the winter wheat growth status, while for THP, TRL and TLZ, the recommendations of NFT are based on the growth status monitored by UAV-based remote sensing.

2.1.1. THP- Method Based on Improved Growth Estimation

THP used RV to estimate AGB of winter wheat at topdressing period and for further prediction of AGB at harvest, where RV is the product of plant height (H) and coverage (C). The acquisition of plant height and UAV-based information will be introduced in Section 2.3 and Section 2.4, respectively. The calculation processes are as follow. Additionally, the formulas used in the calculation processes were derived from an ancillary experiment which will be introduced in Section 2.2.
(1)
Calculation of the AGB-related parameter RV (cm):
RV = H × C / 100
where H is the plant height (cm) of winter wheat during the topdressing period and C is the coverage (%) of winter wheat extracted from UAV-based remote sensing images taken at the same time.
(2)
Estimation of AGB of winter wheat in the topdressing period (AGBt, Mg∙ha−1) from RV:
AGB t = 0.90 × ln ( RV ) 0.58
(3)
Estimation of nitrogen concentration in the aboveground part (NCA) of the topdressing period (Nt, g∙kg−1):
N t = 7.08 × e 1.31 × NDVI
(4)
The forage N uptake of the topdressing period (FNUP, kg∙ha−1) was calculated as follows:
FNUP AGB = AGB t × N t
(5)
Determination of AGB of harvest time (AGBh, Mg∙ha−1):
{ AGB h = AGB hm × AGB t / AGB m   ( AGB t AGB th ) AGB h = AGB t + AGB   ( AGB t < AGB th )
where AGBhm (13.00 Mg⋅ha−1) is the AGB at the harvest time of winter wheat, which received adequate nitrogen during the entire growing period, AGBm (2.15 Mg⋅ha−1) is the AGB during the topdressing period of winter wheat, which received adequate nitrogen before topdressing, AGBth (2.03 Mg⋅ha−1) is a threshold to judge whether winter wheat is under nitrogen deficiency during the topdressing period and AGB (10.50 Mg⋅ha−1) is the maximum increment of AGB from topdressing to harvest:
AGB = 0.9 × ( AGB hm AGB 0 )
where AGB0 (1.33 Mg⋅ha−1) is the AGB during the topdressing period of winter wheat that received no nitrogen fertilizer.
(6)
Estimation of NCA of the harvest period (Nh, g∙kg−1):
N h = 0.15 × AGB h 2 3.27 × AGB h + 27.88
(7)
Calculation of aboveground N uptake of harvest period (NUPh, kg∙ha−1):
NUP h = AGB h × N h
(8)
Recommendation of NFT (RN, kg∙N∙ha−1):
RN = ( NUP h FNUP AGB ) × 0.88
A constant of 0.88 was used to reflect the soil nitrogen supply from the topdressing to the harvest period and the nitrogen usage efficiency.

2.1.2. TRL- Method Based on Localized NFOA

This method is a localization of NFOA, as the parameters of formulas used in NFOA are acquired from the auxiliary experiment mentioned above. The calculation processes are as follows:
(1)
Calculation of INSEY:
INSEY = NDVI DAT
where DAT is the days from planting to monitoring, where growing degree days (GDD) > 0; GDD = T max + T min 2 4.4   °C, where Tmax and Tmin represent daily ambient high and low temperatures [20]. In this study, the DAT = 88d.
(2)
Estimation of PGY (Mg∙ha−1) based on current nutritional status:
PGY = 0.66 × e 235.43 × INSEY
(3)
Estimation of FNUP from NDVI (FNUPNDVI, kg∙ha−1):
FNUP NDVI = 1.03 × e 4.50 × NDVI
(4)
Calculation of the aboveground biomass at harvest (AGBh, Mg∙ha−1):
AGB h = 2.00 × PGY
A constant of 2.00 is used because the grain yield accounts for half of the AGBh [19,20]. The following steps are the same as those in THP. We used NUPh to replace the grain N uptake (GNUP) used in NFOA because the straw was removed in this cropping system. The nitrogen in straw should also be considered.

2.1.3. TLZ- Method Based on Simplified Estimation of Nitrogen Uptake

This method calculates NFT directly from NDVI monitored during the topdressing period, and the calculation processes are as follows:
(1)
Estimation of the N uptake from topdressing to harvest period (∆NUP, kg∙ha−1):
NUP = 67.75 × NDVI 2 + 55.51 × NDVI + 80.45
(2)
Recommendation of NFT (RN, kg∙N∙ha−1):
RN LZ = NUP × 0.88
The parameters were also acquired from the ancillary experiment introduced above.

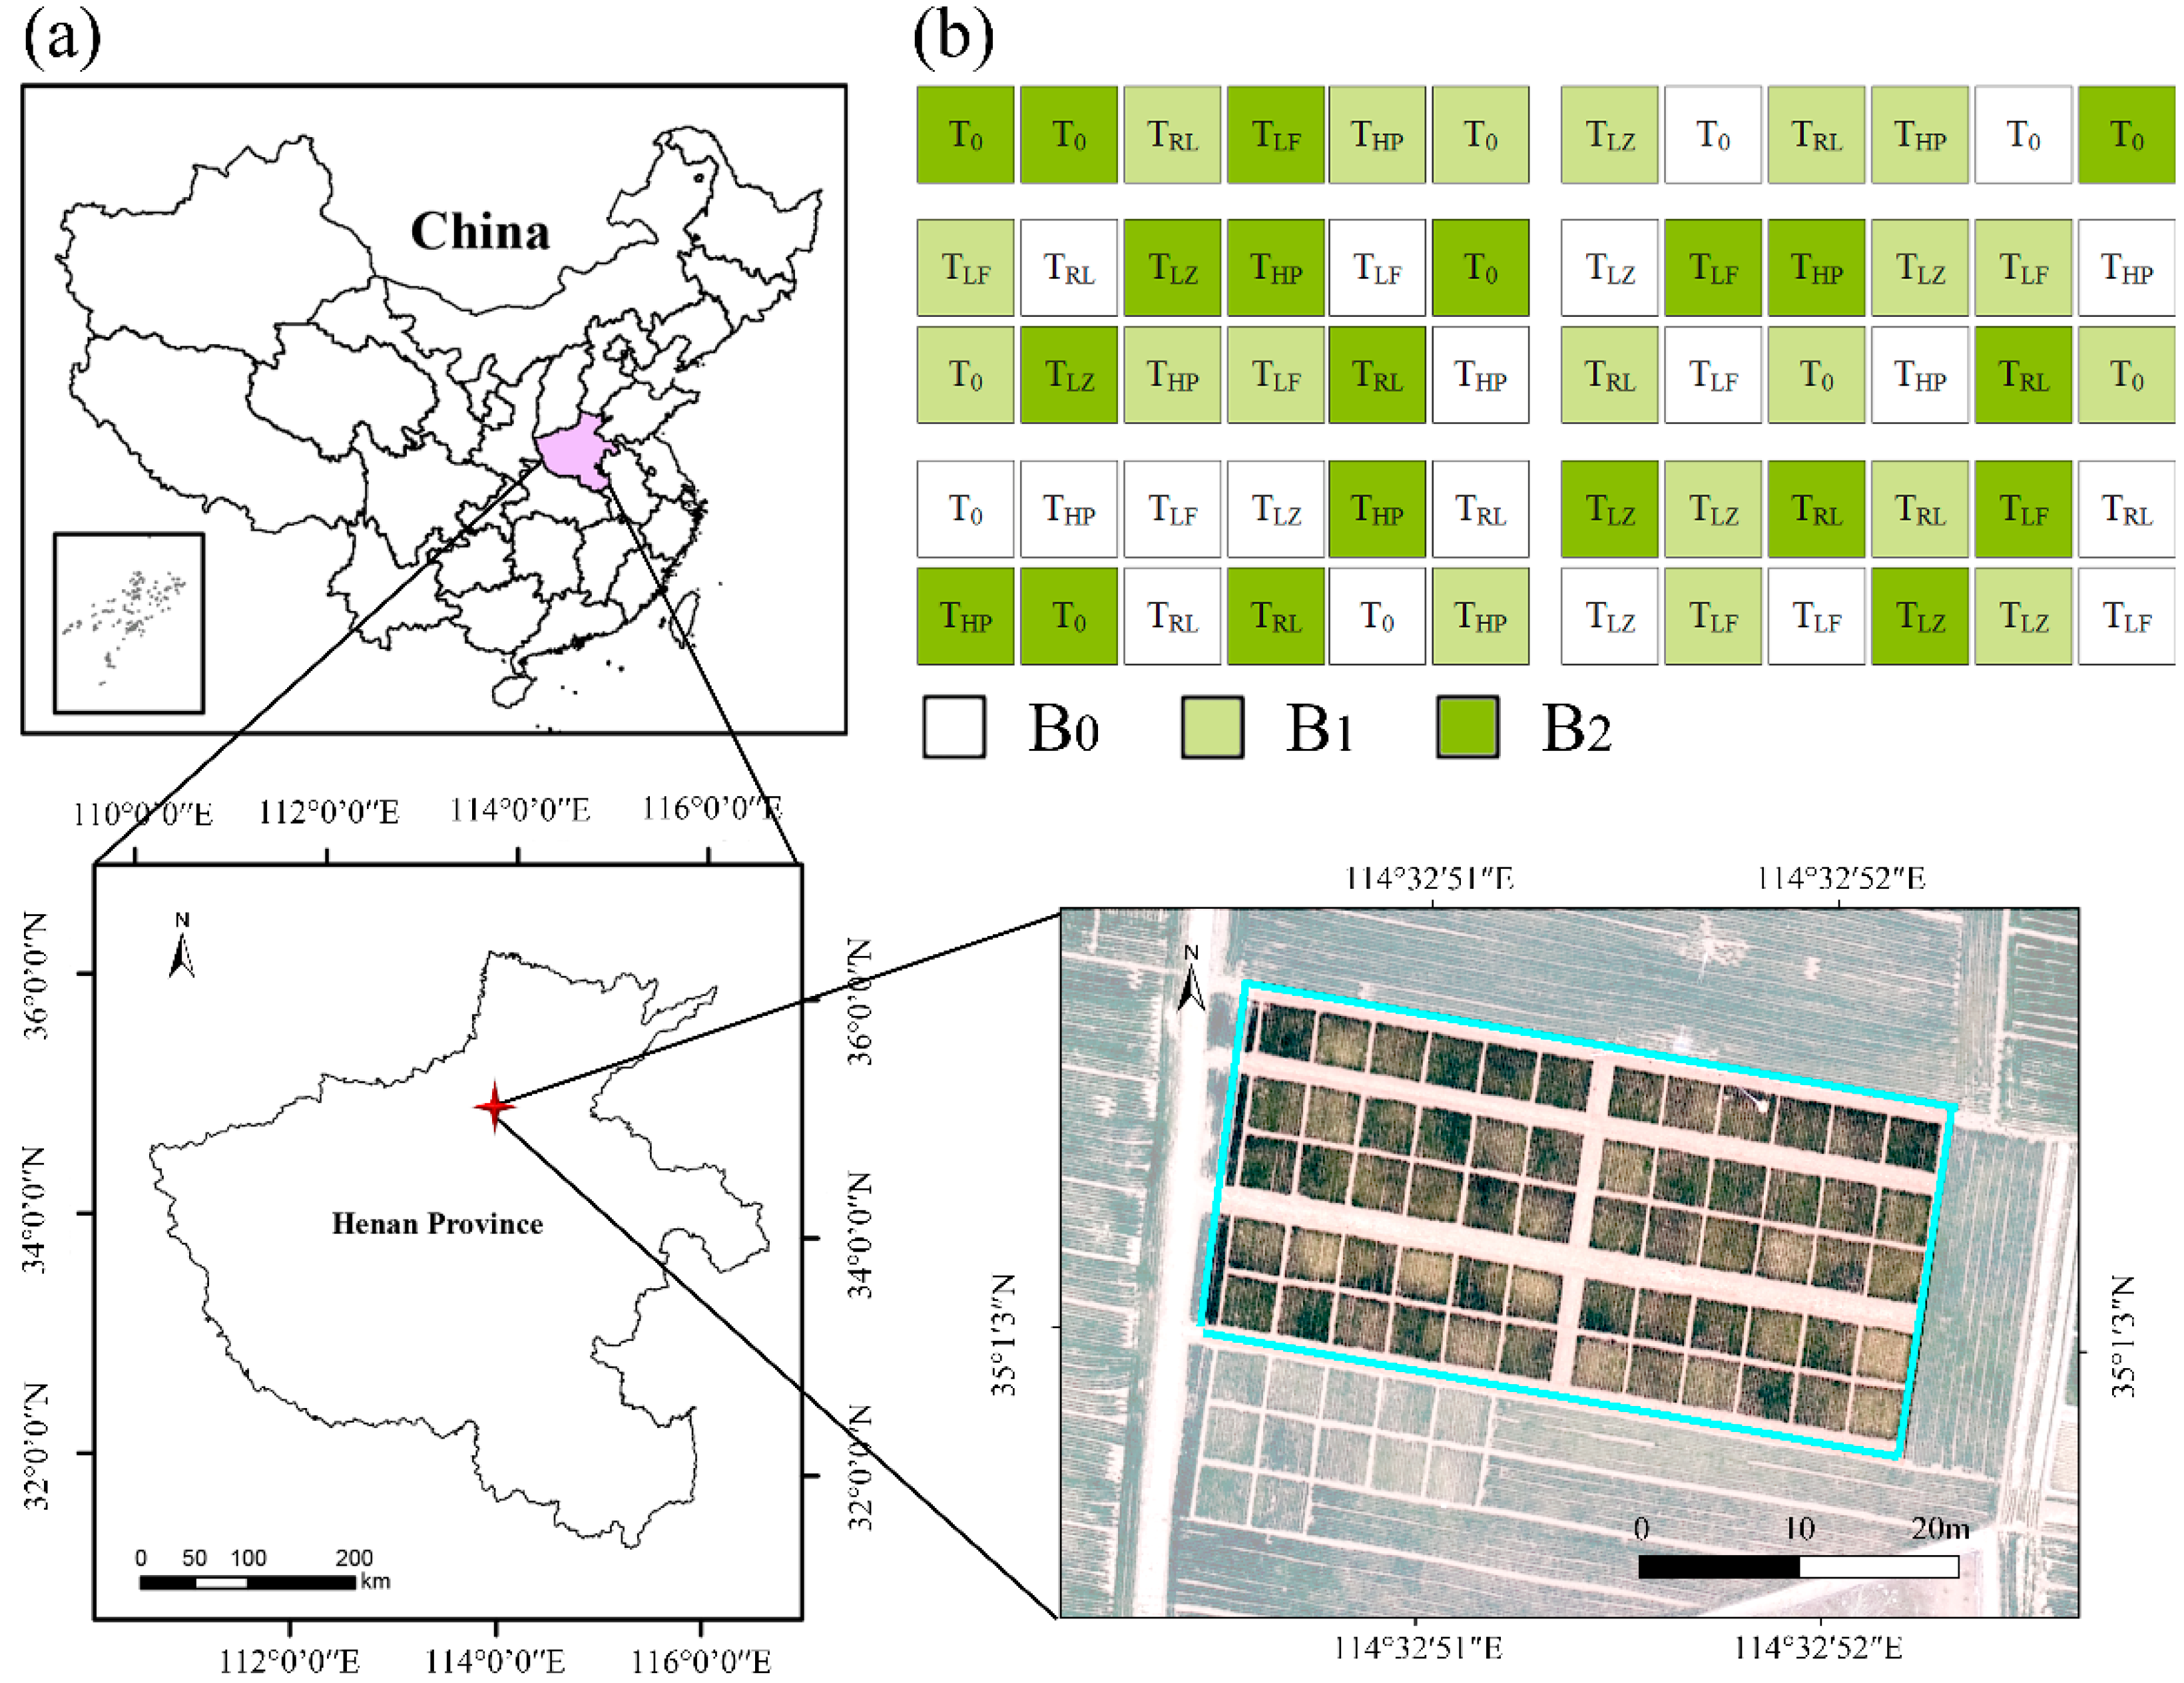
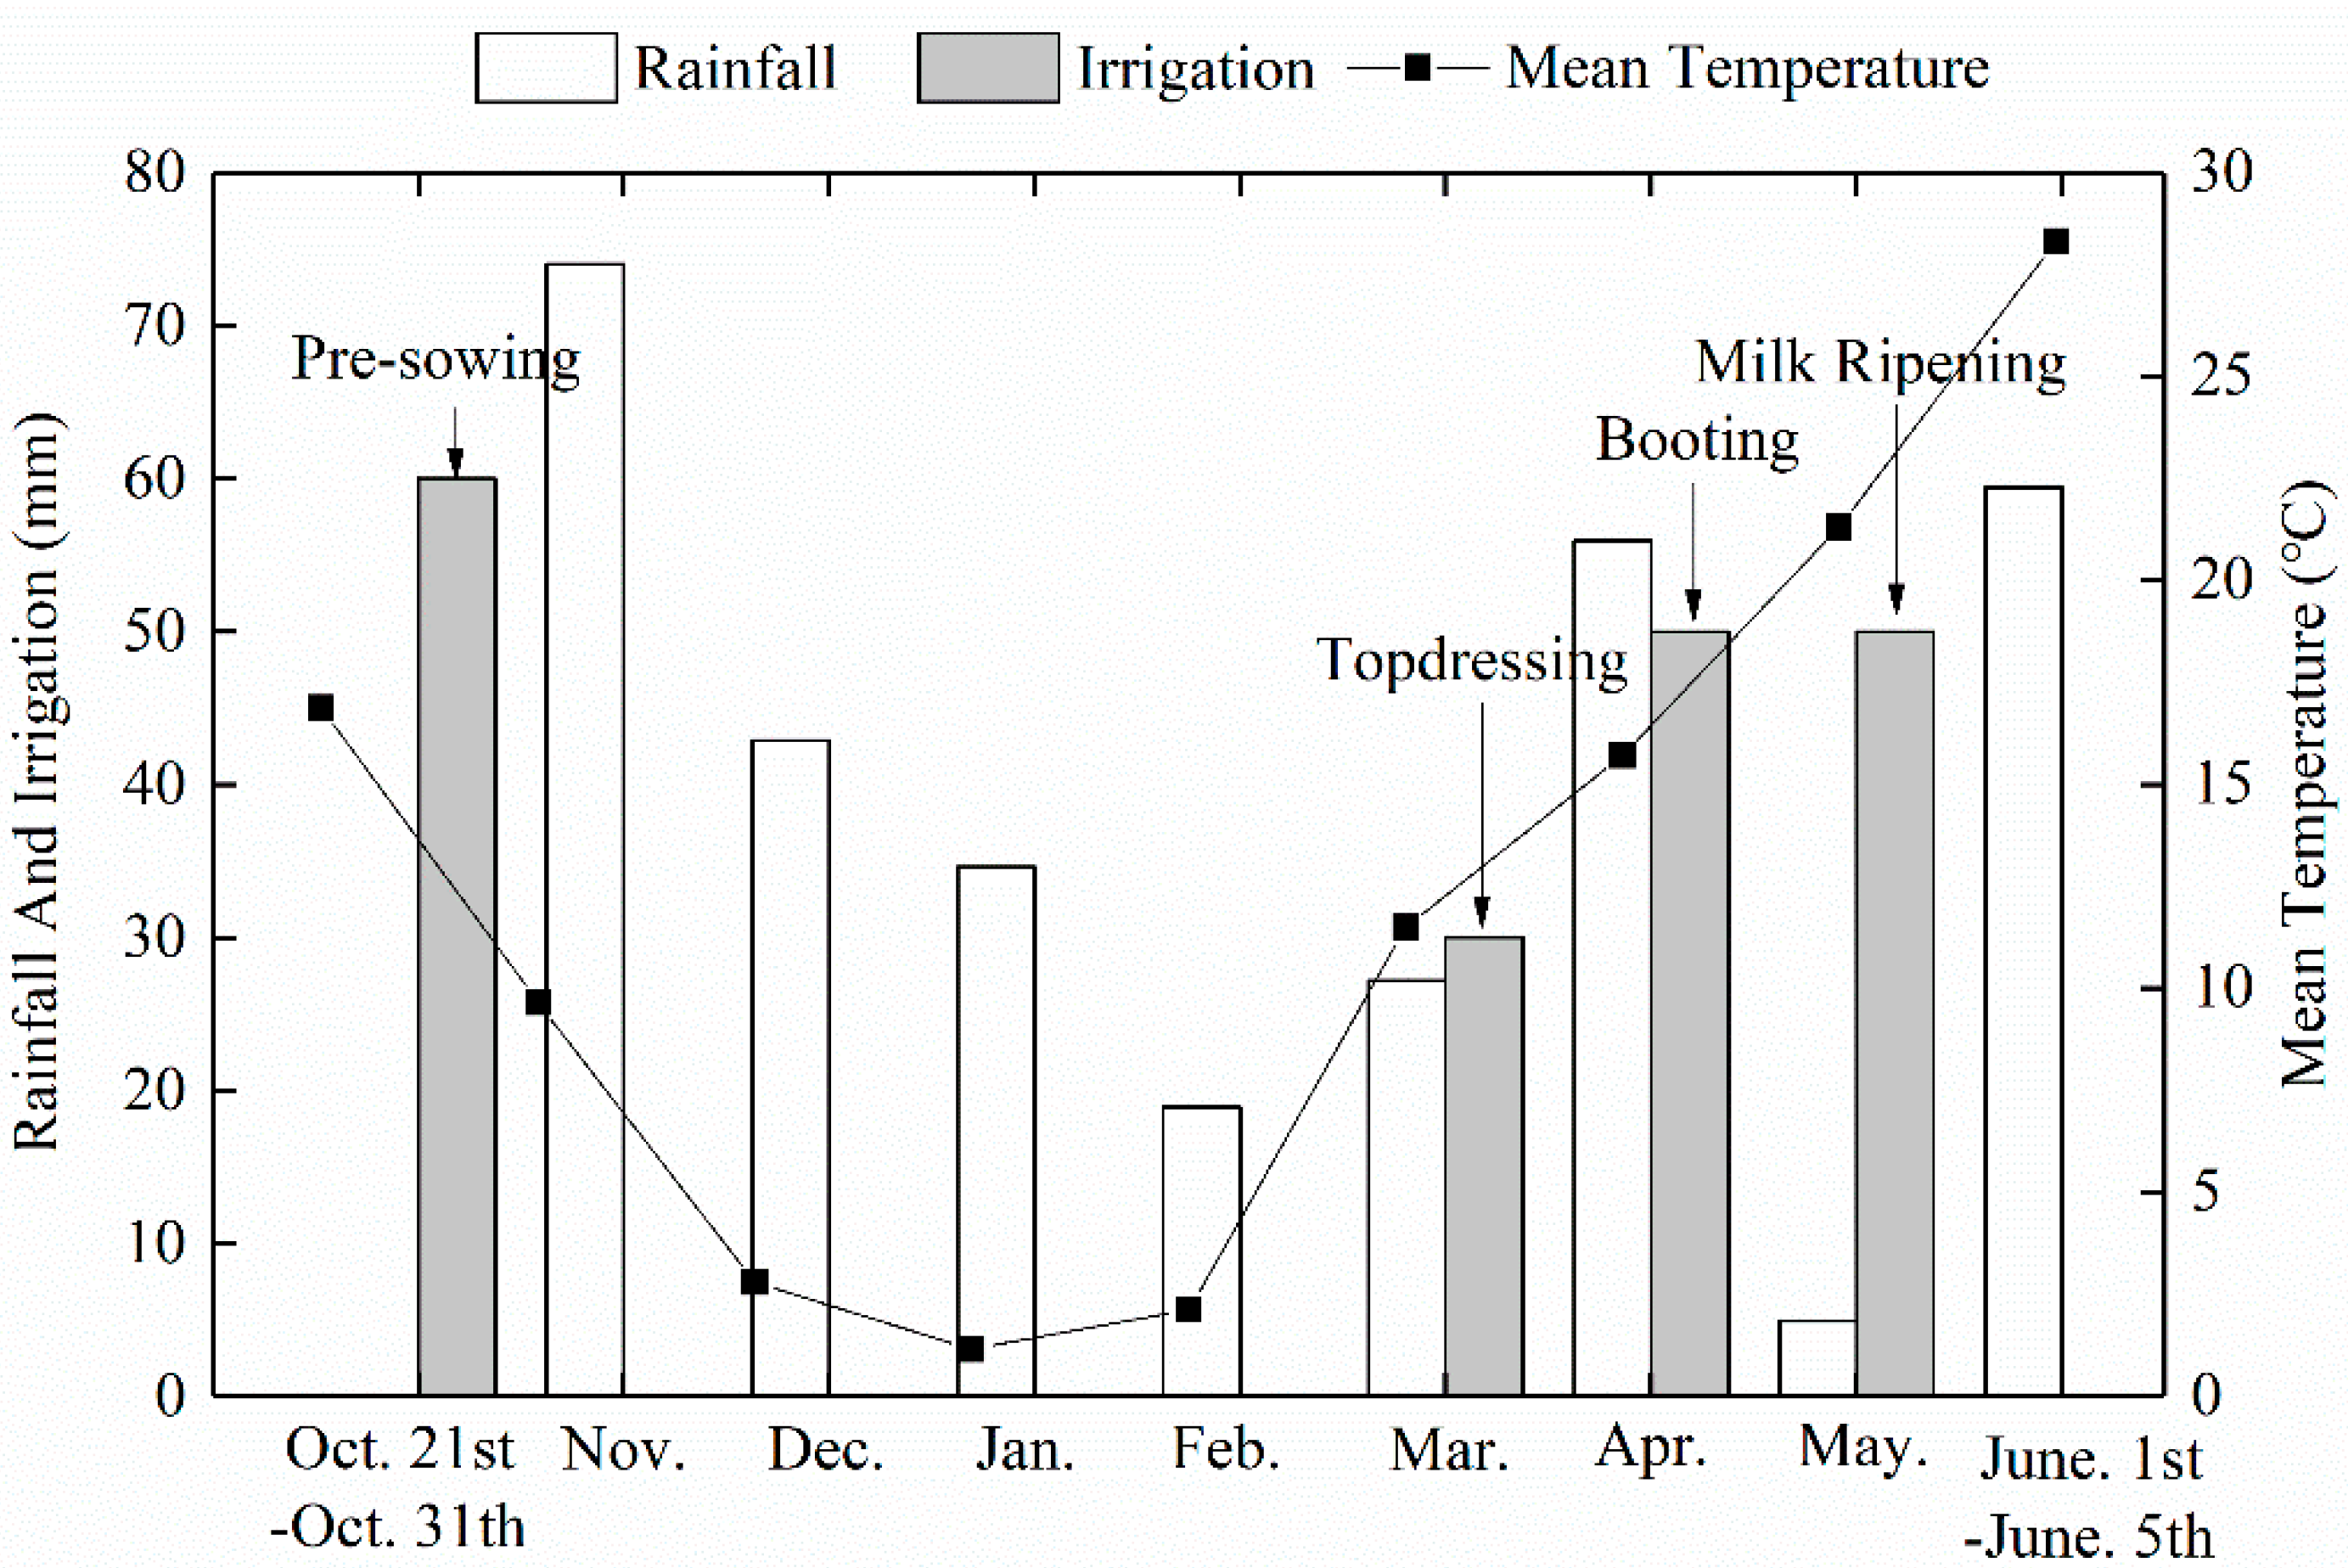
2.2. Field Experiment

The field experiment was arranged at the Fengqiu Agro-ecological Experimental Station, Chinese Academy of Sciences (114°34′ E, 35°01′ N) in Fengqiu County (Henan Province, China), between October 2018 and June 2019 (Figure 2). A completely randomized design was used in the experiment with five topdressing methods at three levels of preceding nutrient conditions. The topdressing methods included the THP, TLF, TRL, TLZ methods and a control (T0) with 0 kg∙ha−1 topdressing N fertilizer, and the three preceding nutrient conditions were achieved by applying controlled N basal fertilizers: B0 (0 kg∙N∙ha−1), B1 (57 kg∙N∙ha−1) and B2 (114 kg∙N∙ha−1), where B2 basal rates describe approximate rates used by many farmers in the region. Each treatment had 4 replications, and in total, there were 60 experimental units in the experiment. The units were 16 m2 (4 m × 4 m). Phosphorus and potassium fertilizers were applied without treatments at 130 kg∙ P2O5∙ ha−1 in the form of Ca(H2PO4)2 and 120 kg∙ K2O ∙ha−1 in the form of K2SO4 as basal fertilizers. Nitrogen fertilizers were applied in the form of urea for basal and topdressing. In the entire growing stage, we carried out irrigation in four time periods—before sowing (October 21st), after topdressing (March 24th), booting (April 17th) and milk ripening (May14th). The irrigation amount was 60, 30, 50 and 50 mm, respectively (Figure 3).
The experimental site has a typical monsoon climate with a mean annual temperature of 13.5~14.5 °C and the mean temperature for the entire growing season was 9.9 °C. The mean annual precipitation is 615 mm and is mainly concentrated between July and September. For the growing season of winter wheat, the precipitation was 318 mm, the specific temperature and precipitation information is shown in Figure 3. The annual sunshine hours are approximately 2300~2500 h, and the frost-free period is approximately 214 days. The soil is classified as Calcaric Fluvisol according to the FAO, with an average pH of 8.3, bulk density of 1.44g∙cm−3, porosity of 0.46 cm3∙cm−3, 6.09 g∙organic C∙kg−1, 0.55 g∙total N∙kg−1, 0.81 g∙total P∙kg−1, 18.08 g∙total K∙kg−1, and 8.01 cmol cation exchange capacity (CEC)∙kg−1 [21,22,23,24]. Winter wheat (Bainong Aikang 58) was sown on 24 October 2018 and harvested on 05 June 2019, and topdressing was applied on 24 March 2019.
Apart from the topdressing experiment, an ancillary experiment with five nitrogen levels, applying N0: 0, N1: 150, N2: 190, N3: 230, N4: 270 kg∙N∙ha−1 fertilizer throughout the entire growing period (60% as the basal fertilizer and 40% as topdressing) was conducted. As the 190 kg∙N∙ha−1 fertilizer is approximate rates used by many farmers in the region, fertilizer levels of 190, 230, and 270 kg∙N∙ha−1 are considered adequate. The size of the experiment unit was 48 m2 (8 m × 6 m) and units were separated by concrete slabs to prevent lateral exchange of soil solutions. The other field managements were the same as those for the topdressing experiment.

2.3. Plant Sampling and Measurement

In this study, plant height, AGB, N concentration in the aboveground part (NCA), and chlorophyll concentration were continuously investigated before and after topdressing to indicate the effect of each topdressing method. In addition, grain yield and straw biomass were measured at harvest. It is worth mentioning that plant height at topdressing is also a key parameter to calculate NFT in THP.
Plant samplings were conducted at four growth stages in 2019—reviving (21 March), booting (16 April), anthesis (28 April) and milk ripening (18 May)—because reviving is the critical growth stage for topdressing, while booting, anthesis and milk ripening are pivotal growth stages of yield formation. Winter wheat was randomly sampled from four corners and the center of the plot (a total of five sampling points for each plot). For the measurement of plant height and chlorophyll concentration, one plant from each sampling point was picked, and the plant height was manually measured with meter scale, while chlorophyll concentration was measured with an MC-100 chlorophyll concentration meter (Apogee Instruments, Inc., Logan, UT, USA). For each plot, all sampled plants were dried and weighed for the measurement of AGB, and the dry matter was crushed and sieved to test NCA using the Kjeldahl method [23]. At maturity (5 June 2019), wheat plants in an area of 1 m2 were harvested. The grain and straw were separated, dried and weighed to measure grain yield and straw biomass [24].

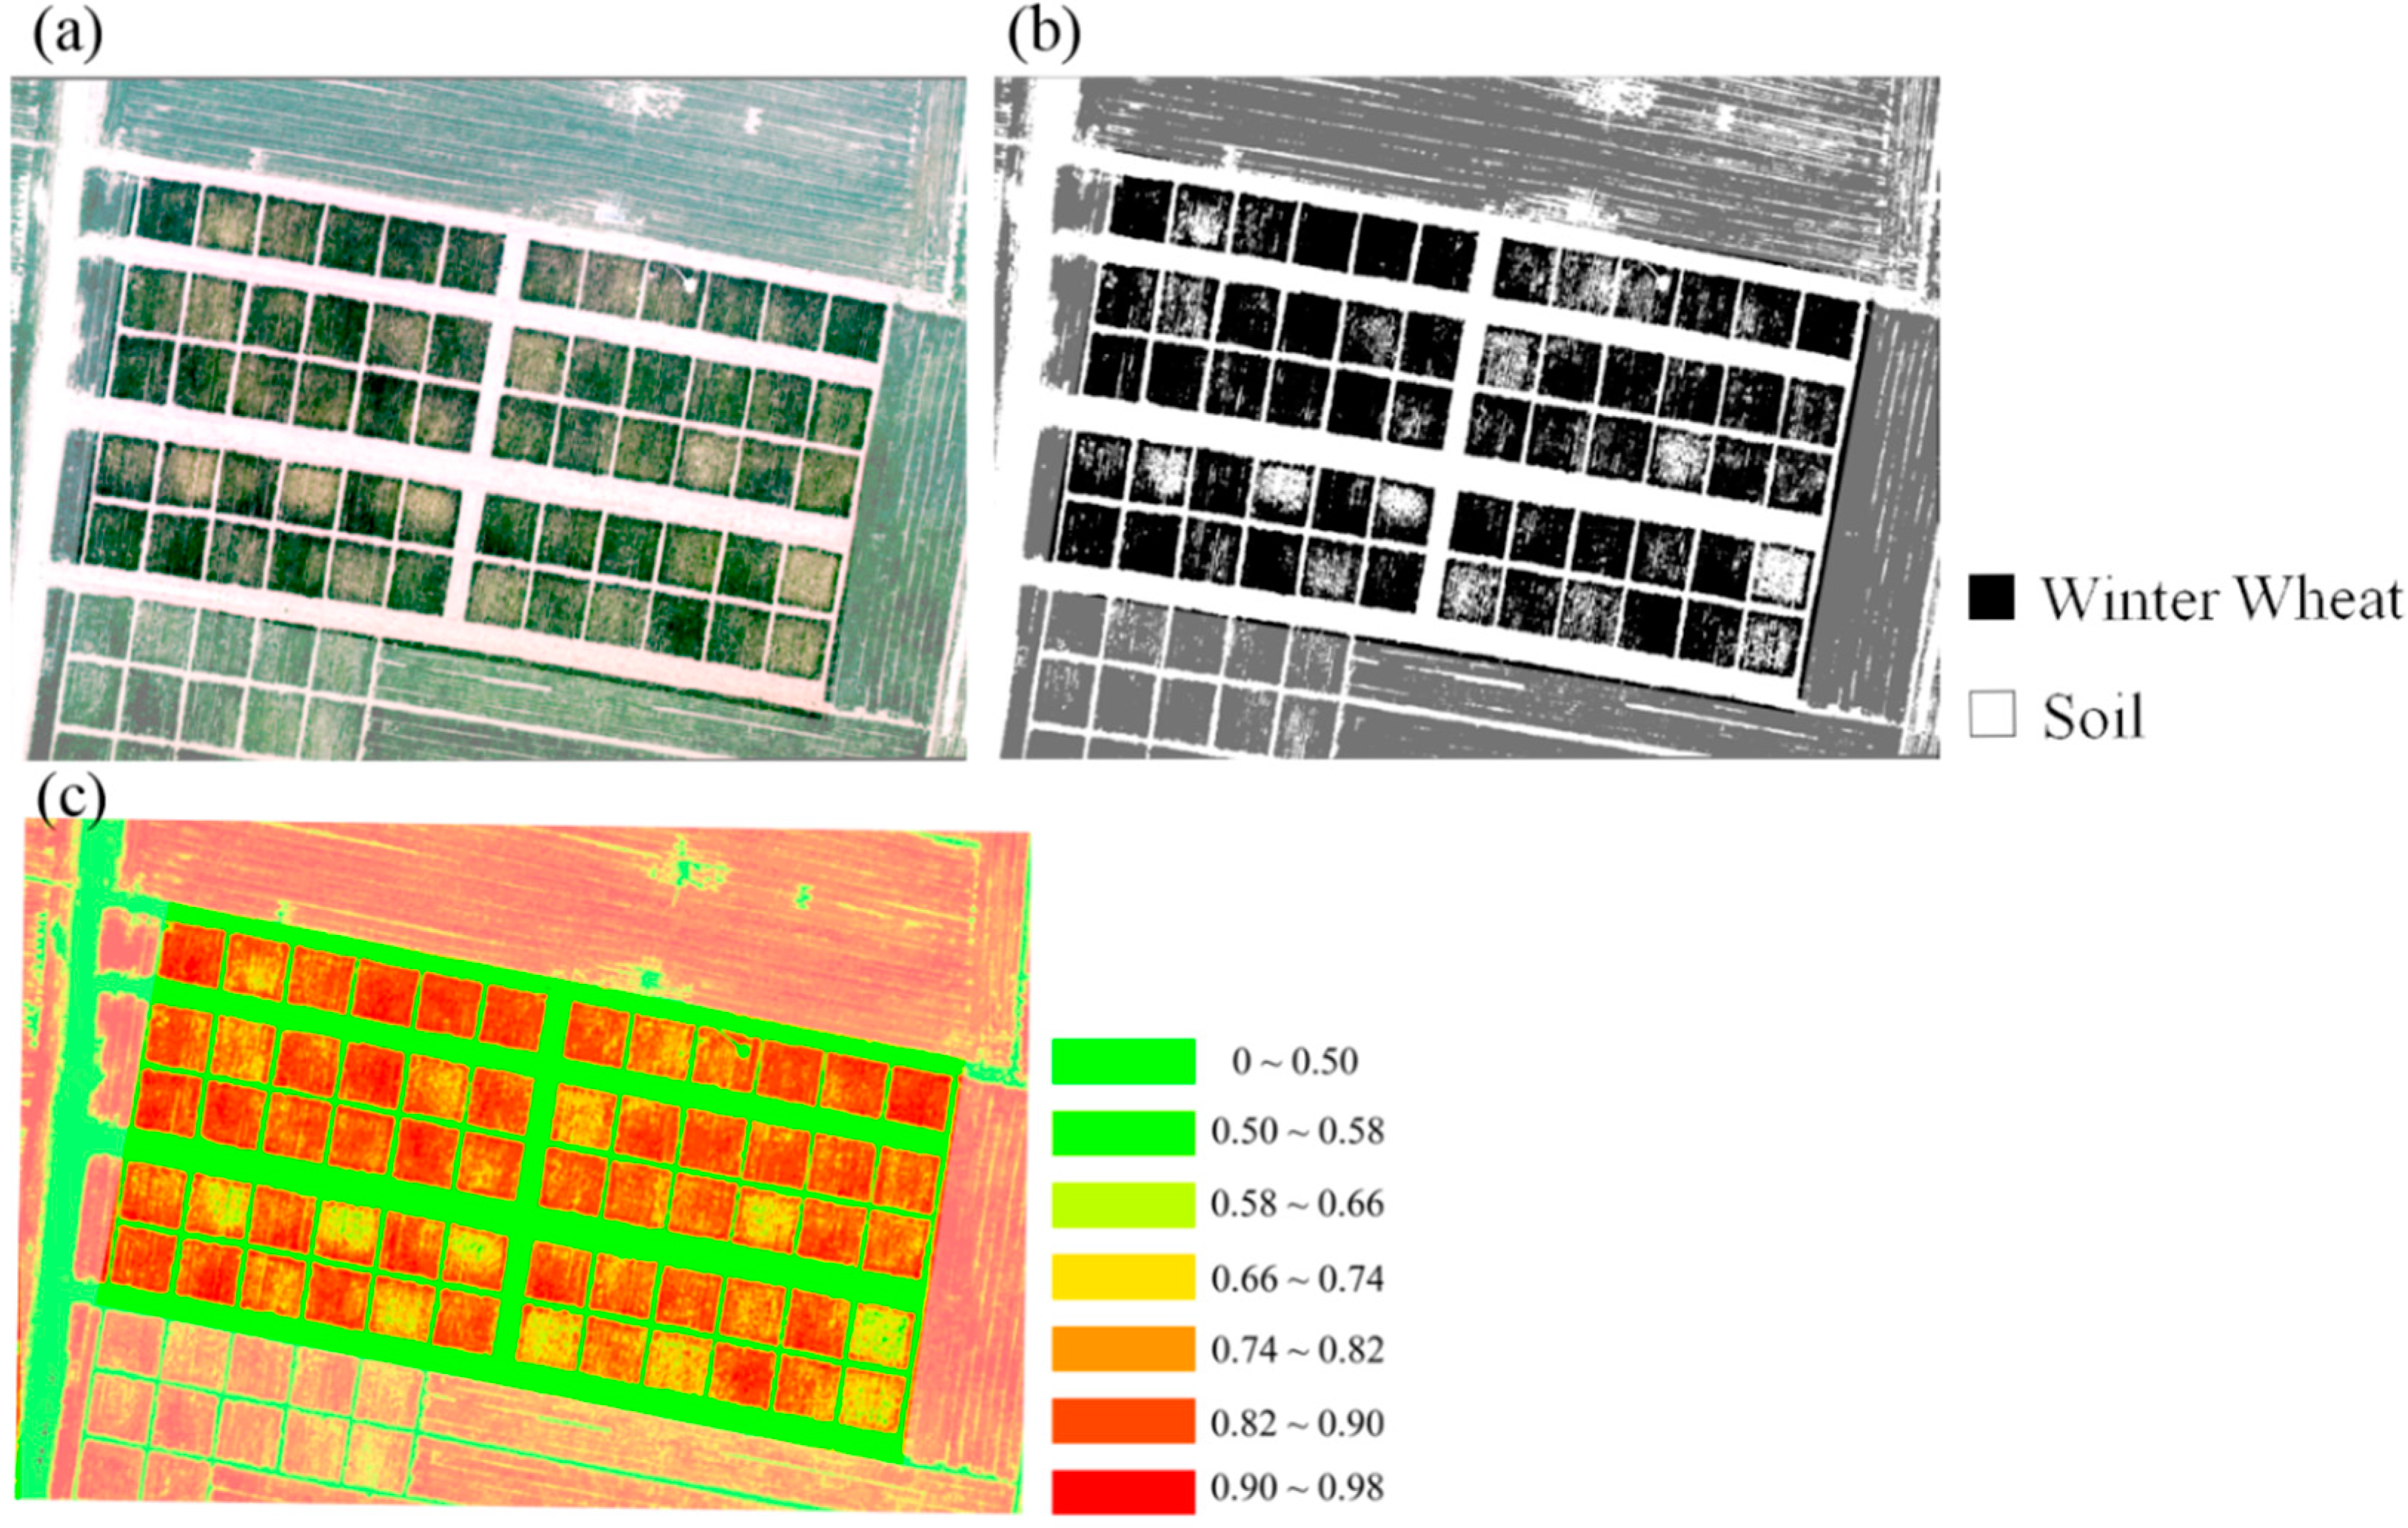
2.4. UAV-Based Remote Sensing

High-resolution RGB and multispectral images of the experimental area were captured on 21 March 2019 before topdressing by an RGB (Zenmuse X5S, DJI, Shenzhen, China) and a multispectral camera (Rededge-M, MicaSense, Seattle, WA, USA) mounted on a quadcopter UAV (M210, DJI), respectively. The work was done between 10:00 and 14:00 local time while it was cloudless and the solar radiation intensity was stable. A regular grid flying pattern was specified to assure over 70% of the image overlapped along and perpendicular to the flight direction, with the flight altitude maintained at 100 m aboveground. Orthographic maps of RGB and multispectral images were generated by Pix4Dmapper 4.2.27 (Pix4D SA, Lausanne, Switzerland) after optical corrections.
In this study, the parameters required by the topdressing methods from UAV-based remote sensing include crop coverage and NDVI:
NDVI = R NIR R Red R NIR + R Red
where RNIR is the reflectance of near IR band, Rred is the reflectance of red band [21].
Crop NDVI of the plots was extracted from the multispectral orthographic map [25], while crop coverages of the plots were calculated from the RGB orthographic map by a method using threshold of vegetation index decided by human interpreting to divide crop and soil [26,27,28]. The vegetation index used for crop coverage extraction was the normalized difference greenness index (NDGI), as NDGI is sensitive to the canopy biomass and vegetation fraction or leaf area [29]:
NDGI = DN green DN red DN green + DN red
where DNgreen is the digital number of the green band and DNred is the digital number of the red band.

2.5. Evaluation of NFT Use Efficiency

Partial factor productivity from applied N for topdressing (PFPt) was used to evaluate the profit and return from N applied as topdressing, and it refers to the calculation formula of partial factor productivity from applied N (PFPN) [30]:
PFP N = Y N T
where Y (Mg∙ha−1) is the grain yield and NT (kg∙N∙ha−1) is the total N fertilizer amount applied, including basal and topdressing:
PFP t = Y Y 0 NFT
where Y0 (Mg∙ha−1) is the grain yield of the treatment that received a certain amount of nitrogen as basal fertilizer without topdressing. NFT (kg∙N∙ha−1) is the nitrogen fertilizer amount of topdressing under a certain basal fertilizer level.

3. Results

3.1. Growth Status of Winter Wheat Before Topdressing

The growth status of winter wheat varied significantly under different early nutrient conditions before topdressing (Table 1). Growth status under B2 represented the growth of winter wheat under local farmer’s growing conditions. Compared to B2, the plant height, AGB, chlorophyll concentration, and NCA of B0 decreased by 22.73%, 24.01%, 16.70% and 21.28%, respectively; for B1, these parameters decreased by 8.32%, 14.08%, 7.74%, and 8.71%, respectively.
UAV-based images (Figure 4) intuitively presented the difference in winter wheat under different basal fertilizer levels at topdressing; correspondingly, the unit average NDVI and coverage of winter wheat varied significantly (Table 2). The difference in coverage was especially obvious. The unit average coverage of winter wheat under B0 and B1 was 34.58% and 13.65% lower than that under B2, respectively. The unit average NDVI under B0 and B1 was 9.41% and 2.35% lower than that under B2, respectively.

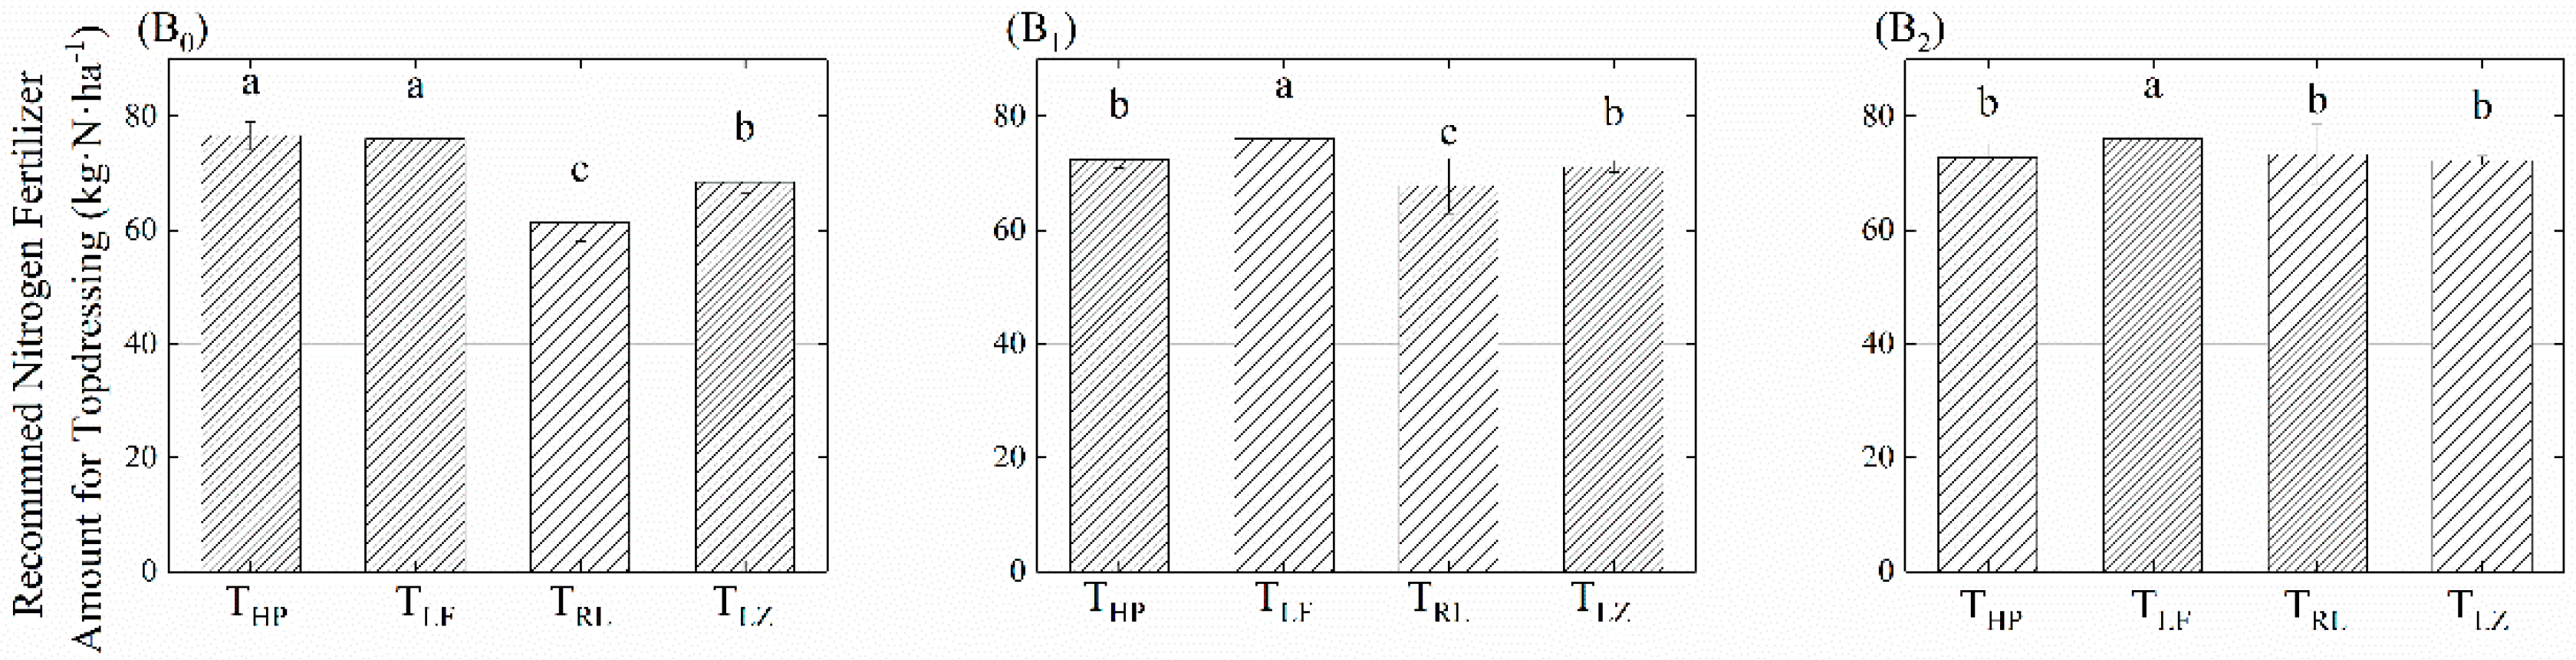
3.2. Recommendations of NFT

The experimental unit average NDVI and coverage of winter wheat extracted in 3.1 and measured plant height were substituted into the formulas (Section 2.1) obtained from the auxiliary experiment (Figure 5) to generate the NFT recommendations. The specific NFT for each unit is shown in Figure 6. The statistical results of the recommended NFT for each topdressing method under different basal fertilizer conditions are shown in Figure 7.
THP tended to increase NFT when N deficiency was present in the early growing season, and recommended a moderate NFT reduction when N was sufficient in the early growing season. When N was severely deficient during the early growing stage (B0), THP recommended the same NFT as TLF to compensate for the nutrient deficiency, while TRL and TLZ recommended reducing NFT by 14.42% and 9.94%, respectively, due to the low expectations of growing potential. Under the B1 condition, THP, TRL and TLZ recommended decreasing NFT by 4.61%, 10.81% and 6.39% compared to TLF, respectively, due to the difference in the evaluation of the nutritional conditions of crops. When sufficient basal fertilizer was provided (B2), the THP method followed the TRL and TLZ methods to reduce NFT by 4.2%, 3.6% and 4.9%, respectively, compared to TLF.

3.3. Responses of Winter Wheat after Topdressing

For the further understanding of the effects of NFTs recommended by each topdressing method to the growth of winter wheat, AGB, plant height, NCA and chlorophyll concentration were continuously monitored at booting, anthesis and milk ripening stage. We compared the parameters of the four topdressing methods and a control under different base nutrition levels separately. The cumulative graphs of each growth parameter (Figure 7) illustrated the developing process of winter wheat intuitively, as the developing trend for each growth parameter over 3 monitoring stages were continuous.
In terms of AGB (Figure 8a–c), THP ensured the accumulation of biomass under different early nutrient conditions, especially for B0. The accumulation of AGB went through two periods after topdressing: a rapid growing period from booting to anthesis, and the accumulation ranged from 3.58~4.42 Mg∙ha−1 for B0; 3.79~4.46 Mg∙ha−1 for B1 and 4.44~5.13 Mg∙ha−1 for B2; and a slow accumulation period from anthesis to milk ripening with an accumulation ranged from 1.72~2.83 Mg∙ha−1 for B0; 2.41~3.56 Mg∙ha−1 for B1 and 2.46~2.75 Mg∙ha−1 for B2. With the growth of winter wheat, the differences in AGBs between different topdressing methods gradually increased, so we focused on the AGBs at milk ripening stage. It was found that under the B0 condition, THP achieved an average AGB of 12.55 Mg∙ha−1, which was close to TLF (12.59 Mg∙ha−1) and significantly higher than TRL (11.55 Mg∙ha−1) and TLZ (12.31 Mg∙ha−1). Under B1 and B2 conditions, the average AGBs of THP, TLF, TRL, and TLZ were not significantly different but were significantly higher than that of T0.
The increase in plant height (Figure 8d–f) was similar to that of AGB, and the slowdown in growth from anthesis to milk ripening was more obvious. As for the B2 condition, the increment of height for each topdressing methods in this stage only reached 2.40~4.00 cm. We focused on the plant height of each topdressing method at the milk ripening stage for the same reason as for AGB. Under the B0 condition, THP achieved an average plant height of 69.94 cm, which was close to that of TLF (70.08 cm) and significantly higher than those of TRL (64.09 cm) and TLZ (67.50 cm). Under B1 and B2 conditions, the average AGBs of THP, TLF, TRL, and TLZ were not significantly different but were significantly higher than that of T0.
The NCA of winter wheat (Figure 8g–i) continued to decrease throughout the growth periods. THP slowed the decreasing trend compared to other topdressing methods, but there was no significant difference between THP, TLF, TRL and TLZ at the milk ripe stage. The mean NCA of THP at the milk ripe stage was 8.14, 10.80 and 11.87 g.kg−1 under B0, B1 and B2 conditions, respectively.
The chlorophyll concentration (Figure 8j–l) increased for a transitory period after topdressing and decreased from the booting to milk ripe stages in all treatments. THP slowed the reduction in chlorophyll concentration and maintained the chlorophyll concentration at 357.11 μmol∙m−2, 481.45 μmol∙m−2 and 526.36 μmol∙m−2 for B0, B1, and B2, respectively, at the milk ripe stage.
Overall, THP performed well in terms of winter wheat development among all topdressing methods in multiple growing stages regardless of the nutritional conditions during the early stages.

3.4. Harvest Index and Nitrogen Use Efficiency

In terms of the grain yield (Figure 9a–c), THP achieved high yield under different basal fertilizer levels. The average grain yields of THP were 5.41, 6.17 and 6.58 Mg∙ha−1 under B0, B1 and B2 level, respectively. The grain yields of THP were not significantly different from those of TLF (B0: 5.42 Mg∙ha−1, B1: 6.23 Mg∙ha−1, B2: 6.59 Mg∙ha−1), and TLZ (B0: 5.29 Mg∙ha−1, B1: 6.16 Mg∙ha−1, B2: 6.59 Mg∙ha−1) under all three basal fertilizer levels but were significantly higher than that of TRL when the early-stage nutrition was insufficient (B0: 5.17 Mg∙ha−1 and B1: 5.93 Mg∙ha−1).
The difference in straw biomass (Figure 9d–f) was not significant among THP, TLF, TRL, and TLZ. Only when nitrogen deficiency occurred in the early stage (B0) did the average straw biomass of THP (7.77 Mg∙ha−1) was slightly higher than that of TLF (0.77 Mg∙ha−1), TRL (0.73 Mg∙ha−1) and TLZ (0.75 Mg∙ha−1).
Overall, THP presented high PFPts under different basal fertilizer levels (Table 3). Under the B0 and B1 levels, the PFPt of THP was higher than that of TRL and TLZ, and under the B2 level, it was higher than that of TLF and TRL. However, the difference between each topdressing method was not significant.

4. Discussion

4.1. Difference in NFT

As shown in Section 3.2, the variable topdressing methods (THP, TRL and TLZ) tested in this experiment varied in NFT for winter wheat under the three preceding nutritional conditions, as the predictions of growth potential were different. Under B2 conditions, THP, TRL, and TLZ recommended similar NFTs, which were lower than that of TLF because the basal fertilizer was excessive and the additional fertilizer for topdressing had no contribution to yield. With the decrease in basal fertilizer, TRL and TLZ gradually reduced NFTs for B1 and B0 due to the diminishing expectation of production, while the circumstance was inverse for THP, as it increased NFT for B1 and B0 aiming to compensate for the deficiency of nitrogen.

4.2. Differences in Responses of Winter Wheat to NFT Recommended by Each Topdressing Method

The difference in topdressing methods had a significant influence on the growth and yield formation of winter wheat, especially when the basal fertilizer was deficient, which was consistent with the research conducted by Xu et al. in 2018 [31]. The NCA kept decreasing throughout the monitoring periods, and the process was more rapid for winter wheat with nitrogen deficiency in the early stage (B0) [24]. Topdressing could slow down the decreasing process of NCA, and the NCAs of T0 were therefore significantly lower than those of other topdressing methods. It was supposed that the NCAs of winter wheat with low NFTs should decrease faster than those with high NFTs. The fact, however, is that no significant difference was found in NCA between the different topdressing methods. This is because well-nourished wheat tended to achieve higher AGBs, and according to the N dilution theory, the NCA decreases with the accumulation of AGB. Due to the influence of many factors, the variation of NCAs with NFT did not show obvious regularity, and as a result, the NCA at the milk ripe stage of THP was not different from that of TRL, even though 15.35 kg·N·ha−1 additional NFT was applied under the B0 condition. However, the additional NFT retarded the breakdown of chlorophyll, so the chlorophyll concentrations of THP and TLF were significantly higher than those of TRL and TLZ. This support the photosynthesis and material accumulation of winter wheat and presented a significant difference in AGB and plant height at the milk ripe stage. The additional material accumulation is transferred to the grain at late growing stages and manifested as grain yield differences. Under the B1 basal fertilizer level, the AGB and plant height were not different among the four topdressing methods, while the N, chlorophyll concentration, and grain yield of TRL were significantly lower than those of the other topdressing methods, implying that the N and chlorophyll concentrations are more sensitive to the nutrient status. Under the B2 basal fertilizer level, all tested growth parameters and the grain yield were not significantly different among the 4 topdressing methods, demonstrating that excessive NFT is unable to increase production.

4.3. Limitations of the Study

Determining the growth potential of winter wheat requires exhaustive work, as the accumulation in AGB changes with the monitoring time. However, we only conducted this experiment for one growing season; thus, the impacts of interannual meteorological variabilities and planting time were not analyzed in the method based on improved growth estimation. Multi-season topdressing experiments are needed to improve the adaptability of THP to different topdressing times. In addition, this work is based on one cultivar and conducted at one experimental site, and as such, large-area applications and evaluation under diverse farm-field conditions are needed to improve this preliminary method.
In this study, we used RV to estimate the AGB of winter wheat at topdressing. However, the process is inefficient, as the calculation of RV requires manually measured plant height. With the development of image processing methods, it is convenient to accurately predict crop biomass with UAV-based remote sensing alone [17,32,33]. Therefore, further research is needed to deeply mine data obtained by UAV-based remote sensing to simplify topdressing.

5. Conclusions

To optimize winter wheat topdressing in monitoring efficiency and fertilizer use efficiency, we constructed a topdressing method based on determing biomass increments with UAV-based remote sensing (THP) and compared the effect of this method with other topdressing methods in a field experiment. The results showed that THP has the potential to ensure grain yield and avoid excessive N fertilization. THP reduced the nitrogen application amount of topdressing by 4.18~4.61% over TLF, with no significant decrease in grain yield, when the early-stage nutrition condition was sufficient, and maintained a relatively high grain yield of 5.41 Mg∙ha−1, which was 17.83% and 20.68% higher than that of TLZ and TRL when the early-stage nutrition condition was deficient, as it was recommended to increase the nitrogen application amount of topdressing when nitrogen deficiency occurred, and moderately reduce the topdressing amount when the nitrogen levels were sufficient. The adaptation of early-stage nutrition conditions was achieved by adjusting the NFT based on estimation of the maximum growth potential. More studies are necessary to further improve this topdressing method for a wider range of applications and obtain information acquired by UAV-based remote sensing.

Author Contributions

X.L. conceived the method. J.J. and Y.N. conducted the experiment. J.J. analyzed the results and wrote the original version. X.L., J.L. and J.C. edited the text. K.X., Y.J., R.J. and C.W. provided suggestions. All authors have read and agreed to the published version of the manuscript.

Funding

This work was supported in part by the National Natural Science Foundation of China under Grant No. 41877021 and 41171265.

Institutional Review Board Statement

Not applicable.

Informed Consent Statement

Not applicable.

Data Availability Statement

Data sharing is not applicable to this article.

Acknowledgments

This work was supported by the National Natural Science Foundation of China (Grant No. 41877021 and 41171265). The authors would like to acknowledge Raun and Lukina for their previous contributions, presented in publication [20,21].

Conflicts of Interest

The authors declare no conflict of interest.

References

  1. Ren, S.; Guo, B.; Wu, X.; Zhang, L.; Ji, M.; Wang, J. Winter wheat planted area monitoring and yield modeling using MODIS data in the Huang-Huai-Hai Plain, China. Comput. Electron. Agric. 2021, 182, 106049. [Google Scholar] [CrossRef]
  2. Liu, B.-Y.; Zhao, X.; Li, S.-S.; Zhang, X.-Z.; Virk, A.L.; Qi, J.-Y.; Kan, Z.-R.; Wang, X.; Ma, S.-T.; Zhang, H.-L. Meta-analysis of management-induced changes in nitrogen use efficiency of winter wheat in the North China Plain. J. Clean. Prod. 2020, 251, 119632. [Google Scholar] [CrossRef]
  3. Xue, L.; Yang, L. Recommendations for nitrogen fertiliser topdressing rates in rice using canopy reflectance spectra. Biosyst. Eng. 2008, 100, 524–534. [Google Scholar] [CrossRef]
  4. Balasubramanian, V.; Morales, A.; Cruz, R.; Abdulrachman, S. On-farm adaptation of knowledge-intensive nitrogen management technologies for rice systems. Nutr. Cycl. Agroecosyst. 1998, 53, 59–69. [Google Scholar] [CrossRef]
  5. Liu, S.; Li, L.; Fan, H.; Guo, X.; Wang, S.; Lu, J. Real-time and multi-stage recommendations for nitrogen fertilizer topdressing rates in winter oilseed rape based on canopy hyperspectral data. Ind. Crop. Prod. 2020, 154, 112699. [Google Scholar] [CrossRef]
  6. Qiang, S.-C.; Zhang, F.-C.; Dyck, M.; Zhang, Y.; Xiang, Y.-Z.; Fan, J.-L. Determination of critical nitrogen dilution curve based on leaf area index for winter wheat in the Guanzhong Plain, Northwest China. J. Integr. Agric. 2019, 18, 2369–2380. [Google Scholar] [CrossRef]
  7. Torino, M.S.; Ortiz, B.V.; Fulton, J.P.; Balkcom, K.S.; Wood, C.W. Evaluation of Vegetation Indices for Early Assessment of Corn Status and Yield Potential in the Southeastern United States. Agron. J. 2014, 106, 1389–1401. [Google Scholar] [CrossRef]
  8. Zhao, G.; Miao, Y.; Wang, H.; Su, M.; Fan, M.; Zhang, F.; Jiang, R.; Zhang, Z.; Liu, C.; Liu, P.; et al. A preliminary precision rice management system for increasing both grain yield and nitrogen use efficiency. Field Crop. Res. 2013, 154, 23–30. [Google Scholar] [CrossRef]
  9. Wood, G.A.; Welsh, J.P.; Godwin, R.J.; Taylor, J.C.; Earl, R.; Knight, S.M. Real-time Measures of Canopy Size as a Basis for Spatially Varying Nitrogen Applications to Winter Wheat sown at Different Seed Rates. Biosyst. Eng. 2003, 84, 513–531. [Google Scholar] [CrossRef] [Green Version]
  10. Tao, M.; Ma, X.; Huang, X.; Liu, C.; Deng, R.; Liang, K.; Qi, L. Smartphone-based detection of leaf color levels in rice plants. Comput. Electron. Agric. 2020, 173, 105431. [Google Scholar] [CrossRef]
  11. Raj, R.; Kar, S.; Nandan, R.; Jagarlapudi, A. Precision Agriculture and Unmanned Aerial Vehicles (UAVs). In Unmanned Aerial Vehicle: Applications in Agriculture and Environment; Springer Science and Business Media LLC: Cham, Switzerland, 2019; pp. 7–23. [Google Scholar]
  12. Tsouros, D.C.; Bibi, S.; Sarigiannidis, P.G. A review on UAV-based applications for precision agriculture. Information 2019, 10, 349. [Google Scholar] [CrossRef] [Green Version]
  13. Matsumura, K. Unmanned Aerial Vehicle (UAV) for Fertilizer Management in Grassland of Hokkaido, Japan. In Unmanned Aerial Vehicle: Applications in Agriculture and Environment; Springer International Publishing: Cham, Switzerland, 2020; pp. 39–50. [Google Scholar]
  14. Zhang, M.; Zhou, J.; Sudduth, K.A.; Kitchen, N.R. Estimation of maize yield and effects of variable-rate nitrogen application using UAV-based RGB imagery. Biosyst. Eng. 2020, 189, 24–35. [Google Scholar] [CrossRef]
  15. Malambo, L.; Popescu, S.; Murray, S.; Putman, E.; Pugh, N.; Horne, D.; Richardson, G.; Sheridan, R.; Rooney, W.; Avant, R.; et al. Multitemporal field-based plant height estimation using 3D point clouds generated from small unmanned aerial systems high-resolution imagery. Int. J. Appl. Earth Obs. Geoinf. 2018, 64, 31–42. [Google Scholar] [CrossRef]
  16. Bendig, J.; Yu, K.; Aasen, H.; Bolten, A.; Bennertz, S.; Broscheit, J.; Gnyp, M.L.; Bareth, G. Combining UAV-based plant height from crop surface models, visible, and near infrared vegetation indices for biomass monitoring in barley. Int. J. Appl. Earth Obs. Geoinf. 2015, 39, 79–87. [Google Scholar] [CrossRef]
  17. Furukawa, F.; Maruyama, K.; Saito, Y.K.; Kaneko, M. Corn Height Estimation Using UAV for Yield Prediction and Crop Monitoring. In Unmanned Aerial Vehicle: Applications in Agriculture and Environment; Springer Science and Business Media LLC: Cham, Switzerland, 2019; pp. 51–69. [Google Scholar]
  18. Xiong, D.; Chen, J.; Yu, T.; Gao, W.; Ling, X.; Li, Y.; Peng, S.; Huang, J. SPAD-based leaf nitrogen estimation is impacted by environmental factors and crop leaf characteristics. Sci. Rep. 2015, 5, 13389. [Google Scholar] [CrossRef] [Green Version]
  19. Thind, H.S.; Gupta, R.K. Need based nitrogen management using the chlorophyll meter and leaf colour chart in rice and wheat in South Asia: A review. Nutr. Cycl. Agroecosyst. 2010, 88, 361–380. [Google Scholar]
  20. Raun, W.; Solie, G.J.; Johnson, M.; Stone, R.; Mullen, K.; Freeman, W.; Thomason, E. Lukina, Improving Nitrogen Use Efficiency in Cereal Grain Production with Optical Sensing and Variable Rate Application. Agron. J. 2002, 94, 815–820. [Google Scholar] [CrossRef] [Green Version]
  21. Raun, W.R.; Solie, J.B.; Johnson, G.V.; Stone, M.L.; Lukina, E.V.; Thomason, W.E.; Schepers, J.S. In-Season Prediction of Potential Grain Yield in Winter Wheat Using Canopy Reflectance. Agron. J. 2001, 93, 131–138. [Google Scholar] [CrossRef] [Green Version]
  22. Xue, L.; Li, G.; Qin, X.; Yang, L.; Zhang, H. Topdressing nitrogen recommendation for early rice with an active sensor in south China. Precis. Agric. 2013, 15, 95–110. [Google Scholar] [CrossRef]
  23. Chemists, A.; Horwitz, W. Official Methods of Analysis; Association of Official Agricultural Chemists: Rockville, MD, USA, 1984. [Google Scholar]
  24. Zhao, B.; Niu, X.; Ata-Ul-Karim, S.T.; Wang, L.; Duan, A.; Liu, Z.; Lemaire, G. Determination of the post-anthesis nitrogen status using ear critical nitrogen dilution curve and its implications for nitrogen management in maize and wheat. Eur. J. Agron. 2020, 113, 125967. [Google Scholar] [CrossRef]
  25. Tunca, E.; Köksal, E.S.; Çetin, S.; Ekiz, N.M.; Balde, H. Yield and leaf area index estimations for sunflower plants using unmanned aerial vehicle images. Environ. Monit. Assess. 2018, 190, 682. [Google Scholar] [CrossRef]
  26. Zhou, Q.; Robson, M. Automated rangeland vegetation cover and density estimation using ground digital images and a spectral-contextual classifier. Int. J. Remote Sens. 2001, 22, 3457–3470. [Google Scholar] [CrossRef]
  27. Richardson, M.D.; Karcher, D.E.; Purcell, L.C. Quantifying Turfgrass Cover Using Digital Image Analysis. Crop. Sci. 2001, 41, 1884–1888. [Google Scholar] [CrossRef]
  28. Li, B.; Liu, R.; Liu, S.; Liu, Q.; Liu, F.; Zhou, G. Monitoring vegetation coverage variation of winter wheat by low-altitude UAV remote sensing system. Trans. Chin. Soc. Agric. Eng. 2012, 28, 160–165. [Google Scholar]
  29. Lencina, A.; Weber, C. Maximum discrimination index: A tool for land cover identification. Int. J. Environ. Sci. Technol. 2019, 17, 1113–1122. [Google Scholar] [CrossRef]
  30. Cassman, K.; Ladha, W.; Reichardt, D. Singh, Opportunities for increased nitrogen-use efficiency from improved resource management in irrigated rice systems. Field Crop. Res. 1998, 56, 7–39. [Google Scholar] [CrossRef]
  31. Xu, H.-C.; Dai, X.-L.; Chu, J.-P.; Wang, Y.-C.; Yin, L.-J.; Ma, X.; Dong, S.; He, M.-R. Integrated management strategy for improving the grain yield and nitrogen-use efficiency of winter wheat. J. Integr. Agric. 2018, 17, 315–327. [Google Scholar] [CrossRef]
  32. Cen, H.; Wan, L.; Zhu, J.; Li, Y.; Li, X.; Zhu, Y.; Weng, H.; Wu, W.; Yin, W.; Xu, C.; et al. Dynamic monitoring of biomass of rice under different nitrogen treatments using a lightweight UAV with dual image-frame snapshot cameras. Plant Methods 2019, 15, 32. [Google Scholar] [CrossRef] [PubMed]
  33. Zheng, H.; Cheng, T.; Zhou, M.; Li, D.; Yao, X.; Tian, Y.; Cao, W.; Zhu, Y. Improved estimation of rice aboveground biomass combining textural and spectral analysis of UAV imagery. Precis. Agric. 2019, 20, 611–629. [Google Scholar] [CrossRef]
Figure 1. Calculation steps of 4 topdressing methods for winter wheat. (THP, TRL, TLZ and TLF are different topdressing methods; RN: recommended nitrogen fertilizer amount for topdressing, RV: relative volume, AGB: above ground biomass, Nt: nitrogen concentration in aboveground part at topdressing period, Nh: nitrogen concentration in aboveground part at harvest, INSEY: in-season estimates of grain yield, PGY: predicted grain yield, FNUP: forage nitrogen uptake, NUP: N uptake in the aboveground part; the subscripts represent different times, i.e., t represents topdressing and h represents harvest, except for AGBth, which represents a threshold of AGB at topdressing).
Remotesensing 13 02349 g001
Figure 2. Study site and the experimental design. (a) The location of the Fengqiu Agro-ecological experimental station, CAS. (b) Experimental design (THP, TLF, TRL, TLZ and T0 are different topdressing methods, and basal fertilizer levels (B0, B1 and B2) are represented by different colors).
Remotesensing 13 02349 g002
Figure 3. Rainfall and irrigation and mean temperature recorded during the 2018 to 2019 wheat growing seasons in Fengqiu Agro-ecological experimental station, CAS.
Remotesensing 13 02349 g003
Figure 4. UAV-based images of winter wheat under different basal fertilizer levels. (a) RGB. (b) NDVI. (c) Coverage.
Remotesensing 13 02349 g004
Figure 5. Illustration of formulas used in THP, TRL and TLZ obtained from the auxiliary experiment. (a) Predicting potential grain yield (PGY) from INSEY (in-season estimate of grain yield). (b) Predicting forage nitrogen uptake (FNUNDVI) from the normalized difference vegetation index (NDVI). (c) Predicting nitrogen concentration in the aboveground part at topdressing (Nt) from NDVI. (d) Predicting aboveground biomass at topdressing, AGBt from relative volume.
Remotesensing 13 02349 g005
Figure 6. Recommended nitrogen fertilizer amount for topdressing for each unit. (THP, TLF, TRL, TLZ, and T0 represent different topdressing methods).
Remotesensing 13 02349 g006
Figure 7. Recommended nitrogen fertilizer amount for topdressing under different basal fertilizer levels. (B0, B1 and B2 represent basal fertilizer levels of 0, 57 and 114 kg∙ha−1, respectively; THP, TLF, TRL, and TLZ represent different topdressing methods; different letters indicate significance using Fischer’s protected least significant difference at p < 0.05).
Remotesensing 13 02349 g007
Figure 8. Growing status of winter wheat after topdressing. (ac) Cumulative graphs of above ground biomass. (df) Cumulative graphs of plant height. (gi) Decreasing graphs of nitrogen concentration in above ground part. (jl) Decreasing graphs of chlorophyll concentration. (B0, B1 and B2 represent basal fertilizer levels of 0, 57 and 114 kg∙N∙ha−1, respectively; THP, TLF, TRL, TLZ, and T0 represent different topdressing methods; different letters indicate significance using Fischer’s protected least significant difference at p < 0.05 at the milk ripe stage).
Remotesensing 13 02349 g008
Figure 9. Grain yield and straw biomass of winter wheat under different topdressing methods. (ac) Grain yields of different topdressing methods under three basal fertilizer levels. (df) Straw biomasses of different topdressing methods under three basal fertilizer levels. (B0, B1, and B2 represent basal fertilizer levels of 0, 57 and 114 kg∙N∙ha−1, respe (B0, B1, and B2 represent basal fertilizer levels of 0, 57 and 114 kg∙N∙ha−1, respectively; THP, TLF, TRL, TPGY, and TLZ represent different topdressing methods; different letters indicate significance using Fischer’s protected least significant difference at p < 0.05).
Remotesensing 13 02349 g009
Table 1. Growth status of winter wheat under different basal fertilizer levels before topdressing.
Growth ParametersPlant Height (cm)Above Ground Biomass (Mg·ha−1)Chlorophyll Concentration (μmol·m−2)Nitrogen Concentration in Above Ground Part (g·kg−1)
B019.33 ± 1.81 (c)1.59 ± 0.06 (c)540.79 ± 11.39 (c)18.05 ± 0.55 (c)
B122.94 ± 2.85 (b)1.80 ± 0.05 (b)598.94 ± 13.77 (b)20.93 ± 0.47 (b)
B225.02 ± 2.04 (a)2.10 ± 0.06 (a)649.18 ± 15.01 (a)22.93 ± 0.66 (a)
B0, B1 and B2 represent basal fertilizer levels of 0, 57, and 114 kg∙N∙ha−1, respectively; different letters indicate significance within the same column using Fischer’s protected least significant difference at p < 0.05.
Table 2. Average NDVI and coverage of winter wheat under different basal fertilizer levels.
Remote Sensing InformationNDVICoverage
B00.77 ± 0.04 (c)49.99% ± 9.76% (c)
B10.83 ± 0.02 (b)65.98% ± 6.99% (b)
B20.85 ± 0.02 (a)76.41% ± 6.62% (a)
B0, B1 and B2 represent basal fertilizer levels of 0, 57 and 114 kg∙N∙ha−1, respectively; different letters indicate significance within the same column using Fischer’s protected least significant difference at p < 0.05.
Table 3. Partial factor productivity from applied nitrogen of topdressing (PFPt).
PFPtB0B1B2
THP11.86 ± 1.69(a)14.90 ± 2.12 (a)9.84 ± 1.65 (a)
TLF12.01 ± 1.63(a)14.72 ± 2.03 (a)9.56 ± 1.72 (a)
TRL10.92 ± 2.56(a)12.56 ± 1.74 (a)9.37 ± 1.39 (a)
TLZ11.59 ± 1.85(a)14.72 ± 1.80 (a)10.12 ± 1.87 (a)
B0, B1 and B2 represent basal fertilizer levels of 0, 57, and 114 kg∙N∙ha−1, respectively. THP, TLF, TRL, and TLZ represent different topdressing methods. Different letters indicate significance within the same column using Fischer’s protected least significant difference at p < 0.05.
Publisher’s Note: MDPI stays neutral with regard to jurisdictional claims in published maps and institutional affiliations.

