
Using the Global Hydrodynamic Model and GRACE Follow-On Data to Access the 2020 Catastrophic Flood in Yangtze River Basin


1
State Key Laboratory of Water Resources and Hydropower Engineering Science, Wuhan University, Wuhan 430072, China
2
School of Civil & Hydraulic Engineering, Huazhong University of Science and Technology, Wuhan 430072, China
3
Bureau of Hydrology, Changjiang Water Resources Commission, Wuhan 430010, China
*
Author to whom correspondence should be addressed.
Remote Sens. 2021, 13(15), 3023; https://doi.org/10.3390/rs13153023
Submission received: 2 July 2021
/
Revised: 29 July 2021
/
Accepted: 29 July 2021
/
Published: 1 August 2021
Abstract
:Flooding is one of the most widespread and frequent weather-related hazards that has devastating impacts on the society and ecosystem. Monitoring flooding is a vital issue for water resources management, socioeconomic sustainable development, and maintaining life safety. By integrating multiple precipitation, evapotranspiration, and GRACE-Follow On (GRAFO) terrestrial water storage anomaly (TWSA) datasets, this study uses the water balance principle coupled with the CaMa-Flood hydrodynamic model to access the spatiotemporal discharge variations in the Yangtze River basin during the 2020 catastrophic flood. The results show that: (1) TWSA bias dominates the overall uncertainty in runoff at the basin scale, which is spatially governed by uncertainty in TWSA and precipitation; (2) spatially, a field significance at the 5% level is discovered for the correlations between GRAFO-based runoff and GLDAS results. The GRAFO-derived discharge series has a high correlation coefficient with either in situ observations and hydrological simulations for the Yangtze River basin, at the 0.01 significance level; (3) the GRAFO-derived discharge observes the flood peaks in July and August and the recession process in October 2020. Our developed approach provides an alternative way of monitoring large-scale extreme hydrological events with the latest GRAFO release and CaMa-Flood model.

1. Introduction
Flooding is one of the most widespread and detrimental natural hazards causing huge adverse impacts on infrastructures, public services, and ecosystem [1]. In the context of global warming and human activities, the increasingly frequent and severe floods in the recent decades imply an urgent necessity to better monitor flood events for sustainable development [2,3]. Exceptional basin-wide floods threatened the Yangtze River basin from July to October in 2020. In July 2020, the water levels along the middle and lower reaches of the Yangtze River constantly exceeded the warning water levels due to continuous heavy storms. Subsequently, another huge flood event occurred in the upper Yangtze River in August 2020. The high disaster losses of 2.42 billion Yuan and 263,200 affected people caused by the 2020 flood in the Yangtze River basin have attracted great attention for flood control and monitoring strategies [4]. As a direct hydrological parameter, runoff explicitly determines the intensity and scale of floods. To improve runoff monitoring, several methods [5] have been employed to measure and quantify runoff, including in situ observations, hydrological simulation, and by remote sensing techniques. Hydrometric stations directly measure runoff in point scale on the ground. However, the distribution is sparse and the number of observation stations worldwide has decreased considerably due to considerable financial and material costs [6,7]. Alternatively, advanced hydrological models provide a diagnostic tool for simulating runoff continuously [8]. However, the uncertainty in their parameters is expected to increase in ungauged and poorly gauged regions as in situ runoff observations are needed to constrain their simulations [9]. Additionally, hydrological models performed poorly in some catchments with complicated hydrological processes, including the Amazon Basin and the Yangtze River basin, due to the simplified process [10]. With rapid advances in remote sensing technologies and Earth system modeling, spaceborne sensors and state-of-the-art numerical weather models have provided a diagnostic tool for measuring river discharge at a near-global coverage and an unprecedented spatiotemporal resolution. The water width and flow velocity of rivers can be remotely derived from optical images comprising Landsat 5/6/7, MODIS, as well as Sentinel 1/2 satellites data. Satellite radar and laser altimetry carried out on the currently operational satellites such as Envisat, Jason 1/2/3 and Sentinel 3 A/B, Icesat 1/2 extract the information of water level from re-tracked radar waveforms. The multi-source remotely sensing products have been used in evaluating river runoff based on the Manning’s equation and corresponding empirical relationship with water surface parameters [11]. However, these remotely sensing products are difficult to apply in medium and small rivers due to their coarse spatiotemporal resolution and complicated post-processing procedures [12].
The Gravity Recovery and Climate Experiment (GRACE) mission provides another approach to access runoff variation at a basin scale. GRACE has produced monthly gravity fields globally in the form of equivalent water height, and is a robust approach for monitoring large-scale changes in terrestrial water storage (TWS). GRACE ignores the limitations of traditional ground observations in time and space, providing high accuracy and concise hindcasts compared to in situ monitoring, hydrological models, and other spaceborne-based satellites [13]. GRACE-derived TWS change is an important variable in the water cycle, which represents water budget changes governed by multiple water fluxes including precipitation, evapotranspiration, and runoff. Hence, accurate quantification of terrestrial water storage anomaly (TWSA) determines the evaluation of runoff and influences the antecedent soil moisture [14]. The implementation of GRACE enabled the study of runoff evaluation and flood monitoring from a totally new perspective. Syed [15] firstly estimated freshwater runoff at a continental scale during the period of 2003–2005 based on GRACE data and achieved satisfactory performance at both monthly and annual scales. More recently, the extraction of runoff components from GRACE-derived TWSA data has been widely validated at basin and local scales around the globe, such as the Yangtze River basin [16], the Amazon basin [17], the East Africa Rift Valley [18], the Gulf of Alaska watershed [19], and many other areas [20,21,22]. Given the robust ability to monitor the large-scale water variation of GRACE, its contribution to the flood monitoring has attracted much attention. Reager and Famiglietti proposed the Flood Potential Index (FPI) based on GRACE and remote sensing precipitation data to represent the effective TWS capacity [23]. With the FPI data, the flood monitoring potential of GRACE-derived TWSA has been examined at diverse climate regions [24,25,26,27,28], which even shows high performance in observing large-extent and long-duration floods.
After the retirement of GRACE in June 2017, GRACE Follow-On (GRAFO) satellites, launched in June 2018, continue to provide consecutive TWSA data for global applications in hydrology, geology, and oceanology [29,30]. Compared with its predecessor, the laser ranging system of the GRAFO twin satellites additionally provides angle-variable information. The improvements of the measurement accuracy and scientific data system enable GRAFO satellites to sense gravitational variation at a finer scale, thus realizing more accurate observations of Earth’s gravity than GRACE [31,32].
Although a few studies have extracted and evaluated the runoff yield from GRACE-derived TWSA based on water budget, few works have taken the runoff routing processes into consideration and the reliability of GRAFO-based runoff data is unexamined. Therefore, this study attempts to investigate the runoff variation using GRAFO data based on water budget and river-flow route processes via the CaMa-Flood model, by taking the 2020 catastrophic flood event in the Yangtze River basin as our case study. Moreover, we demonstrate the spatiotemporal variation of GRAFO-derived discharge as well as flood potential during the flood. The relationship between precipitation and atmospheric circulation factors including the NINO3.4 and North Atlantic Oscillation (NAO) indexes during the flood period is also discussed, which may provide rich information as references for investigating potential causes of the exceptional flood in the Yangtze River basin.
2. Study Area
The focus of this study is the Yangtze River basin of China, which controls a drainage area of about 1,671,677 km2, equaling to approximately 20% of the territory of mainland China. As the longest river in China, the Yangtze River originates from the Tibetan Plateau in the west and eventually empties into the East China Sea in the east of China (see Figure 1). The topography of the Yangtze River basin appears as a ladder-like distribution from west to east with an average elevation of 748 m. The spatial distribution of precipitation is uneven because of the complicated geographical and topographical environment. The subtropical monsoon climate dominates the basin where tropical hot-air masses and polar dry- and cold-air masses meet. The mean annual precipitation is about 1100 mm, which presents a remarkable seasonal distribution, and more than 70% of the annual rainfall is distributed during the wet season between May and October. The uneven spatiotemporal-distributed precipitation indicates the large-scale floods are prone to occur from May to October every year. Given the fact that the Yangtze River basin sustains about 400 million people and occupies approximately 40% of the Gross Domestic Product of China, flood monitoring is of great significance for the reduction of financial and life losses from flood disasters [33]. This study divides the Yangtze River basin into three parts, the upstream, midstream, and downstream sub-basins, with outlet gauge stations of Yichang, Hukou, and Datong, respectively (see Figure 1).
3. Data and Methods
3.1. Data
3.1.1. Remote Sensing Products
Five GRAFO datasets are used to provide monthly TWSA in the Yangtze River basin between June 2018 and October 2020, which comprise three Level 2 spherical harmonics solutions solved by the Center for Space Research at the University of Texas in Austin (CSR), Jet Propulsion Laboratory (JPL), and the German Research Center for Geoscience (GFZ), respectively, in addition to two mass concentration blocks solutions from CSR and GFZ, respectively. The GRAFO products all have the latest version, Release 06 for three spherical harmonics solutions and 02 for two mass concentration blocks solutions [34,35]. The monthly GRAFO datasets have been deducted from the average gravity field between 2004 and 2010 for the spherical harmonic’s solutions and between 2004 and 2009 for mass concentration blocks solutions. The spatial resolution of mass concentration blocks products has been resampled to for comparison with spherical harmonics solutions spatially. A simple linear interpolation method has been used to fill the missing TWSA values in August and September 2018. The continuous high-resolution GRAFO data is subsequently applied to evaluate runoff and calculate the Flood Potential Index (FPI) [22] combined with other meteorological forcing data (i.e., precipitation and evapotranspiration).
The remote sensing precipitation dataset used in this study derives from the Global Precipitation Measurement (GPM) mission, which is an international network of satellites that provide next-generation global observations of rain and snow. The Core Observatory satellite of the GPM launched in February 2014 carried out the Dual-Frequency Precipitation Radar and GPM Microwave Imager instruments to generate a global precipitation dataset. The Integrated Multi-Satellite Retrievals (IMERG) algorithm is employed to merge microwave-calibrated infrared satellite estimates, satellite microwave precipitation estimates, and in situ precipitation data with fine accuracy and consistency all over the globe [36]. The GPM IMERG version 06 product is applied with a 3-month latency. Moreover, the monthly precipitation dataset from the GPM mission has a high spatial resolution of , and subsequently resampled at a gridded scale to match the spatial resolution of GRAFO data.
To figure out the influential factors on the exceptional 2020 flood in the Yangtze River basin, some atmospheric circulation factors including NINO3.4 and NAO indexes were applied. The NINO3.4 index is an El Niño/Southern Oscillation (ENSO) indicator based on sea surface temperatures, which is calculated as the average sea surface temperature anomaly between 1981 and 2010 in the region bounded by 5° N to 5° S, from 170° W to 120° W. An El Niño or La Niña event is identified if the 3-month moving average of the NINO3.4 index exceeds +0.5 °C for El Niño or −0.5 °C for La Niña for at least 5 consecutive months [37]. The NOAA OISST version 2 dataset provides the daily sea surface temperature at a high spatial resolution of from 1982 up to the present. The NOAA OISST product is generated based on the Advanced Very High-Resolution Radiometer (AVHRR) [38].
3.1.2. Reanalysis Dataset
The Global Land Evaporation Amsterdam Model (GLEAM) is a set of algorithms that separately estimate the different components of land evapotranspiration including transpiration, bare-soil evaporation, interception loss, open-water evaporation, and sublimation. The monthly GLEAM dataset has a spatial resolution of (subsequently resampled to ) [39]. This study selects the evapotranspiration data of the latest version of GLEAM v3.5a to derive runoff data combined with TWSA and precipitation data using the water balance equation. Moreover, the monthly derived NAO index is used in this study because of its strong relationship with extreme precipitation across the south China [38]. The NAO index is defined as the difference the between normalized sea level pressure over Gibraltar and the normalized sea level pressure over Southwest Iceland, which are taken from the National Center for Environmental Prediction (NCEP) reanalysis data at a relatively coarse resolution of .
3.1.3. Model Outputs
The Global Land Data Assimilation System (GLDAS-Version 2.1) involves multiple land surface and hydrological models including Noah, the Community (CLSM), and the Variable Infiltration Capacity (VIC) models [8,40]. The monthly total runoff data from GLDAS is utilized for comparison with water budget estimates, which is the monthly accumulation of the sum of surface runoff and subsurface runoff as groundwater is not modeled by the GLDAS. The total precipitation and evapotranspiration data are also obtained from GLDAS to evaluate the uncertainty sourced from different hydrological factors. Similarly, the spatial resolution of the models of GLDAS is thus a direct spatial comparison between runoff from GLDAS and the water balance equation can be carried out.
3.1.4. In Situ Observations
Average monthly discharge observations are collected from the Yichang, Hukou, and Datong gauge stations (see Figure 1) between June 2018 and October 2020, which are considered as the outlets of the upper, middle, and lower reaches of the Yangtze River basin. The records are continuous and have followed a strict quality control policy.
3.2. Methods
3.2.1. Water Balance Equation
The water balance equation is utilized to evaluate the monthly runoff volume in the form of equivalent water height based on multisource datasets at grid and basin scales as follows:
where (mm/month) is the monthly runoff depth, P (mm/month) represents the monthly precipitation from GPM IMERG, ET (mm/month) denotes monthly GLEAM-derived evapotranspiration, and dS/dt (mm/month) is the difference of TWSA from GRAFO, which is calculated as follows:
where (mm) represents the terrestrial water storage anomaly of ith month.
3.2.2. Uncertainty and Error Analysis
Analysis of Variance (ANOVA) is an effective tool to decompose the total variance into variance of different sources for quantification of variance sourced from different hydrological variables in the total variance, which has been widely used for uncertainty assessment in hydrology and meteorology [41]. By implementing multiple products for each hydrological variable in the water balance equation (i.e., precipitation, TWSA, and evapotranspiration), we can obtain a large ensemble of 80 runoff evaluations for the estimation of the relative uncertainty contribution rate of each hydrological factor and their interactions via a three-way ANOVA. The total uncertainty, expressed as variance, is separated into different contributions as follows:
where is the total variance, and ,, and represent the variance contributed by the effects of precipitation, TWSA, evapotranspiration, and their interactions, respectively. I, J, and K denote the number of datasets of 4 precipitation data (GPM, GLADS-CLSM, GLADS-Noah, and GLADS-VIC), 5 TWSA data (Spherical harmonics of CSR, JPL and GFZ, mascon concentration blocks of CSR and JPL), and 4 evapotranspiration (GLEAM, GLADS-CLSM, GLADS-Noah, and GLADS-VIC), respectively. is the runoff derived from the rainfall, TWSA, and evapotranspiration data sets, represents the mean runoff using all datasets combinations, , , and refer to the averaged runoff using the combination of rainfall, TWSA, and evapotranspiration datasets, respectively.
Therefore, the fractional contributions of different sources to overall uncertainty can be calculated by dividing total variance from results from different sources. Moreover, the standard deviations of 4 precipitation products, 5 TWSA solutions, 4 evapotranspiration datasets, and 80 runoff estimations are computed for each month to represent their variability. For validation of water balance estimates of runoff data (totalling 80 datasets), the multiple hydrological models of GLDAS (i.e., Noah, CLSM, and VIC) are added into comparison. The Pearson correlation coefficient (CC) is used to evaluate the linear relationship between GRAFO-derived and GLDAS-simulated runoff in the Yangtze River basin [42]. Furthermore, the field significance of the CCs is estimated by comparing the percentage of grids where significant correlation is detected to the percentage of grids where significant trend would be expected to occur by chance to overcome the impact of spatial autocorrelations of 167 grid cells across the Yangtze River basin [43]. A stepwise decreasing significance level of 10%, 5%, and 1% is imposed to the average spatial pattern of CCs with a false discovery rate (FDR) of 0.1. The FDR approach is considered as one of the strongest multiple comparison tests [44].
3.2.3. CaMa-Flood Hydrodynamic Model
For direct comparison between water budget estimates of runoff (unit in mm) and in situ observations (unit in m3/s) at the gauge station, the latest CaMa-Flood version 4.0 is forced using GRAFO-derived runoff datasets. The CaMa-Flood model is a distributed global river network routing model designed to simulate the hydrodynamics in continental-scale rivers [45]. It routes the high-resolution streamflow from one grid cell to another by adapting the grid-vector hybrid river network map and local inertial equation. The parameters and variables used in the CaMa-Flood model are channel length, channel width, bank height derived from high resolution 90 m surface elevation map (MERIT DEM) and river network map (MERIT Hydro) over the Yangtze River basin. In addition, the regional parameters for the floodplain reservoir include the unit catchment area, the floodplain elevation profile, the floodplain water depth, and the flooded area. The assumption made in the model is that inundation will always occur from lower to higher elevation. The CaMa-Flood hydrodynamic model is performed based on the discretized unit-catchments for each grid cell over the floodplain reservoir. The Flexible Location of Waterways (FLOW) approach is employed to locate the downstream grid cells away from the immediate neighborhood of the grid, rather than merely considering one of the eight neighboring cells as downstream cells in previous studies. Based on the local inertial equation, the river streamflow Q () from each cell toward its downstream cell is calculated by neglecting the second term of the St. Venant momentum equation as:
where A and h means the cross-section area (m2) and depth of flow (m), respectively. R, z, and n is the hydraulic radius (m), bed elevation (m), and the Manning’s roughness coefficient (default set to 0.03 ) in the whole river reach. Moreover, x and t donate the flow distance and time. The first, second, third, and fourth terms of the local inertial Equation (9) represent the local acceleration, advection, water slope, and friction slope, respectively.
The global-scale CaMa-Flood model has high computational efficiency and greatly improves the simulation of peak flow with realistic surface water dynamics [46]. By coupling the CaMa-Flood model with GRAFO-derived runoff in addition to GLDAS results, monthly modeled flow discharge is obtained along the Yangtze River with a high spatial resolution of .
3.2.4. Flood Potential Index
To monitor the large-scale flood event in the Yangtze River basin, this study calculates flood potential index (FPI) according to Reager and Famiglietti [23]:
where FPA(t) (mm) is the flood potential amount of the specific month that indicated the capacity of storing the potential rainfall into the land. P(t) (mm) is the remote sensing precipitation of the corresponding month. and (mm) represent the maximum GRAFO TWSA and the previous month’s value during the period from June 2018 to October 2020, respectively. The regional terrestrial storage ability is expressed as the difference between and . represents the highest difference between precipitation and regional storage variability (i.e., FPA(t)) during the same period. A larger FPI(t) donates the higher possibility of flood.
3.2.5. Time Series Decomposition
We also apply the seasonal trend decomposition using local regression (STL) to de-seasonalize the monthly time series of precipitation and GRAFO-derived discharge from July 2018 to October 2020. The STL proposed by Cleveland et al. [47] is a robust time series decomposing method, which decomposes the original time series into three components, including trend, seasonal, and residual series as follows:
where is the original time series of precipitation or runoff, , and refer to the trend components, seasonal cycle, and residual signals of , respecyively.
4. Results
4.1. Uncertainty Analysis
An ANOVA approach is adopted to quantify the relative contribution of different hydrological variables and their interactions to the overall uncertainty in runoff estimates, and the standard deviation was calculated to represent their respective variability. Figure 2 presents multiple time series of precipitation, evapotranspiration, and GRAFO-derived TWSA in the Yangtze River basin between June 2018 and October 2020. The precipitation, TWSA, and evapotranspiration present a similar pattern that decreases to the lowest in December 2019 and reaches to the highest in July 2020. Regional precipitation from CLSM, VIC, and Noah models of GLDAS show nearly no difference all the time. The discrepancy between GLDAS precipitation and GPM products during the dry season is relatively larger than that during the wet season. The results also indicate that the VIC-modeled evapotranspiration presents an overall underestimation of about 15 mm than other GLDAS outputs, with slight differences between GLEAM, CLSM, and Noah results. In terms of TWSA, two mass concentration blocks solutions are generally higher than spherical harmonics products, although they are in good agreement.
We also accessed the spatial distribution of the average standard deviation of precipitation, TWSA, as well as evapotranspiration in Figure 3c–e. Three different hydrological elements exhibit a similar spatial distribution that their variability decreases from the west to the east. The variability of precipitation ranges from 0 to 20 mm in the upstream Yangtze River and increases between 30 and 40 mm in the lower reaches. Evaporation shows a stable uncertainty from 10 to 20 mm in the majority of the Yangtze River basin and some relatively high values occur in the eastern basin. In terms of TWSA, the variability gradually increases from the west to the east of basin and peaks in the downstream of the Yangtze River basin ranging from 90 to 100 mm. Some grid cells show high uncertainty from 60 to 70 mm/month around the boundary in the north Yangtze River basin.
ANOVA results in Figure 4 present the relative contribution of different sources to overall uncertainty of runoff. At the basin scale, interactions of precipitation, TWSA, and evapotranspiration play a subtle role in the overall uncertainty of runoff both at the monthly and yearly scale with relative contribution below 0.1 because of the long-time span (i.e., a month and a year) and large-scale spatial averaging of the Yangtze River basin. TWSA dominates the uncertainty of runoff except for in December, and its relative contribution shows an obvious seasonal variation that peaks in July and decreases up to the end of year. The relative contribution of evapotranspiration illustrates a reverse distribution to precipitation and TWSA that decreases to the lowest in July, followed by a rapid rebound.
Spatially, Figure 5 indicates that precipitation dominates the overall uncertainty of runoff in middle reach of the Yangtze River basin with the relative contribution between 0.8 and 0.9, while TWSA governs the upper and lower reaches with a relative contribution higher than 0.9. However, evapotranspiration and interactions of three hydrological variables show an overall low relative contribution below 0.1, indicating that their uncertainties exert low impacts on the overall uncertainty in runoff at annual scale.
4.2. Evaluation of Discharge
Runoff between the period of July 2018 to October 2020 has been evaluated by combing multiple precipitation, TWSA, and evapotranspiration datasets based on the water balance equation. The variability in runoff is computed as the standard deviation of 80 runoff datasets per month. Spatially, we calculated an average pattern of CCs between multiple GRAFO-derived runoff and GLDAS-modeled datasets and performed at the field significance level of 10%, 5%, and 1%, respectively (see Figure 6). As seen, the upper and center of the middle reaches of the Yangtze River basin show high CCs ranging from 0.8 to 1, while other regions present relatively low CCs between 0.4 and 0.6 compared with GLDAS results, consistent with the spatial distribution of variability of GRAFO-derived runoff and that of TWSA according to Figure 3a and 3d. We further detected the spatial distribution of GLDAS-modeled runoff in Figure 3b. It exhibits an overall low variability ranging from 0 to 15 mm over the basin. It indicates that bias of precipitation and TWSA are responsible for the poor correlation between water budget estimates and simulations from GLDAS in the east midstream and downstream of the Yangtze River basin. The variability of GLDAS output data also plays a secondary role. Moreover, the significant grid cells are usually concentrated in specific regions (i.e., upper and partial middle reaches of the basin) at different significance levels. The average percentage of grid cells with good correlations is 98%, 96%, and 79% at the 10%, 5%, and 1% significance level, respectively, indicating the local field significance of the correlations at the 5% level after an FDR of 0.01.
The CaMa-Flood model is employed to converge GRAFO-derived runoff along the Yangtze River for comparison with in situ observations and simulations from GLDAS (see Figure 7). For the upper reach of Yangtze River basin, a good correlation is discovered between ensemble mean of water budget estimates and in situ measurements (CC = 0.83, p < 0.01) and GLDAS-modeled results (CC = 0.93, p < 0.01). A high Nash–Sutcliffe efficiency value of 0.85 is found between GRAFO-derived discharge and GLDAS results, slightly greater than that with observations (NSE = 0.49). Similarly, GRAFO-derived discharge agrees well with GLDAS results and measurements with the CC/NSE of 0.72/0.35 and 0.94/0.92 in the midstream Yangtze River basin, while a relatively weaker accuracy between GRAFO-based discharge and in situ data (CC/NSE = 0.66/0.28) is found at the Datong station due to the overestimation between August and October 2019. In general, an approximate two-month lag exists between GRAFO/ GLDAS-based discharge and in situ observations, which might result from the uncertainty in uniform roughness parameter for the whole river reach and the monthly time step in the CaMa-Flood model [48].
While simulations from GLDAS underestimate the discharge peak in July 2020 and show large discrepancies during the wet season, it highlights that the variation range of GRAFO-derived discharge involves the observations and simulations with an exception in May and June 2020, showing good performance of water budget estimates.
4.3. The 2020 Flood
The spatial evolution of GRAFO-derived runoff (left panel) and their standard deviation (right panel) in the Yangtze River basin between July and October 2020 are presented in Figure 8. There are some negative values of runoff ranging from –100 to 0 mm, which are generally located in the area with relatively high variability. It indicates that the bias of precipitation and TWSA together with evapotranspiration result in these abnormal negative values of runoff. The leakage and bias effect of GRAFO observations may result in the bias of TWSA around the boundary, and some human activities, including reservoir operation and water diversion, could impact the accurate measurements of GRAFO satellites. In June 2020, the northeast, central of the middle, and the whole of the lower reaches of the Yangtze River basin show the high runoff surplus ranging from 300 to 400 mm, indicating the formation of a flood. Then, the scale and intensity of the flood increase substantially in July and the majority along the Yangtze River, particularly in the middle and lower reach of the catchment, while the reported water table level in the Tai Lake has exceeded the highest safety water level and some stations of the Poyang Lake reached their highest water levels in its history [4]. In August, the highest runoff (348 mm during the period June–October) was detected in the upstream of the Yangtze River basin and other regions experienced a flood recession process, which was validated by the fact that huge flooding occurred in the Min River and the Jialing River in the upper Yangtze River [4]. The flood continued to develop from the east to the west and the lower reach of the basin experienced a severe runoff gain in September. During October, GRAFO-derived runoff illustrated a comprehensive drop temporally and spatially, consistent with the hydrological records [4]. However, the water budget estimates of grid cells located in the lower reach of the basin presented a runoff depletion between –100 and –50 mm because of high variability of runoff here (see Figure 3a). We also accessed the average spatial pattern of discharge during the 2020 flood in the Yangtze River basin by coupling the CaMa-Flood model with 80 GRAFO-based runoff datasets (see Figure 9), which describes the dynamic hydrological process with a high spatial resolution of . Figure 9 shows a clear flood evolution process from the upstream to the downstream along the Yangtze River. The routing simulations capture the flood peaks in July and August and the recession process in October spatially [4], as revealed by the Yichang, Hukou, and Datong hydrological stations (see Figure 1). The spatial distribution of the standard deviation of ensemble discharge simulations from the CaMa-Flood model is similar to the modeling results. The modeling results along the Yangtze River present the highest uncertainty compared to other tributaries.
Alternatively, the spatial variation of the FPI index was derived based on TWSA and precipitation data, as shown in Figure 10. As a preferable tool to monitor large-scale flooding using GRACE data, FPI presented highly similar spatial distribution to that of runoff. The FPI in the whole of basin in July and values in the upper reach of the catchment in August exceeded 0.9, indicating great potential to forming the flood, in good agreement with runoff data. It suggested that GRAFO-derived FPI played an important role in monitoring the exceptional basin-wide flooding occurring both in July and August. The comprehensive spatial decrease of FPI in October is also strongly correlated to the runoff change of the month. The temporal variation of the regional FPI during the flood is depicted in Figure 11, which shows that FPI exceeded 0.5 continuously from June to September and reached 1 in July before a decrease in October, indicating a basin-wide flood is likely to occur. The successful response to the flood process indicates the huge flood monitoring potential of FPI based on GRAFO data.
5. Discussion
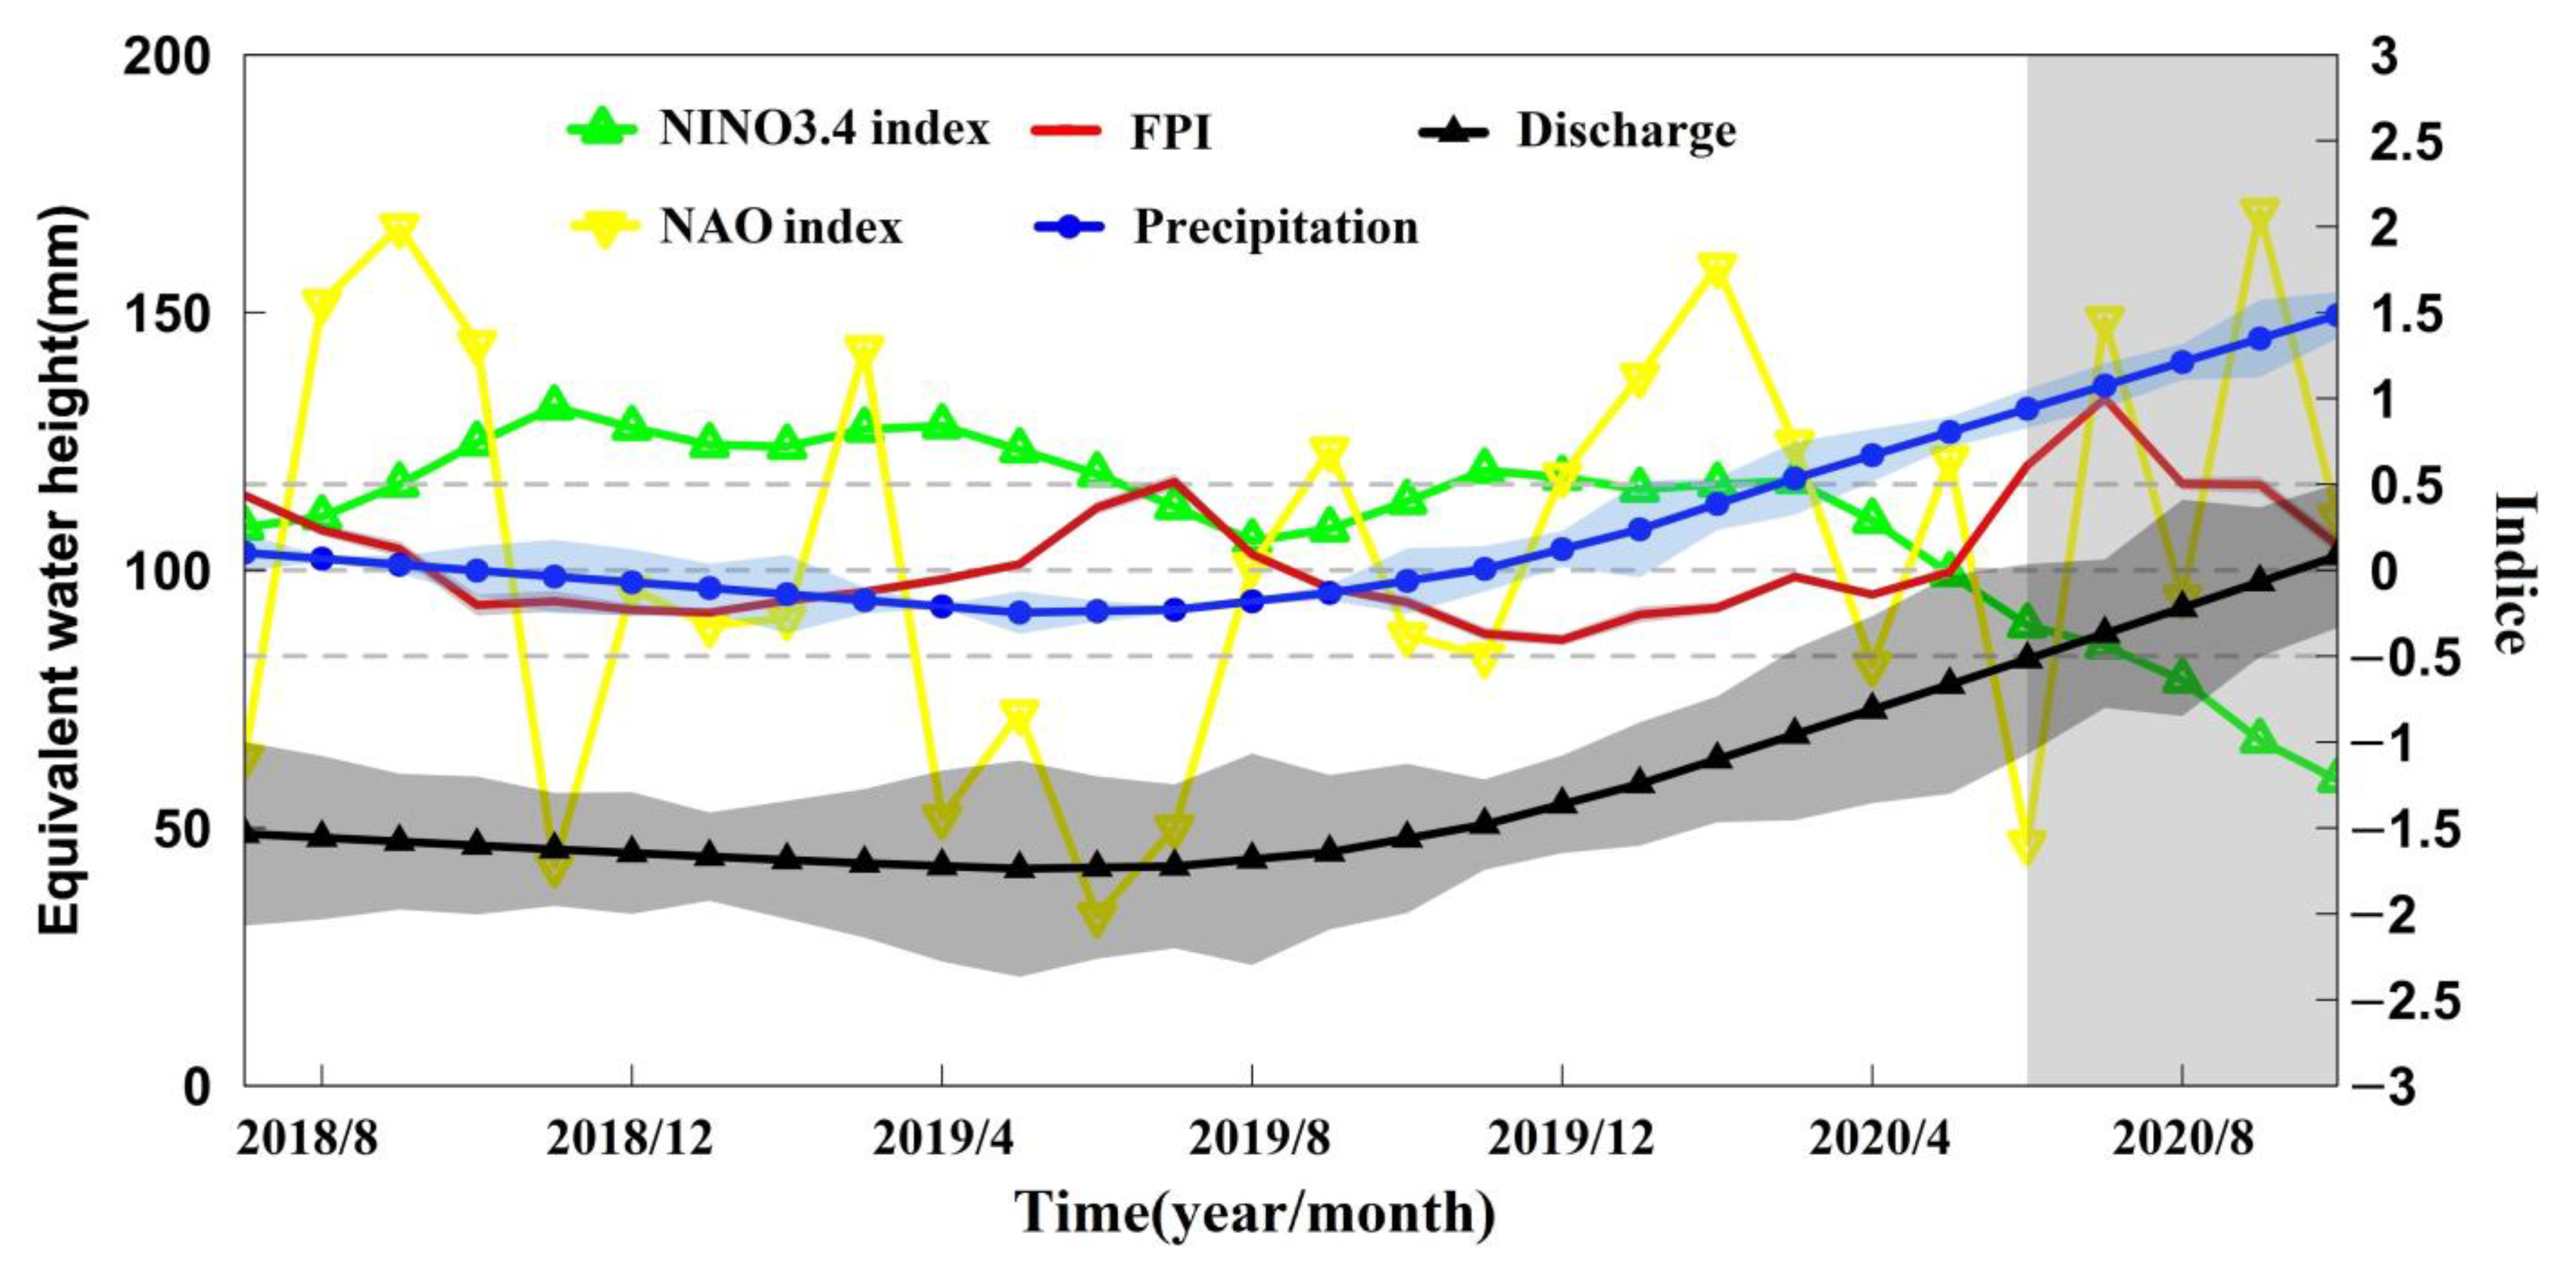
De-seasonalized data is useful for exploring the trendF and other remaining irregular signals [45]. To capture the temporal variation of precipitation and its relationship with runoff, we de-seasonalize the ensemble means of multiple discharge at the Datong station and basin average precipitation datasets, as well as their variability in the Yangtze River basin between July 2018 and October 2020 (see Figure 11). The trend component of runoff is consistent with that of rainfall, particularly during the flood period. The CC between nonseasonal discharge and precipitation is as high as 0.98 without time lag, indicating that the increasing heavy precipitation is the main contributor to the basin-wide flooding from June to October. Furthermore, two atmospheric circulation factors including NINO3.4 and NAO indexes are compared to investigate the potential causes of the sharply increased rainfall. The NINO3.4 index is taken as the 3-month moving average of the original NINO3.4 index to indicate an El Niño or La Niña event [49]. The averaged NINO3.4 index is slightly higher than 0.5 during the period from November 2019 to March 2020 continuously, except for in January 2020 (0.47), indicating that a weak El Niño event has occurred. The formation of a weak El Niño event strengthened the western Pacific subtropical high. Therefore, a quantity of warm and wet air current brought from the westward Western Pacific and the South China Sea met the cold air from north China and traveled around the Yangtze River basin, leading to the sharp increase in precipitation [50,51]. Moreover, the decrease in the averaged NINO3.4 index is strongly correlated to the change in precipitation during the flood period with a CC of 0.87, which was lower than –0.5 in August and September, followed by an abnormally low value of –1.22 in October 2020. The continuous NINO3.4 index below –0.5 suggests that a La Niña phenomenon is likely to occur during the flood, which is also related to an increase in frequency and intensity of precipitation extremes in the current year [52]. Alternatively, a relatively high NAO index of 1.77 was found in February 2020 and the values of 1.46 and 2.09 occurred in July and September 2020, respectively. The extremely positive NAO index also influenced the increase in precipitation with time delay [53,54,55]. Moreover, the South Asian monsoon played a secondary role in the increase in rainfall by bringing the wet and warm air to the Yangtze River basin. In general, several atmospheric circulation factors contribute to the great increase in the Yangtze River basin during the flood, which favors the formation of the basin-wide flood.
Although GRAFO-derived discharge successfully reveals the extreme flood in the Yangtze River basin between June and October 2020, there are some limitations existing at the current stage. First, our method is more appropriate to the large river basins (e.g., the Yangtze River basin) due to the coarse spatial resolution of GRACE Follow-On satellites (>150,000 km2). Secondly, the monthly GRACE Follow-On products with a significant time lag obstruct the estimation of runoff variation at the sub-monthly scale, indicating the poor monitoring ability for short-time and small-volume floods. Thirdly, the large biases of GRAFO data predominately impact on the evaluation of runoff. It is challenging to accurately quantify and reduce the uncertainty in GRAFO data because of the lack of adequate in situ TWSA or gravity measurements for validation. The residuals over the ocean can approximately measure the GRAFO biases [56]. However, the results may be overestimated as the ocean variability and deficiencies in the de-aliasing models are also included in the estimates of GRAFO uncertainty. Alternatively, the method proposed by Wahr et al. is also used to represent the coefficient residuals of the GRAFO spherical harmonics solutions mission by calculating the standard deviation of the residuals of coefficients when seasonal cycles have been removed [57]. The results may also overestimate the GRAFO biases considering the hypothesis that all non-seasonal variability of Stokes coefficients results from the GRAFO biases. Moreover, the uncertainty in parameters of CaMa-Flood model also contributes to the biases of GRAFO-based discharge.
6. Conclusions
This study estimated runoff using the multi-source satellite precipitation, evapotranspiration, and terrestrial water storage anomaly data based on the water balance budget in the Yangtze River basin during the period of July 2018–October 2020 and quantified the relative contribution of different hydrological parameters to the overall uncertainty in runoff estimates. Subsequently, the CaMa-Flood hydrodynamic model was coupled to simulate river discharge during the exceptional flood between July and October 2020. The main conclusions of this study were summarized as follows:
(1) ANOVA results suggest that uncertainty in TWSA dominates the overall uncertainty in water budget estimates of runoff temporally. Spatially, TWSA shows the highest relative contribution in the upper and lower reaches of the basin and precipitation governs the middle reach.
(2) Spatially, a field significance at the 5% level is discovered for the correlations between GRAFO-based runoff and GLDAS results. The CaMa-Flood-modeled streamflow is validated by in situ observations and GLDAS output, with relatively high correlation coefficients with in situ/GLDAS results in the upper (0.83/0.93), middle (0.72/0.94), and lower (0.66/0.93) reaches of the Yangtze River basin at the 0.01 significance level. Additionally, the fluctuation range of simulated discharge generally covers the in situ observations and GLDAS results.
(3) During the exceptional 2020 flood in the Yangtze River basin, the GRAFO-based discharge successfully observes the flood peaks in July and August and the recession process in October spatially and temporally, and the corresponding FPI also shows the reasonable monitoring potential for the 2020 flood.
Author Contributions
Conceptualization, J.X. and S.G.; methodology, J.Y. and L.G.; software, J.X. and L.G.; validation, J.X., J.Y., S.G. and F.X.; writing—review and editing, J.X.; supervision, S.G. All authors have read and agreed to the published version of the manuscript.
Funding
This study was financially supported by National Key Research and Development Project of China (2018YFC1508001) and China Three Gorges Cooperation (0799254).
Data Availability Statement
The code of CaMa-Flood hydrodynamic model can be found at http://hydro.iis.u-tokyo.ac.jp/~yamadai/cama-flood/index.html (last accessed on 2 July 2021); the GRACE and GLDAS data are obtained from NASA JPL (http://grace.jpl.nasa.gov, last accessed on 2 July 2021). The in-situ discharge are collected from the Bureau of Hydrology, Changjiang Water Resources Commission (http://www.cjh.com.cn/, last accessed on 2 July 2021).
Acknowledgments
The authors would like to thank GRACE Tellus for providing the GLDAS data (http://grace.jpl.nasa.gov, last accessed on 2 July 2021), hosted by the Goddard Earth Sciences Data and Information Services Center. GRACE land data were provided by the NASA MEaSUREs Program and are available at http://grace.jpl.nasa.gov (last accessed on 2 July 2021). The authors wish to express their gratitude to all authors of the numerous technical reports used for this paper.
Conflicts of Interest
The authors declare no conflict of interest.
References
- Barredo, J.I. Major flood disasters in Europe: 1950–2005. Nat. Hazards. 2007, 42, 125–148. [Google Scholar] [CrossRef]
- Milly, P.; Wetherald, R.T.; Dunne, K.A. Increasing risk of great floods in a changing climate. Nature 2002, 415, 514–517. [Google Scholar] [CrossRef]
- Yin, J.; Gentine, P.; Zhou, S.; Sullivan, S.C.; Wang, R.; Zhang, Y.; Guo, S. Large increase in global storm runoff extremes driven by climate and anthropogenic changes. Nat. Commun. 2018, 9, 4389. [Google Scholar] [CrossRef] [PubMed] [Green Version]
- Xia, J.; Chen, J. A new era of flood control strategies from the perspective of managing the 2020 Yangtze River flood. Sci. China Earth Sci. 2021, 64, 1–9. [Google Scholar] [CrossRef]
- Chen, J.L.; Tapley, B.; Rodell, M.; Seo, K.; Wilson, C.; Scanlon, B.; Pokhrel, Y. Basin-scale river runoff estimation from GRACE gravity satellites, climate models, and in situ observations: A case study in the Amazon Basin. Water Resour. Res. 2020, 56, e2020WR028032. [Google Scholar] [CrossRef]
- Yin, J.; Guo, S.; Gu, L.; Zeng, Z.; Liu, D.; Chen, J.; Shen, Y.; Xu, C. Blending multi-satellite, atmospheric reanalysis, and gauge precipitation products to facilitate hydrological modelling. J. Hydrol. 2021, 593, 125878. [Google Scholar] [CrossRef]
- Zhao, C.S.; Zhang, C.B.; Yang, S.T. Calculating e-flow using UAV and ground monitoring. J. Hydrol. 2017, 552, 351–365. [Google Scholar] [CrossRef]
- Rodell, M.; Houser, P.R.; Jambor, U.; Gottschalck, J.; Bosilovich, M. The global land data assimilation system. Bull. Amer. Meteorol. Soc. 2004, 85, 381–394. [Google Scholar] [CrossRef] [Green Version]
- Lou, H.; Wang, P.; Yang, S. Combining and comparing an unmanned aerial vehicle and multiple remote sensing satellites to calculate long-term river discharge in an ungauged water source region on the Tibetan Plateau. Remote Sens. 2020, 12, 2155. [Google Scholar] [CrossRef]
- Scanlon, B.; Zhang, Z.; Save, H.; Sun, A.; Schmied, H.; Beek, V.; Wiese, D.; Wada, Y.; Long, D.; Reedy, R. Global models underestimate large decadal declining and rising water storage trends relative to GRACE satellite data. Proc. Natl. Acad. Sci. USA 2018, 115, E1080–E1089. [Google Scholar] [CrossRef] [Green Version]
- Sichangi, A.W.; Wang, L.; Yang, K. Estimating continental river basin discharges using multiple remote sensing data sets. Remote Sens. Environ. 2016, 179, 36–53. [Google Scholar] [CrossRef] [Green Version]
- Yang, S.; Wang, P.; Lou, H. Estimating river discharges in ungauged catchments using the slope-area method and unmanned aerial vehicle. Water 2019, 11, 2361. [Google Scholar] [CrossRef] [Green Version]
- Yeh PJ, F.; Swenson, S.C. Remote sensing of groundwater storage changes in Illinois using the Gravity Recovery and Climate Experiment. Water Resour. Res. 2006, 42, W12203. [Google Scholar] [CrossRef]
- Famiglietti, J.S.; Rodell, M. Water in the balance. Science 2013, 340, 1300–1301. [Google Scholar] [CrossRef]
- Syed, T.H.; Famiglietti, J.S.; Chambers, D.P. GRACE-based estimates of terrestrial freshwater discharge from basin to continental scales. J. Hydrometeorol. 2009, 10, 22–40. [Google Scholar] [CrossRef]
- Ferreira, V.G.; Zheng, G.; He, X. Estimating total discharge in the Yangtze River basin using satellite-based observations. Remote Sens. 2013, 5, 3415–3430. [Google Scholar] [CrossRef] [Green Version]
- Frappart, F.; Ramillien, G.; Ronchail, J. Changes in terrestrial water storage versus rainfall and discharges in the Amazon basin. Int. J. Climatol. 2013, 33, 3029–3046. [Google Scholar] [CrossRef] [Green Version]
- Hassan, A.A.; Jin, S. Lake level change and total water discharge in East Africa Rift Valley from satellite-based observations. Glob. Planet. Chang. 2014, 117, 79–90. [Google Scholar] [CrossRef]
- Beamer, J.P.; Hill, D.F.; Arendt:, A. High-resolution modeling of coastal freshwater discharge and glacier mass balance in the Gulf of Alaska watershed. Water Resour. Res. 2016, 52, 3888–3909. [Google Scholar] [CrossRef] [Green Version]
- Mouyen, M.; Longuevergne, L.; Steer, P. Assessing modern river sediment discharge to the ocean using satellite gravimetry. Nat. Commun. 2018, 9, 3384. [Google Scholar] [CrossRef] [Green Version]
- Khan, R.; Usmani, M.; Akanda, A. Long-range River discharge forecasting using the gravity recovery and climate experiment. J. Water Resour. Plan. Manag. 2018, 145, 06019005. [Google Scholar] [CrossRef]
- Lorenz, C.; Kunstmann, H.; Devaraju, B.; Tourian, M.J.; Sneeuw, N.; Riegger, J. Large-scale runoff from landmasses: A global assessment of the closure of the hydrological and atmospheric water balances. J. Hydrometeorol. 2014, 15, 2111–2139. [Google Scholar] [CrossRef]
- Reager, J.T.; Famiglietti, J.S. Global terrestrial water storage capacity and flood potential using GRACE. Geophys. Res. Lett. 2009, 36, L23402. [Google Scholar] [CrossRef] [Green Version]
- Reager, J.T.; Thomas, B.F.; Famiglietti, J.S. River basin flood potential inferred using GRACE gravity observations at several months lead time. Nat. Geosci. 2014, 7, 589–593. [Google Scholar] [CrossRef]
- Molodtsova, T.; Molodtsov, S.; Kirilenko, A. Evaluating flood potential with GRACE in the United States. Nat. Hazards Earth Syst. Sci. 2016, 16, 1011–1018. [Google Scholar] [CrossRef] [Green Version]
- Idowu, D.; Zhou, W. Performance evaluation of a potential component of an early flood warning system-a case study of the 2012 flood, lower Niger River Basin, Nigeria. Remote Sens. 2019, 11, 1970. [Google Scholar] [CrossRef] [Green Version]
- Jaggi, A.; Weigelt, M.; Flechtner, F.; Guentner, A. European gravity service for improved emergency management, EGSIEM-from concept to implementation. Geophys. J. Int. 2019, 218, 1572–1590. [Google Scholar] [CrossRef]
- Yang, P.; Zhang, Y.Y.; Xia, J.; Sun, S.X. Identification of drought events in the major basins of Central Asia based on a combined climatological deviation index from GRACE measurements. Atmos. Res. 2020, 244, 105105. [Google Scholar] [CrossRef]
- Ciracì, E.; Velicogna, I.; Swenson, S. Continuity of the mass loss of the world’s glaciers and ice caps from the GRACE and GRACE Follow-on missions. Geophys. Res. Lett. 2020, 47, e2019GL086926. [Google Scholar] [CrossRef]
- Ghobadi-Far Han, S.; McCullough, C.; Wiese, D.; Watkins, M. GRACE Follow-On laser ranging interferometer measurements uniquely distinguish short-wavelength gravitational perturbations. Geophys. Res. Lett. 2020, 47, e2020GL089445. [Google Scholar] [CrossRef]
- Ghobadi-Far, K.; Han, S.-C.; Allgeyer, S. GRACE gravitational measurements of tsunamis after the 2004, 2010, and 2011 great earthquakes. J. Geod. 2020, 94, 65. [Google Scholar] [CrossRef]
- Wegener, H.; Mueller, V.; Heinzel, G.; Misfeldt, M. Tilt-to-length coupling in the GRACE Follow-On laser ranging interferometer. J. Spacecr. Rockets. 2020, 57, 1362–1372. [Google Scholar] [CrossRef]
- Wang, Q.; Xu, Y.; Wang, Y.; Zhang, Y.; Wang, J. Individual and combined impacts of future land-use and climate conditions on extreme hydrological events in a representative basin of the Yangtze River delta, China. Atmos. Res. 2019, 236, 104805. [Google Scholar] [CrossRef]
- Watkins, M.M.; Wiese, D.N.; Yuan, D.-N.; Boening, C.; Landerer, F.W. Improved methods for observing Earth’s time variable mass distribution with GRACE using spherical cap mascon. J. Geophys. Res. Solid Earth 2015, 120, 2648–2671. [Google Scholar] [CrossRef]
- Save, H.; Bettadpur, S.; Tapley, B.D. High-resolution CSR GRACE RL05 mascons. J. Geophys. Res. Solid Earth 2016, 121, 7547–7569. [Google Scholar] [CrossRef]
- Hou, A.Y.; Kakar, R.K.; Neeck, S.; Azarbarzin, A.A.; Kummerow, C.D.; Kojima, M.; Oki, R.; Nakamura, K.; Iguchi, T. The global precipitation measurement mission. Bull. Amer. Meteorol. Soc. 2014, 95, 701–722. [Google Scholar] [CrossRef]
- Reynolds, R.W.; Smith, T.M.; Liu, C.; Chelton, D.B.; Casey, K.S.; Schlax, M.G. Daily high-resolution blended analysis for sea surface temperature. J. Clim. 2007, 20, 5473–5496. [Google Scholar] [CrossRef]
- Feng, J.; Li, J.; Liao, H.; Zhu, J. Simulated coordinated impacts of the previous autumn North Atlantic Oscillation, NAO and winter El Niño on winter aerosol concentrations over eastern China. Atmos. Chem. Phys. 2019, 19, 10787–10800. [Google Scholar] [CrossRef] [Green Version]
- Martens, B.; Miralles, D.; Lievens, H.; Schalie, R.; Verhoest, N. GLEAM v3: Satellite-based land evaporation and root-zone soil moisture. Geosci. Model Dev. 2017, 10, 1903–1925. [Google Scholar] [CrossRef] [Green Version]
- Rodell, M.; Chen, J.; Kato, H.; Famiglietti, J.S.; Nigro, J.; Wilson, C.R. Estimating groundwater storage changes in the Mississippi River basin, USA using GRACE. Hydrogeol. J. 2007, 15, 159–166. [Google Scholar] [CrossRef] [Green Version]
- Vetter, T.; Huang, S.; Aich, V.; Yang, T.; Wang, X.; Krysonova, V.; Hattermann, F. Multi-model climate impact assessment and intercomparison for three large-scale river basins on three continents. Earth Syst. Dynam. 2015, 6, 17–43. [Google Scholar] [CrossRef] [Green Version]
- Adler, J.; Parmryd, I. Quantifying colocalization by correlation: The Pearson correlation coefficient is superior to the Mander’s overlap coefficient. Cytom. Part A 2010, 77, 733–742. [Google Scholar] [CrossRef] [PubMed]
- Livezey, R.E.; Chen, W.Y. Statistical field significance and its determination by Monte Carlo techniques. Mon. Weather Rev. 1983, 111, 46–59. [Google Scholar] [CrossRef] [Green Version]
- Ventura, V.; Paciorek, C.J.; Risbey, J.S. Controlling the proportion of falsely rejected hypotheses when conducting multiple tests with climatological data. J. Clim. 2004, 17, 4343–4356. [Google Scholar] [CrossRef] [Green Version]
- Yamazaki, D.; Kanae, S.; Kim, H.; Oki, T. A physically based description of floodplain inundation dynamics in a global river routing model. Water Resour. Res. 2011, 47, W04501. [Google Scholar] [CrossRef]
- Zhao, F.; Veldkamp, T.; Frieler, K.; Schewe, J.; Leng, G. The critical role of the routing scheme in simulating peak river discharge in global hydrological models. Environ. Res. Lett. 2017, 12, 075003. [Google Scholar] [CrossRef]
- Cleveland, R.B.; Cleveland, W.S.; McRae, J.E.; Terpenning, I. STL: A seasonal-trend decomposition. J. Off. Stat. 1990, 6, 3–73. [Google Scholar]
- Zhou, F.; Xu, Y.; Chen, Y.; Xu, C.; Gao, Y.; Du, J. Hydrological response to urbanization at different spatiotemporal scales simulated by coupling of CLUE-S and the SWAT model in the Yangtze River delta region. J. Hydrol. 2013, 485, 113–125. [Google Scholar] [CrossRef]
- Jin, E.K.; Kinter, J.L.; Wang, B. Current status of ENSO prediction skill in coupled ocean–atmosphere models. Clim. Dyn. 2008, 31, 647–664. [Google Scholar] [CrossRef]
- Zou, Y.; Xi, X. On the role of the south Pacific subtropical high at the onset of El Niño events. Atmos. Chem. Phys. Discuss. 2018, 1–22. [Google Scholar] [CrossRef] [Green Version]
- Hu, S.; Fedorov, A.V. Exceptionally strong easterly wind burst stalling El Niño of 2014. Proc. Natl. Acad. Sci. USA 2016, 113, 2005–2010. [Google Scholar] [CrossRef] [Green Version]
- Li, X.; Zhang, K.; Gu, P.; Febg, H.; Yin, Y.; Chen, W.; Cheng, B. Changes in precipitation extremes in the Yangtze River basin during 1960–2019 and the association with global warming, ENSO, and local effects. Sci. Total Environ. 2021, 760, 144244. [Google Scholar] [CrossRef] [PubMed]
- Wang, J.K.; Yu, J.Y.; Johnson, K.R. Pacific and Atlantic controls of the relationship between mainland southeast Asia and east China interannual precipitation variability. Clim. Dyn. 2020, 54, 4279–4292. [Google Scholar] [CrossRef]
- Yin, J.; Guo, S.; Gentine, P.; Sullivan, S.C.; Gu, L.; He, S.; Chen, J.; Liu, P. Does the hook structure constrain future flood intensification under anthropogenic climate warming? Water Resour. Res. 2021, 57, e2020WR028491. [Google Scholar] [CrossRef]
- Wahr, J.; Swenson, S.; Zlotnicki, V.; Velicogna, I. Time-variable gravity from GRACE: First results. Geophys. Res. Lett. 2004, 31, L11501. [Google Scholar] [CrossRef] [Green Version]
- Shi, J.; Cui, L.L.; Ma, Y.; Du, H.Q.; Wen, K.M. Trends in temperature extremes and their association with circulation patterns in China during 1961–2015. Atmos. Res. 2018, 212, 259–272. [Google Scholar] [CrossRef]
- Wahr, J.; Swenson, S.; Velicogna, I. Accuracy of GRACE mass estimates. Geophys. Res. Lett. 2006, 33, L06401. [Google Scholar] [CrossRef] [Green Version]
Figure 1.
The sub-basin and river network of Yangtze River in China. Note: The black dashed line divides the Yangtze River basin into the upper, middle, and lower reaches.
Figure 1.
The sub-basin and river network of Yangtze River in China. Note: The black dashed line divides the Yangtze River basin into the upper, middle, and lower reaches.
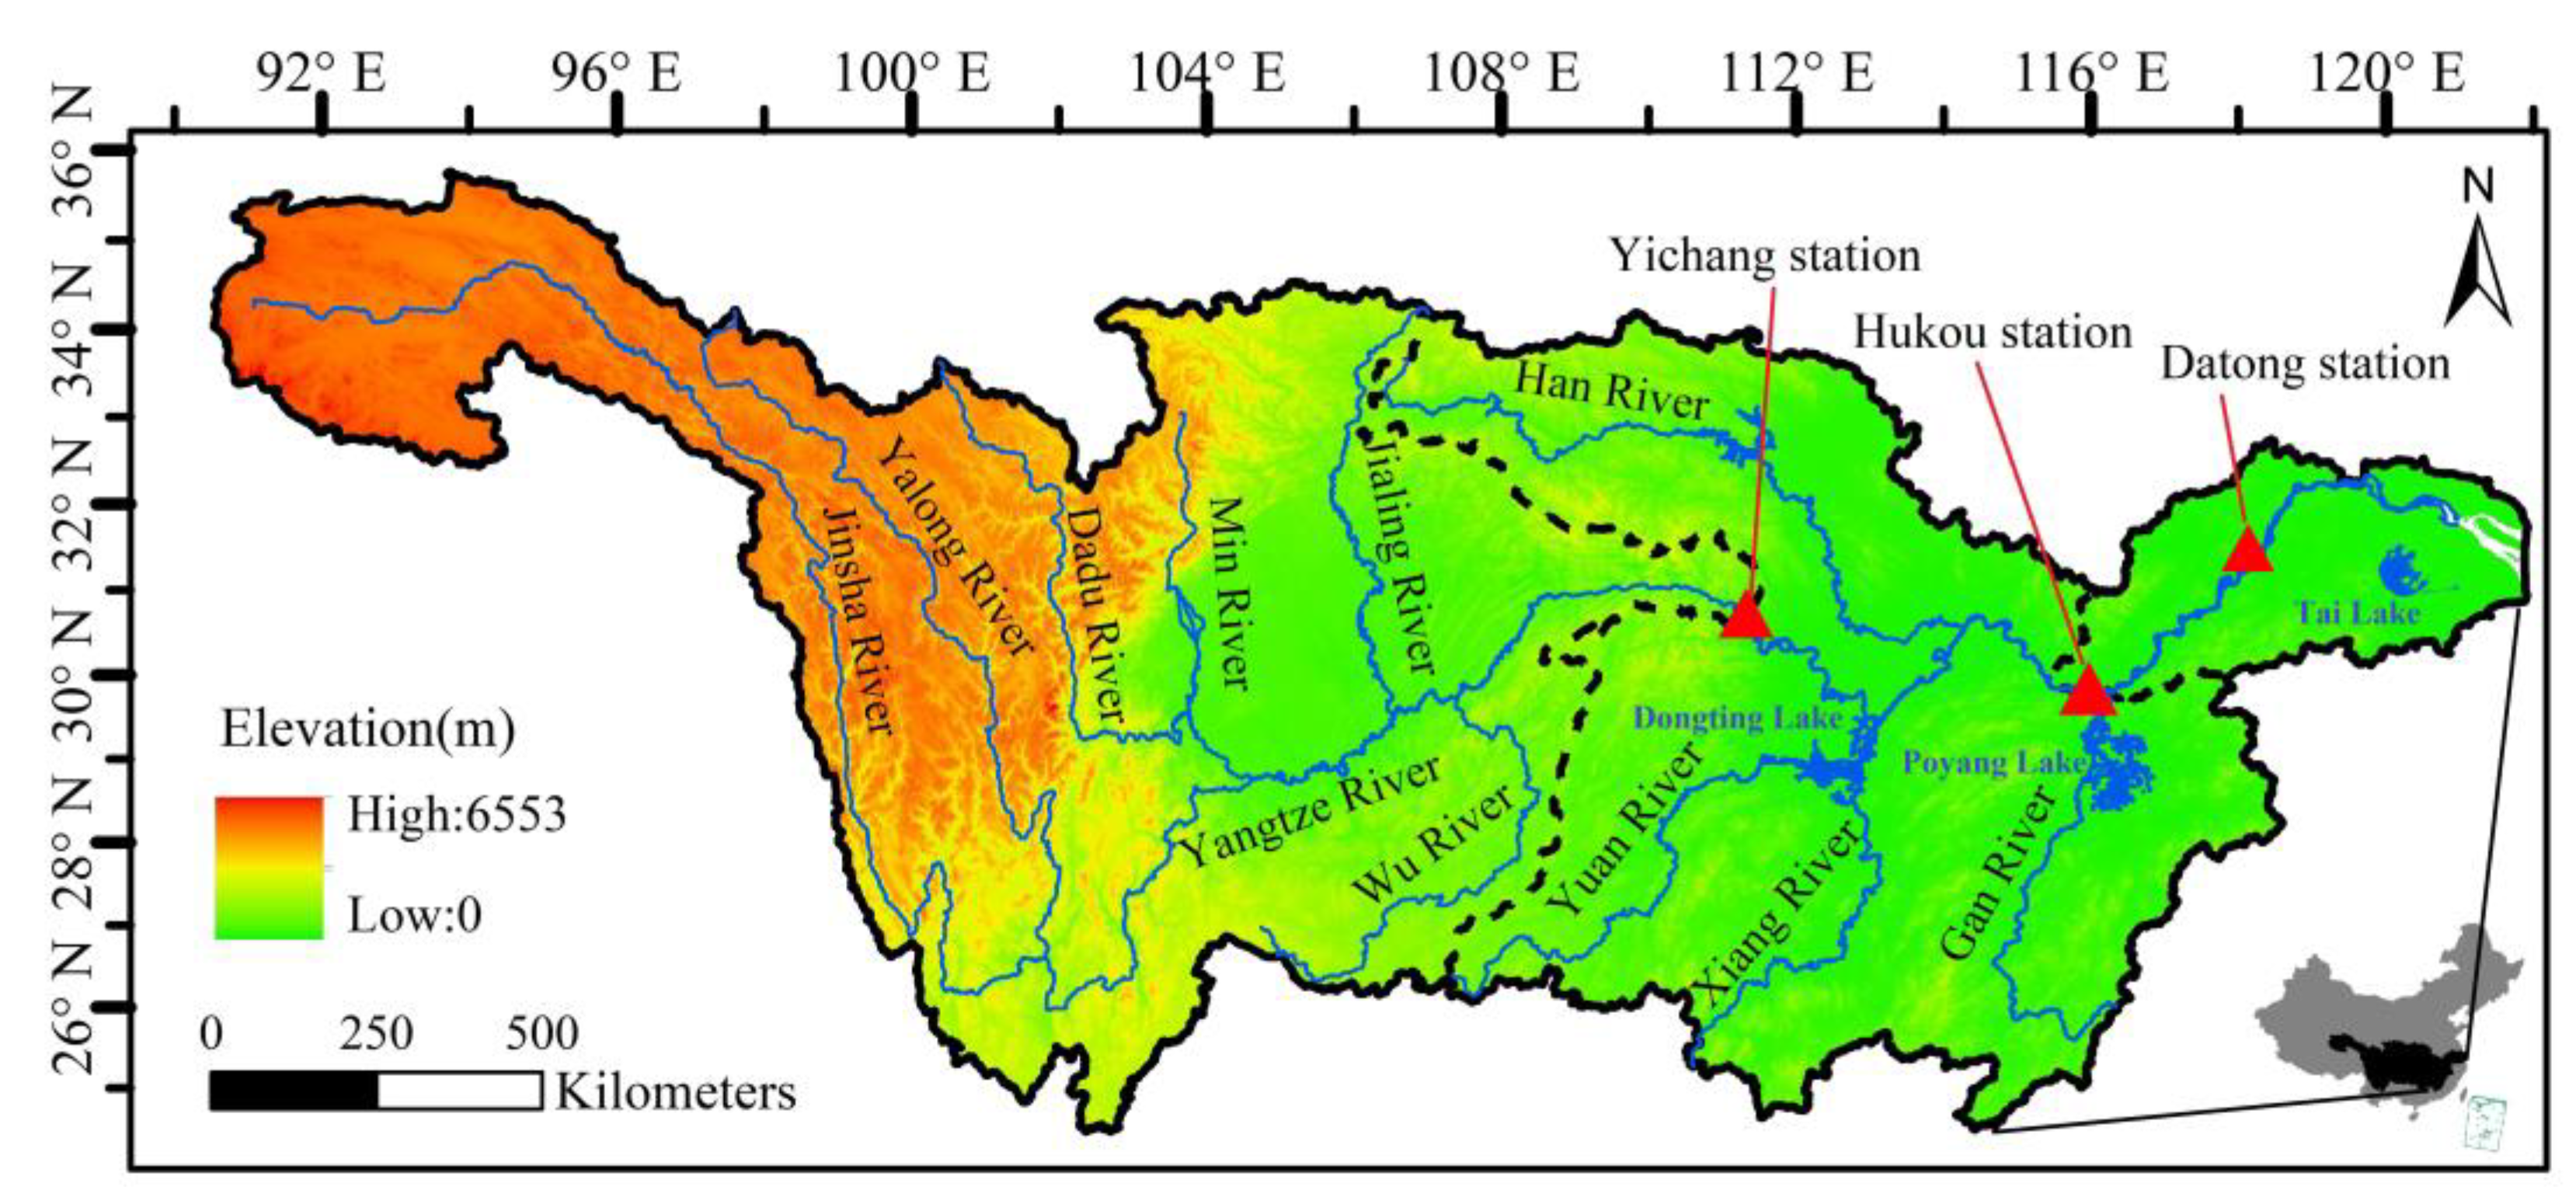
Figure 2.
Time series of precipitation, evapotranspiration, and TWSA in the Yangtze River basin between June 2018 and October 2020, on which the shading area with different color represents the change range of different variables.
Figure 2.
Time series of precipitation, evapotranspiration, and TWSA in the Yangtze River basin between June 2018 and October 2020, on which the shading area with different color represents the change range of different variables.
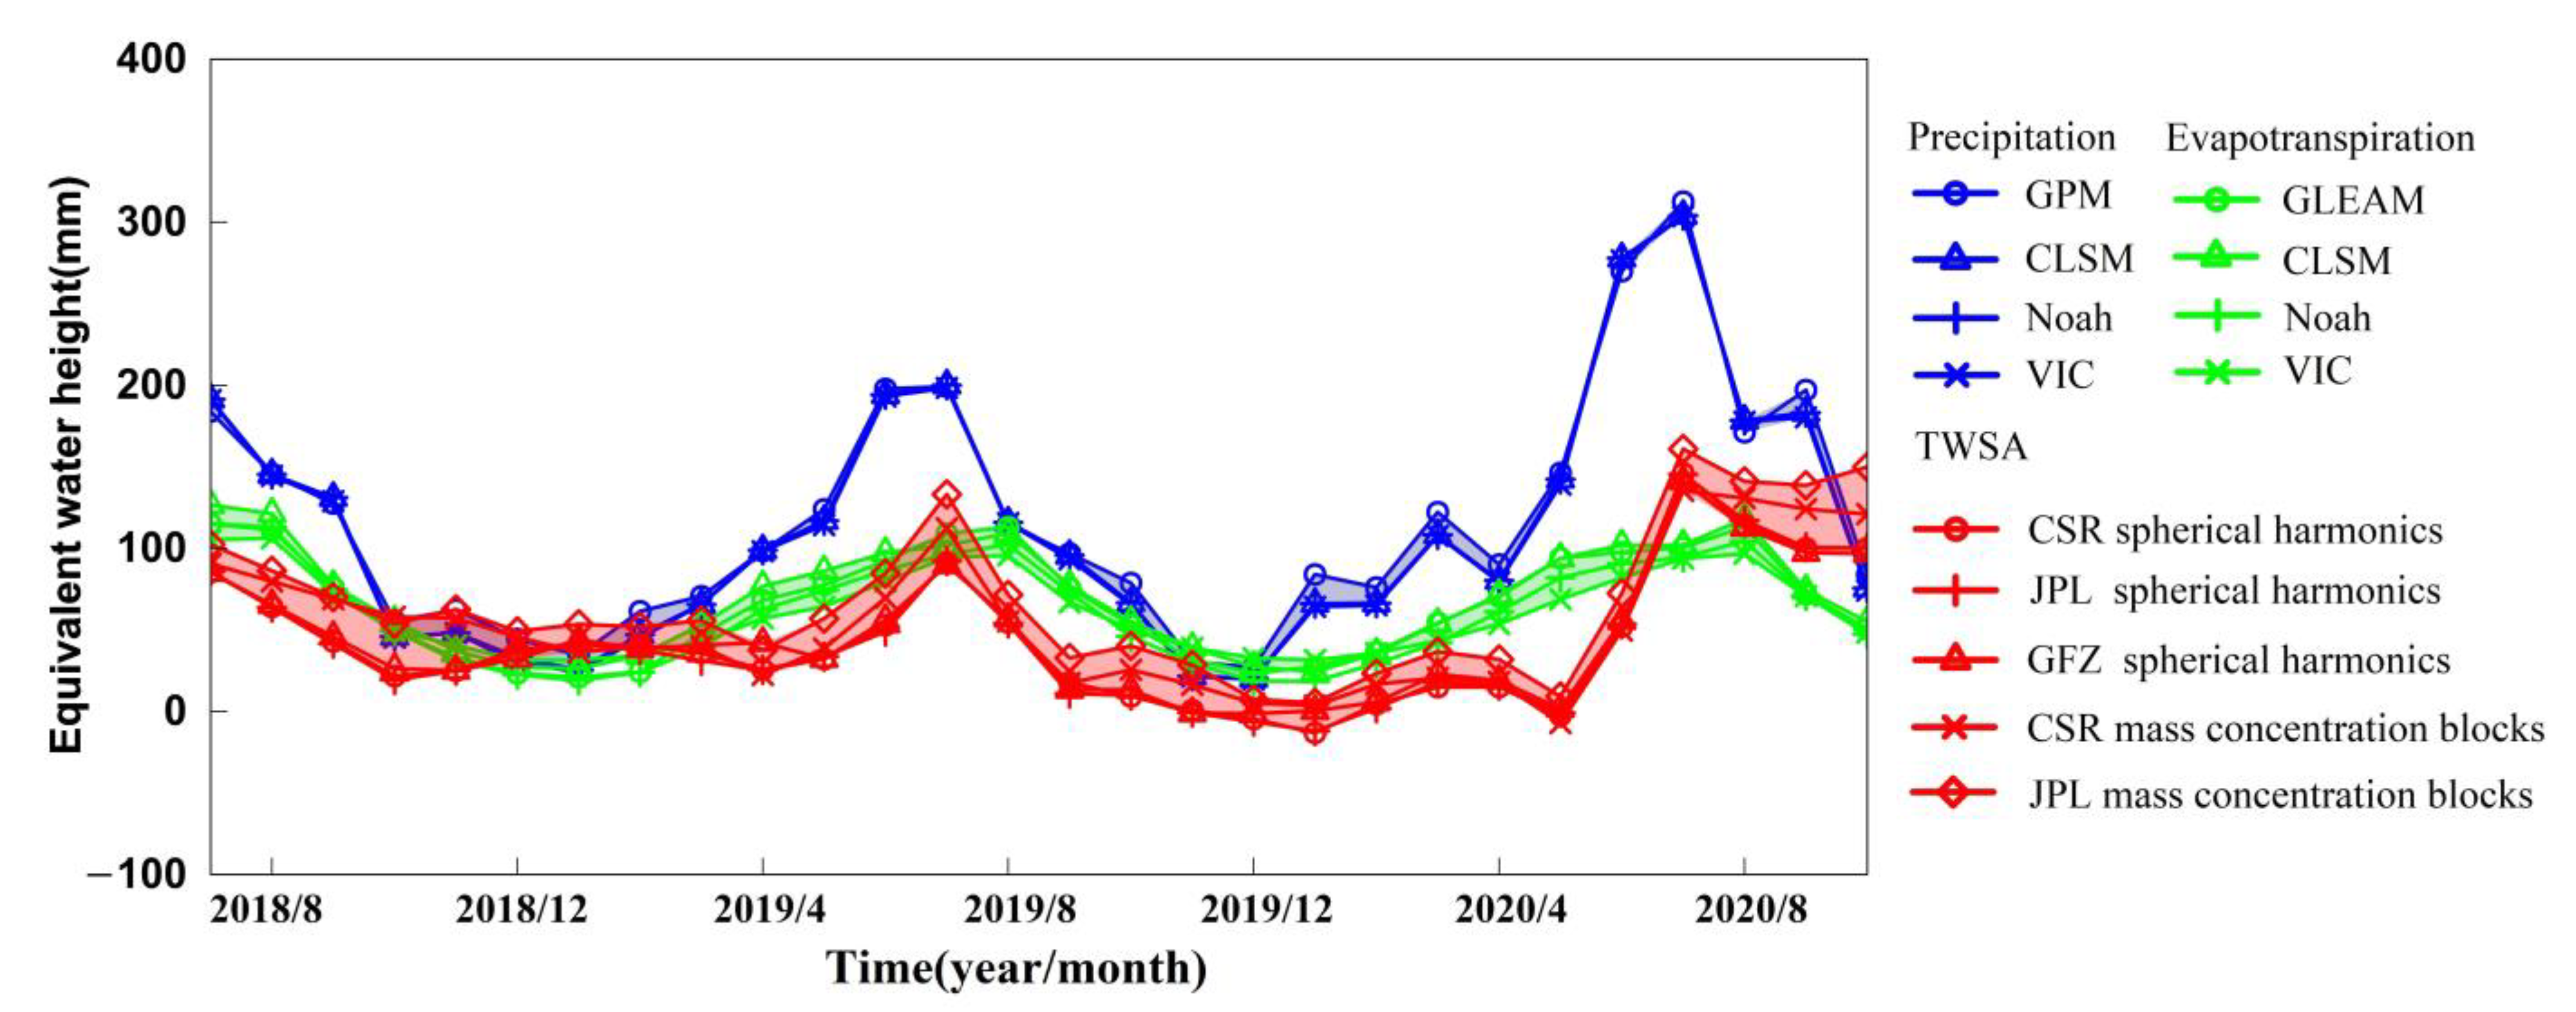
Figure 3.
Spatial distribution of the average standard deviation of runoff from (a) GRAFO and (b) GLDAS, (c) TWSA, (d) precipitation, and (e) evapotranspiration in the Yangtze River basin between July 2018 and October 2020.
Figure 3.
Spatial distribution of the average standard deviation of runoff from (a) GRAFO and (b) GLDAS, (c) TWSA, (d) precipitation, and (e) evapotranspiration in the Yangtze River basin between July 2018 and October 2020.

Figure 4.
Contribution of four uncertainty sources, i.e., precipitation, TWSA, evapotranspiration, and their interaction at monthly and yearly scale, respectively.
Figure 4.
Contribution of four uncertainty sources, i.e., precipitation, TWSA, evapotranspiration, and their interaction at monthly and yearly scale, respectively.
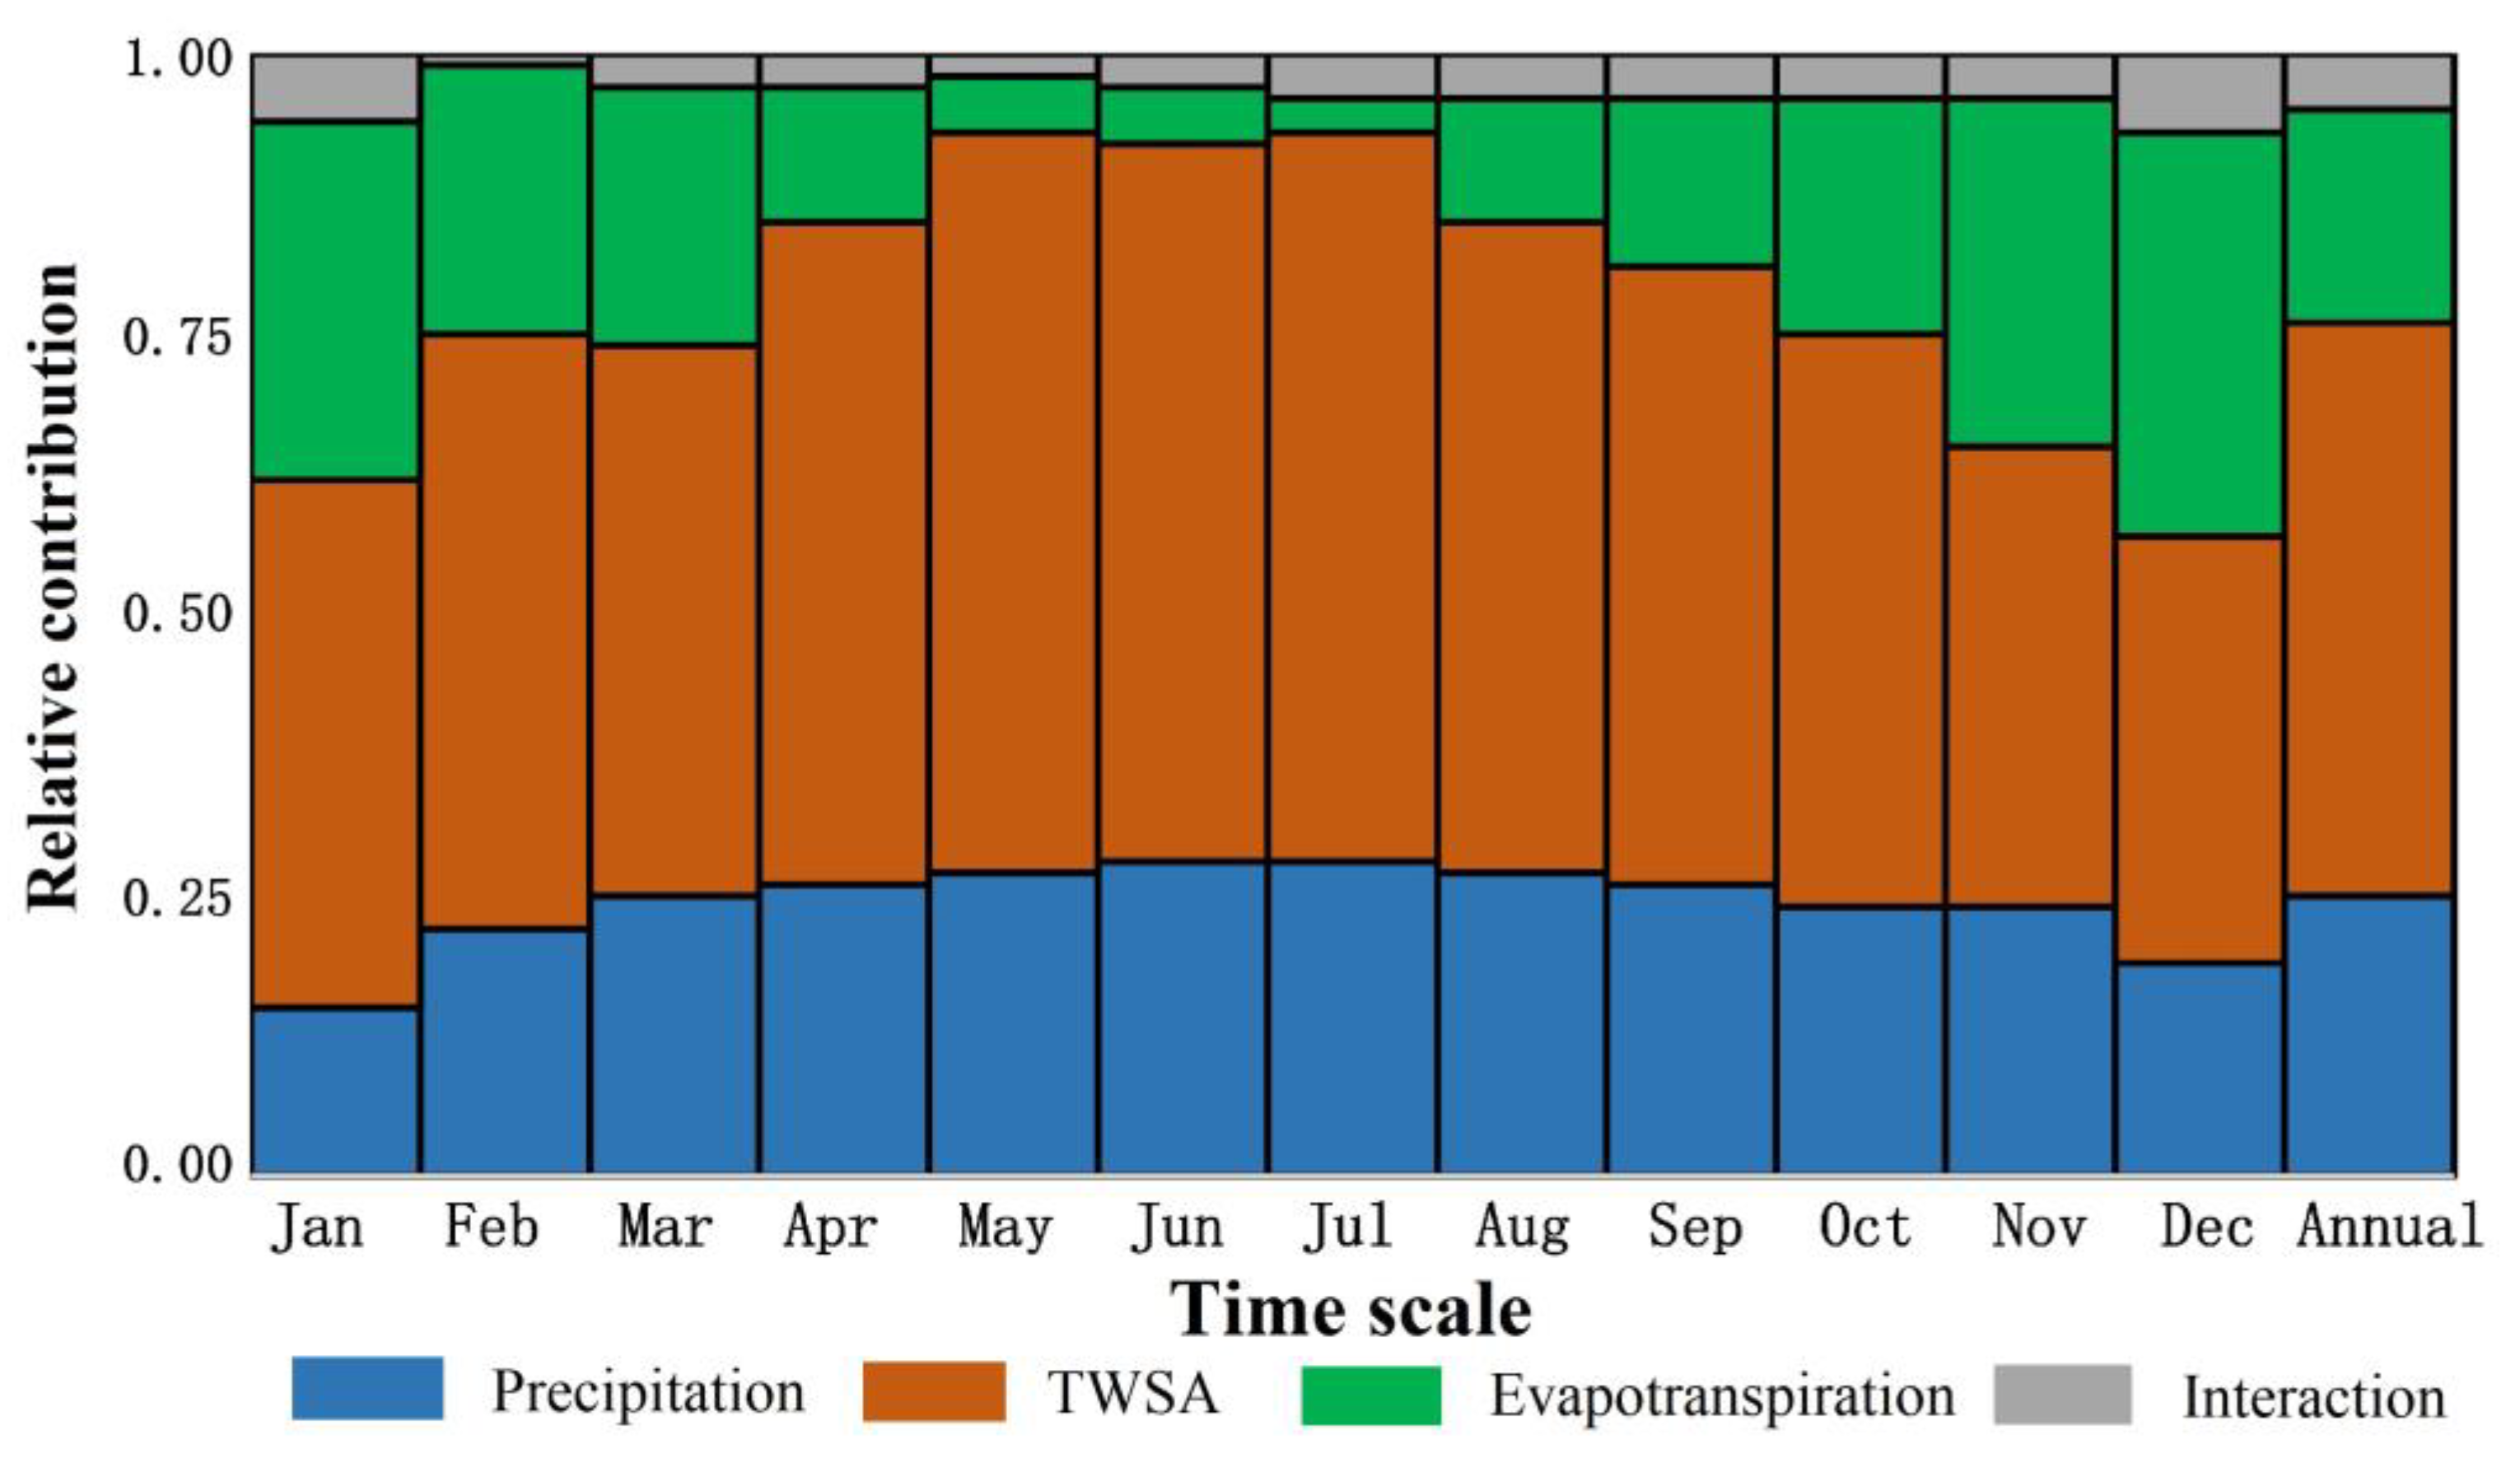
Figure 5.
Spatial distribution of contribution of uncertainty in (a) precipitation, (b) TWSA, and (c) the dominating factor at yearly scale.
Figure 5.
Spatial distribution of contribution of uncertainty in (a) precipitation, (b) TWSA, and (c) the dominating factor at yearly scale.

Figure 6.
Mean correlation coefficient between multiple GRAFO-derived (i.e., 80 data sets) and GLDAS-modeled (i.e., 3 hydrological models) runoff data in the Yangtze River basin between July 2018 and October 2020, on which a grid cell is plotted only if the respective test is locally significant at the (a) 1%, (b) 5%, and (c) 10% significance lever.

Figure 7.
Ensemble means of GRAFO-derived, GLDAS-modeled, and observed discharge at the (a) Yichang, (b) Hukou, and (c) Datong gauge station between July 2018 and October 2020, on which the shading area is the change range of runoff data.
Figure 7.
Ensemble means of GRAFO-derived, GLDAS-modeled, and observed discharge at the (a) Yichang, (b) Hukou, and (c) Datong gauge station between July 2018 and October 2020, on which the shading area is the change range of runoff data.
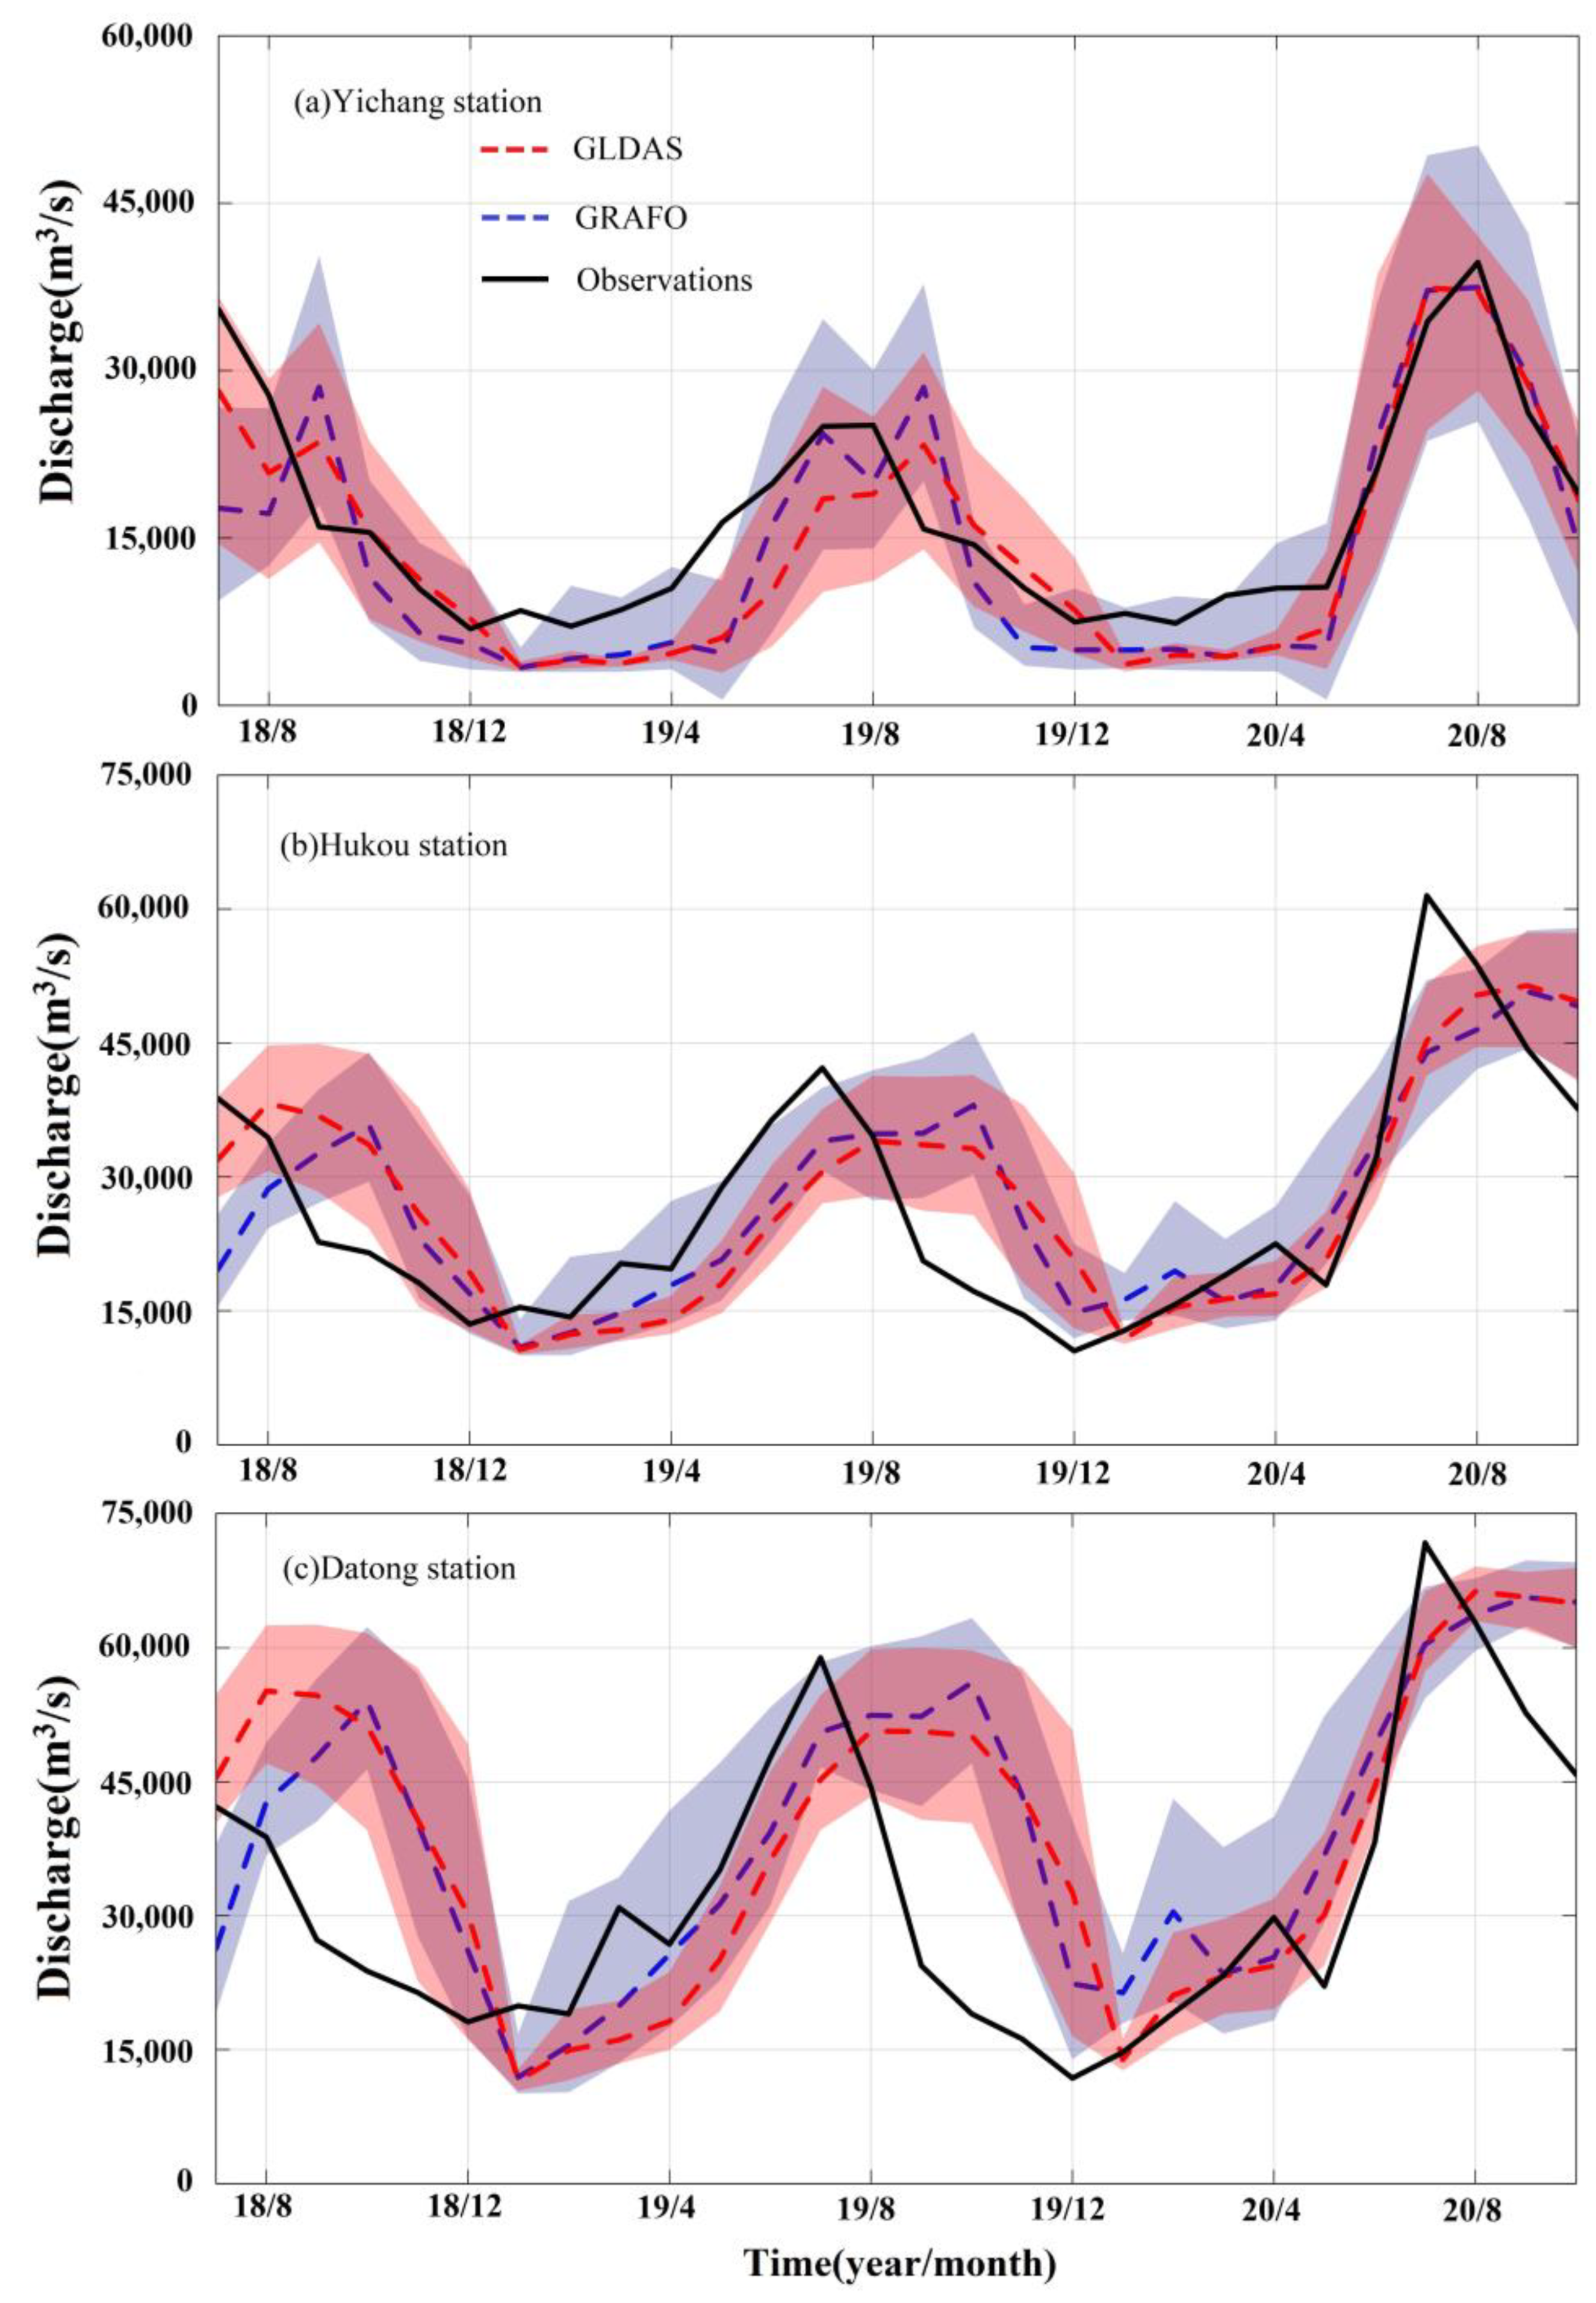
Figure 8.
Monthly spatial distribution of ensemble means of GRAFO-derived runoff (left panel) and their standard deviation (right panel) in the Yangtze River basin from June 2020 to October 2020.
Figure 8.
Monthly spatial distribution of ensemble means of GRAFO-derived runoff (left panel) and their standard deviation (right panel) in the Yangtze River basin from June 2020 to October 2020.

Figure 9.
Monthly spatial distribution of ensemble means of discharge (left panel) and their standard deviation (right panel) in the Yangtze River basin from June 2020 to October 2020.
Figure 9.
Monthly spatial distribution of ensemble means of discharge (left panel) and their standard deviation (right panel) in the Yangtze River basin from June 2020 to October 2020.
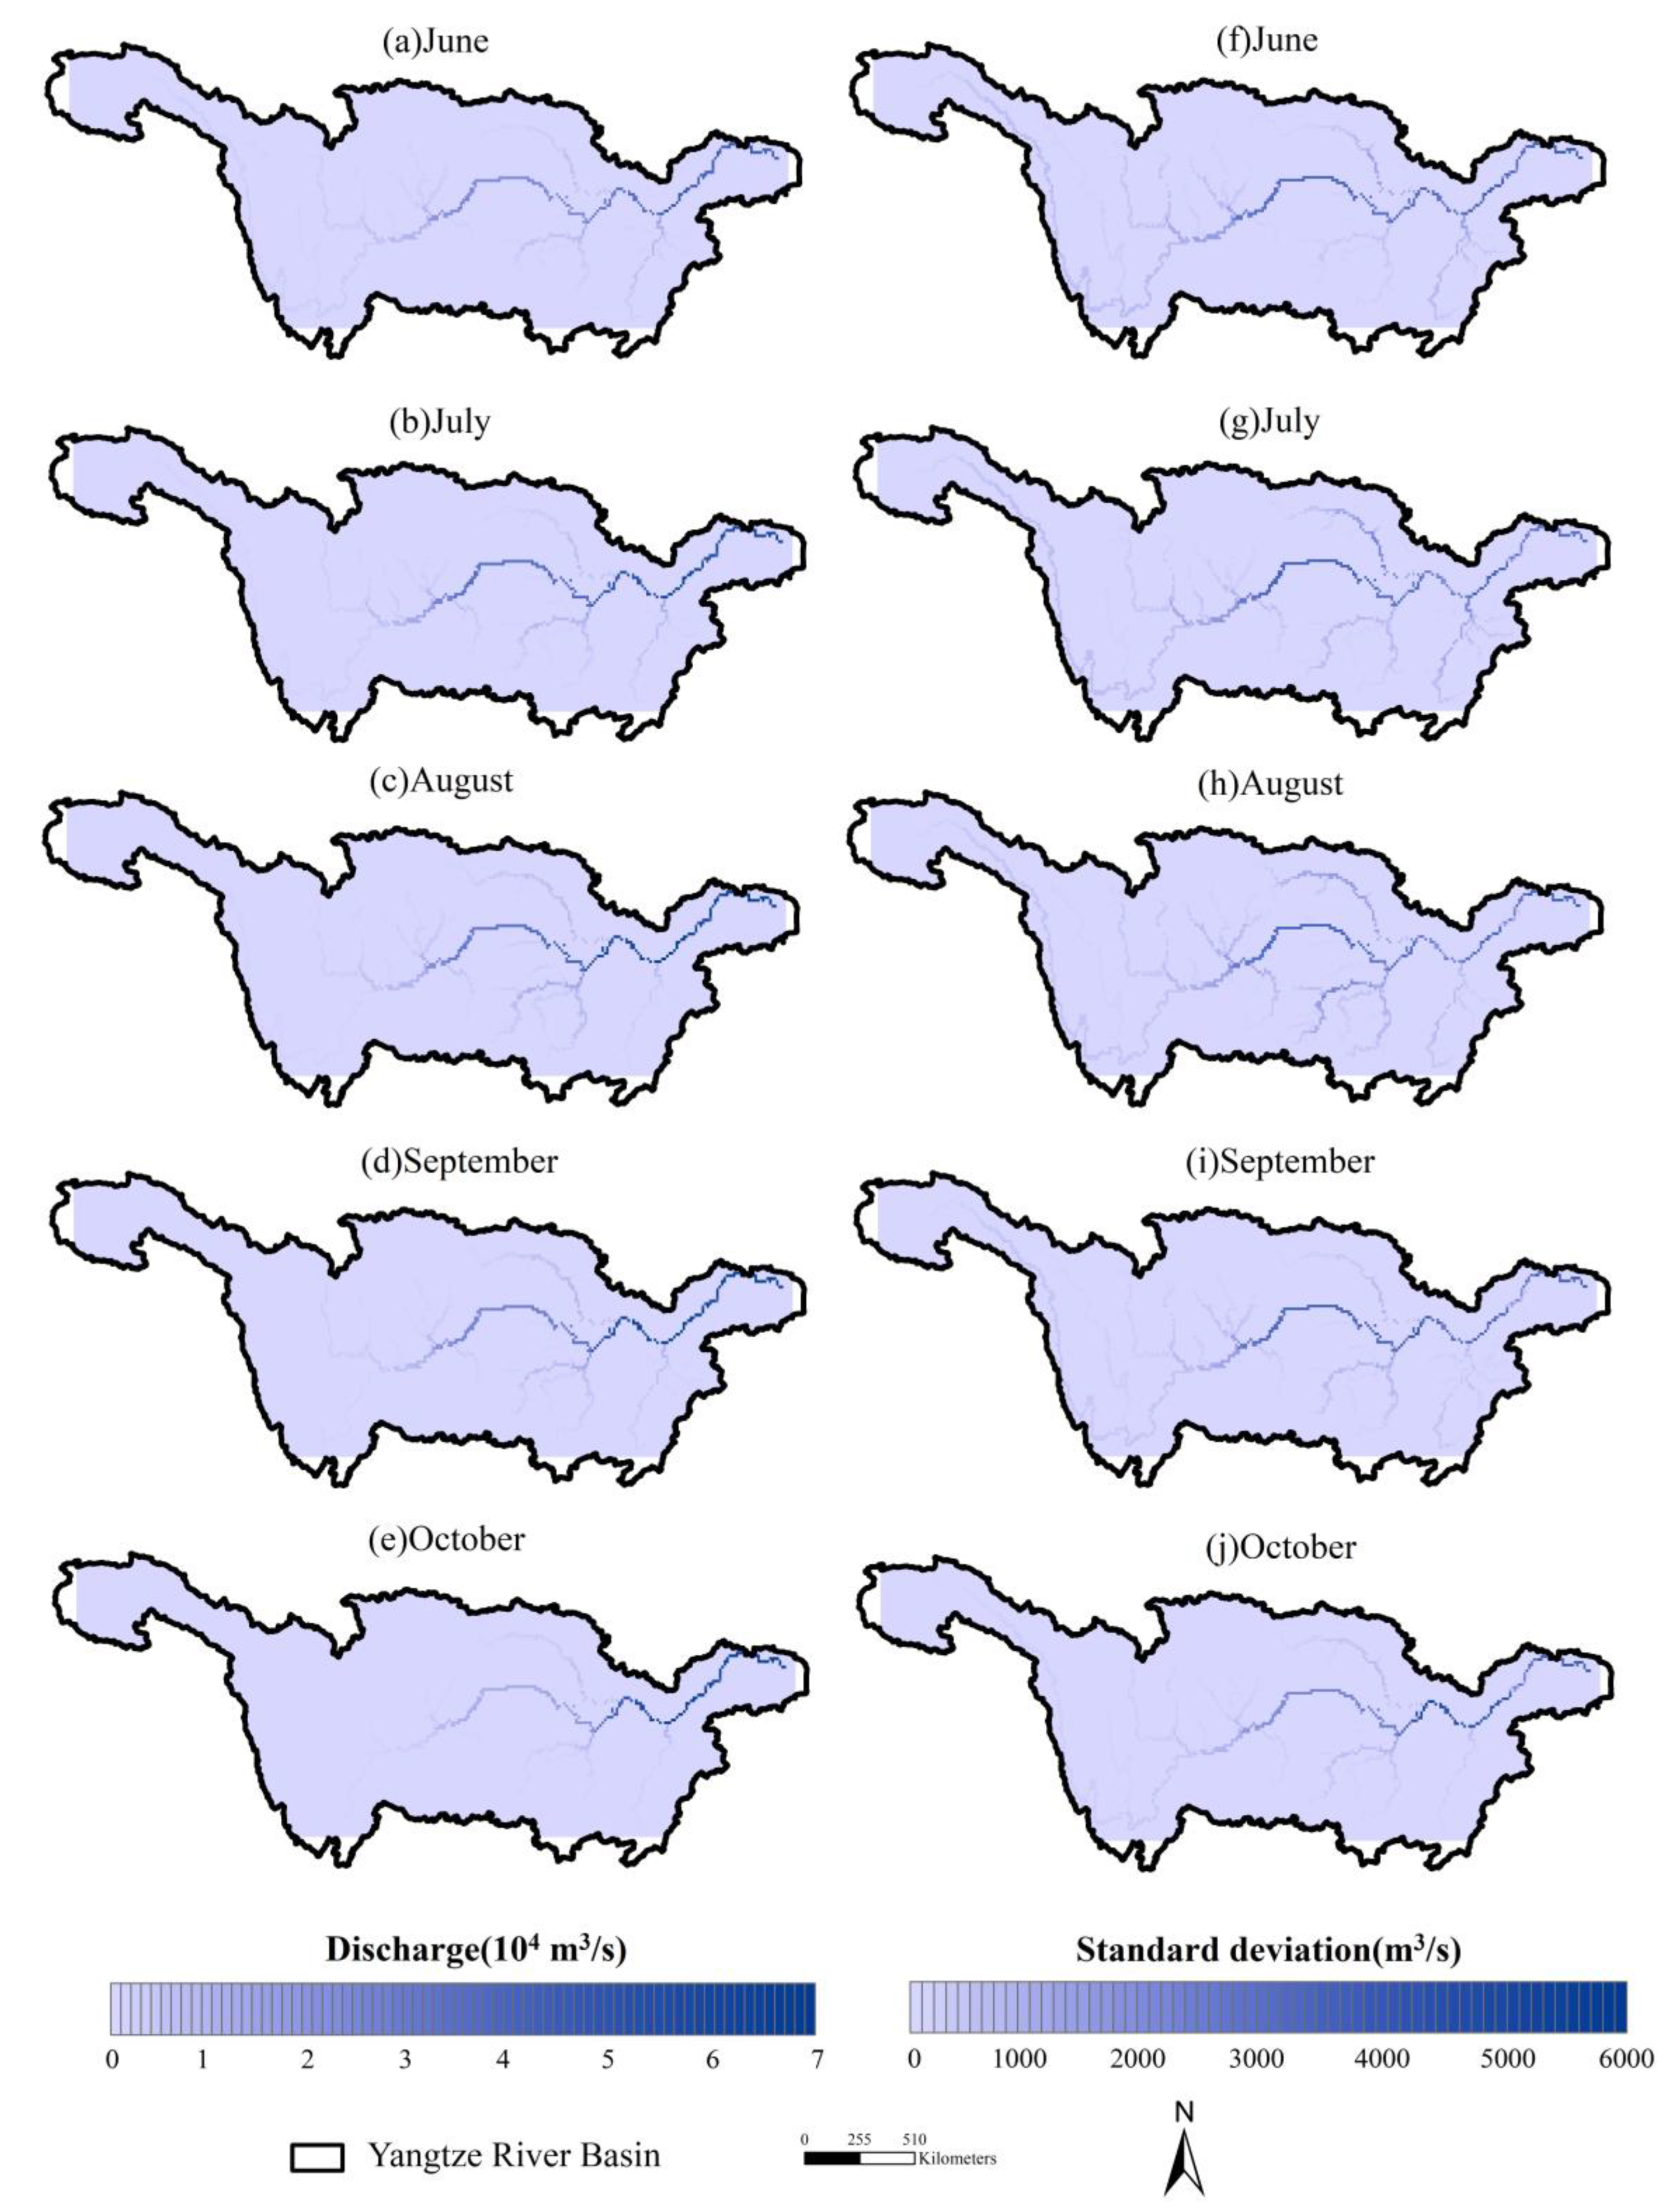
Figure 10.
Monthly spatial distribution of ensemble means of FPI (left panel) and their standard deviation (right panel) in the Yangtze River basin from June 2020 to October 2020.
Figure 10.
Monthly spatial distribution of ensemble means of FPI (left panel) and their standard deviation (right panel) in the Yangtze River basin from June 2020 to October 2020.
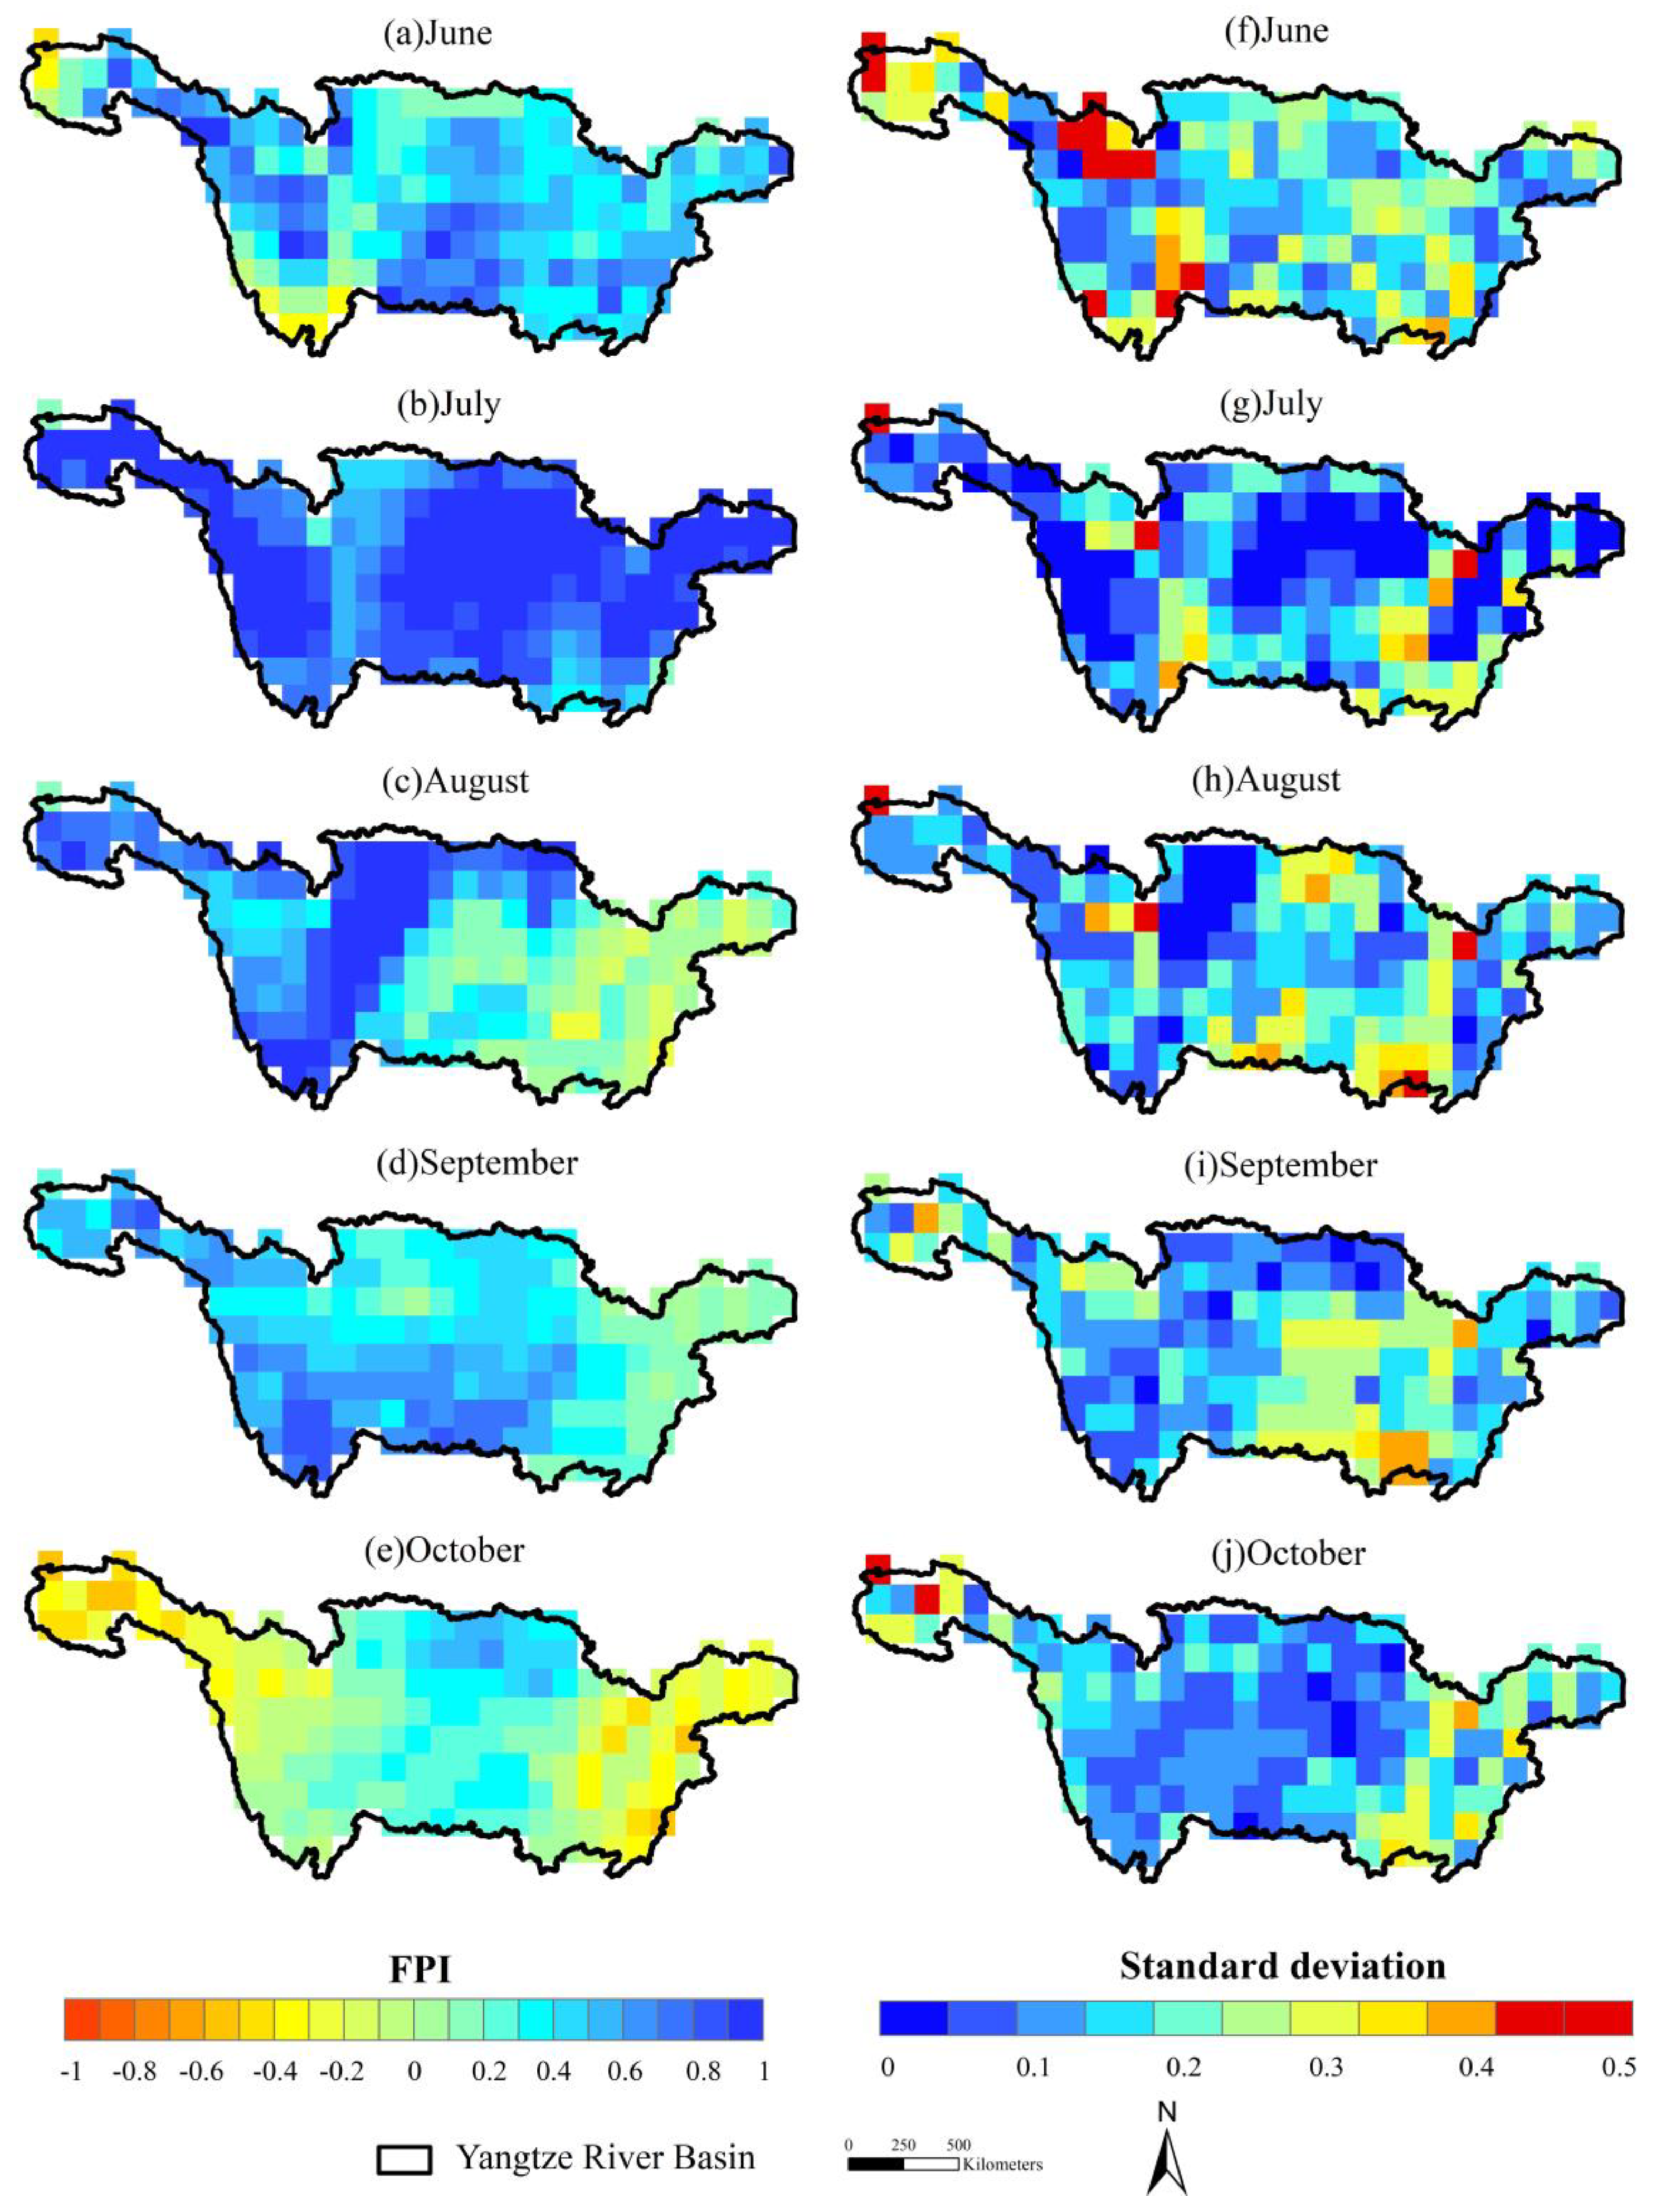
Figure 11.
Non-seasonal GRAFO-derived discharge and precipitation, together with NINO3.4, NAO, and FPI indices in the Yangtze River basin between July 2018 and October 2020, on which the gray-blue shading means the period of 2020 basin-wide flood in the Yangtze River basin. The blue, black, and red shading donates the average standard deviation of precipitation, runoff, and FPI, respectively. The NINO3.4 series is taken as the 3-month moving average of the original NINO3.4 index.
Publisher’s Note: MDPI stays neutral with regard to jurisdictional claims in published maps and institutional affiliations. |
© 2021 by the authors. Licensee MDPI, Basel, Switzerland. This article is an open access article distributed under the terms and conditions of the Creative Commons Attribution (CC BY) license (https://creativecommons.org/licenses/by/4.0/).
Share and Cite
MDPI and ACS Style
Xiong, J.; Guo, S.; Yin, J.; Gu, L.; Xiong, F. Using the Global Hydrodynamic Model and GRACE Follow-On Data to Access the 2020 Catastrophic Flood in Yangtze River Basin. Remote Sens. 2021, 13, 3023. https://doi.org/10.3390/rs13153023
AMA Style
Xiong J, Guo S, Yin J, Gu L, Xiong F. Using the Global Hydrodynamic Model and GRACE Follow-On Data to Access the 2020 Catastrophic Flood in Yangtze River Basin. Remote Sensing. 2021; 13(15):3023. https://doi.org/10.3390/rs13153023
Chicago/Turabian StyleXiong, Jinghua, Shenglian Guo, Jiabo Yin, Lei Gu, and Feng Xiong. 2021. "Using the Global Hydrodynamic Model and GRACE Follow-On Data to Access the 2020 Catastrophic Flood in Yangtze River Basin" Remote Sensing 13, no. 15: 3023. https://doi.org/10.3390/rs13153023
Note that from the first issue of 2016, this journal uses article numbers instead of page numbers. See further details here.