
The Integration of Two Interferometric Radars for Measuring Dynamic Displacement of Bridges


1
Road and Bridge Research Institute, ul. Instytutowa 1, 03-302 Warszawa, Poland
2
Institute of Fundamental Technological Research, Polish Academy of Sciences, Adolfa Pawińskiego 5B, 02-106 Warszawa, Poland
3
IDS GeoRadar (Part of Hexagon), Via Augusto Righi, 6, 6A, 8, 56121 Ospedaletto, Pisa, Italy
*
Author to whom correspondence should be addressed.
Remote Sens. 2021, 13(18), 3668; https://doi.org/10.3390/rs13183668
Submission received: 9 August 2021
/
Revised: 8 September 2021
/
Accepted: 10 September 2021
/
Published: 14 September 2021
(This article belongs to the Special Issue Bridge Monitoring Using Remote Sensors)
Abstract
:Measurements of displacements of bridges under dynamic load are particularly difficult in the case of structures where access to the area under the tested structure is impossible. Then, remote measurement methods are preferred, such as interferometric radar. Interferometric radar has high accuracy when measuring displacement in the direction of its target axis. The problems appear when a bridge vibrates in two directions: horizontal (lateral or longitudinal) and vertical. The use of one radar to measure those vibrations may be impossible. This paper presents the application of a set of two interferometric radars to measure vertical vibration and horizontal longitudinal vibration with high accuracy. The method was positively verified by experimental tests on two railway bridges characterized by different levels of horizontal displacement. The accuracy of the radar measurements was tested by the direct measurement of vertical displacements using inductive gauges. In conclusion, in the case of vertical displacement measurements using one interferometric radar, the influence of horizontal displacements should be excluded. In the case of locating radars at the area of bridge supports, it is necessary to either use a set of two radars or first investigate the magnitude of possible horizontal displacements in relation to vertical displacements.
1. Introduction
Theoretical and experimental analysis of the displacements of bridge structures under static and dynamic load is important in SHM (structural health monitoring) or bridge load testing. With the developments of SHM systems, the deflection caused by the live load of bridges can be studied based on high-quality monitoring data from advanced deflection sensing systems [1]. The bridge displacement response is primarily sensitive to the stiffness of the bridge, whereas the acceleration response is affected by many other parameters, so bridge dynamic displacement is more suited than acceleration for updating railway bridge stiffness [2]. Accurate measurements of deflections are also important in the validation of road bridge models [3].
Displacement measurements under dynamic load are much more difficult to perform than measurements under static load. These measurements are particularly important when the structures are subjected to significant dynamic loads, such as railway bridges [4,5,6], or are susceptible to dynamic impact due to applied structural solutions, such as slender footbridges [7,8,9]. Measurements of displacements under dynamic load are particularly difficult in the case of structures where access to the area under the tested structure is hindered or impossible (bridges over busy roads, railway lines or rivers). In such cases, remote measurement methods are preferred, e.g., vision-based methods [10,11,12,13,14] or methods using inertial sensors (inclinometers and accelerometers), which do not require reference points [15,16,17,18].
Interferometric radar seems to also be a very good tool for remote measurements of displacements [19,20,21,22,23,24,25,26,27]. Interferometric radar has high accuracy when measuring displacement in the direction of its target axis. Displacements in the direction of interest (lateral or vertical) are determined on the basis of geometric relationships. The closer the vibration direction is to the direction of the target axis of the radar, the higher the accuracy of the radar measurements. The problems appear when a bridge vibrates in two directions: horizontal and vertical. The use of one radar to measure those components of vibration may be impossible. This paper presents the application of a set of two interferometric radars to measure vertical vibration and horizontal longitudinal vibration with high accuracy.
2. Method
2.1. Purpose of the Thesis
In the case of vertical displacement measurements using interferometric radar, the most accurate results are obtained when it is possible to position the radar directly under the tested point of the bridge. Then, the range direction will be vertical and measured displacements will be determined directly. In the case of when we do not have access to the area under the tested point of the structure, we have to set the range direction at an angle to the measured vertical displacements (Figure 1).
The actual vertical displacement dz will be calculated as dz_calc based on the geometry of the system and assuming zero horizontal displacement dy, according to the formula [23]:
The horizontal displacement shown in Figure 1 has been scaled for clarity of the figure. In most cases, longitudinal (in the horizontal direction) displacements are much smaller than vertical displacement values. In some cases, the lateral (in the horizontal direction) displacement of the bridge can take on significant values relative to vertical displacement. This may occur, for example, on railway bridges [28,29] or on slender footbridges [30,31]. Errors resulting from the failure to consider horizontal displacement when determining vertical displacement using interferometric radar are pointed out in [32]. Errors can be significant when the detected scatter point is far from the so-called “neutral axis” of the bridge. It has been experimentally shown in [33] that the determination of only one component of displacement can lead to significant errors.
Based on the diagram shown in Figure 1, the Interpretation Error EI of determining the vertical displacement associated with the failure to consider the second component of displacement was calculated:
Figure 2 shows the relationship between error EI on the ratio R/H (radar distance from the tested point in the target axis/distance from the tested point in the vertical direction) at the different levels of the ratio L/V (longitudinal or lateral/vertical displacement). The error EI was determined in the range from R/H = 1, i.e., for optimal radar positioning under the tested point of the structure, to R/H = 5, i.e., at the maximum recommended ratio still allowing us to obtain displacement determination errors below 1.0 mm [34].
As can be seen from the diagram (Figure 2), the error values caused by the omission of the occurring horizontal displacements in the determination of vertical displacements are significant values. For example, for horizontal displacements equal to 0.01 of vertical displacements and with the radar setting at a vertical distance equal to 1/5 of the radar distance, the error EI will be equal to ca. 5%, and for horizontal displacements greater than 0.20 of vertical displacements, the error EI will exceed 10% at almost all settings of the radar (excluding vertical targeting). Such significant error values can make it practically impossible to compare the measured values with the calculated ones and to properly evaluate the tested structure. It should be emphasized that the total error of vertical displacement measurement with the use of interferometric radar should also include components related to the accuracy of displacement measurement in the target axis and the accuracy of determining the geometry of the system. In the case of horizontal displacements and their omission in the calculation of vertical displacements, in most cases the EI error component will be dominant.
For these reasons, the main objective of the presented project is to increase the accuracy of vertical displacement calculations using interferometric radar by the simultaneous measurement of vertical and horizontal displacements.
In order to achieve the aforementioned objective, the following activities were carried out:
- Analysis of existing solutions for measuring displacements in two or three directions using interferometric radars.
- Development of a method of measuring displacements in two directions using the existing set of two interferometric radars.
- Conducting comparative research using the set of two radars and the reference method. Research is planned on bridge structures with different levels of horizontal displacement in relation to vertical displacement.
- Analysis of comparative research results.
2.2. Proposed Methodology
Several papers can be found in the literature on different solutions for measuring displacements in two or three directions using interferometric radar. A multi-monostatic radar for retrieving the displacement in two directions is presented in [32]. A multiple input, multiple output (MIMO) interferometric radar equipped with a transponder and that consisted of a pair of antennae, with amplifiers, was connected to the radar with a radiofrequency cable. This solution allowed for the simultaneous detection of two directions of displacement components. The radar was successfully tested both in a controlled environment and in the field on a real, 127 m long bridge. In [35], a similar technique is presented to monitor the three-dimensional displacement vector of a bridge with the use of a monostatic/bistatic radar. Two single transponders consisted of an antenna and an amplifier, and they were connected to the (MIMO) interferometric radar with a radiofrequency cable. The method was tested on a real bridge, and for the first time the 3D displacement vector was successfully detected by a radar system.
In [36], a technique to estimate 2D or 3D vibrations by using two or three synchronized radars and at least two fixed calibrators is presented. An example of retrieving 2D millimetric displacements with very low errors was shown in a controlled laboratory experiment with application to pipe vibration monitoring. In [37], the advanced processing steps were applied exemplarily on measurements with two sensors at a prestressed concrete, 26 m long bridge. The external influences were successfully removed, and two components of the three-dimensional displacement vector were determined. A measurement uncertainty of less than 0.1 mm was achieved for the discussed application.
In [38], the applications of one or a set of two interferometric radars for measuring the lateral vibration of railway bridges are presented. Continuation of that work related to the simultaneous use of two interference radars is presented by the authors in this paper. It is an attempt to solve the task of the two-way measurement of bridge elements.
The application of a set of two independent interferometric radars is the main novelty and difference of the system presented here relative to a multiple input and multiple output interferometric radar, described in [32] or [35]. This makes it possible to locate two radars at a greater distance between each other than a radar and transponder connected with a radiofrequency cable (25 m length). The second novelty resulting from the first one is the possibility of locating two radars at the opposite sides of the tested point—for example, at both river sides.
The main difference relative to the method presented in [36] is no need for hardware radar synchronization and no need for two or three closely spaced radars, which may be difficult in the case of most bridges. In [37], the different scenarios of two radar placements are presented, but the test performed at the bridge concerned the possibility of separating transversal and vertical displacement. The longitudinal component was assumed to be insignificant compared to the other two components.
At the system presented here, the measurement on two appropriately selected target directions will enable precise measurement of the components of vertical and horizontal displacements. It was assumed that the radars must be located in one plane (determined by both directions of vibrations—vertical and horizontal) but they can be situated on one side of the tested element (e.g., on one bank at different heights—Figure 3a) or on both sides of the tested element (e.g., on both banks of the river—Figure 3b).
The first radar, if possible, should have a target axis oriented towards the measurement of vertical displacements and the second radar should have a target axis oriented towards the horizontal (lateral or longitudinal) direction (Figure 3a).
The displacements in the direction of the target axes dr1 and dr2 are described by a system of two equations:
- In the case of the location on one side of the tested element:
- In the case of the location of radars on both sides of the tested element:Vertical displacements dz and horizontal displacements dy are determined based on the solution of this system of two equations:
- In the case of the location of radars on one side of the tested element:
- In the case of the location of radars on both sides of the tested element:
The diagram for determining vertical and horizontal displacements on the basis of displacement measurements dr1 and dr2 from two independently measuring and recording interferometric radars and distances R1, H1 and R2, H2 includes the following stages:
- Selecting the structure element to be observed using additional reflective elements or structure elements directly.
- R1 and R2 readout from both radars correlated with manual measurement of the radar—tested point distance using a laser rangefinder.
- Measurement of H1 and H2 using a laser rangefinder.
- Simultaneous measurement as a function of time of displacements dr1(t) by radar No. 1 and dr2(t) by radar No. 2.
- After the completion of the measurement, low pass filtration of dr1(t) and dr2(t).
- Alignment of the sampling frequency of displacements dr1(t) and dr2(t).
- Time synchronization of both displacements dr1(t) and dr2(t).
- Determination of dz(ti) and dy(ti) values for each pair of dr1(ti) and dr2(ti) readouts using Equations (5) or (6).
2.3. Bridges Selected for Verification Tests
Verification tests were conducted on two railway bridges characterized by different levels of horizontal displacement. Because of the necessity of verifying radar measurements by direct measurement of vertical displacements, spans located on the floodplain were selected for testing. The inductive gauges were located at that area under the bridge with the use of the tripods. The wires were attached at one end to a tested point of the span (girder) and the other end to a spring fixed to the ground at the sensor location point. The sensors were attached to the wires. The first selected bridge has a truss structure and is characterized by significant values of vertical and horizontal displacement along the bridge axis, especially under freight train traffic. The bridge is also crossed by passenger trains at speeds up to 50 km/h. The second bridge has an arch structure and is characterized by much smaller vertical displacements and minimal horizontal displacements along the bridge axis. Passenger trains at speeds of up to 200 km/h pass over the bridge.
2.3.1. Test Bridge No. 1
The bridge consists of two single-track structures, each with 7 simple-supported spans of 66.00 m length (Figure 4). They are truss structures with railway at the upper truss chord on the bridge sleepers.
Using the numerical model of the truss span structure, theoretical vertical and horizontal displacements along the bridge were determined during the recorded passage of the set of two coupled locomotives. Figure 5 shows the distribution of extreme vertical displacements along the span (on the horizontal chord of the lower girder) and the corresponding distribution of horizontal displacements and L/R ratio. Due to the minimal vertical displacements near the supports, the L/V diagram does not include the beginning and end of the span.
Figure 6 shows the spatial deformation diagram for deformations of the ¾ length of the span from fixed bearing and ¼ length of the span length from the movable bearing side. As can be seen, the horizontal displacement of the crossbeam is due to the rotation of the section and the displacement of the structure on the movable bearing.
2.3.2. Test Bridge No. 2
The bridge consists of two independent structures, for each of the two tracks. The tested span is 51 m (Figure 7). They are arch structures with railway at the ballasted deck.
Analogically to the previous bridge, using the numerical model of the span structure, theoretical vertical and horizontal displacements along the bridge were determined during the recorded passage of a multiple-unit passenger train (Figure 8).
3. Results
3.1. Tests on Bridge No. 1
The tests were conducted in two spans on the floodplain on both banks of the river. The cross-sections selected for measurement were those in the area of 16.5 m from the movable bearing (cross-section No. 1—Figure 9) and 22.0 m from the fixed one (cross-section No. 2). Crossbars at the bottom chord level were used as reflecting elements.
The parameters of radar locations were:
Cross-section No. 1:
2P0: R1 = 9.0 m, H1 = 6.6 m, R1/H1 = 1.36; R2 = 14.3 m, H2 = 4.6 m, R2/H2 = 3.11
Cross-section No. 2:
1P1: R1 = 14.3 m, H1 = 11.4 m, R1/H1 = 1.25; R2 = 20.3 m, H2 = 5.5 m, R2/H2 = 3.69
2P0: R1 = 12.0 m, H1 = 7.3 m, R1/H1 = 1.64; R2 = 20.3 m, H2 = 5.5 m, R2/H2 = 3.69
Marks: 2P0—radar No. 1 and radar No. 2 at the same side of the tested point;
1P1—radar No. 1 and radar No. 2 at the opposite side of the tested point.
The 30 Hz low pass filter was applied after registration.
During the comparative research, 12 train passages were recorded; the most characteristic one was the passage of a cargo train, which caused the largest vertical displacements and longitudinal displacements (Figure 10).
For the extreme value of vertical displacement in Figure 10, if single radar measurements were carried out, the absolute and relative deviations of extreme vertical displacement from the reference measurement would be equal to 6.25 mm (27%) in the case of radar No. 1 and 19.67 mm (84%) in the case of radar No. 2. The error values determined this way using single radars are consistent with values of the interpretation error EI from Figure 2—at the ratio L/V ≈ 0.3 and R/H = 1.4 EI ≈ 28% and at R/H = 3.1 equals EI ≈ 88%. Applying the determination of vertical displacements on the basis of measurements from both radars reduced the deviations to 0.46 mm (2%). The estimated uncertainty value of the reference measurement was about 0.30 mm, which confirms that the measurements using the set of two radars are consistent with the reference measurement. The extreme values of vertical displacements and the corresponding horizontal displacements during the passage of a cargo train are close to those calculated theoretically at a distance of 16.5 m from the support due to the passage of two locomotives (Figure 5). The extreme vertical displacements determined from the measurements account for 95% of the calculated displacements and the longitudinal displacements for 88% of the calculated ones.
3.2. Tests on Bridge No. 2
Tests were conducted in a span on the floodplain. The cross-section selected for measurement was the one in the vicinity of ¼ of the span near the movable bearing (Figure 11). Crossbars at the deck level were used as reflecting elements.
The parameters of radar location were (two locations of radar No. 2):
1P1: R1 = 12.2 m, H1 = 5.7 m, R1/H1 = 2.15; R2 = 9.9 m, H2 = 6.4 m, R2/H2 = 1.56;
1P1: R1 = 12.2 m, H1 = 5.7 m, R1/H1 = 2.15; R2 = 8.4 m, H2 = 6.4 m, R2/H2 = 1.32.
Marks: 1P1—radar No. 1 and radar No. 2 at the opposite side of the tested point.
The 30 Hz low pass filter was applied after registration.
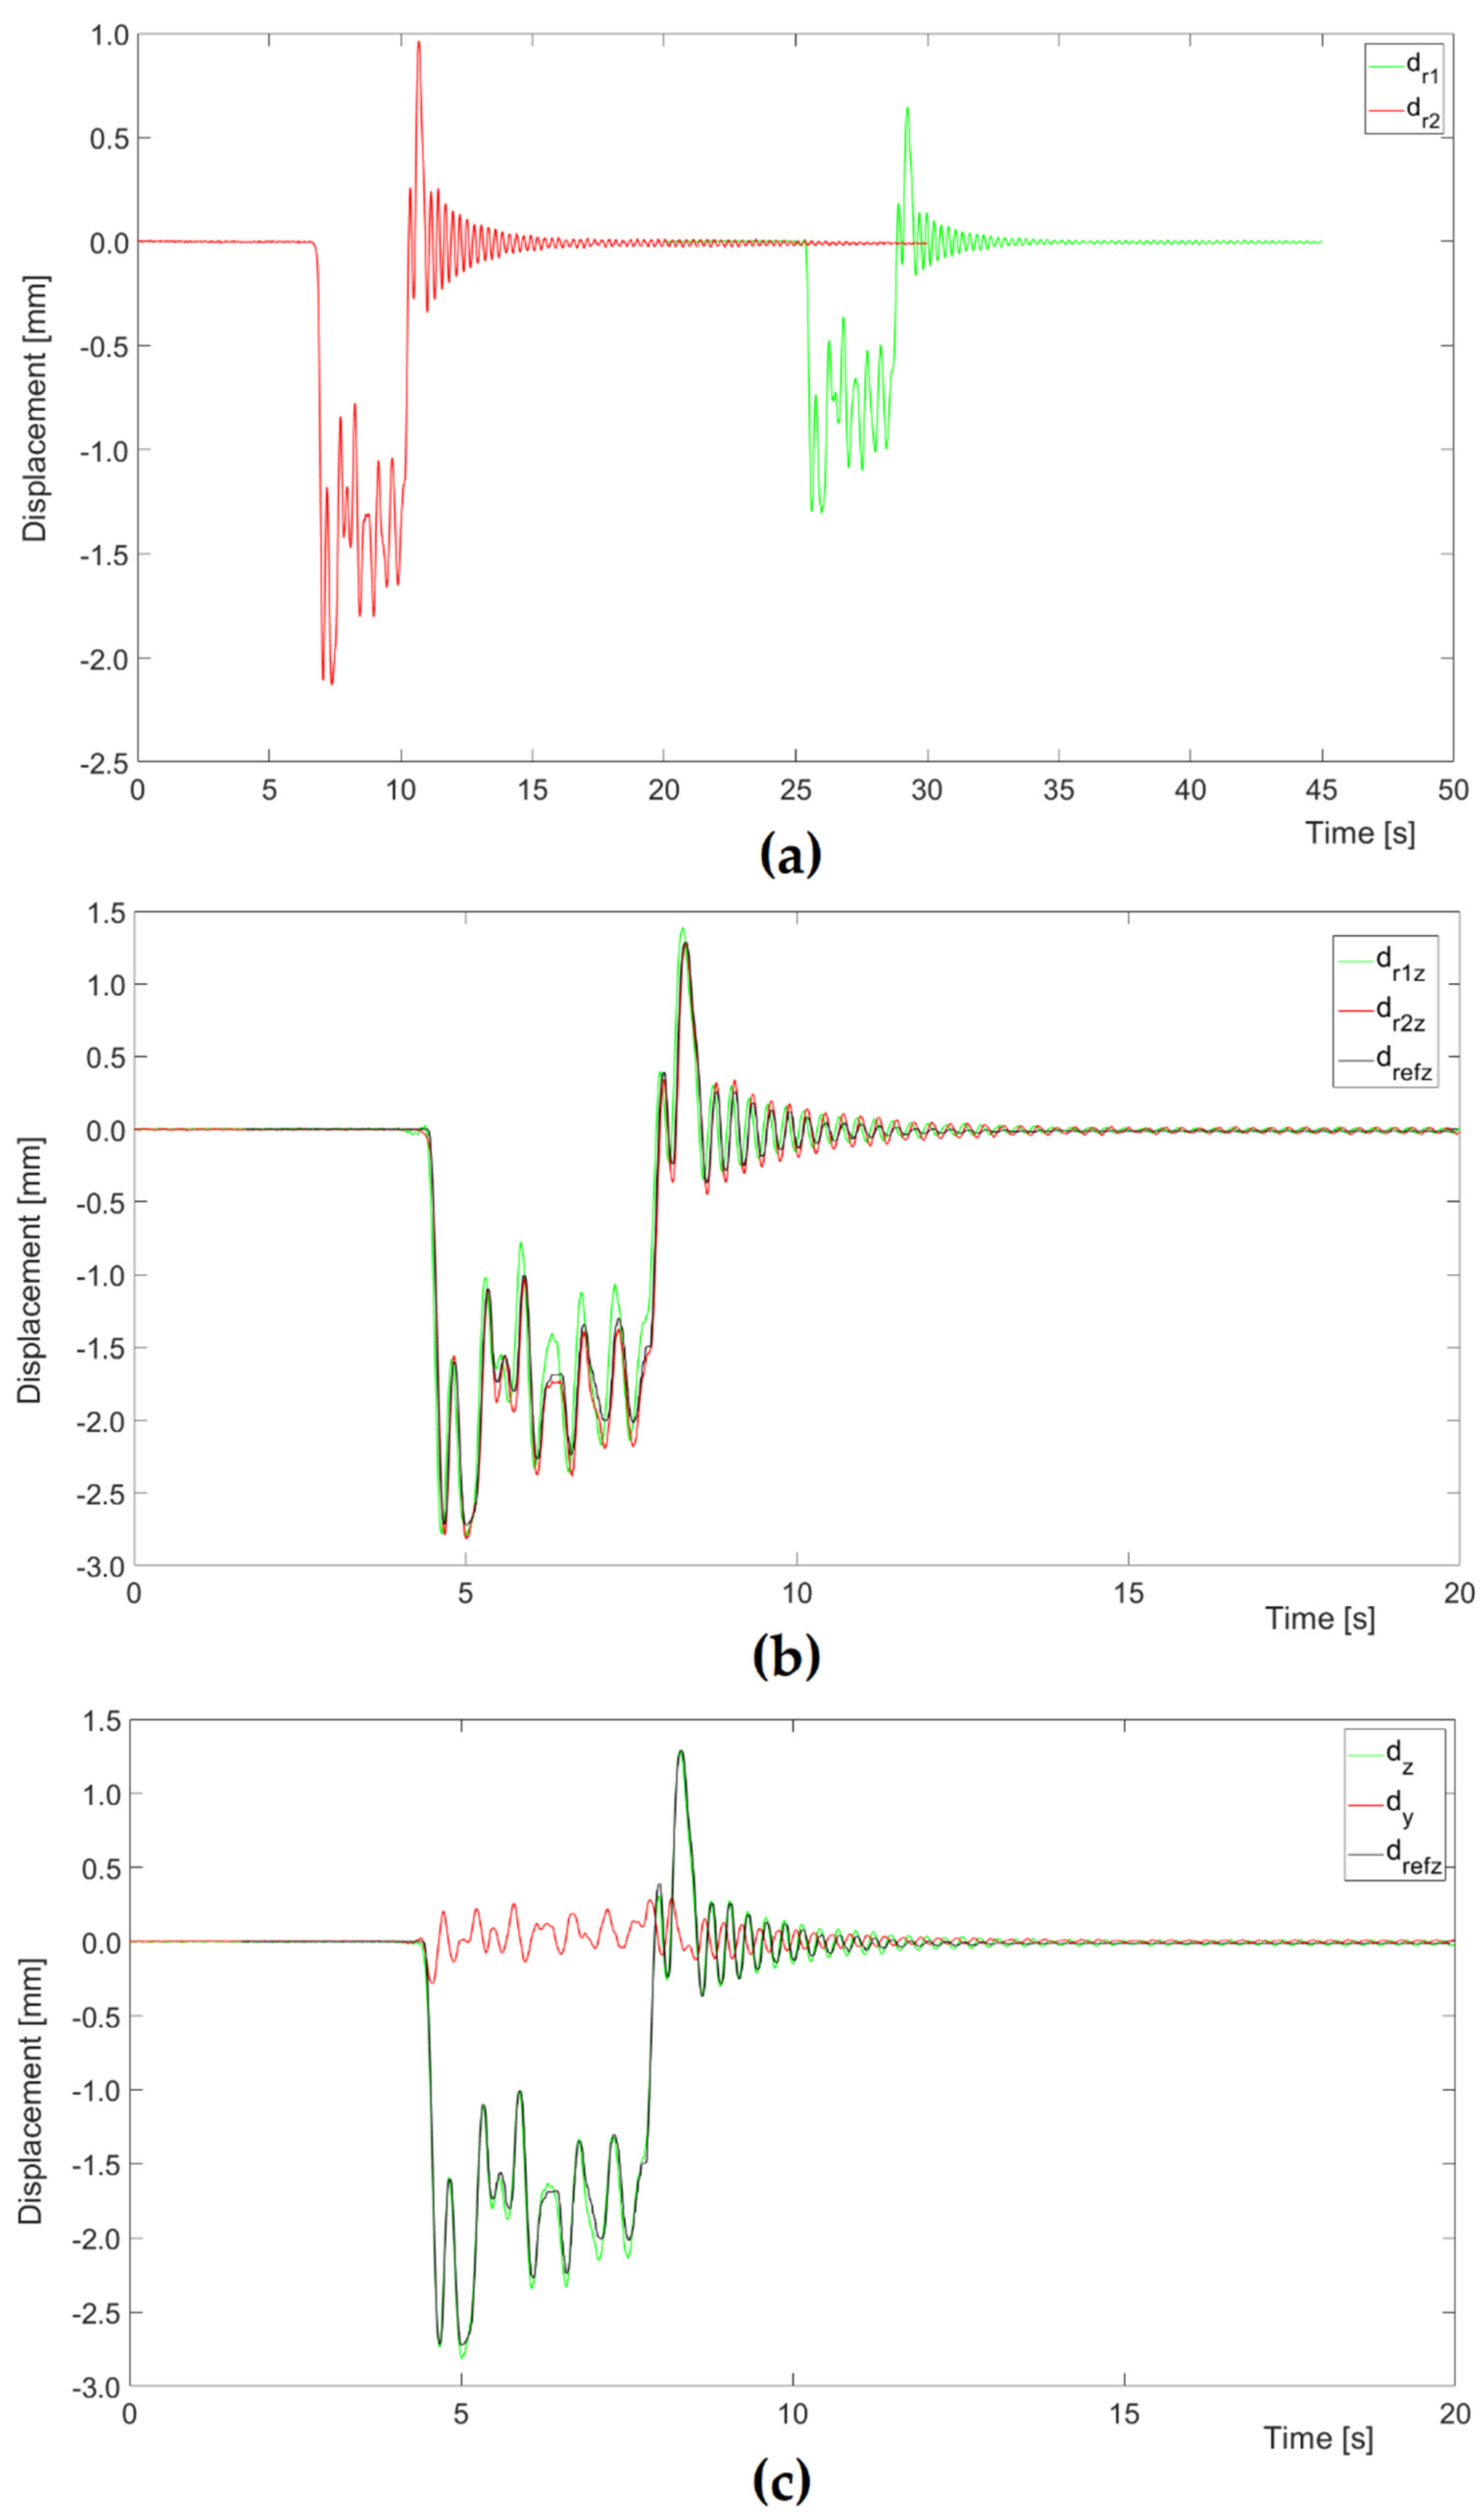
During the comparative research, eight train passages were registered; the most characteristic one was a multiple-unit passenger train (ED250—Pendolino) with a speed above 200 km/h (Figure 12).
For the extreme value of vertical displacement in Figure 12, if single radar measurements were carried out, the absolute and relative deviations of extreme vertical displacement from the reference measurement would be equal to 0.09 mm (3.3%) in the case of radar No. 1 and 0.10 mm (3.7%) in the case of radar No. 2. Applying the determination of vertical displacements on the basis of measurements from both radars reduced the deviations to 0.06 mm (2.4%). The estimated uncertainty value of the reference measurement was about 0.10 mm, which confirms the consistency of both measurements with the use of single radars and measurements with the use of a set of two radars with the reference measurements.
The values of the Interpretation Error with the use of single radars from Figure 2 were: at ratio L/V ≈ 0.1 and R/H = 2.2 EI ≈ 9.7% and at R/H = 1.6 equals EI ≈ 3.3% and at R/H = 1.3 equals EI ≈ 4.4%. These values are close to the deviation from the reference measurements, i.e., the errors resulting from the omission of horizontal displacements are not dominant in this case.
The extreme values of vertical displacements and the corresponding horizontal displacements during the passage of a multiple-unit passenger train are close to those calculated theoretically at a distance of 12.75 m from the support (Figure 8). The extreme vertical displacements determined from the measurements account for 102% of the calculated displacements and both measured and calculated longitudinal displacements are below the value of 0.1 mm.
3.3. Summary of Results
In the case of both bridges, for all train passages recorded during the comparative research, the extreme values of vertical displacements were determined using single radars and using synchronized results from two radars. Absolute and relative deviations from reference measurements were determined. The results were collected for trains inducing similar vertical displacement values and are presented in Table 1 and Table 2.
4. Discussion
In the case of both examined cross-sections of bridge No. 1, the extreme relative deviations from the reference measurements of vertical displacement in the case of a single radar located more preferably for the measurement of vertical displacements were from 6% to 27%, and in the case of a single radar located more preferably for the measurement of longitudinal displacements they were from 20% to 91%. Such errors make it impossible to correctly calibrate the structure model and were unacceptable for the SHM analysis. Only the application of a set of two radars reduced deviations to acceptable values—below 0.5 mm (below 2.1%).
In the case of determining vertical displacements in the middle of the span and the vertical distance of the radar from the tested point of the structure equal to ca. 8 m, the error caused by using one radar on the basis of data from Figure 2 and Figure 5 may be estimated as 20%÷30%, which is an unacceptable value. To sum up, in the case of the structure of bridge No. 1 and practically every tested cross-section as well as conducting measurements from the vicinity of supports, it is not possible to obtain sufficient accuracy of measurements and analyses without the use of a set of two radars. A precise measurement with only one radar would be possible only if the instrument is placed directly below the measurement point.
In the case of bridge No. 2, the deviations of the measurements made by single radars were below 0.20 mm, and after applying the set of two radars they were below 0.15 mm. Taking into account the estimated uncertainty values of the reference measurements at the level of 0.10 ÷ 0.20 mm, it should be considered that the results of all measurements are fully consistent. Due to the low values of measured displacements, the percentage deviations are ancillary in this case.
Summarizing the results of the comparative research, it can be stated that the method with two radars can be applied to bridges with significant vertical displacements, such as bridge No. 1 (maximum displacement from a freight train approx. 25 mm), and bridges with much smaller displacements, such as bridge No. 2 (maximum displacement from the multiple-unit train below 3 mm). The method can be used at bridges with a different level of longitudinal relative to vertical displacements. The determined courses of vertical displacements were consistent with the courses of comparative tests both in the case of bridge No. 1 (maximum value of longitudinal displacements around 30% of vertical) and bridge No. 2 (maximum value of longitudinal displacements below 1% of vertical displacements).
In the case of bridge No. 1, the estimated accuracy (as an uncertainty value) of vertical measurement could be below 0.4 mm, and in the case of bridge No. 2 measurement could be below 0.1 mm. Such low values of the estimated accuracy of determining vertical displacements can be treated as a confirmation of the effectiveness of minimizing the Interpretation Error of determining the vertical displacement caused by the failure to consider the simultaneous longitudinal displacement.
Comparative research has not been conducted in the case of longitudinal measurements. Considering the location of both radars (one radar located more preferably for the measurement of vertical displacements and the other one for longitudinal displacements, or both equally), we can assume approximate accuracy for the measurement of longitudinal and vertical displacements. According to our experience and [34], the radar would be located more preferably for the measurement of vertical displacements when R/H is in the range from 1 (the best position) to 5 (the worst acceptable position), and for the measurement of horizontal displacements when R/H is in the range from ∞ (the best position) to 1.02 (the worst acceptable position).
An important issue is selecting the structure element to be observed by two radars when that element is used directly as a reflector (without additional reflectors). The deformation of this bridge element should be consistent with the global deformation of the structure and not result from local deformation of the bridge elements. In the case of both examined bridges, this was ensured due to the symmetrical load in the transverse section (because of one railway line at the bridge deck).
The fact of observing the same element of the structure by both radars should be confirmed by aiming in the direction of both radars’ line of sight by the manual laser rangefinder. The measured ranges of line of sight from both radars should be equaled with results of measurement with the use of a laser rangefinder.
Radars should be as far apart as possible to avoid mutual interference of the same frequency band. It is natural when radars are located at both sides of the element, and it is also easy to achieve when two radars are located at one side of the tested element measured. Only in some cases it was necessary to apply manual correction and shift of one signal in relation to the other.
For both bridges and for most of the recorded signals, the automatic time synchronization of two radars in offline mode was possible on the basis of the times of the extremum appearance. Only in some cases it was necessary to apply manual correction and shift of one signal in relation to the other.
The developed method seems to be competitive with other methods of measuring displacements in two directions due to the use of two independent radars. Synchronization of the recorded courses of displacements is performed after the measurement is completed. The application of the method should not be limited by the possible distances between the radars. We foresee further works being carried out related to measurements at considerable distances between located radars, for example, on both banks of the river as well as to improve the system of identification of points measured by radars and the measurement of their height with the use of laser rangefinders or scanning total stations.
5. Conclusions
The presented method was positively verified by experimental tests on two railway bridges. In the case of a truss bridge with significant values of vertical and horizontal displacements, only the application of the set of two radars led to the conformity of measurements with the reference measurements. In the case of the arch bridge, both measurements with single radars and with the set of two radars were consistent with the reference measurements.
In conclusion, in the case of vertical displacement measurements using one interferometric radar, the influence of horizontal displacements should be excluded. In the case of locating radars at the area of bridge supports, it is necessary to either use a set of two radars or first investigate the magnitude of possible horizontal displacements in relation to vertical displacements.
Author Contributions
Conceptualization, P.O. and F.B.; methodology, P.O. and F.B; validation, P.O. and A.Ś.; investigation, P.O.; data curation, P.O. and A.Ś.; software, P.O.; writing—original draft preparation, P.O.; writing—review and editing, P.O. and A.Ś. All authors have read and agreed to the published version of the manuscript.
Funding
Part of the project was carried out within the framework of Applied Research Projects, financed by the National Centre for Research and Development, Poland in years 2015–2018 (grant agreement PBS3/B9/36/2015); the authors also acknowledge the support of the National Science Centre, Poland (grant agreement 2018/31/B/ST8/03152).
Institutional Review Board Statement
Not applicable.
Informed Consent Statement
Not applicable.
Data Availability Statement
The data are not publicly available due to no permission of the owner of the bridges.
Acknowledgments
The authors would like to thank the members of the team who completed the presented part of the project, including: Robert Czachowski, Małgorzata Mazanek, Tomasz Wierzbicki, Paweł Nurek, Ewa Twardosz, Natalia Ruszkiewicz from the Road and Bridge Research Institute, Kazimierz Szadkowski and Directors, Main Engineers and Bridge Diagnosticians from the Railway Track Development and Construction Unit of PKP Polskie Koleje Państwowe S.A. in Warsaw and Skarżysko Kamienna.
Conflicts of Interest
The authors declare no conflict of interest.
References
- Deng, Y.; Li, A.; Chen, S.; Feng, D. Serviceability Assessment for Long-Span Suspension Bridge Based on Deflection Measurements. Struct. Control. Health Monit. 2018, 25, e2254. [Google Scholar] [CrossRef]
- Feng, D.; Feng, M.Q. Model Updating of Railway Bridge Using In Situ Dynamic Displacement Measurement under Trainloads. J. Bridge Eng. 2015, 20, 04015019. [Google Scholar] [CrossRef]
- Olaszek, P.; Łagoda, M.; Casas, J.R. Diagnostic Load Testing and Assessment of Existing Bridges: Examples of Application. Struct. Infrastruct. Eng. 2014, 10, 834–842. [Google Scholar] [CrossRef]
- Matsuoka, K.; Collina, A.; Somaschini, C.; Sogabe, M. Influence of Local Deck Vibrations on the Evaluation of the Maximum Acceleration of a Steel-Concrete Composite Bridge for a High-Speed Railway. Eng. Struct. 2019, 200, 109736. [Google Scholar] [CrossRef]
- Bačinskas, D.; Kamaitis, Z.; Kilikevičius, A. A Sensor Instrumentation Method for Dynamic Monitoring of Railway Bridges. J. Vibroengineering 2013, 15.1, 176–184. [Google Scholar]
- Brownjohn, J.M.W.; De Stefano, A.; Xu, Y.-L.; Wenzel, H.; Aktan, A.E. Vibration-Based Monitoring of Civil Infrastructure: Challenges and Successes. J. Civ. Struct. Health Monit. 2011, 1, 79–95. [Google Scholar] [CrossRef]
- Nakamura, S.; Kawasaki, T. Lateral Vibration of Footbridges by Synchronous Walking. J. Constr. Steel Res. 2006, 62, 1148–1160. [Google Scholar] [CrossRef]
- Cremona, C. Dynamic investigations of the solferino footbridge. In Proceedings of the 3rd International Operational Modal Analysis Conference (IOMAC 2009), Portonovo, Italy, 4–6 May 2009; pp. 72–81. [Google Scholar]
- Dallard, P.; Fitzpatrick, A.J.; Flint, A.; Le Bourva, S.; Low, A.; Ridsdill Smith, R.M.; Willford, M. The London Millennium Footbridge. Struct. Eng. 2001, 79, 17–21. [Google Scholar]
- Olaszek, P. Investigation of the Dynamic Characteristic of Bridge Structures Using a Computer Vision Method. Measurement 1999, 25, 227–236. [Google Scholar] [CrossRef]
- Cigada, A.; Mazzoleni, P.; Zappa, E. Vibration Monitoring of Multiple Bridge Points by Means of a Unique Vision-Based Measuring System. Exp. Mech. 2014, 54, 255–271. [Google Scholar]
- Busca, G.; Cigada, A.; Mazzoleni, P.; Tarabini, M.; Zappa, E. Static and Dynamic Monitoring of Bridges by Means of Vision-Based Measuring System. In Topics in Dynamics of Bridges; Cunha, A., Ed.; Conference Proceedings of the Society for Experimental Mechanics Series; Springer: New York, NY, USA, 2013; Volume 3, pp. 83–92. ISBN 978-1-4614-6518-8. [Google Scholar]
- Lee, J.J.; Shinozuka, M. A Vision-Based System for Remote Sensing of Bridge Displacement. NDT E Int. 2006, 39, 425–431. [Google Scholar] [CrossRef]
- Malesa, M.; Szczepanek, D.; Kujawińska, M.; Świercz, A.; Kołakowski, P. Monitoring of Civil Engineering Structures Using Digital Image Correlation Technique. In Proceedings of the EPJ Web of Conferences, Poitiers, France, 4–9 July 2010; Volume 6, p. 31014. [Google Scholar] [CrossRef] [Green Version]
- Hou, X.; Yang, X.; Huang, Q. Using Inclinometers to Measure Bridge Deflection. J. Bridge Eng. 2005, 10, 564–569. [Google Scholar] [CrossRef]
- Hem, X.; Yang, X.; Zhao, L. Application of Inclinometer in Arch Bridge Dynamic Deflection Measurement. Telkomnika Indones. J. Electr. Eng. 2014, 12, 3331–3337. [Google Scholar]
- Hem, X.; Yang, X.; Zhao, L. New Method for High-Speed Railway Bridge Dynamic Deflection Measurement. J. Bridge Eng. 2014, 19, 05014004. [Google Scholar] [CrossRef]
- Olaszek, P.; Wyczałek, I.; Sala, D.; Kokot, M.; Świercz, A. Monitoring of the Static and Dynamic Displacements of Railway Bridges with the Use of Inertial Sensors. Sensors 2020, 20, 2767. [Google Scholar] [CrossRef]
- Gentile, C.; Bernardini, G. An Interferometric Radar for Non-Contact Measurement of Deflections on Civil Engineering Structures: Laboratory and Full-Scale Tests. Struct. Infrastruct. Eng. 2010, 6, 521–534. [Google Scholar] [CrossRef]
- Gentile, C.; Bernardini, G. Radar-Based Measurement of Deflections on Bridges and Large Structures. Eur. J. Environ. Civ. Eng. 2010, 14, 495–516. [Google Scholar] [CrossRef]
- Gentile, C. Deflection Measurement on Vibrating Stay Cables by Non-Contact Microwave Interferometer. NDT E Int. 2010, 43, 231–240. [Google Scholar] [CrossRef]
- Pieraccini, M.; Miccinesi, L. Ground-Based Radar Interferometry: A Bibliographic Review. Remote Sens. 2019, 11, 1029. [Google Scholar] [CrossRef] [Green Version]
- Pieraccini, M.; Parrini, F.; Fratini, M.; Atzeni, C.; Spinelli, P.; Micheloni, M. Static and Dynamic Testing of Bridges through Microwave Interferometry. NDT E Int. 2007, 40, 208–214. [Google Scholar] [CrossRef]
- Bęben, D. Application of the Interferometric Radar for Dynamic Tests of Corrugated Steel Plate (CSP) Culvert. NDT E Int. 2011, 44, 405–412. [Google Scholar] [CrossRef]
- Mayer, L.; Yanev, B.S.; Olson, L.D.; Smyth, A.W. Monitoring of Manhattan Bridge for Vertical and Torsional Performance with GPS and Interferometric Radar Systems. In Proceedings of the Transportation Research Board 89th Annual Meeting, Washington, DC, USA, 10–14 January 2010. [Google Scholar]
- Pieraccini, M.; Fratini, M.; Parrini, F.; Atzeni, C.; Bartoli, G. Interferometric Radar vs. Accelerometer for Dynamic Monitoring of Large Structures: An Experimental Comparison. NDT E Int. 2008, 41, 258–264. [Google Scholar] [CrossRef]
- Pieraccini, M.; Miccinesi, L.; Abdorazzagh Nejad, A.; Naderi Nejad Fard, A. Experimental Dynamic Impact Factor Assessment of Railway Bridges through a Radar Interferometer. Remote Sens. 2019, 11, 2207. [Google Scholar] [CrossRef] [Green Version]
- Xiang, J.; Zeng, Q.; Lou, P. Transverse Vibration of Train-Bridge and Train-Track Time Varying System and the Theory of Random Energy Analysis for Train Derailment. Veh. Syst. Dyn. 2004, 41, 129–155. [Google Scholar] [CrossRef]
- Jin, Z.; Pei, S.; Li, X.; Qiang, S. Vehicle-Induced Lateral Vibration of Railway Bridges: An Analytical-Solution Approach. J. Bridge Eng. 2016, 21, 04015038. [Google Scholar] [CrossRef]
- Fujino, Y.; Pacheco, B.M.; Nakamura, S.-I.; Warnitchai, P. Synchronization of Human Walking Observed during Lateral Vibration of a Congested Pedestrian Bridge. Earthq. Eng. Struct. Dyn. 1993, 22, 741–758. [Google Scholar] [CrossRef]
- Dallard, P.; Fitzpatrick, T.; Flint, A.; Low, A.; Smith, R.R.; Willford, M.; Roche, M. London Millennium Bridge: Pedestrian-Induced Lateral Vibration. J. Bridge Eng. 2001, 6, 412–417. [Google Scholar] [CrossRef]
- Miccinesi, L.; Beni, A.; Pieraccini, M. Multi-Monostatic Interferometric Radar for Bridge Monitoring. Electronics 2021, 10, 247. [Google Scholar] [CrossRef]
- Dei, D.; Mecatti, D.; Pieraccini, M. Static Testing of a Bridge Using an Interferometric Radar: The Case Study of “Ponte Degli Alpini,” Belluno, Italy. Sci. World J. 2013, 2013, e504958. [Google Scholar] [CrossRef]
- Gocał, J.; Ortyl, Ł.; Owerko, T.; Kuras, P.; Kocierz, R.; Ćwiąkała, P.; Puniach, E.; Sukta, O.; Bałut, A. Determination of Displacements and Vibrations of Engineering Structures Using Ground-Based Radar Interferometry; Wydawnictwa AGH: Kraków, Poland, 2013; ISBN 978-83-7464-645-1. [Google Scholar]
- Miccinesi, L.; Pieraccini, M. Bridge Monitoring by a Monostatic/Bistatic Interferometric Radar Able to Retrieve the Dynamic 3D Displacement Vector. IEEE Access 2020, 8, 210339–210346. [Google Scholar] [CrossRef]
- Monti-Guarnieri, A.; Falcone, P.; D’Aria, D.; Giunta, G. 3D Vibration Estimation from Ground-Based Radar. Remote Sens. 2018, 10, 1670. [Google Scholar] [CrossRef] [Green Version]
- Michel, C.; Keller, S. Advancing Ground-Based Radar Processing for Bridge Infrastructure Monitoring. Sensors 2021, 21, 2172. [Google Scholar] [CrossRef] [PubMed]
- Olaszek, P. The Application of Interferometric Radar for Measuring Lateral Vibration of Bridges; CRC Press: Boca Raton, FL, USA, 2021; pp. 2359–2366. ISBN 978-0-429-27911-9. [Google Scholar]
Figure 1.
Vertical displacement measurement using one interferometric radar in the case of simultaneous horizontal displacement: 1—interferometric radar; 2—tested element of bridge; d—total displacement; dz—vertical component of total displacement; dy—horizontal component of total displacement; dr—displacement in the range direction; dz_calc—calculated vertical displacement; R—radar distance from the tested point in the target axis; H—distance from the tested point in vertical direction.

Figure 2.
Relationship between the Interpretation Error EI and the R/H ratio (radar distance from the tested point in the target axis/distance from the tested point in vertical direction) at the different levels of the ratio L/V (horizontal, longitudinal or lateral displacement/vertical displacement).
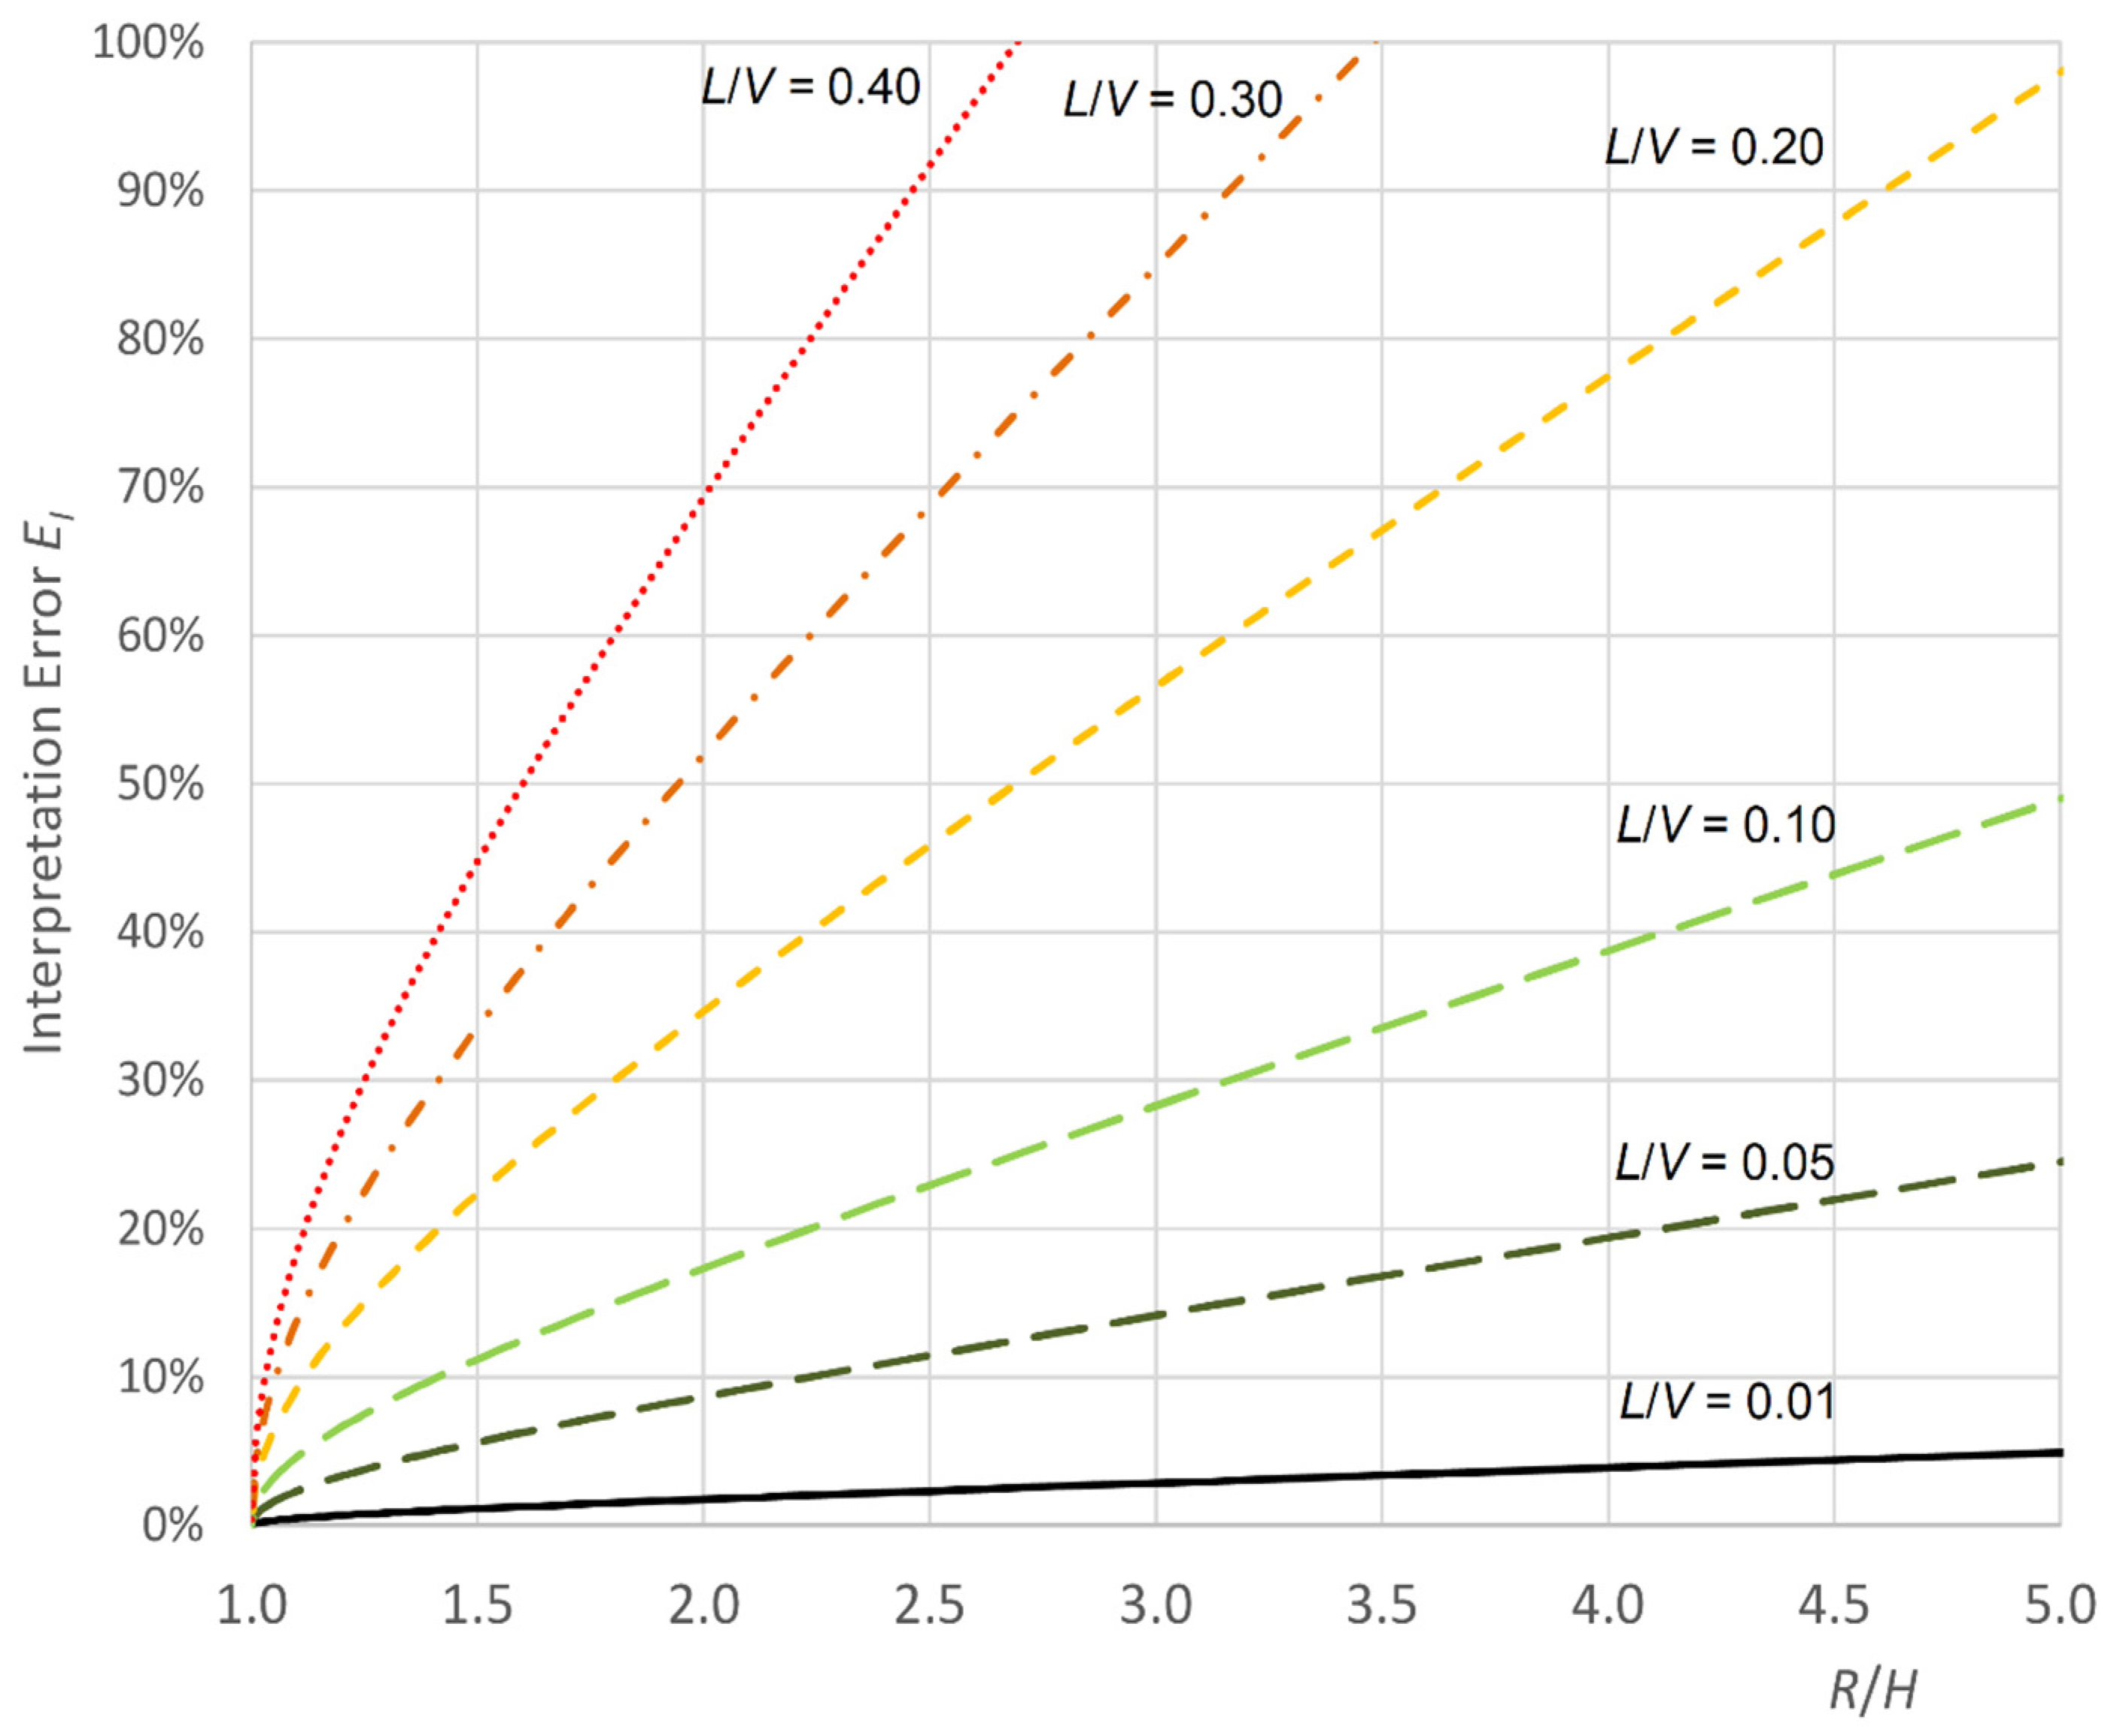
Figure 3.
Vertical and horizontal displacement measurement using a set of two interferometric radars: (a) two radars at the same side of measured element, (b) two radars at both sides of measured element; 1 and 2—interferometric radars, 3—tested element of the bridge, d—total displacement, dz—vertical component of total displacement, dy—horizontal component of total displacement, dr1 and dr2—displacements in the range direction, R1 and R2—radar distance from the tested point in the target axis, H1 and H2—distance from the tested point in vertical/horizontal direction.

Figure 4.
View of bridge No. 1.
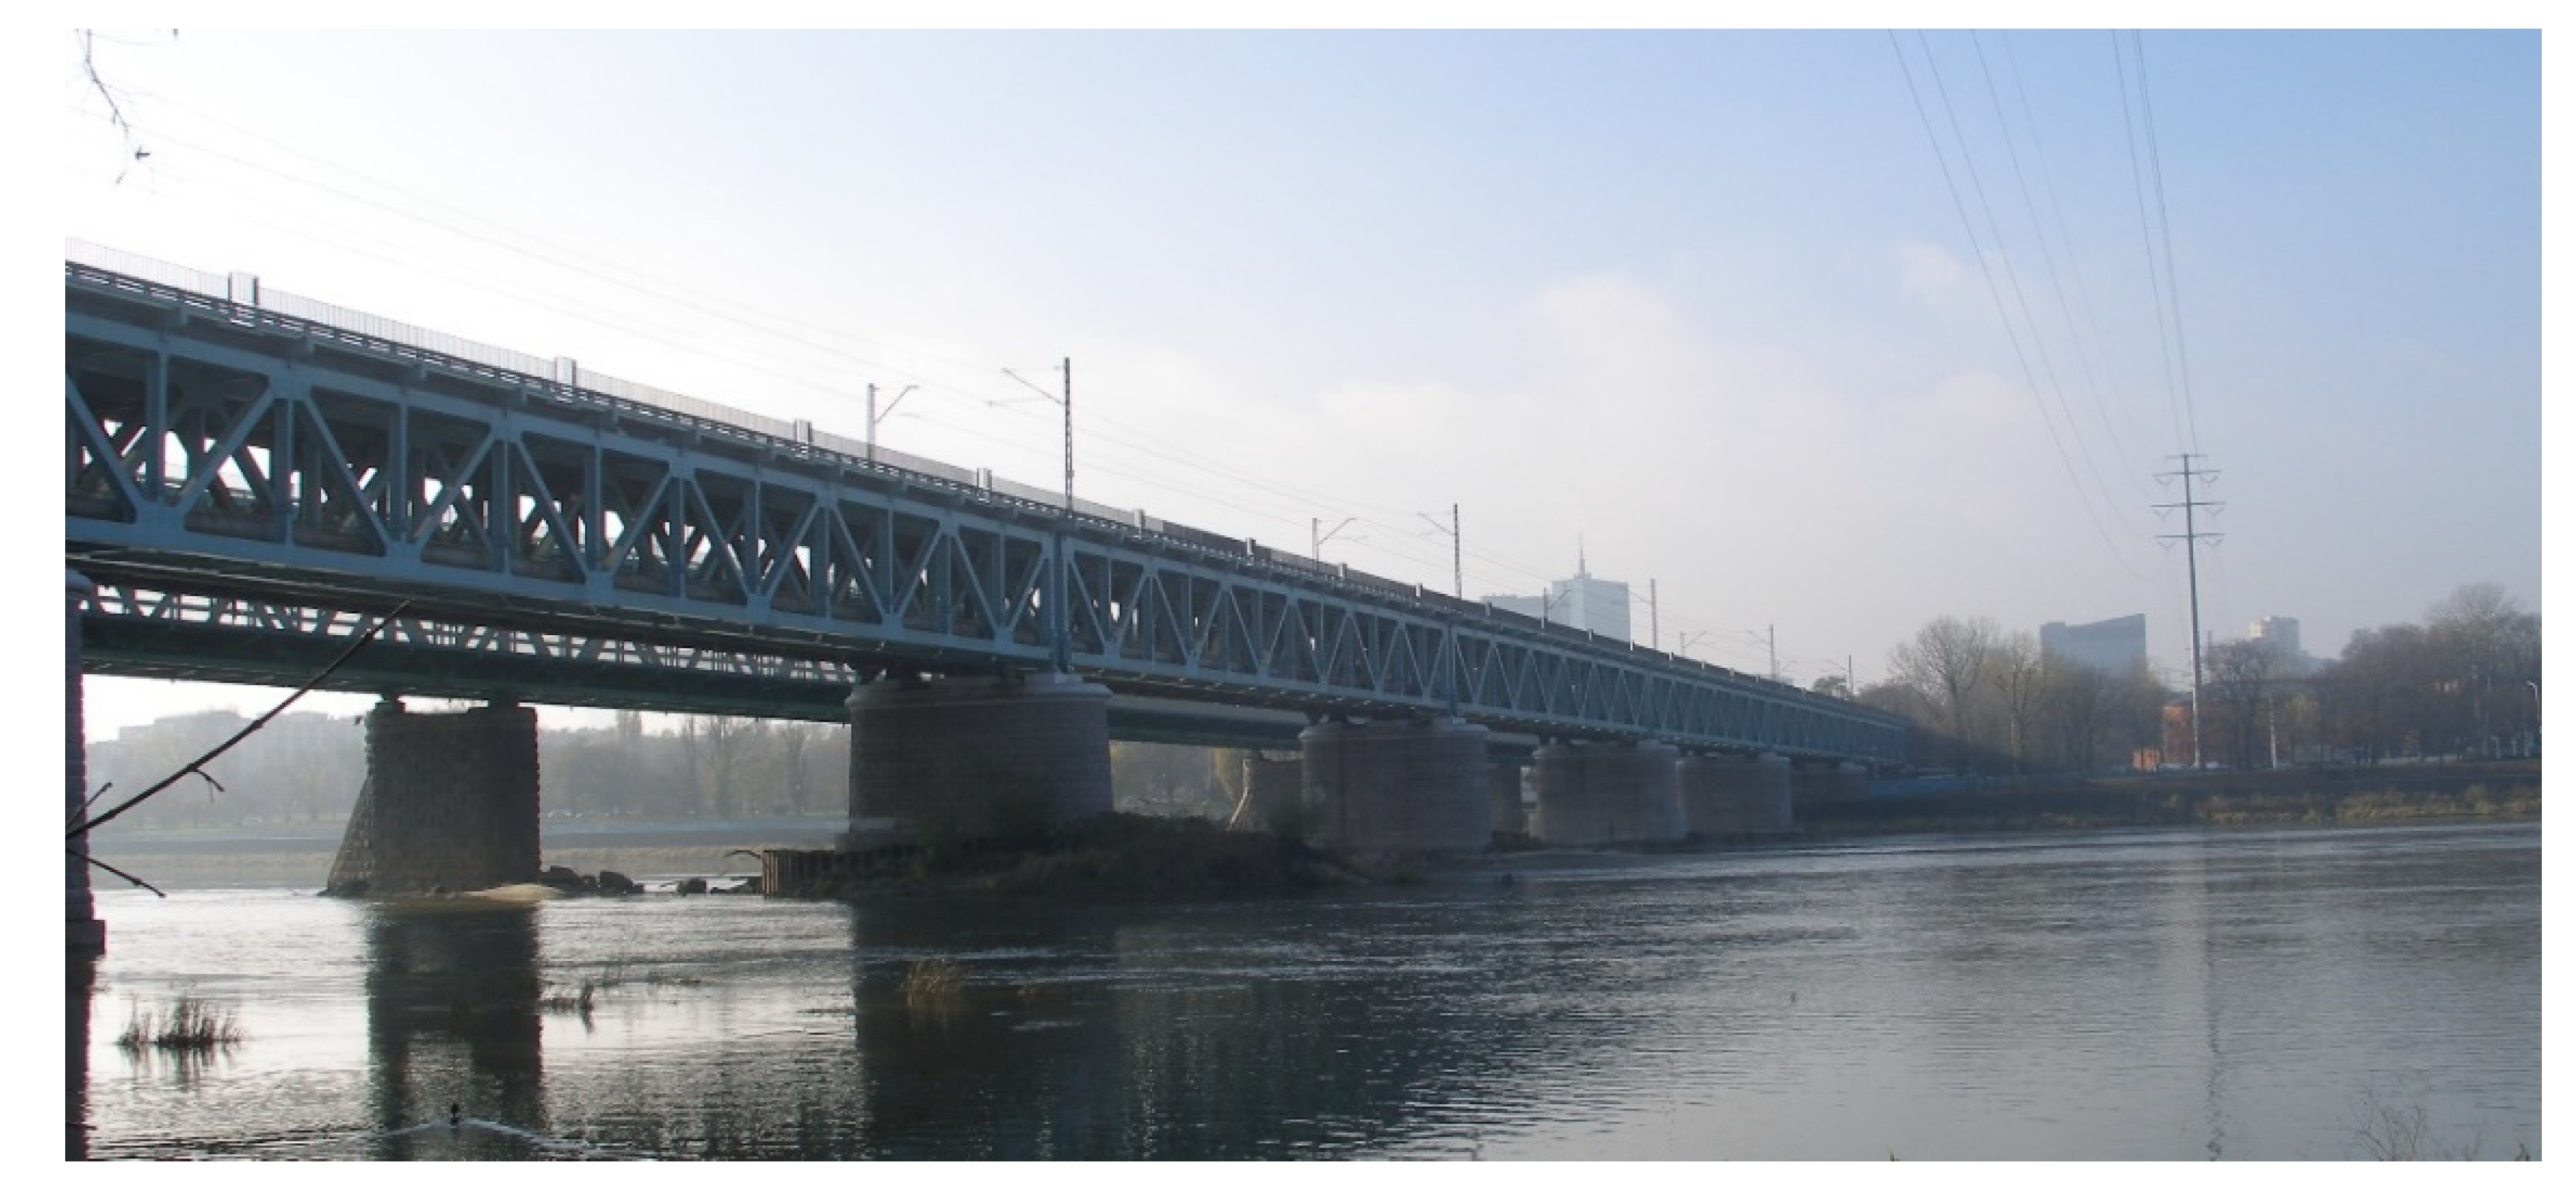
Figure 5.
Results of calculation for passage of two coupled locomotives: left axis—the calculated extremal vertical and simultaneous horizontal displacement along the span; right axis—ratio L/V.
Figure 5.
Results of calculation for passage of two coupled locomotives: left axis—the calculated extremal vertical and simultaneous horizontal displacement along the span; right axis—ratio L/V.
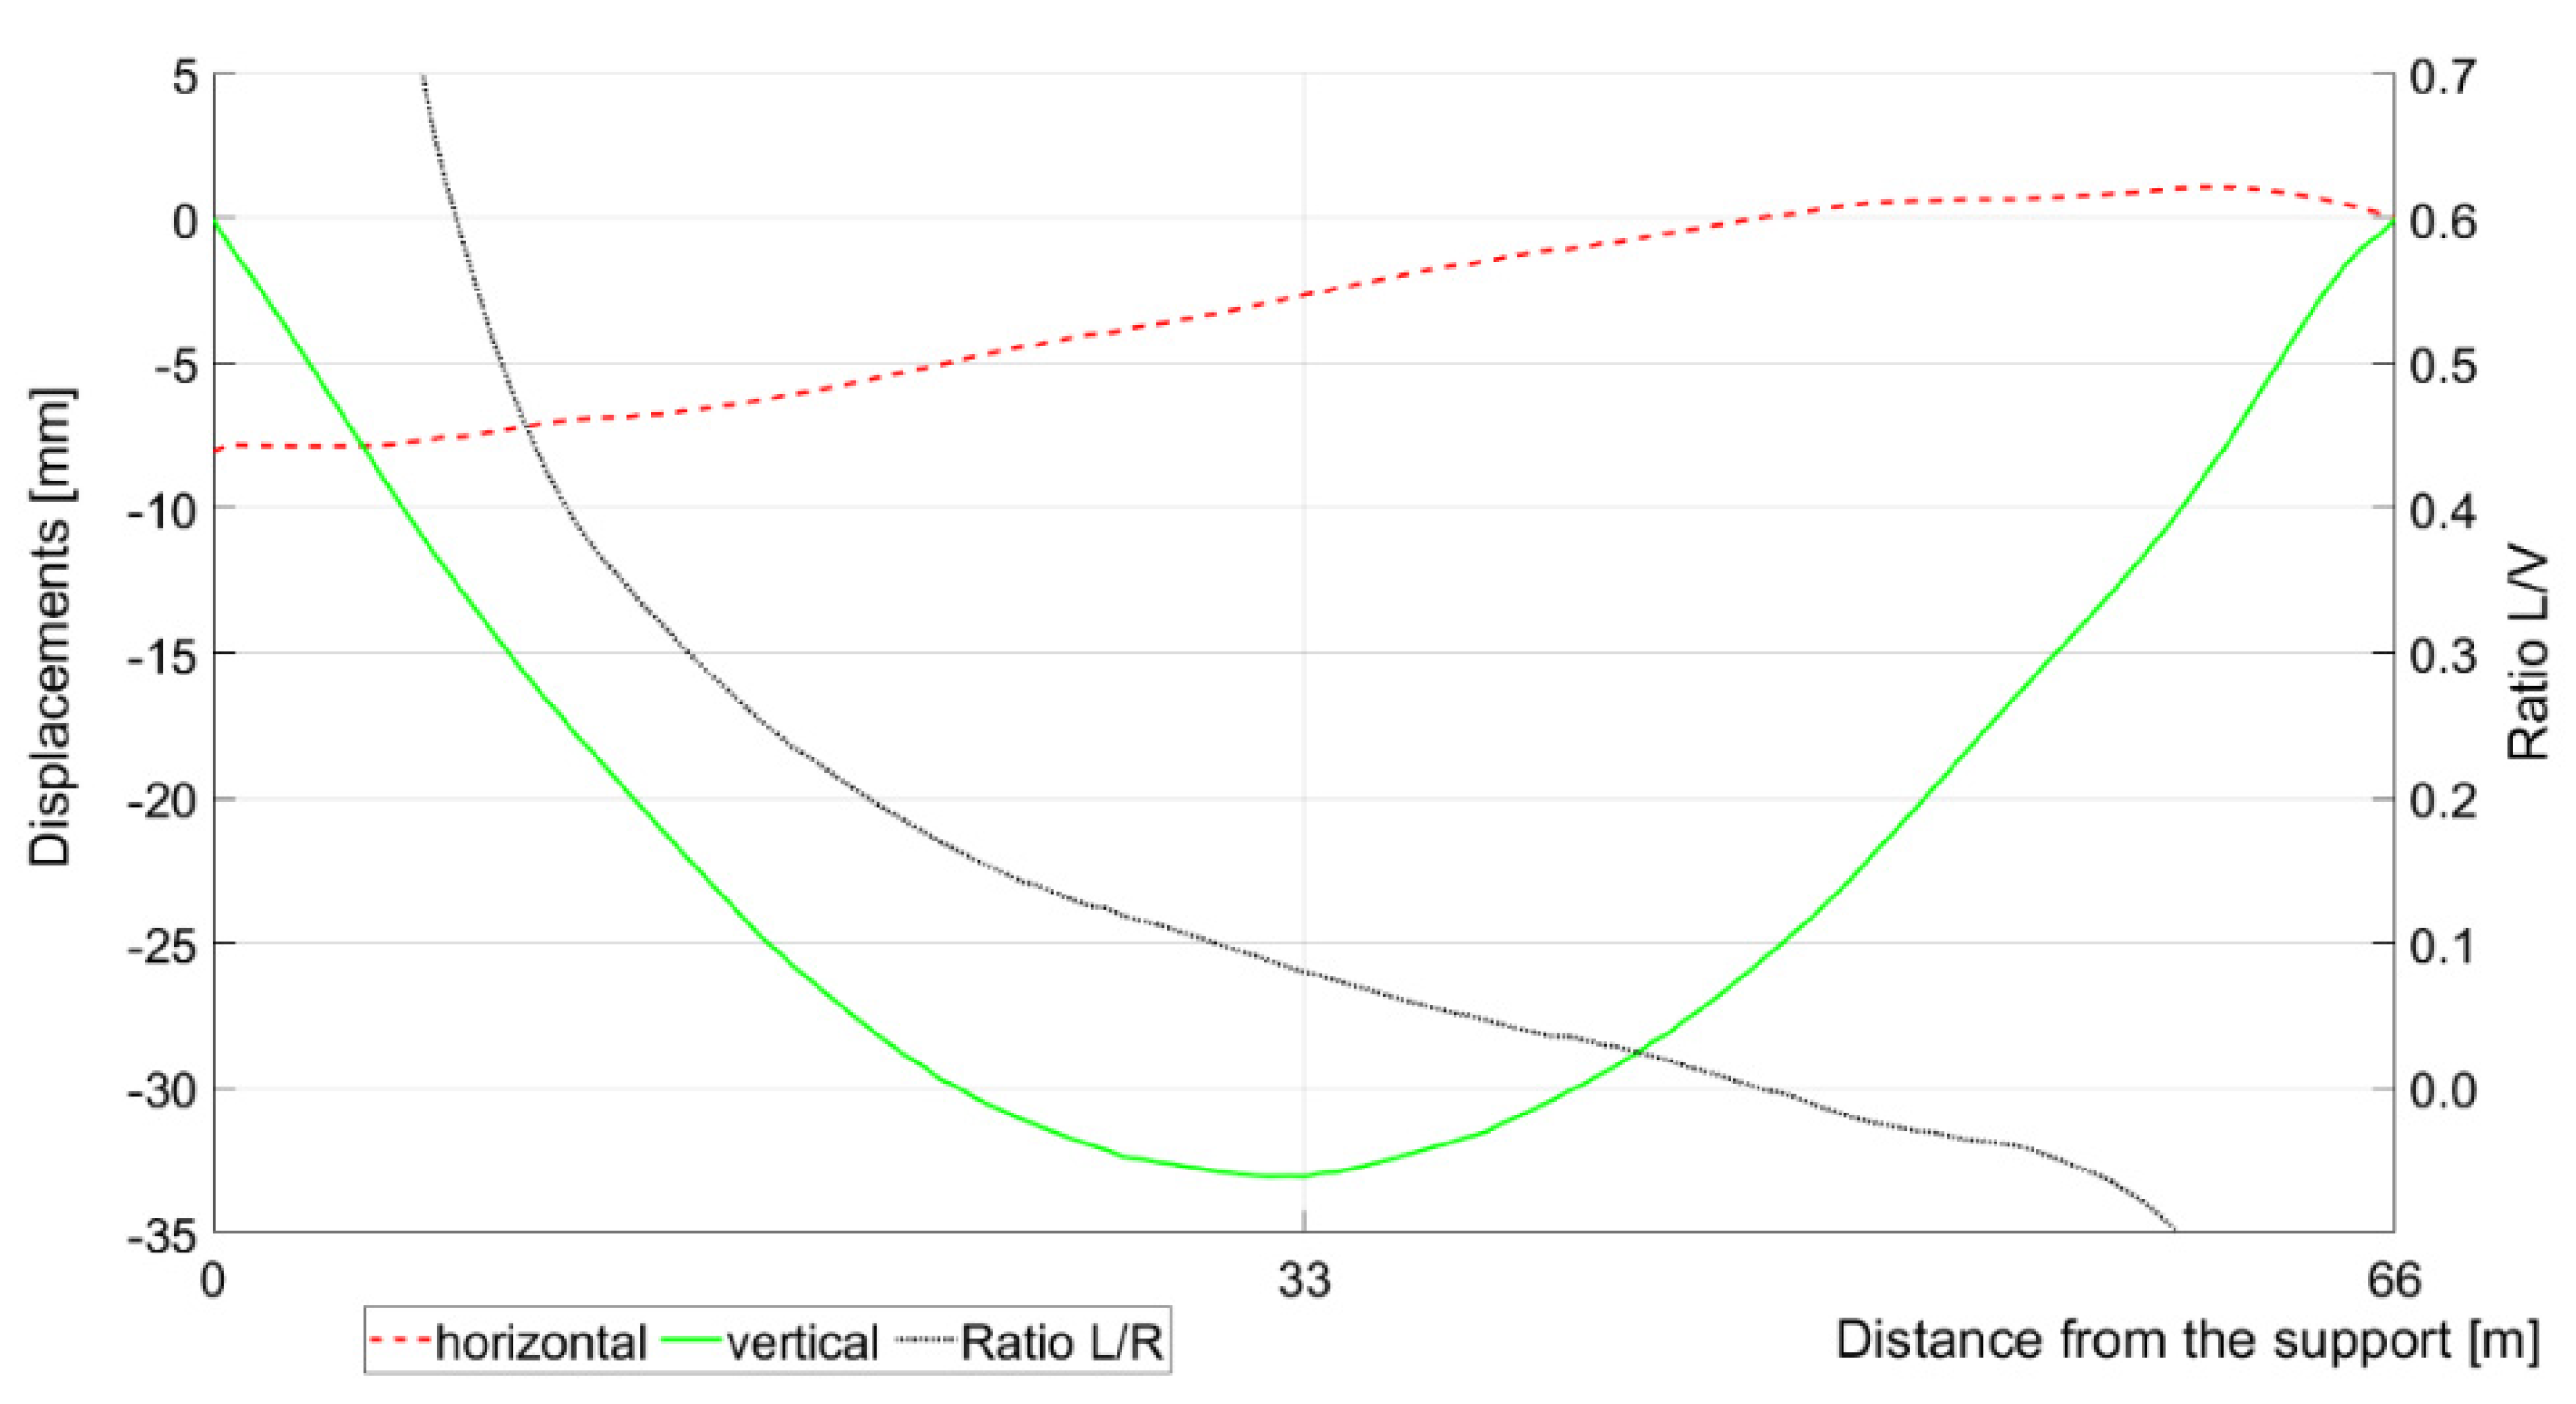
Figure 6.
Results of the calculation for passage of two locomotives: (a) deformations of the 3/4 length of the span (from fixed bearing); (b) deformations of the 1/4 length of the span (from movable bearing); the vertical and horizontal displacements of the point on the cross bar are marked (scale of the graph (b) is greater than scale of the graph (a)).
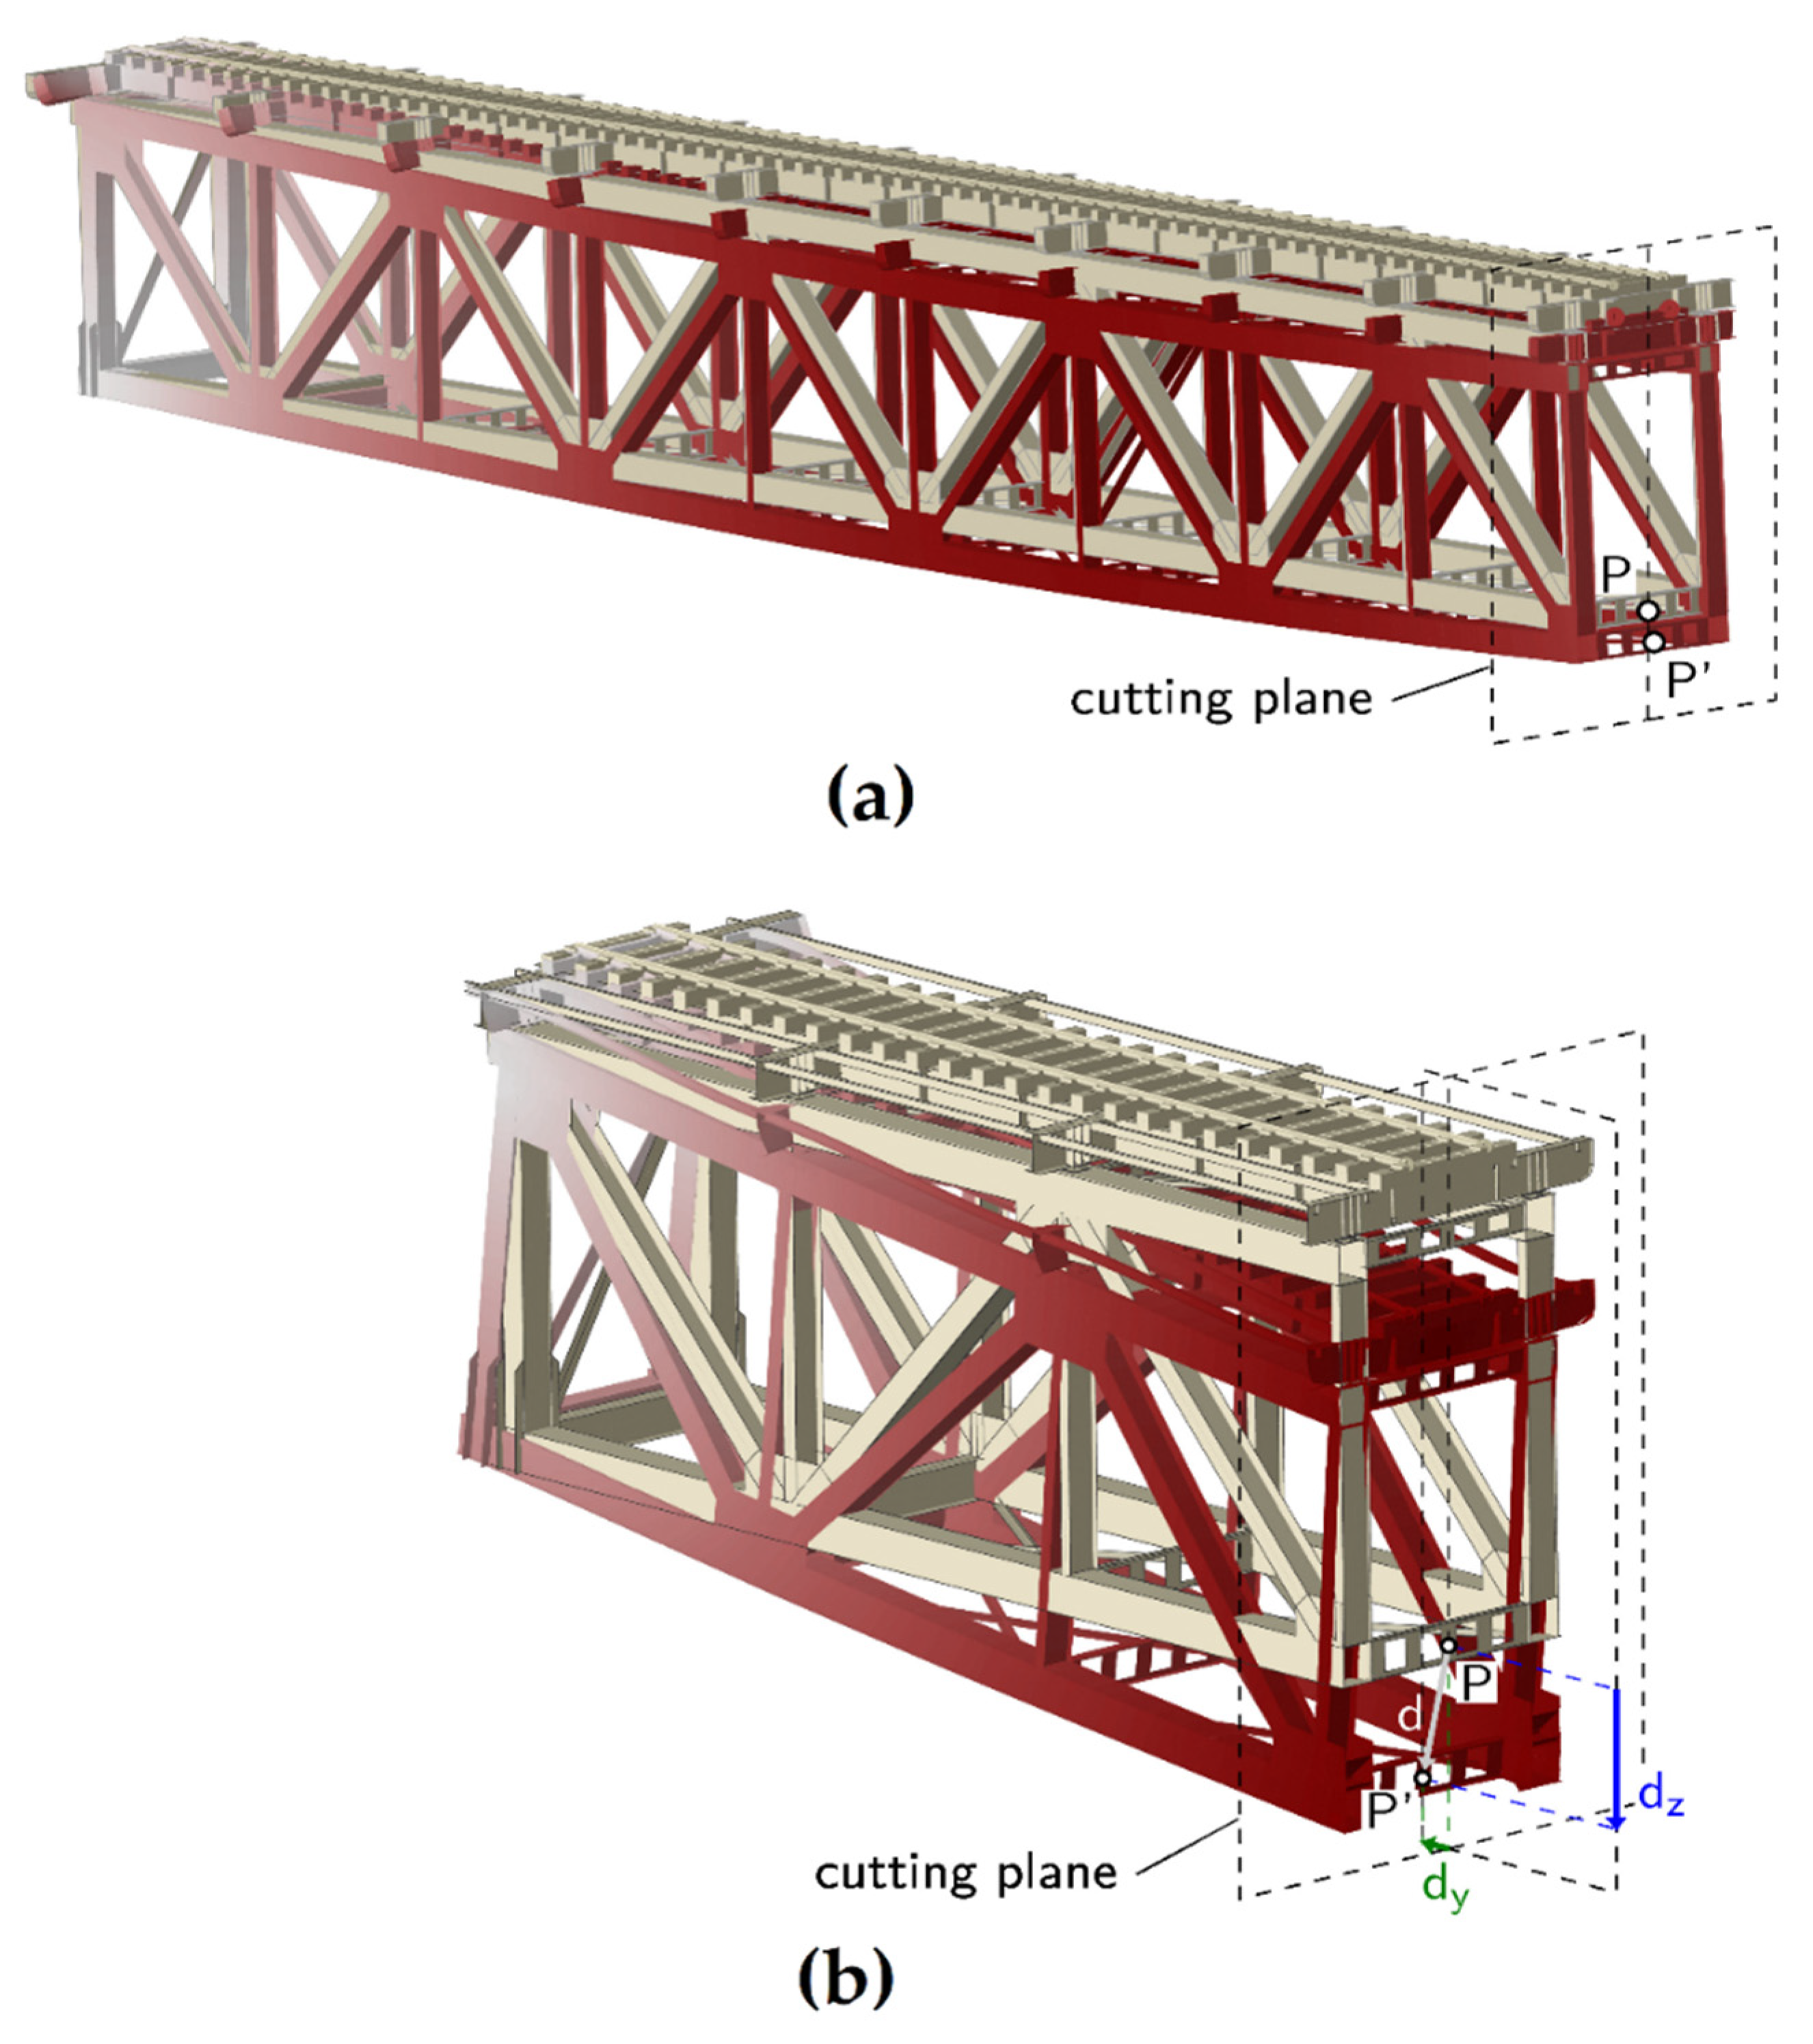
Figure 7.
View of bridge No 2.

Figure 8.
Results of calculation for passage of multiple-unit passenger train: left axis—the calculated extremal vertical and simultaneous horizontal displacement along the span; right axis—ratio L/V.
Figure 8.
Results of calculation for passage of multiple-unit passenger train: left axis—the calculated extremal vertical and simultaneous horizontal displacement along the span; right axis—ratio L/V.
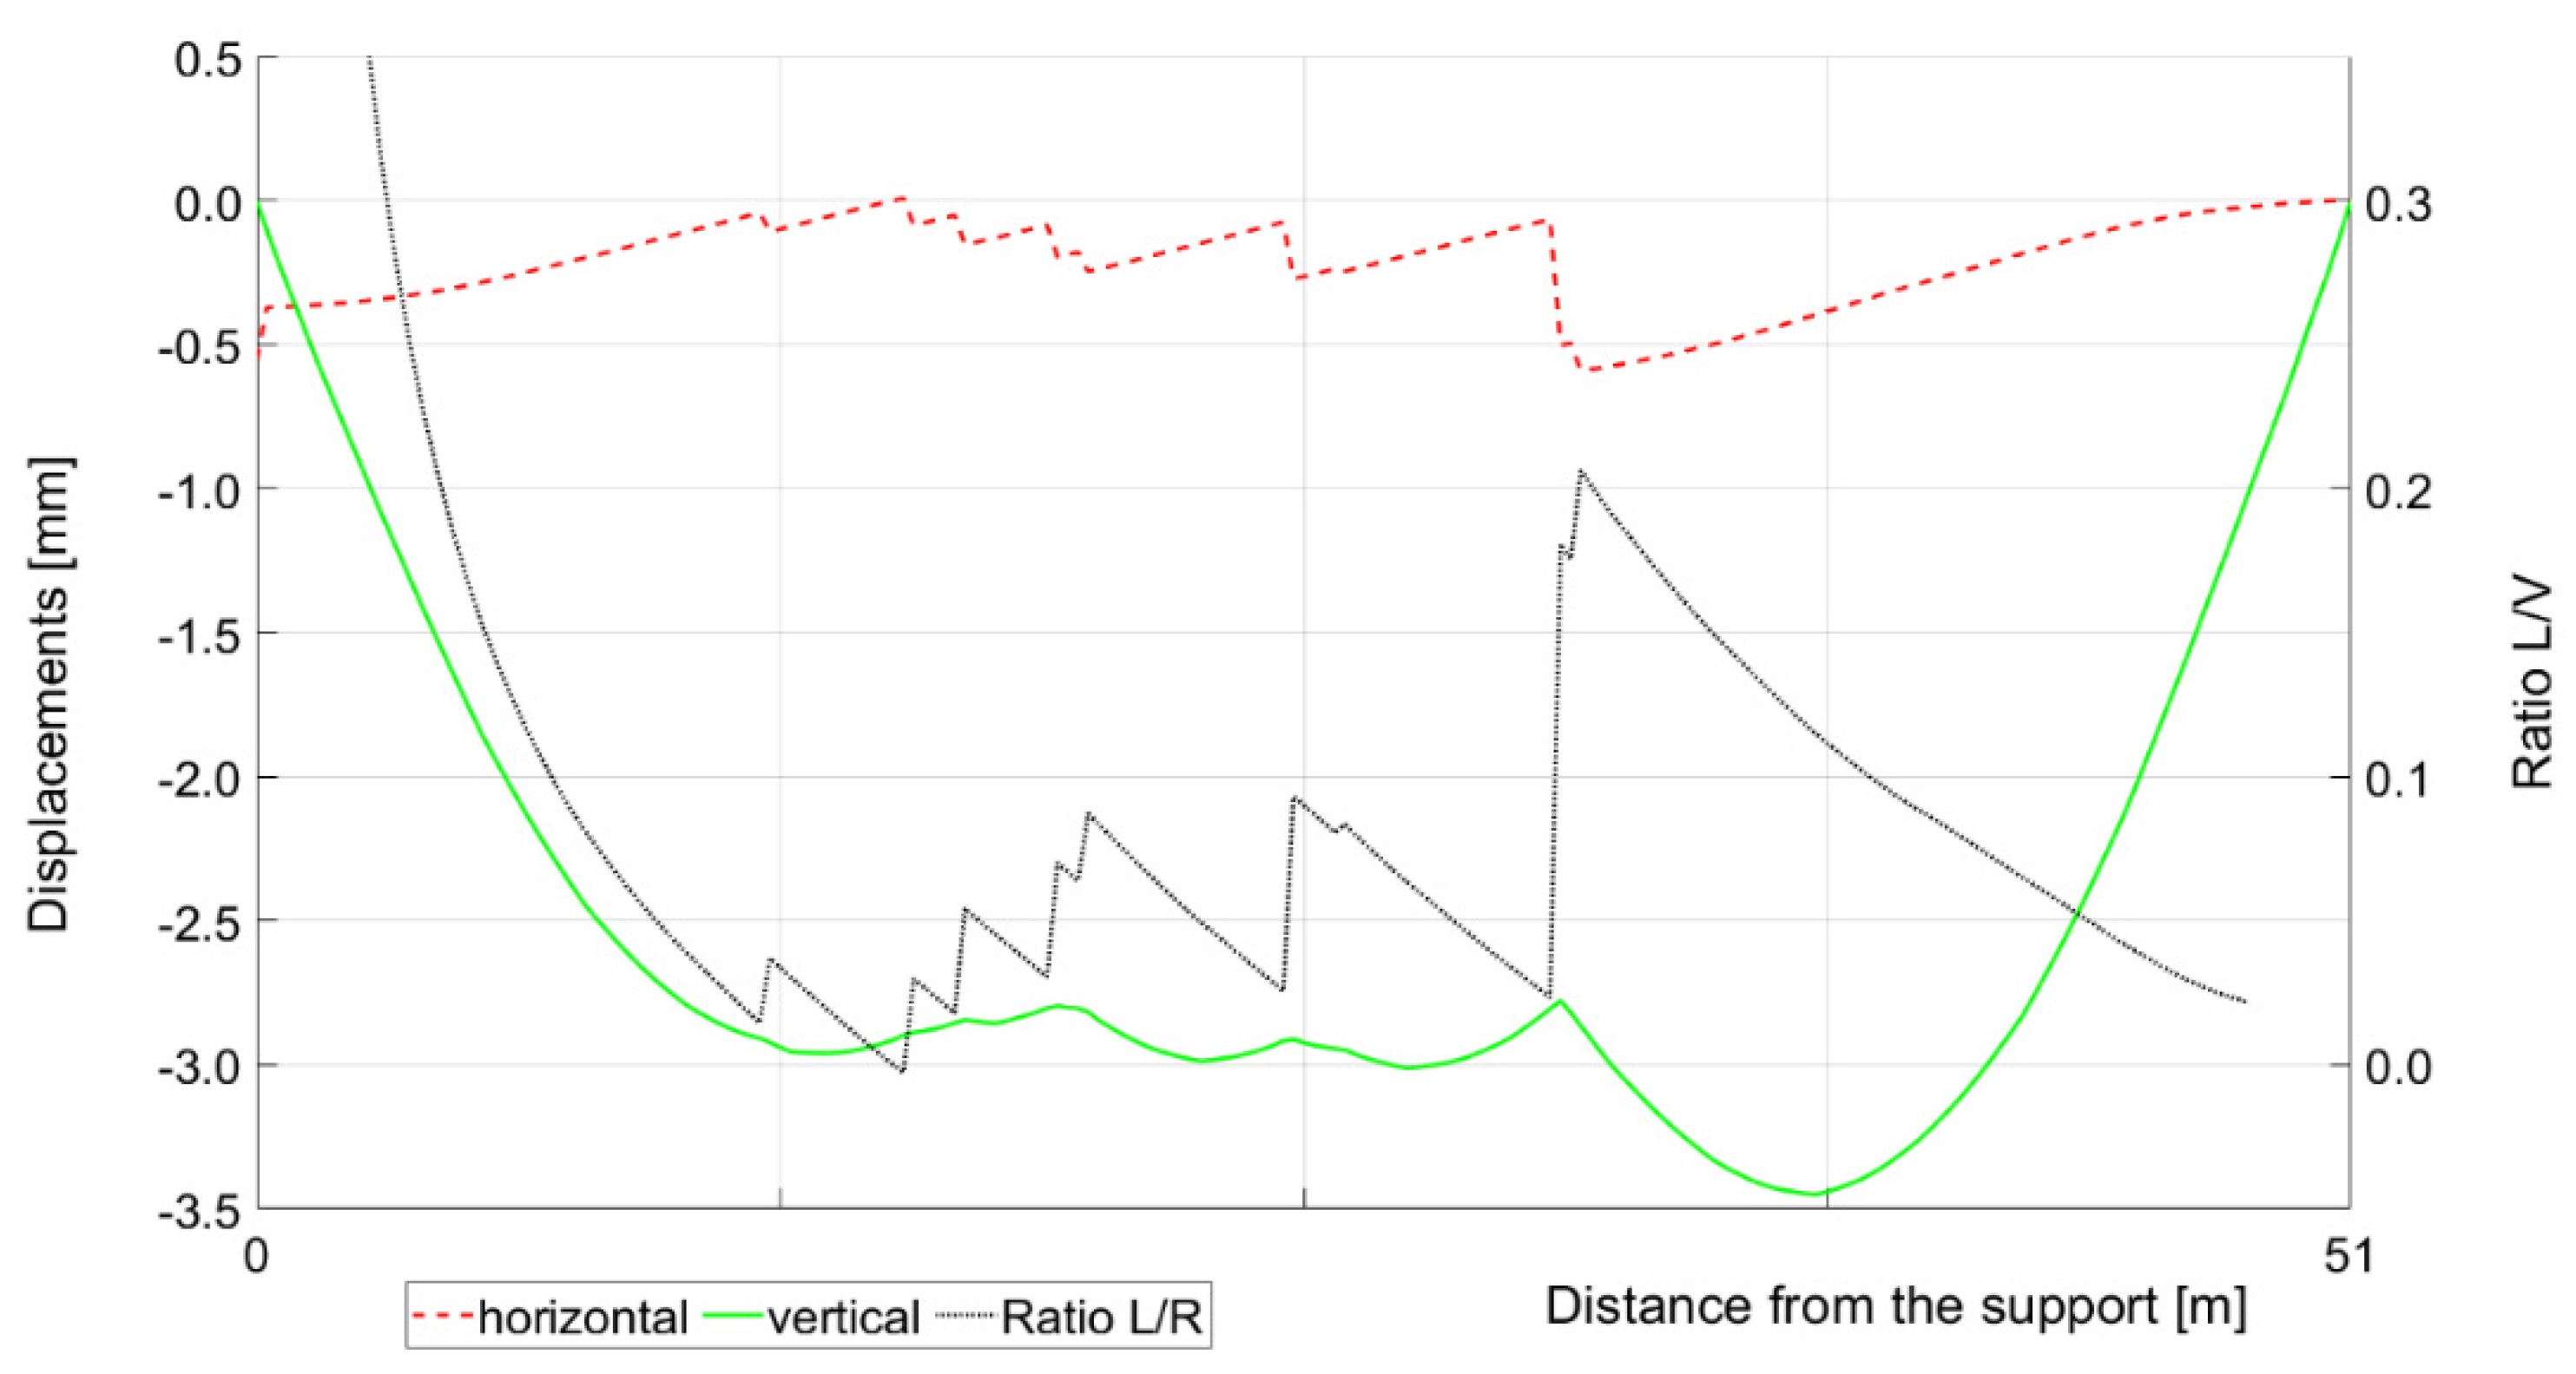
Figure 9.
Bridge No. 1—test at cross-section No. 1: (a) 1—radar No. 1, 3—inductive transducer for the reference measurement; (b) 1 and 2—radar No. 1 and No. 2.
Figure 9.
Bridge No. 1—test at cross-section No. 1: (a) 1—radar No. 1, 3—inductive transducer for the reference measurement; (b) 1 and 2—radar No. 1 and No. 2.
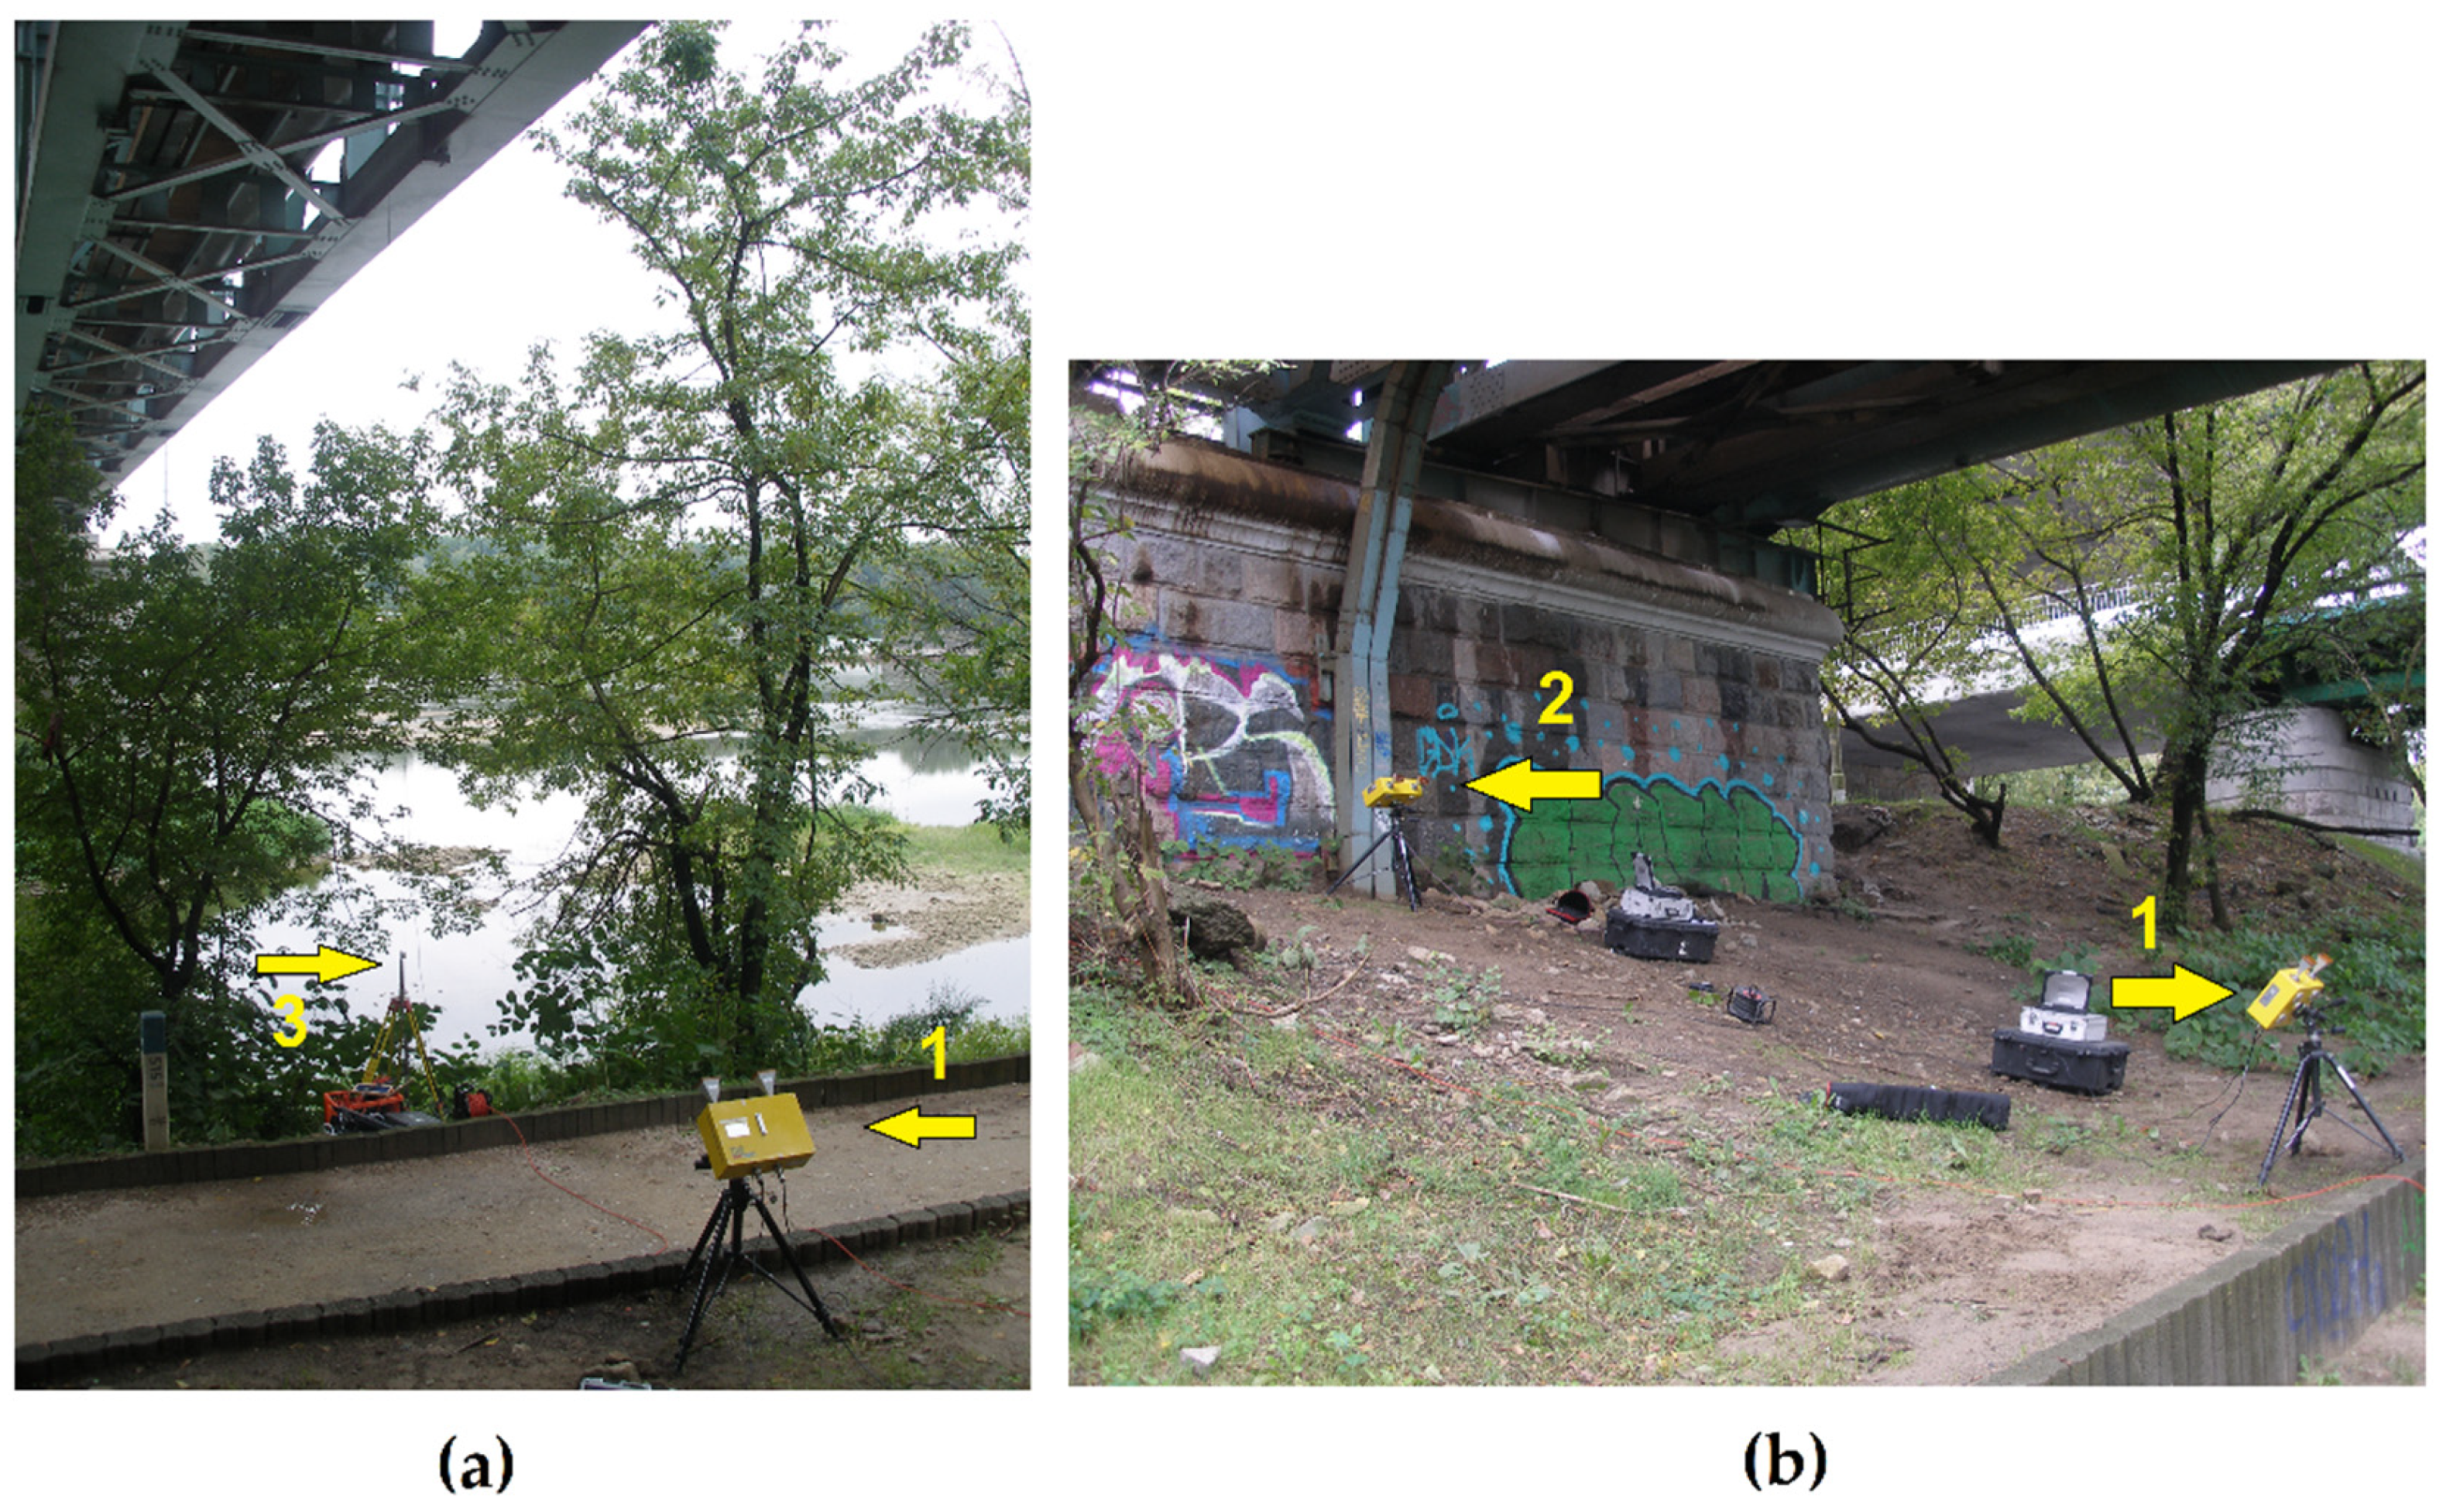
Figure 10.
Bridge No. 1—an example of an analysis of a cargo train passage: (a) displacements in the range direction measured by single radars No. 1 and No. 2 before synchronization; (b) vertical displacement measured by single radars No. 1 and No. 2 and the reference vertical displacement measurement; (c) vertical and horizontal displacement calculated based on two radars’ (No. 1 and No. 2) measurements and the reference vertical displacement measurement; scale of the graph (b) is two times scale of the graph (c).

Figure 11.
Bridge No. 2; 1—radar No. 1, 2—radar No. 2, 3—inductive transducer for the reference measurement.
Figure 11.
Bridge No. 2; 1—radar No. 1, 2—radar No. 2, 3—inductive transducer for the reference measurement.
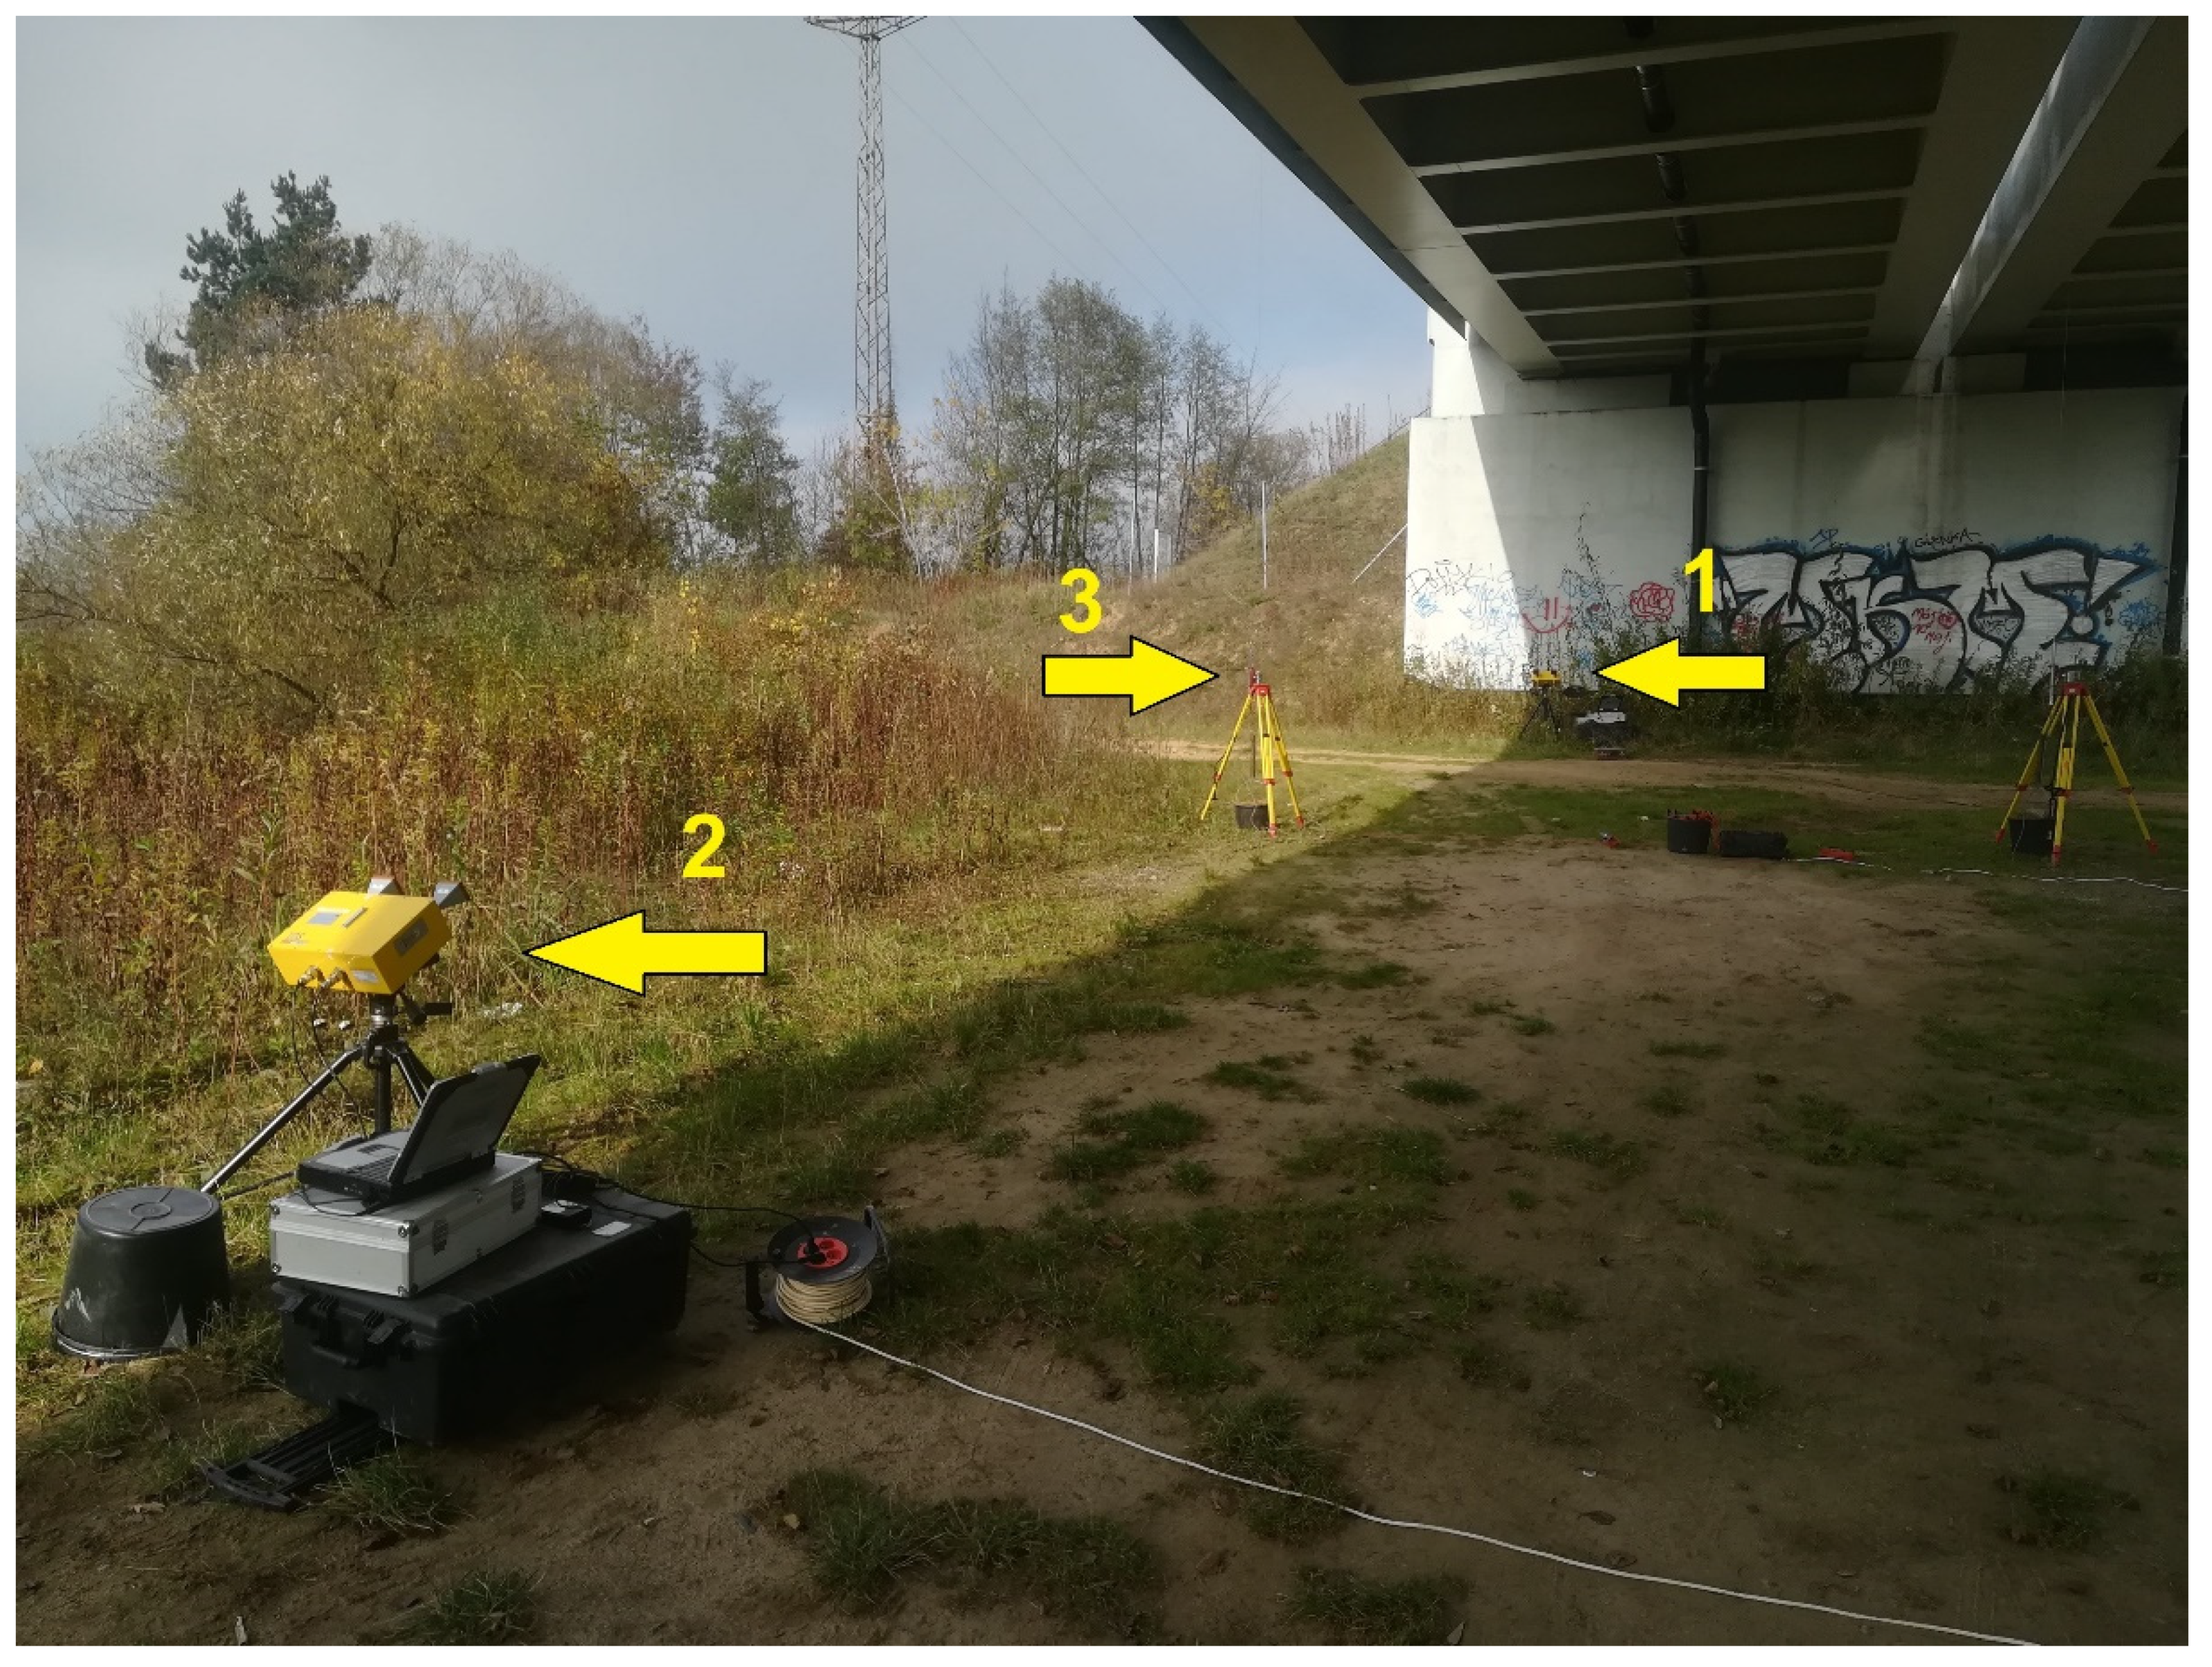
Figure 12.
Bridge No. 2—an example of an analysis of a multiple-unit passenger train passage: (a) displacements in the range direction measured by single radars No. 1 and No. 2 before synchronization; (b) vertical displacement measured by single radars No. 1 and No. 2 and the reference vertical displacement measurement; (c) vertical and horizontal displacement calculated based on two radars’ (No. 1 and No. 2) measurements and the reference vertical displacement measurement.

Table 1.
Bridge No. 1—summary of comparative research (cross-section No. 1: trains 1 and 2, cross-section No. 2: trains 3 and 4).
Table 1.
Bridge No. 1—summary of comparative research (cross-section No. 1: trains 1 and 2, cross-section No. 2: trains 3 and 4).
| Trains | Extremal Measurement Results (mm) | ||
| dr1 z | dr2 z | dz | |
| (1) Separate locomotive and cargo or passenger wagons | −29.65 | −43.07 | −23.87 |
| (2) Multiple-unit passenger train | −13.08 | −19.01 | −10.45 |
| (3) Separate locomotive and passenger wagons | −17.4 | −13.2 | −16.7 |
| (4) Multiple-unit passenger train | −11.60 | −9.64 | −12.89 |
| Trains | Extremal Deviation to Reference Measurements (mm) | ||
| | dr1z, r2z, z) − dref z | | |||
| (1) Separate locomotive and cargo or passenger wagons | 6.25 | 19.67 | 0.47 |
| (2) Multiple-unit passenger train | 2.67 | 8.60 | 0.14 |
| (3) Separate locomotive and passenger wagons | 0.94 | 3.30 | 0.20 |
| (4) Multiple-unit passenger train | 1.05 | 3.02 | 0.26 |
| Trains | Extremal Relative Deviation to Reference Measurements | ||
| | dr1z, r2z, z) − dref z |/|dref z | | |||
| (1) Separate locomotive and cargo or passenger wagons | 27% | 91% | 2% |
| (2) Multiple-unit passenger train | 26% | 83% | 0% |
| (3) Separate locomotive and passenger wagons | 6% | 20% | 1% |
| (4) Multiple-unit passenger train | 9% | 24% | 3% |
Table 2.
Bridge No. 2—summary of comparative research.
| Trains | Extremal Measurement Results (mm) | ||
| dr1 z | dr2 z | dz | |
| (1) Separate locomotive and passenger wagons | −6.39 | −6.40 | −6.40 |
| (2) Multiple-unit passenger train | −2.81 | −2.82 | −2.82 |
| Trains | Extremal Deviation to Reference Measurements (mm) | ||
| | dr1z, r2z, z) − dref z | | |||
| (1) Separate locomotive and passenger wagons | 0.19 | 0.15 | 0.14 |
| (2) Multiple-unit passenger train | 0.10 | 0.18 | 0.14 |
| Trains | Extremal Relative Deviation to Reference Measurements | ||
| |dr1z, r2z, z) − dref z |/|dref z | | |||
| (1) Separate locomotive and passenger wagons | 3% | 3% | 2% |
| (2) Multiple-unit passenger train | 4% | 7% | 5% |
Publisher’s Note: MDPI stays neutral with regard to jurisdictional claims in published maps and institutional affiliations. |
© 2021 by the authors. Licensee MDPI, Basel, Switzerland. This article is an open access article distributed under the terms and conditions of the Creative Commons Attribution (CC BY) license (https://creativecommons.org/licenses/by/4.0/).
Share and Cite
MDPI and ACS Style
Olaszek, P.; Świercz, A.; Boscagli, F. The Integration of Two Interferometric Radars for Measuring Dynamic Displacement of Bridges. Remote Sens. 2021, 13, 3668. https://doi.org/10.3390/rs13183668
AMA Style
Olaszek P, Świercz A, Boscagli F. The Integration of Two Interferometric Radars for Measuring Dynamic Displacement of Bridges. Remote Sensing. 2021; 13(18):3668. https://doi.org/10.3390/rs13183668
Chicago/Turabian StyleOlaszek, Piotr, Andrzej Świercz, and Francesco Boscagli. 2021. "The Integration of Two Interferometric Radars for Measuring Dynamic Displacement of Bridges" Remote Sensing 13, no. 18: 3668. https://doi.org/10.3390/rs13183668
Note that from the first issue of 2016, this journal uses article numbers instead of page numbers. See further details here.