
Geomorphology, Mineralogy, and Geochronology of Mare Basalts and Non-Mare Materials around the Lunar Crisium Basin


1
Shandong Key Laboratory of Optical Astronomy and Solar-Terrestrial Environment, School of Space Science and Physics, Institute of Space Sciences, Shandong University, Weihai 264209, China
2
CAS Center for Excellence in Comparative Planetology, Chinese Academy of Sciences, Hefei 230026, China
*
Author to whom correspondence should be addressed.
Remote Sens. 2021, 13(23), 4828; https://doi.org/10.3390/rs13234828
Submission received: 18 October 2021
/
Revised: 17 November 2021
/
Accepted: 23 November 2021
/
Published: 27 November 2021
(This article belongs to the Special Issue Planetary Remote Sensing: Chang’E-4/5 and Mars Applications)
Abstract
:The Nectarian-aged Crisium basin exhibits an extremely thin crust and complicated lunar geological history. This large multi-ring impact basin is characterized by prolonged lunar volcanism ranging from the Imbrian age to the Eratosthenian period, forming the high-Ti mare unit, low-Ti mare basalts, and very low-Ti mare unit. We produced an updated geological map of the Crisium basin and defined four mare units (Im1: 3.74 Ga; Im2: 3.49 Ga; Im3: 3.56 Ga; EIm: 2.49 Ga) in terms of distinct composition and mineralogy. Olivine was widely determined in the Ti-rich Im1, implying the hybridization source in the lunar mantle with the occurrence of small-scale convective overturn. The major phase of low-Ti basaltic volcanism occurred c.a. 3.5 Ga, forming Im2 and Im3 in the western area. The youngest mare unit (EIm) has slight variations of pyroxene compositions, implying a decrease of calcic content of basaltic volcanisms with time. Later, distal material transports from large impact events in highlands could complicate the mixing of local mare basalts in the Copernicus age, especially the Im3 unit. The identified olivine-bearing outcrops and widely Mg-rich materials (Mg# > 70, where Mg# = molar 100 × Mg/(Mg + Fe)) in the western highlands, assumed to be the occurrence of the Mg-suite candidates, require future lunar exploration missions to validate.
1. Introduction
Among the most prominent landforms on the Moon, large impact basins have a relatively complex topographic expression and mineralogical composition [1,2]. A large impact basin usually consists of concentric rings formed during catastrophic impact events. These basins are commonly surrounded by old, heavily cratered terrain, representing the residue of the ancient lunar crust. The interior floors of these basins, especially for these on the lunar nearside, are usually filled with subsequent, multi-phase mare lava flows from the partially melted lunar mantle. However, the mare plains could be contaminated by highland materials ejected by small-body impact events and other basin-forming events, leading to the compositional and mineralogical heterogeneity due to later mixing. Mare basalts are estimated to occupy only 0.1~0.5 vol.% of the lunar crust, but these mare deposits witness the evolution and thermal history of the lunar mantle cumulus [3,4,5]. Interestingly, in mare basalt-filling basins, the lunar crust is extremely thin on the lunar nearside from the GRAIL dataset [6]. Most lunar basins have been characterized in terms of mineralogy and composition (e.g., Mare Imbrium from Thiessen et al., 2014 [7]; Mare Serenitatis from Kaur et al., 2013 [8]; Mare Frigoris from Kramer et al., 2015 [9], etc.), which enhance our understanding of the flooding history of mare lava flows and the inhomogeneity of the lunar mantle.
Mare Crisium is a Nectarian-aged basin that spans 1000 km in diameter [2,10]. The crustal thickness in the Crisium basin is close to 0 km [6]. It is suggested that, even if the Crisium impact event did not penetrate the primitive lunar crust to excavate the lunar mantle materials, it would have greatly thinned the local lunar crust. Some olivine outcrops, assumed to be one of the major lunar mantle materials, have been detected from lunar remote sensing observations, based on Moon Mineralogy Mapper (M3) data [11] and SELENE/Kaguya multiband imager (MI) data [12]. The chemical compositions of basalts in Mare Crisium improve our understanding of basaltic volcanic activities on the Moon. Spudis and Sliz (2016) [13] identified and dated the impact melt sheets in the rim of the Crisium basin, suggesting that the western Crisium kipukas contain mare-like, Ca, Fe-rich pyroxene compositions. Runyon et al. (2020) [14] further characterized possible impact melt sheets, indicating that Yerkes crater likely contains the Crisium melt materials. Thus, a detailed geologic map of the Crisium basin from the newly acquired remote sensing observations is necessary to understand the geologic context, regional crustal composition, flooding history of mare basalts, and geochronology.
In this study, we map the geology of Mare Crisium involving morphologies (impact craters, impact melts, wrinkle ridges, volcanic cones, and kipukas), chemical compositions and geochronology of mare basalts and non-materials based on multiple sources of remote sensing image and data. This updated geological map contains four mare units and two groups of highland units as well as absolute model ages (AMAs) of basalts. It provides a detailed geological setting of the Crisium basin on the Moon.
2. Geological Setting of Crisium Basin
The large impact basins (diameter larger than ~300 km [15]) are the common and typical geological structure on the Moon, which records the geological process and final product of giant impact events. Spudis et al. (1993) have identified 42 multi-ring impact basins across the surface of the Moon with ages from pre-Nectarian to Lower Imbrian. The South Pole-Aitken basin (SPA) is the oldest and largest impact structure on the lunar farside, while the Oriental basin is the youngest basin that keeps intact impact multi-ring structure. The Crisium basin is a large multi-ring impact basin on the northeastern portion (10~25°N and 50~70°E) of the lunar nearside (Figure 1). Lunar Orbiter Laser Altimeter (LOLA) data reveal that the inner ring of Crisium basin is approximately 556 km in diameter and covers an area of 176,000 km2. Its central floor is quite flat in the inner depression, which was filled with lunar basalts. Mare Crisium is surrounded by highland massifs, remaining in the undegraded basin rings. Among these irregular and topographically higher massifs, there are many dark and low basalt-filling patches, such as Mare Anguis in the northeast and other unnamed mare deposits inside impact craters or among massifs. Some large impact events (i.e., Cleomedes, Macrobius, Picard, and Proclus craters) reshaped the topography and mixed various materials, making it difficult to understand the origin and evolution of the basins only based on mineralogy.
Previous works have analyzed and classified mare units of the Crisium basin on the base of titanium and iron contents using Earth-based telescopic data or low-resolution remote data (i.e., Clementine Ultraviolet/Visible spectral data). Pieters and McCord (1976) [16] combined Earth-based spectral reflectance measurements and multispectral imagery of Mare Crisium with laboratory analyses of Luna 24 samples, then described the regional context and composition. Head et al. (1978) [17] identified three major basalt groups in the Crisium basin from the variations of titanium contents: Group I (Fe- and Mg-rich titaniferous basalts), Group II (very low titanium ferrobasalts), and Group III (low titanium ferrobasalts). The Group I is similar to the returned Luna 16 samples (containing high iron and low titanium basalts) from Mare Fecunditatis. They are only distributed in the southeast of Mare Crisium with more elevated topography and near the prominent impact craters in the western, probably representing the oldest mare unit in Mare Crisium. The Group II has a similarity to the returned Luna 24 samples, composed of very low-titanium (VLT) basalt. These basalts can be divided into two subgroups, of which subgroup A basalt occurs in the northwestern area of this basin, and subgroup B basalt is located at the outer region in the northeast of the Crisium basin. Group III is similar to the samples returned by the Apollo 12 mission, consisting of low-titanium (LT) basalt and mostly occurring in the southeast. Kodama et al. (2003) [18] used Clementine Ultraviolet/Visible multi-spectral data to map mare deposits of Mare Crisium referenced to the results of Head et al. (1978) [17]. Here, we will continue to refine the division of mare units and non-mare materials in the Crisium basin based on previous reports and new datasets.
The AMAs of Mare Crisium have been estimated using the crater size-frequency distribution (CSFD) technique [17,20]. Casella and Binder (1972) [21] and Olson and Wilhelms (1974) [22] suggested that the Imbrian-aged (Im) basalts filled the northern area of Mare Crisium, being the presence of a small independent unit of the Eratosthenian or Imbrian period. The easternmost area was defined as an Eratosthenian-aged or Imbrian-aged (EIm) unit, roughly related to the Group I basalt identified by Head et al. (1978) [17]. However, Olson and Wilhelms (1974) [22] indicated that the two areas in the east of the Picard crater could be EIm, and the southern area of the Cirsium basin is roughly Im. Hiesinger et al. (2011) [20] obtained a wide range of the AMAs from 2.71 Ga to 3.61 Ga in Mare Cirsium, concluding that the basalts in the northwestern area are younger than those in the southern. However, there is an absence of the AMA in the northwestern area near the border. Besides the remote sensing observations, Luna 24 mission returned lunar soil samples from Mare Cirsium, providing the ground truth of geochronology. The radioisotopic dating of Luna 24 samples from Papike and Vaniman (1977) [23] and Fernandez and Burgess (2005) [24] are 3.34–3.44 Ga and 2.52–3.45 Ga, representatively. However, the AMA in the Luna 24 site from Boyce and Johnson (1978) [25] was c.a. 3.5 Ga.
Geological maps of the Crisium basin have also been produced [17,26,27]. Sliz and Spudis (2016) [26] drew a more detailed geological map of the Crisium basin, containing two group units (the Crisium group and Imbrium group) with ten different geological units. The formation of this impact basin and the filling time of mare basalts have been roughly defined and subdivided on the basis of its topography. However, the classification of mare basalt units following chemical compositions and mineral variations is absent.
3. Data and Methods
3.1. Datasets
In this study, imaging and spectral datasets with higher spatial and spectral resolution were applied to demonstrate the topographic, compositional, and chronologic properties of the Crisium basin. Lunar Reconnaissance Orbiter Camera Wide Angle Camera (LROC-WAC) data with 100 m/pixel resolution were used for TiO2 content [28] and geological context characterization [29]. Highland units and impact craters for chronology were characterized using a digital elevation model (DEM) derived from the LOLA data with a spatial resolution of 60 m/pixel and the SELENE Terrain Camera (Kaguya-TC) data with a spatial resolution of 10 m/pixel [30]. SELENE Multiband Imager (Kaguya-MI) data were employed to derive the FeO content with a spatial resolution of 20 m/pixel in five visible bands [31]. The Mg# (molar 100 × Mg/(Mg + Fe)) map was derived from the Chang’E-1 Interference Imaging Spectrometer (CE1-IIM) data (200 m/pixel) [32]. The Th map generated from the Lunar Prospector gamma ray spectrometer has a resolution of 0.5°/pixel [33]. The M3 aboard Chandrayaan-1 is an imaging spectrometer with 85 spectral bands, ranging from 430 to 3000 nm with 20~40 nm spectral sampling at global mode [34,35]. One-track data used here were collected at the spatial resolution of ~140 m/pixel at ~100 km altitude during the OP1B period. Other 15-track data from the same optical period (OP2C) were collected at ~280 m/pixel spatial resolution when the spacecraft’s orbit was raised to ~200 km. The spectral data from the OP1B period were used because the 48.46~70.15°E region is not covered by the OP2C datasets. All M3 data in this study are listed in Table S1.
3.2. Topography and Geochronology
The Kaguya TC morning map data (~10 m/pixel) and LRO WAC global image (~100 m/pixel) were mosaicked to analyze topographic features in Mare Crisium. TC morning map was also used to determine the AMAs of major mare units using the CSFD measurements in the Crisium basin. Importantly, the division of mare units, crater identification, and the elimination of secondary impact craters can affect the accuracy of geochronology in different units. Based on the TC morning map (~10 m/pixel), we identified craters ≥400 m in diameter and measured their diameters. The potential impact crater chains and clusters have been excluded based on the topography and composition. The AMAs of the mare units within Mare Crisium were fitted by both cumulative and differential fit using the Craterstats 2.0 tool, with the lunar chronology function (CF) and production function (PF) from Michael and Neukum (2010) [36] and Michael et al. (2016) [37].
3.3. FeO Contents and MI RGB
3.4. Mineralogy
The M3 spectral data processing method includes mosaicking multi-camera images, RGB mapping, removal of the spectral continuum, data smoothing, spectral parameter estimation, and deconvolution of spectral absorption bands.
The downloaded M3 reflectance datasets were corrected (ground-truth and geographical correction) and then mosaicked into an entire image of the study area to facilitate the subsequent analyses. An integrated band depths (IBD) map [39,40] was derived and used to extract the spectra of the fresh small craters, which exposed the subsurface materials. The spectral data exceeding 2600 nm were eliminated considering the thermal emission effect [41], and the reflectance data in 430–2600 nm were smoothed using the Savitzky–Golay algorithm [42].
The continuum of reflectance spectra was automatically removed by the automatic detection of band centers (Figure 2) This approach is employed by Horgan et al. (2014) [43], who assumed an upper convex hull, finding a linear continuum with adjustable tie points around a 1000 nm absorption band and a 2000 nm absorption band. Continuum removal is performed by dividing the initial spectrum by the continuum interpolated spectrum. We searched for shoulders at 660~930 nm and 1109~2018 nm of a smoothed spectrum, which minimized the effect of instrument noise. Band centers (BC) were derived from the wavelength corresponding to the minimum value of the second-order polynomial fit of the smoothed spectrum between the band and band (m corresponding to the band with minimum reflectance, n = 5 at 1000 nm and n = 8 at 2000 nm). The IBD were also calculated by integrating the band depths (the reflectance to continuum ratio at the same band) [39,40]. The formulae of BC and IBD are listed in Table S2.
The Modified Gaussian Model (MGM) method developed by Sunshine and Pieters (1990, 1993, 1998) [44,45,46] was applied to analyze pyroxene absorption components in these spectra. The relative strengths of pyroxene absorption bands at 1000 nm and 2000 nm were derived. Pyroxene compositions can be estimated by calculating the ratio of high-Ca pyroxene and low-Ca pyroxene band strengths (HCP/LCP) [44,45,47]. An example is shown in Figure 2c to indicate the application of spectra parameter calculation and deconvolution of absorption bands using MGM.
4. Results
4.1. Geomorphology
4.1.1. Impact Craters
The Picard crater (Figure 3a) is the largest crater within the Crisium basin, with a diameter of 23.7 km. It exhibits complex features including central peaks and terraced walls. Secondary craters by ejecta are distributed surrounding the Picard crater. Besides post-mare craters, more than 14 pre-existing mare craters (ranging from ~2 km to ~34 km in diameter) are not completely erased. Most pre-existing ones are located on the basin rim, exhibiting a relatively higher elevation. Yerkes crater (Figure 3b) is one of the pre-existing mare craters that has an intact rim and multiple central peaks. Secondary crater chains and clusters (Figure 3c) are common in the Crisium basin. The primary crater ejecta is from Proclus and Giordano Bruno craters. In addition, discontinuous and secondary craters of Langrenus and Taruntius are also found in the central and eastern areas in the basin [48].
4.1.2. Impact Melts
Impact melting usually occurs during the formation of multi-rings impact basins and thousands of kilometers of impact melt products are produced [1,13,49,50]. Impact melt deposits surrounding the Crisium basin were recently recognized by Spudis and Sliz (2016) [13]. These impact melt deposits generally have the following characteristics: (1) rough and fractured surface; (2) different compositions with surrounding mare materials; and (3) the occurrence in the steep side of impact crater and near the ring of basin. An impact melt candidate (range up to ~10 km) in the western area near Yerkes crater has a rough and fractured surface (Figure 4a). We outlined this impact melt deposit with the white line. The RGB map (Figure 4b) of this impact melt deposit is also derived using IBD parameters based on M3 reflectance spectra. Blue-violet tone reflects the highland materials and light-yellow tone indicates abundant mafic minerals. This composition of impact melt deposit exhibits the affinity to the lunar highland materials, possibly related to the formation of multi-rings impact basins [1,13,49,50].
4.1.3. Wrinkle Ridges
Most wrinkle ridges are located near the Crisium basin rim, but some are in the center of the basin. The wrinkle ridges can be developed with a length of hundreds of kilometers and a width of a few kilometers. These wrinkle ridges are concentric in the center of the basin. The most common wrinkle ridges are linear (Figure 5a), but some special ridges are arcuate and nearly circular (Figure 5b). Interestingly, three linear and subparallel wrinkle ridges (WR1, WR2, and WR3, Figure 5a,c) have the preferred orientations (NW-SE trend) along the outer ring of the Crisium basin. This trend suggests that the wrinkle ridges formation in the eastern maria was affected by the ridges system of the Crisium basin.
4.1.4. Volcanic Cones
Lunar volcanic cones form from highly explosive eruptions with the release of large amounts of dissolved gas (called degassing) [51,52,53], when highly viscous magma rises to slowly fill the volcanic vent. Eleven cones were identified in the Crisium basin using the TC morning map and LOLA DEM data (Figure 6). Based on the classification scheme from Lawrence et al. (2013) [54], nine of these volcanic cones are identified as C-class because of their distinctive C-shaped characteristic, exhibiting a similarity to cones in the Marius Hills [54]. The representative C-class volcanic cone (Figure 6b) has a diameter of ~5.8 km and is topographically higher by about 200 m than its surroundings. We also observed that the point of highest topography along the rim of a C-class cone is roughly opposite the gap formed by lava leaving the vent area (Figure 6d). It is suggested that these C-class cones might have formed as follows [54,55]: (1) flows overtopped the rim and eroded the cone walls; (2) the cone was breached because of lava accumulation; (3) pre-existing topography. One of the two remaining has an intact structure of cone inside the Lick crater (Figure 6a). The other one is morphologically similar to the C-class cones, but it has two opposite gaps (Figure 6c).
4.1.5. Kipukas
Kipukas are islands or exposures of earlier units surrounded by mare basalts with a similar composition to highland materials in the Crisium basin (Figure 7).When the interior of the basin was filled with basaltic magma, the higher massifs were not covered by the lava flows. We identified numerous isolate or clustered kipukas located in the eastern region of the Crisium basin (Figure 7). These kipukas appear feldspathic-rich characteristic in composition (Figure 7b), distinct from the mafic-enriched mare basalts in the surrounding regions.
4.2. Geochemistry
4.2.1. TiO2, FeO, Mg#, and Th Contents
The TiO2, FeO, Mg#, and Th abundance maps in the Crisium basin are shown in Figure 8. The TiO2 content of highland materials is very low (<2 wt.% TiO2), while mare basalts have higher and various TiO2 contents (Figure 8a). The TiO2 content is higher (6~10 wt.% TiO2) in the eastern area, relatively moderate in the center (3~6 wt.% TiO2) and the northwestern area (2~3 wt.% TiO2), and there is low TiO2 content (<2 wt.%) in the northern and western maria. Moreover, the eastern rim of Picard crater exposes very-high-Ti (VHT) basalt (>9 wt.% TiO2). Interestingly, the easternmost area in the Crisium basin, especially around a small unnamed crater, has a TiO2 content higher than 9 wt.%. According to the results of Head et al. (1978) [17], the northwestern and southeastern maria in Mare Crisium can be roughly classified as two types including VLT and LT mare basalts. VHT mare basalts are distributed around the impact craters (i.e., Picard) and the eastern maria of the basin that is consistent with our results from the LROC-WAC data.
The materials from highlands and mare have distinct FeO contents (Figure 8b). The FeO content in the highlands is much lower than 10 wt.%. Highland massifs exhibit extremely low FeO content (<5 wt.%) around some fresh impact craters, such as Proclus, which is a Copernicus-age crater. The FeO content of mare basalts is widely variable. The eastern region of the Picard crater and the central and eastern maria of Mare Crisium are as high as 19~22 wt.% FeO. However, the rim in the northwestern area contains a medium FeO (13–16 wt.%) compared to the other maria. In general, the FeO concentration in the southeastern maria is higher than in the northwestern maria.
The Mg# map (Figure 8c) of this basin is also derived based on CE1-IIM data, to explore the differentiation processes and the cooling history of the basaltic melts from partly melted lunar mantle [56]. Importantly, basin rings exhibit unambiguous variations in Mg# content. The eastern and southern basin rings have lower Mg# (averaging 64) than the western and northern rings (averaging 78). The Crisium lava plains have roughly the same Mg# of 50, but ejecta materials are more magnesian (Mg# ~58).
Th map derived from Luna Prospector gamma ray data indicates that mare materials in the Crisium basin have relatively low Th contents (1.6~2.8 ppm) than the young basalts (>5 ppm Th) in the Procellarum KREEP Terrane (PKT) [57]. Thus, ejecta materials from the western basins (e.g., Mare Imbrium) can be indicated by higher Th contents than in the surrounding terrains in Mare Crisium. As shown in Figure 8d, the western-to-central maria and islanded region in the eastern maria have a relatively higher Th content (2.3~2.8 ppm) than the other mare plains (1.6~2 ppm) of the Crisium basin. In addition, relatively higher Th content is dominated in the western basin rings except a region near the Proclus crater.
4.2.2. Mineralogy
The M3 reflectance map at 750 nm is shown in Figure 9a. IBD parameters were calculated and shown in RGB colors (Figure 9b) to demonstrate the variations of mineral composition. IBD 1000 (red channel) implies pyroxene- and olivine-rich signatures or the mixture of mafic minerals. IBD 2000 (green channel) can be used to distinguish pyroxene and olivine minerals. Re750 (blue channel) represents the maturity and featureless spectra of common lunar minerals. The variations in mineral compositions and spectral characteristics of the Crisium basin and the surrounding terrain show that the feldspathic highland materials have a blue-purple color, and mare lava plains are mafic-enriched (red-green color). Numerous fresh impact craters appear in a light-yellow color, representing the enrichment of pyroxene components with diagnostic absorption bands both at 1000 nm and 2000 nm. The eastern maria exhibits a dark-red color in the RGB map, which indicates the enrichment of mafic minerals (especially olivine) in basalts because of the broad and pronounced 1000 nm absorption feature. The western maria appear blue-purple hue, indicating potential contamination from the ejecta of Proclus crater. However, the visible crater rays centered in the northern maria of the basin are much more greenish, probably representing the ejected feldspathic materials from impact events.
The lunar soils are highly weathered and exhibit very weak spectral absorptions. However, fresh deposition of more material by secondary craters could penetrate the weathered regolith of the lunar surface, excavate the fresh minerals in the lunar subsoil, and affect the spectral absorption bands in the surrounding terrains. We performed the spectral survey of 2439 small impact craters (<1 km in diameter and 2~4 pixels in M3 image data) in order to understand the spatial distribution of mineral composition in the Crisium basin and some surrounding areas. The MGM deconvolution analyses of reflectance spectrums of small impact craters were reported (Figure 2). Absorption features derived from the MGM deconvolution and the HCP/LCP ratios (Figure 9c) were obtained to improve the knowledge about mare basalts and feldspathic contamination in Mare Crisium. The spatial distribution of mineral components was also used to reflect the variations of pyroxene compositions (Figure 9d). The results suggest that the northeastern maria in the Crisium basin have very low HCP/LCP ratios (1.01~1.35). However, the eastern and southernmost maria are dominated by high-calcium pyroxene (HCP/LCP = 1.50~1.90). The middle and northwestern maria have relatively homogenous distributions of high-calcium pyroxene and low-calcium pyroxene with the HCP/LCP ratios of 1.36~1.50. The observation from Kaguya Gamma-Ray Spectrometer of Yamashita et al. (2012) indicated that the eastern mara basins (e.g., Mare Crisium) in the lunar nearside have much higher Ca abundances than the western mare units [58], consistent with the results from the spectral survey. It is suggested that mare basalts have the enrichment in Ca in the Crisium basin, implying the variation of calcium contents in the lunar mantle and potential HCP-rich mantle sources of Mare Crisium in comparison with Mare Imbrium and Oceanus Procellarum. Interestingly, the HCP/LCP ratios in basin rings and highlands materials display lower trends (HCP/LCP < 1.0) than those in mare units. However, some small mare patches among massifs and large craters filled by mare lava flows have abundant high-Ca pyroxene (HCP/LPC > 1.0) because of the sputter depositions of mare materials.
Apart from the HCP/LCP ratios, the BC I and BC II corresponding to the absorption bands near 1000 and 2000 nm, respectively, can be used to distinguish mare basalt with highland materials. Compared with natural pyroxenes [59,60] and synthetic pyroxenes [61], the absorption band centers from fresh small craters of the lunar highlands (navy points) are scattered in the Opx region and extend to Cpx trends (Figure 10a) distant from pure pyroxene types [59,60,61], implying the predominate low-Ca pyroxene and potential clinopyroxene (high-Ca pyroxene) in the surrounding highlands. Nonetheless, some low-Ca pyroxenes are detected in association with Crisium inner rings and massifs in the northeastern and western areas, but there is an absence of mare basalts. Significantly, high-Ca pyroxenes of the lunar highlands are mostly located in the surrounding regions adjacent to individual mare patches, such as Lacus Bonitatis, Mare Fecunditatis, and other unnamed mare units among massifs. These regions are contaminated by mafic-rich basalts ejected from impact events, composed of more abundant high-Ca pyroxenes.
On the contrary, M3 spectral band centers from fresh small craters of mare units (orange points) are adjoint to Cpx regions from terrestrial experiments (Figure 10a), but they are removed from synthetic pigeonites from Klima et al. (2011) [61]. It is suggested that mare basalts in Mare Crisium have abundant Cpx and minor Opx components. We note that these collected spectra in the highlands and mare units exhibit a higher BC I (~1000 nm) than synthetic Cpx and Opx when they have the same BC II (~ 2100 nm). This observation demonstrates the possibility of abundant high-Ca pyroxene in the Crisium basin or the occurrence of olivine. However, the IBDR and BC I diagram [62,63] excludes the possibility of olivine (Figure 10b) in the highlands and mare units, consistent with the reports of high calcium contents in the eastern mara basins of the lunar nearside [58]. The 3D scatter plot (Figure 10c) of spectral parameters (BC I, BC II, and IBDR) of small craters in four mare units (Im1, Im2, Im3, and EIm, defined in Section 4.2.3) reveals different trend. Ten representative spectra (Figure 10d,e) are selected to demonstrate the variations in mineralogy. Reflectance spectra (#1651 and #2158) of two small craters in the lunar highland exhibit high albedos and weak absorption bands of mafic minerals (Figure 10e). The details of spectral among mare units will be analyzed in the next section.
The olivine, assumed to be potential mantle materials, are detected on the rims of small craters (e.g., #722 spectrum in Figure 11), on massifs at the rim of Crisium (e.g., an exposure of Mg-olivine in Figure 11), and on mare both inside and outside of the Crisium basin. In these mare basalt filling units, small-body impact events were able to excavate and expose substrate olivine-rich materials in the lunar subsurface. In addition, we discovered some small fresh craters (e.g., #103 shown in Figure 11d) located at the ejecta blanket of the Picard crater, which are substrate materials excavated by the larger Picard crater. These spectra from newly exposed craters exhibited a broad, composite absorption feature centered near 1050 nm (Figure 11), having the greatest affinity to typical olivine spectra. In addition, some Ti-rich craters and their ejecta materials exhibit similar spectral characteristics to olivine (Figure S1).
4.2.3. Geologic Units
Part I: mare units
According to composition and the MI false-color composite image (Figure 12a), we divided mare units into four groups (Im1, Im2, Im3, and EIm). The AMAs of Crisium basalt units (9431 craters with ≥400 m in diameter, Table 1) were also reexamined using CSFD methods.
Im1 is the oldest mare unit (~3.74 Ga), located at the easternmost area with the relatively high relief in Mare Crisium, and is dominated by medium-to-high-Ti basalts with the range of 6~10 wt.% TiO2 content (up to 10 wt.% TiO2 in the surrounding regions around small craters, Figure 8a and Table 1). Compositionally, Im1 exhibits the relatively high FeO content (19~22 wt.%), low Mg# (~48), and low Th abundance (~1.7 ppm). The spectral parameters of Im1 show that BC I ranges from 975 to 1050 nm and HCP/LCP ratios have a range of 1.20~1.89 (Figure 9c), indicating the diversity of mafic minerals. The IBD map of M3 spectra (Figure 9a) reveals that Im1 contains abundant olivine because of its broad absorption center at 1000 nm. Two representative spectra (Im1 #349 and Im1 #369) are selected in Figure 10d,e which both exhibit distinct olivine absorption with a broad composite absorption at ~1050 nm. The CSFD measurements of Im1 indicate that it is an Imbrian-aged mare unit ( Ga), consistent with the result (~3.60 ± 0.5 Ga) of Boyce et al. (1978) [25]. In summary, it is suggested that Im1 could be shortly filled with Ti-rich basaltic lava flows after the basin formation (~100 Ma [64]).
Im2 is the largest maria plain (46,904 km2) in the Crisium basin (Figure 12 and Table 1). This geologic unit contains a medium TiO2 content (4~6 wt.%), medium-to-high FeO content (15~22 wt.%), low Mg# (~47.5), and low Th content (~1.95 ppm). It exhibits similar chemical composition to Im1, but they have different spectral characteristics. For most small craters in this mare unit, the BC I is estimated at a range of 983~1020 nm and HCP/LCP ratios (1.28~1.76) have the similarity to Im1. In the RGB map of M3 spectra (Figure 9b), the pyroxene is predominant mafic mineral in Im2 unit. Two representative spectra (Im2 #258 and Im2 #965, Figure 10e) exhibit a prominent absorption of pyroxene due to broad absorption bands around 1000 and 2000 nm. The AMAs () of this unit indicate an Imbrian-aged mare plain in accordance with radioactive dating of the returned Luna 24 samples (Table 1).
Im3 is Imbrian-aged mare unit () located at the northeastern maria with low TiO2 content (2~3 wt.%). Its geochronology is consistent with the results (3.50±0.1 Ga, Figure S2) of Boyce et al. (1977) [25]. The estimated spectral parameters in this unit have a similar range of BC I (984~1018 nm) and HCP/LCP (1.30~1.71) ratios to those in Im2 unit. Two representative spectra (Im3 #674 and Im3 #1468, Figure 10e) exhibit strong absorption depths both at 1000 nm and 2000 nm, like those in Im2. Compositionally, Im3 and Im2 have different TiO2 and Th contents. This unit exhibits lower TiO2 content, medium FeO content (13~16 wt.%), relatively higher Mg# (~52.5), and the highest Th content (~2.11 ppm) in Mare Crisium. The enrichment in Th indicates that Im3 unit could have been contaminated from impact events in Mare Imbrium.
EIm is the youngest mare unit, composed of Eratosthenian or Imbrian-aged basalts of with different compositions from older Imbrian-age basalts. This unit covers the northwestern area with very low TiO2 content (<2 wt.%), medium FeO content (13~16 wt.%), relatively high Mg# (~53), and low Th content (~1.88 ppm). Because of mineralogical heterogeneity, EIm displays more magnesian pyroxene than Imbrian-age basalts in Crisium basin. Specifically, the BC Ⅰ of this young unit has short-wavelength bands with a range of 970~1005 nm and HCP/LCP ratios (1.27~1.43). In addition, two representative spectra (EIm #406 and EIm #1108, Figure 10e) are selected to examine this trend. They exhibit similar absorption characteristics but more short-wavelength band centers than other mare units.
There is a mass of non-mare materials ejected beyond the continuous and discontinuous deposits from impact events in other regions, especially in Im2 and Im3. These regions in the Crisium basin were characterized by much lower TiO2 and FeO contents (Figure 9a,b) than surrounding mare materials, classified as ejecta units. In addition, their spectra of small fresh craters in these ejecta units have little variations compared with those in Im2 and Im3. It is that the ejecta materials only contaminated mare-basalt-rich surfaces in Mare Crisium on the Moon.
Chronologically, Boyce and Johnson (1978) [25] and Hiesinger et al. (2011) [20] have determined the ages of the Crisium basalts (Figure S2) with a range of 2.5~3.6 Ga and 2.71~3.61 Ga, representatively. The radioisotopic ages (3.34~3.44 Ga from Papike and Vaniman (1977) [23]; 2.52~3.45 Ga from Fernandez and Burgess (2005) [24]) of the returned Luna 24 samples have concordance with Im2 unit (3.49 Ga). In summary, our AMAs of mare units suggest that Mare Crisium is covered by Eratosthenian and Imbrian-aged mare basalts (2.49~3.74 Ga). Im1, Im2, and Im3 units are Imbrian-age basalts, and they have the similarity in mineral composition except for TiO2 content. EIm is Eratosthenian or Imbrian-aged mare unit with distinct chemical composition and mineralogy compared with mare plains of Crisium basin.
Part II: highland units
The highlands units have distinct topographic and spectral properties from mare plains, including more complex morphologies and denser craters. Sliz and Spudis (2016) [26] performed the division of highlands units, composed of two groups and six units (Crisium Group: Smooth Plains, Hilly and Furrowed Terrain, Platform Massifs and Irregular Massifs; Imbrium Group: Knobby Material and Lineated Basin Material) based on composition (Fe, Ti, and Th), morphology (rough or smooth), stratigraphic relations and other factors. We adopted the classification criteria from Sliz and Spudis (2016) [26] and sketched the extent of these highland units (Figure S3). In addition, the mineral characteristics derived from spectral data are used to reexamine the classification of geological units.
Crisium Group: This group can be divided into four members, predating the formation of Mare Crisium. It is the remnants from the ancient lunar crust and has been modified by late-stage secondary impact in large quantities (Figure S3a). Thus, these units are of Nectarian-age. Smooth Plains (NS) are discovered in flat terrain with a higher albedo and more crater densities in comparison with surrounding mare regions, usually between highland massifs and adjacent to mare unit. NS unit is feldspathic; however, mare region is mafic (Figure 9b). Hilly and Furrowed Terrain (NHF) is removed from the center of this basin and makes up most of the high proportion of lunar highlands areas, with a topographic relief. NHF stands as a transition unit between the low-lying, flat mare basalts and highland massif units, with relative high elevation and much lower FeO content (2~5 wt.%, Figure 8b) and HCP/LCP ratios (0~1, Figure 10) than surrounding mare regions. Platform Massifs (NP) and Irregular Massifs (NI) including islanded massifs (Figure S3b,c) are concentrated outside the mare units, as primary constituent on the inner ring of the Crisium basin. The NI unit is much higher in elevation and more rugged than NP unit. The massifs in two units are subjected to have been exposed to more weathering, resulting in weak ambiguous absorption spectra and highly degraded craters. The spectra of only a few freshest small craters can be used to estimate spectral parameters (averaging HCP/LCP < 0.5, Figure 9c,d).Two spectra (#1651 and #2158, Figure 10d) from highland massifs exhibit higher albedos, weaker absorption characteristics, and lower band centers than those in mare basalts. Interestingly, we identified olivine-bearing spectra from the rim of Crisium on the NP and NI members.
Imbrium Group: It consists of two members and exhibits relatively high Th content (>2.3 ppm), related to the northwestern Imbrium basin. Knobby Material (ImK) has hummocky structure, composed of irregular blocks and knobs. Lineated Basin Material (ImLB) is distinguished by northwest-southeast lineated terrain to the Imbrium structure and can also appear hummocky in places (Figure S3b). The HCP/LCP ratios of small craters in Imbrium group have a range of 1.01~1.35. It is suggested that ejecta materials from Mare Imbrium are similar to EIm unit in mineralogy, but this similarity is restricted to materials excavated by small craters. Compositionally, the surface composition is still Fe-poor (FeO: 5~8 wt.%, Figure 8b) and Mg-rich (Mg#: ~77, Figure 8c).
Part III: Crater units
According to previous geological maps and stratigraphic relations [2,65], we draw their rims and ejecta materials of craters with >5 km diameter. These craters are further classified on the basis of geochronology [2,26,27,65]: Pre-Nectarian craters and crater materials (pNc and pNcm), Nectarian craters and crater materials (Nc and Ncm), Imbrian craters and crater materials (Ic and Icm), Eratosthenian craters and crater materials (Ec and Ecm), and Copernican craters and crater materials (Cc and Ccm). Proclus (Copernican-age), as one of the youngest craters around the Crisium basin, excavated the materials with extremely low FeO content (FeO: <5 wt.%, Figure 8a) and low Th content (Th: 1.2~1.5 ppm, Figure 8d). We infer that these ejecta materials had contaminated the Im3 unit to a large extent.
5. Discussion
5.1. Mg-Suite Candidates in the Western Crisium Highlands?
The Mg-suite materials are an important constituent of the lunar crustal rocks, still retaining uncertain distribution in the lunar crust and the onset of secondary magmatism from density-driven mantle overturn [66]. However, Mg-suite rocks identified in Apollo samples [66,67,68,69] and remote observations [61,70] are restricted to the PKT on the Moon. The Crisium basin is removed from Mare Imbrium around 1000 km, potentially affected by ejecta materials of the Mg-suite-bearing PKT. The Mg# and Th maps of the western Crisium highland units (Mg# >75 and Th >2 ppm) suggest the contamination of Mg- and Th-rich materials in composition. Spectroscopically, pyroxene absorption bands around 1000 and 2000 nm in the western shift toward lower wavelength (BC I: ~930 nm and BC II: 1958 nm) than Fe-, Ca-bearing mare basalts, implying abundant Mg-rich member of pyroxene component [59,60,61]. The calculated HCP/LCP ratios (~0.47) further evidence the highly magnesian signature in this area. In terms of spectroscopy, composition, and mineralogy, we infer that the Mg- and Th-rich highland unit in the western Crisium basin can be Mg-suite candidates from the transport of cumulative basin ejecta in the PKT [66]. Alternatively, the olivine-rich outcrops among highland massifs on a localized scale in the western Crisium basin represent potential Mg-suite plutonic rocks [66]. The lines of evidence support the possibility of magnesian rocks around the Crisium basin. This highly magnesian signature (Mg# >70) in the western highland of Mare Crisium is also observed from LRO diviner data (Ma et al., 2021, [71]), implying the potential outcrops of magnesian rocks. Both Pieters et al. (2014) [72] and Sun et al. (2017) [73] detected the exposures of Mg-spinel lithologies within central peaks of craters in the northwestern highland area of Mare Crisium. The origin of Mg-spinel is possibly related to Mg-suite plutonism. Importantly, Corley et al. (2018) [11] detected the high-Mg olivine (Mg# ~90) outcrops on localized massifs at the southwestern rim of Crisium basin. In summary, the sporadic olivine-bearing outcrops on highland massifs or the western Crisium highlands represent potential Mg-suite pluton from large basin ejecta deposits in the PKT. It is here where future robotic and/or human missions can confidently prove this hypothesis of the occurrence of Mg-suite rocks around the western highlands of the Crisium basin.
5.2. Volcanic Events
The oldest recognizable mare basalt unit in the Crisium basin is Im1 (~3.74 Ga). At present, it is only exposed in the eastern maria with Fe- and Ti-rich compositions, probably corresponding with Group I (Fe- and Mg-rich titaniferous basalts) from Head et al. (1978) [17]. Interestingly, near some impact craters (Picard, Peirce and one small crater in Im1), their ejecta materials display more abundant titanium (>9 wt.% TiO2, Figure 8a). Owing to the elevation of the Im1 unit being higher than the inner depression, even small impact craters could excavate the subsurface high-Ti basalts. These Ti-rich ejecta materials were also discovered in Picard (~24 km) and Peirce (~19 km) craters in the western maria (Figure 8a), possibly representing the underlying more Ti-rich basalts excavated by impact events. Spectroscopically, we observed that these Ti-rich basalt materials have unambiguous olivine absorption, indicating the enrichment in olivine compared with other mare units. Their HCP/LCP ratios (averaging 1.57) of pyroxene composition indicate that these basalts have abundant calcic pyroxene. This olivine-rich high-Ti basalt phase suggests that the early magma sources in the lunar mantle had saturated in olivine with abundant ilmenite [74]. This type of basalt was also identified in Apollo 17 samples [75]. Neal and Taylor (1992) [74] proposed the hybridization source models that the mantle sources of these olivine-rich high-Ti basalts occurred small-scale convective-overturn events, then the early-stage olivine-rich cumulate layer selectively assimilated a proportion of the ilmenite- and clinopyroxene-bearing, late-stage cumulate layer [74,76]. Their parental magma likely assimilated a small amount of KREEP-rich material during its ascent through the lunar crust [77].
The Im2 unit has a medium TiO2 content (4~6 wt.%) and high FeO abundance (17~22 wt.%), corresponding with Group III (low titanium basalts) from Head et al. (1978) [17]. Volcanic cones in this unit (Figure 13) contain relatively Ti-rich materials in accordance with Im1, probably representing the remnants of pre-mare high-Ti volcanism. Besides similar geochronology (Im2: ~3.49 Ga; Im3: ~3.56 Ga), spectroscopy (BC I and BC II), and mineralogy (HCP/LCP) between Im2 and Im3, the Im3 unit exhibits lower TiO2 (2~3 wt.%) and FeO (13~16 wt.%) contents in composition than Im2, corresponding with Group II (very low titanium basalts) from Head et al. (1977) [17]. These observations suggest that this medium-to-low-Ti basalt phase could be produced by a more evolved Moon source rich in clinopyroxene [74]. However, Im3 displays higher Mg# than Im2, again demonstrating the heterogeneity of lunar mantle (see detailed petrological descriptions of Apollo 12 and Apollo 15 low-Ti basalt, [74]).
The EIm unit represents the youngest (~2.49 Ga) basaltic volcanism, characterized by very low TiO2 content (<2 wt.%) and relatively high Mg# (~53) in composition. Spectroscopically, EIm has a lower range of BC I (970~1005 nm) than Imbrian-aged mare units. The calculated HCP/LCP ratios (averaging 1.20) suggest the more abundant Opx than other mare members. These observations imply that EIm has distinct mantle source from low-Ti basalt in Im3. The mantle sources at varying depths of these VLT basalts (like Luna 24 VLT basalts, [74,78]) have been almost devoid of Fe-Ti oxide minerals and are dominated by early orthopyroxene-bearing cumulates [74].
In summary, the Imbrian-aged and Eratosthenian-aged basalts exhibit diverse composition, spectroscopy, mineralogy, and chronology. It is suggested that mare basalts in the Crisium basin have a variety of post-magma-generation processes, mantle sources, and varying depths.
5.3. Geological History
The sequence of geological events in the Crisium basin are composed of volcanic activity, tectonism, and impact cratering. A new geologic map was produced and the geological evolution history of the Crisium basin was interpreted as follows:
- (1)
- The Crisium impact event in the Late Heavy Bombardment (4.1~3.8 Ga) generated a Nectarian-aged multi-ring system. The highland units and some large impact craters (i.e., Cleomedes, Eimmart, Firmicus, and Condorcet craters) around the basin were simultaneously formed.
- (2)
- The earliest basaltic volcanism in the Crisium basin erupted around 3.74 Ga, forming the oldest middle-to-high-Ti mare basalts (6~10 wt.% TiO2) basalt filled most area of the Crisium basin during the Imbrian period about 100 Ma after the formation of the basin. The remanent topography in this epoch is presented by numerous volcanic cons. Simultaneously, Yerkes and Eimmart C craters were generated in the impact melt deposits along the basin rim; Macrobius, Alhazen and Hansen craters were formed among the highland massifs.
- (3)
- The subsequent low-to-middle basaltic volcanism occurred and flooded the center-to-western area (i.e., Im2 and Im3 unit) at ~3.5 Ga, superposed on the prominent high-Ti basalts.
- (4)
- The Eratosthenian-age basaltic volcanism erupted, and widespread lava flows filled the northern and eastern area of the Crisium basin. In this period, large craters Picard and Peirce were generated and the subsurface high-TiO2 basalt in the western area was excavated.
- (5)
- In the Copernican period, a wide range of volcanism has ceased, but the impact events continued to reshape the terrain and garden the surface materials of the Crisium basin. For example, projectile-contaminated ejecta and distal material transports from Proclus and other craters in the highlands could seriously overlap and complicate the mixing of local mare basalts (especially Im3 unit), characterized by very low-Ti (~1 wt.%) materials.
6. Conclusions
We systematically studied the detailed geologic context, including geomorphology, reflectance spectra, composition, mineralogy and chronology around the Crisium basin, producing a newly updated geological map of the Crisium basin. Four mare units of Mare Crisium were divided in terms of composition, including the oldest Imbrian-aged (3.74 Ga) mare unit (Im1) with Ti-, olivine-rich characteristic (TiO2: 6–10 wt.%), two Imbrian-aged mare units (Im2: 3.49 Ga and 4–6 wt.% TiO2; Im3: 3.56 Ga and 2–4 wt.% TiO2), and the youngest Eratosthenian or Imbrian-aged (~2.49 Ga) and very low-Ti (<2 wt.% TiO2) mare basalt (EIm). Olivine-rich materials are detected on the rim of small craters of mare shorelines, ejecta blanket of the large craters (e.g., Picard crater with 23.7 km diameter), and massifs in the southwestern highlands. Interestingly, olivine signatures were widely determined in the Ti-rich Im1 unit, implying the hybridization source in the lunar mantle with the occurrence of small-scale convective overturn. The major phase of low-Ti basaltic volcanism occurred c.a. 3.5 Ga, forming low-Ti to medium-Ti mare basalts (Im3 and Im2) overlying the pre-existing mare in the western area of the Crisium basin. In the period of Eratosthenian time, the very low-Ti basaltic lava flows flooded the northern and eastern areas (EIm) of Mare Cirsium and formed relatively Mg-richer basalts with abundant orthopyroxene-bearing pyroxene than Imbrian-aged mare members. It is suggested that the pyroxene compositions of basaltic volcanisms with time had a slight change (decrease of calcic content). Later, the projectile-contaminated ejecta and distal material transports from Proclus and other craters in the highlands could cover and complicate the mixing of local mare basalts (especially Im3 unit) in the Copernicus age. The observations of high-Mg olivine-bearing outcrops and the widespread distribution of highly magnesian materials (Mg# >70) in the western highland massifs of the Cirsium basin imply the potential occurrence of Mg-suite candidates, probably involving the horizontal transport of cumulative basin ejecta (i.e., Mare Imbrium) in the lunar Procellarum KREEP Terrane. We suggest that future lunar sampling and human exploration missions could answer this hypothesis.
Supplementary Materials
The following are available online at www.mdpi.com/article/10.3390/rs13234828/s1, Table S1: Information of Moon Mineralogy Mapper (M3) datasets used in this study; Table S2: The calculation formula and definition of spectral parameters used in this study; Figure S1 Four spectra from high-Ti regions are smoothed and continuum-removed. Figure S2: The chronology results of Mare Crisium from Boyce et al. (1978) and Hiesinger et al. (2011); Figure S3: The highland units are outlined in this study.
Author Contributions
Conceptualization, Z.L.; methodology, X.L., Z.L. and J.C.; software, X.L. and H.C.; validation, Z.L., X.F. and L.Q.; formal analysis, X.L., Z.L. and H.C.; investigation, X.L.; resources, Z.L.; data curation, X.L. and J.C.; writing—original draft preparation, Z.L. and X.L.; writing—review and editing, Z.L., H.C., X.F., L.Q. and J.C.; visualization, X.L.; supervision, Z.L.; project administration, Z.L.; funding acquisition, Z.L. All authors have read and agreed to the published version of the manuscript.
Funding
This research was funded by National Natural Science Foundation of China, grant number 41972322, 11941001, U1931211; Pre-research project on Civil Aerospace Technologies funded by China National Space Administration (CNSA), grant number D020102; National Key Research and Development Program of China, grant number 2020YFE0202100, 2019YFE0123300; Natural Science Foundation of Shandong Province, grant number ZR2019MD008; Key Research Program of Frontier Sciences, CAS, grant number QYZDY-SSW-DQC028; Strategic Priority Research Program of Chinese Academy of Sciences, grant number XDB 41000000.
Institutional Review Board Statement
Not applicable.
Informed Consent Statement
Not applicable.
Data Availability Statement
Not applicable.
Acknowledgments
We would like to thank the editors and anonymous reviewers for their constructive suggestion, which significantly improve the quality of this work. This is the SDU-CPS publication #92.
Conflicts of Interest
The authors declare no conflict of interest.
References
- Spudis, P.D. The Geology of Multi-Ring Impact Basins: The Moon and Other Planets; Cambridge University Press: Cambridge, UK, 2005; ISBN 9780521619233. [Google Scholar]
- Wilhelms, D.E.; McCauley, J.F.; Trask, N.J. The Geologic History of the Moon; United States Geological Survey: Washington, DC, USA, 1987; p. 1348. [Google Scholar]
- Head, J.W.; Wilson, L. Lunar mare volcanism: Stratigraphy, eruption conditions, and the evolution of secondary crusts. Geochim. Cosmochim. Acta 1992, 56, 2155–2175. [Google Scholar] [CrossRef]
- Head, J.W. Lunar volcanism in space and time. Rev. Geophys. 1976, 14, 265–300. [Google Scholar] [CrossRef] [Green Version]
- Neal, C.R.; Taylor, L.A. Metasomatic products of the lunar magma ocean: The role of KREEP dissemination. Geochim. Cosmochim. Acta 1989, 53, 529–541. [Google Scholar] [CrossRef]
- Wieczorek, M.A.; Neumann, G.A.; Nimmo, F.; Kiefer, W.S.; Taylor, G.J.; Melosh, H.J.; Phillips, R.J.; Solomon, S.C.; Andrews-Hanna, J.C.; Asmar, S.W.; et al. The crust of the moon as seen by GRAIL. Science 2013, 339, 671–675. [Google Scholar] [CrossRef] [PubMed]
- Thiessen, F.; Besse, S.; Staid, M.; Hiesinger, H. Mapping lunar mare basalt units in mare Imbrium as observed with the Moon Mineralogy Mapper (M3). Planet. Space Sci. 2014, 104, 244–252. [Google Scholar] [CrossRef]
- Kaur, P.; Bhattacharya, S.; Chauhan, P.; Ajai, P.; Kumar, A.K. Mineralogy of Mare Serenitatis on the near side of the moon based on Chandrayaan-1 moon mineralogy mapper (M3) observations. Icarus 2013, 222, 137–148. [Google Scholar] [CrossRef]
- Kramer, G.Y.; Jaiswal, B.; Hawke, B.R.; Ohman, T.; Giguere, T.A.; Johnson, K. The basalts of Mare Frigoris. J. Geophys. Res. Planets 2015, 120, 1646–1670. [Google Scholar] [CrossRef] [Green Version]
- Fassett, C.I.; Head, J.W.; Kadish, S.J.; Mazarico, E.; Neumann, G.A.; Smith, D.E.; Zuber, M.T. Lunar impact basins: Stratigraphy, sequence and ages from superposed impact crater populations measured from Lunar Orbiter Laser Altimeter (LOLA) data. J. Geophys. Res. Space Phys. 2012, 117. [Google Scholar] [CrossRef]
- Corley, L.M.; McGovern, P.J.; Kramer, G.Y.; Lemelin, M.; Trang, D.; Gillis-Davis, J.J.; Taylor, G.J.; Powell, K.E.; Kiefer, W.; Wieczorek, M.; et al. Olivine-bearing lithologies on the Moon: Constraints on origins and transport mechanisms from M3 spectroscopy, radiative transfer modeling, and GRAIL crustal thickness. Icarus 2018, 300, 287–304. [Google Scholar] [CrossRef]
- Yamamoto, S.; Nakamura, R.; Matsunaga, T.; Ogawa, Y.; Ishihara, Y.; Morota, T.; Hirata, N.; Ohtake, M.; Hiroi, T.; Yokota, Y.; et al. Possible mantle origin of olivine around lunar impact basins detected by SELENE. Nat. Geosci. 2010, 3, 533–536. [Google Scholar] [CrossRef]
- Spudis, P.D.; Sliz, M.U. Impact melt of the lunar Crisium multiring basin. Geophys. Res. Lett. 2017, 44, 1260–1265. [Google Scholar] [CrossRef]
- Runyon, K.; Moriarty, D., III; Denevi, B.; Greenhagen, G.; Morgan, K.; Young, B.; Cohen, C.; van der Bogert, H.; Hiesinger, H.; Jozwiak, L.M. Impact melt facies in the moon’s crisium basin: Identifying, characterizing, and future radiogenic dating. J. Geophys. Res. Planets 2020, 125, e2019JE006024. [Google Scholar] [CrossRef] [PubMed] [Green Version]
- Hartmann, W.K.; Wood, C.A. Moon: Origin and evolution of multi-ring basins. Earth Moon Planets 1971, 3, 3–78. [Google Scholar] [CrossRef]
- Pieters, C.M.; Staid, M.I.; Fischer, E.M.; Tompkins, S.; He, G. A sharper view of impact craters from clementine data. Science 1994, 266, 1844–1848. [Google Scholar] [CrossRef] [PubMed] [Green Version]
- Head, J.W.; Adams, J.B.; McCord, T.; Pieters, C.; Zisk, S. Regional stratigraphy and geologic history of mare crisium. In Mare Crisium: The View from Luna 24; Pergamon Press: New York, NY, USA, 1978; pp. 43–74. [Google Scholar]
- Kodama, S.; Yamaguchi, Y. Lunar mare volcanism in the eastern nearside region derived from Clementine UV/VIS data. Meteorit. Planet. Sci. 2003, 38, 1461–1484. [Google Scholar] [CrossRef]
- Nelson, D.; Koeber, S.; Daud, K.; Robinson, M.; Watters, T.; Banks, M.; Williams, N. Mapping lunar maria extents and lobate scarps using lroc image products. In Proceedings of the 45th Lunar and Planetary Science Conference, The Woodlands, TX, USA, 17–21 March 2014; p. 2861. [Google Scholar]
- Hiesinger, H.; van der Bogert, C.; Reiss, D.; Robinson, M. Crater size-frequency distribution measurements of mare crisium. In Proceedings of the Lunar and Planetary Science Conference, The Woodlands, TX, USA, 7–11 March 2011; p. 2179. [Google Scholar]
- Casella, C.; Binder, A. Geologic Map of the Cleomedes Quadrangle of the Moon; US Geological Survey Report 707; US Geological Survey: Reston, VA, USA, 1972. [Google Scholar]
- Olson, A.; Wilhelms, D.J. USGS Open-File Report; U.S. Geological Survey: Flagstaff, AZ, USA, 1974. [Google Scholar]
- Vaniman, D.T.; Papike, J.J. Ferrobasalts from Mare Crisium: Luna 24. Geophys. Res. Lett. 1977, 4, 497–500. [Google Scholar] [CrossRef]
- Fernandes, V.A.; Burgess, R. Volcanism in Mare Fecunditatis and Mare Crisium: Ar-Ar age studies. Geochim. Cosmochim. Acta 2005, 69, 4919–4934. [Google Scholar] [CrossRef]
- Boyce, J.; Johnson, D. Ages of flow units in mare crisium based on crater density. In Proceedings of the Lunar and Planetary Science Conference, Houston, TX, USA, 14–18 March 1977; pp. 3495–3502. [Google Scholar]
- Sliz, M.; Spudis, P. New geological map of the lunar crisium basin. In Proceedings of the Lunar and Planetary Science Conference, The Woodlands, TX, USA, 21–25 March 2016; p. 1678. [Google Scholar]
- Wilhelms, D.E.; McCauley, J.F. Geologic Map of the Near Side of the Moon; US Geological Survey: Washington, DC, USA, 1971. [Google Scholar]
- Sato, H.; Robinson, M.S.; Lawrence, S.J.; Denevi, B.W.; Hapke, B.; Jolliff, B.L.; Hiesinger, H. Lunar mare TiO2 abundances estimated from UV/Vis reflectance. Icarus 2017, 296, 216–238. [Google Scholar] [CrossRef]
- Robinson, M.S.; Brylow, S.M.; Tschimmel, M.; Humm, D.; Lawrence, S.J.; Thomas, P.C.; Denevi, B.; Bowman-Cisneros, E.; Zerr, J.; Ravine, M.A.; et al. Lunar reconnaissance orbiter camera (LROC) instrument overview. Space Sci. Rev. 2010, 150, 81–124. [Google Scholar] [CrossRef]
- Barker, M.; Mazarico, E.; Neumann, G.; Zuber, M.; Haruyama, J.; Smith, D. A new lunar digital elevation model from the Lunar Orbiter Laser Altimeter and SELENE Terrain Camera. Icarus 2016, 273, 346–355. [Google Scholar] [CrossRef] [Green Version]
- Otake, H.; Ohtake, M.; Hirata, N. Lunar iron and titanium abundance algorithms based on selene (kaguya) multiband imager data. In Proceedings of the Lunar and Planetary Science Conference, Houston, TX, USA, 14–18 March 2012; p. 1905. [Google Scholar]
- Ling, Z.; Zhang, J.; Liu, J.; Zhang, W.; Zhang, G.; Liu, B.; Ren, X.; Mu, L.; Liu, J.; Li, C. Mapping mgo and mg-number with chang’e-1 iim data. In Proceedings of the EPSCDPS Joint Meeting, Nantes, France, 2–7 October 2011; pp. 936–942. [Google Scholar]
- Prettyman, T.H.; Hagerty, J.J.; Elphic, R.C.; Feldman, W.C.; Lawrence, D.J.; McKinney, G.W.; Vaniman, D.T. Elemental composition of the lunar surface: Analysis of gamma ray spectroscopy data from Lunar Prospector. J. Geophys. Res. Space Phys. 2006, 111, 111. [Google Scholar] [CrossRef]
- Cheek, L.C.; Hanna, K.L.D.; Pieters, C.M.; Head, J.W.; Whitten, J.L. The distribution and purity of anorthosite across the Orientale basin: New perspectives from Moon Mineralogy Mapper data. J. Geophys. Res. Planets 2013, 118, 1805–1820. [Google Scholar] [CrossRef]
- Green, R.O.; Pieters, C.; Mouroulis, P.; Eastwood, M.; Boardman, J.; Glavich, T.; Isaacson, P.; Annadurai, M.; Besse, S.; Barr, D.; et al. The Moon Mineralogy Mapper (M3) imaging spectrometer for lunar science: Instrument description, calibration, on-orbit measurements, science data calibration and on-orbit validation. J. Geophys. Res. Space Phys. 2011, 116. [Google Scholar] [CrossRef] [Green Version]
- Michael, G.; Neukum, G. Planetary surface dating from crater size–frequency distribution measurements: Partial resurfacing events and statistical age uncertainty. Earth Planet. Sci. Lett. 2010, 294, 223–229. [Google Scholar] [CrossRef]
- Michael, G.; Kneissl, T.; Neesemann, A. Planetary surface dating from crater size-frequency distribution measurements: Poisson timing analysis. Icarus 2016, 277, 279–285. [Google Scholar] [CrossRef]
- Lemelin, M.; Lucey, P.G.; Song, E.; Taylor, G.J. Lunar central peak mineralogy and iron content using the Kaguya Multiband Imager: Reassessment of the compositional structure of the lunar crust. J. Geophys. Res. Planets 2015, 120, 869–887. [Google Scholar] [CrossRef]
- Cheek, L.; Pieters, C.; Boardman, J.; Clark, R.; Combe, J.; Head, J.; Isaacson, P.; McCord, T.; Moriarty, D.; Nettles, R.P. Goldschmidt crater and the moon’s north polar region: Results from the moon mineralogy mapper (M3). J. Geophys. Res. Planets 2011, 116. [Google Scholar] [CrossRef] [Green Version]
- Clark, R.N.; Roush, T.L. Reflectance spectroscopy: Quantitative analysis techniques for remote sensing applications. J. Geophys. Res. Space Phys. 1984, 89, 6329–6340. [Google Scholar] [CrossRef]
- Li, S.; Milliken, R.E. An empirical thermal correction model for Moon Mineralogy Mapper data constrained by laboratory spectra and Diviner temperatures. J. Geophys. Res. Planets 2016, 121, 2081–2107. [Google Scholar] [CrossRef] [Green Version]
- Savitzky, A.; Golay, M.J.E. Smoothing and differentiation of data by simplified least squares procedures. Anal. Chem. 1964, 36, 1627–1639. [Google Scholar] [CrossRef]
- Horgan, B.; Cloutis, E.A.; Mann, P.; Bell, J.F. Near-infrared spectra of ferrous mineral mixtures and methods for their identification in planetary surface spectra. Icarus 2014, 234, 132–154. [Google Scholar] [CrossRef] [Green Version]
- Sunshine, J.; Pieters, C.M.; Pratt, S.F. Deconvolution of mineral absorption bands: An improved approach. J. Geophys. Res. Space Phys. 1990, 95, 6955–6966. [Google Scholar] [CrossRef] [Green Version]
- Sunshine, J.; Pieters, C.M. Estimating modal abundances from the spectra of natural and laboratory pyroxene mixtures using the modified Gaussian model. J. Geophys. Res. Space Phys. 1993, 98, 9075–9087. [Google Scholar] [CrossRef] [Green Version]
- Sunshine, J.; Pieters, C.M. Determining the composition of olivine from reflectance spectroscopy. J. Geophys. Res. Space Phys. 1998, 103, 13675–13688. [Google Scholar] [CrossRef]
- Ling, Z.; Qiao, L.; Liu, C.; Cao, H.; Bi, X.; Lu, X.; Zhang, J.; Fu, X.; Li, B.; Liu, J.J.P.; et al. Composition, mineralogy and chronology of mare basalts and non-mare materials in von kármán crater: Landing site of the Chang’E−4 mission. Planet. Space Sci. 2019, 179, 104741. [Google Scholar] [CrossRef]
- Maxwell, T.A.; El-Baz, F. The nature of rays and sources of highland material in mare crisium. In Proceedings of the Mare Crisium: The View from Luna 24, Houston, TX, USA, 1–3 December 1978; pp. 89–103. [Google Scholar]
- Dence, M.R. Impact melts. J. Geophys. Res. 1971, 76, 5552–5565. [Google Scholar] [CrossRef]
- Spudis, P.D. The Geology of Multi-Ring Impact Basins; Cambridge University Press: Cambridge, UK, 1993; ISBN 9780521261036. [Google Scholar] [CrossRef]
- Head, J.W.; Wilson, L. Lunar linear rilles as surface manifestations of dikes: Predictions and observations. In Proceedings of the Lunar and Planetary Science Conference, Houston, TX, USA, 13–17 March 1996. [Google Scholar]
- Lena, R.; Wöhler, C.; Phillips, J.; Wirths, M.; Bregante, M.T. Lunar domes in the Doppelmayer region: Spectrophotometry, morphometry, rheology, and eruption conditions. Planet. Space Sci. 2007, 55, 1201–1217. [Google Scholar] [CrossRef]
- Weitz, C.M.; Head, J.W., III. Spectral properties of the marius hills volcanic complex and implications for the formation of lunar domes and cones. J. Geophys. Res. Planets 1999, 104, 18933–18956. [Google Scholar] [CrossRef]
- Lawrence, S.J.; Stopar, J.D.; Hawke, B.R.; Greenhagen, B.T.; Cahill, J.T.S.; Bandfield, J.L.; Jolliff, B.L.; Denevi, B.W.; Robinson, M.S.; Glotch, T.D.; et al. LRO observations of morphology and surface roughness of volcanic cones and lobate lava flows in the Marius Hills. J. Geophys. Res. Planets 2013, 118, 615–634. [Google Scholar] [CrossRef]
- Harwood, R.D. Cinder Cone Breaching Events at Strawberry and O’neill Craters, San Francisco Volcanic Field, Arizona. Master’s Thesis, Northern Arizona University, Flagstaff, AZ, USA, 1989. [Google Scholar]
- Ohtake, M.; Takeda, H.; Mastunaga, T.; Yokota, Y.; Haruyama, J.; Morota, T.; Yamamoto, S.; Ogawa, Y.; Hiroi, T.; Karouji, Y. Primitive farside highland materials detected by mg number. In Proceedings of the Lunar and Planetary Science Conference, The Woodlands, TX, USA, 19–23 March 2012; p. 1977. [Google Scholar]
- Jolliff, B.L.; Gillis, J.J.; Haskin, L.A.; Korotev, R.L.; Wieczorek, M. Major lunar crustal terranes: Surface expressions and crust-mantle origins. J. Geophys. Res. Space Phys. 2000, 105, 4197–4216. [Google Scholar] [CrossRef] [Green Version]
- Yamashita, N.; Gasnault, O.; Forni, O.; D’Uston, C.; Reedy, R.; Karouji, Y.; Kobayashi, S.; Hareyama, M.; Nagaoka, H.; Hasebe, N.; et al. The global distribution of calcium on the Moon: Implications for high-Ca pyroxene in the eastern mare region. Earth Planet. Sci. Lett. 2012, 353–354, 93–98. [Google Scholar] [CrossRef]
- Adams, J.B. Visible and near-infrared diffuse reflectance spectra of pyroxenes as applied to remote sensing of solid objects in the solar system. J. Geophys. Res. Space Phys. 1974, 79, 4829–4836. [Google Scholar] [CrossRef]
- Cloutis, E.A.; Gaffey, M.J. Pyroxene spectroscopy revisited: Spectral-compositional correlations and relationship to geothermometry. J. Geophys. Res. Space Phys. 1991, 96, 22809–22826. [Google Scholar] [CrossRef]
- Klima, R.L.; Dyar, M.D.; Pieters, C.M. Near-infrared spectra of clinopyroxenes: Effects of calcium content and crystal structure. Meteorit. Planet. Sci. 2011, 46, 379–395. [Google Scholar] [CrossRef]
- Gaffey, M.J.; Bell, J.F.; Brown, R.; Burbine, T.H.; Piatek, J.L.; Reed, K.L.; Chaky, D.A. Mineralogical variations within the S-Type asteroid class. Icarus 1993, 106, 573–602. [Google Scholar] [CrossRef]
- Varatharajan, I.; Srivastava, N.; Murty, S.V. Mineralogy of young lunar mare basalts: Assessment of temporal and spatial heterogeneity using M3 data from Chandrayaan-1. Icarus 2014, 236, 56–71. [Google Scholar] [CrossRef]
- Van der Bogert, C.; Hiesinger, H.; Spudis, P. The age of the crisium impact basin. New Views Moon 2 Eur. 2017, 1988, 6009. [Google Scholar]
- Wilhelms, D.; El-Baz, F. Geologic Map of the East Side of the Moon; US Geological Survey: Reston, VA, USA, 1977. [Google Scholar]
- Shearer, C.K.; Elardo, S.; Petro, N.; Borg, L.E.; McCubbin, F.M. Origin of the lunar highlands Mg-suite: An integrated petrology, geochemistry, chronology, and remote sensing perspective. Am. Miner. 2014, 100, 294–325. [Google Scholar] [CrossRef]
- Goodrich, C.A.; Taylor, G.J.; Keil, K.; Kallemeyn, G.W.; Warren, P.H. Alkali norite, troctolites, and VHK mare basalts from breccia 14304. J. Geophys. Res. Space Phys. 1986, 91, 305–318. [Google Scholar] [CrossRef]
- Warren, P.H.; Taylor, G.J.; Keil, K.; Marshall, C.; Wasson, J. Foraging westward for pristine nonmare rocks-complications for petrogenetic models. In Proceedings of the Lunar and Planetary Science Conference, Houston, TX, USA, 15–19 March 1982; pp. 21–40. [Google Scholar]
- Warren, P.H.; Wasson, J.T. Further foraging for pristine nonmare rocks-correlations between geochemistry and longitude. In Proceedings of the Lunar and Planetary Science Conference, Houston, TX, USA, 17–21 March 1980; pp. 431–470. [Google Scholar]
- Klima, R.; Cahill, J.; Hagerty, J.; Lawrence, D. Remote detection of magmatic water in Bullialdus Crater on the Moon. Nat. Geosci. 2013, 6, 737–741. [Google Scholar] [CrossRef]
- Ma, M.; Li, B.; Chen, S.; Lu, T.; Lu, P.; Lu, Y.; Jin, Q. Global estimates of lunar surface chemistry derived from LRO diviner data. Icarus 2021, 371, 114697. [Google Scholar] [CrossRef]
- Pieters, C.M.; Hanna, K.D.; Cheek, L.; Dhingra, D.; Prissel, T.; Jackson, C.; Moriarty, D.; Parman, S.; Taylor, L.A. The distribution of Mg-spinel across the Moon and constraints on crustal origin. Am. Miner. 2014, 99, 1893–1910. [Google Scholar] [CrossRef]
- Sun, Y.; Li, L.; Zhang, Y. Detection of Mg-spinel bearing central peaks using M 3 images: Implications for the petrogenesis of Mg-spinel. Earth Planet. Sci. Lett. 2017, 465, 48–58. [Google Scholar] [CrossRef]
- Neal, C.R.; Taylor, L.A. Petrogenesis of mare basalts: A record of lunar volcanism. Geochim. Cosmochim. Acta 1992, 56, 2177–2211. [Google Scholar] [CrossRef]
- Green, D.; Ringwood, A.; Hibberson, W.; Ware, N. Experimental petrology of apollo 17 mare basalts. In Proceedings of the Lunar and Planetary Science Conference, Houston, TX, USA, 17–21 March 1975; Volume 6, pp. 871–893. [Google Scholar]
- Snyder, A.G.; Taylor, A.L.; Neal, C.R. A chemical model for generating the sources of mare basalts: Combined equilibrium and fractional crystallization of the lunar magmasphere. Geochim. Cosmochim. Acta 1992, 56, 3809–3823. [Google Scholar] [CrossRef]
- Wang, Y.; Hsu, W.; Guan, Y.; Li, X.; Li, Q.; Liu, Y.; Tang, G. Petrogenesis of the Northwest Africa 4734 basaltic lunar meteorite. Geochim. Cosmochim. Acta 2012, 92, 329–344. [Google Scholar] [CrossRef]
- Grove, T.L.; Vaniman, D. Experimental petrology of very low TI/VLT/basalts. In Mare Crisium: The View from Luna 24; Pergamon Press: New York, NY, USA, 1978; pp. 445–471. [Google Scholar]
Figure 1.
Location of the Crisium basin. (a) LROC WAC image showing the geological features (e.g., impact craters and mare plains). Mare boundaries are outlined from Nelson et al. (2014) [19]. The white boxes represent the locations of other Figures 2–7. (b) Topography of the Crisium basin. This image is an LOLA DEM data superposed on the LROC WAC map.

Figure 2.
An example for M3 spectral data processing. (a) The original spectrum (orange crosses) was smoothed (green line) and then shoulders (black vertical bars) were automatically detected. The linear segments connect the modeled continuum (red line). The spectrum after removing the continuum (red line of y = 1) is shown in (b) as orange crosses. The second-order polynomial fit curves (navy line) were used to calculate absorption band centers (vertical dotted lines) around 1000 and 2000 nm. (c) The MGM method employed the deconvolution of pyroxene absorption bands. From top to bottom: Root-mean-square (RMS) error (magenta line), continuum (red line), Gaussian absorptions (blue lines), continuum-removed spectrum (origin crosses), fitting spectrum (black line), and absorption bands of pyroxene (blue arrows).

Figure 3.
Typical impact craters in the Crisium basin. (a) The largest impact crater (~24 km in diameter) in this region: Picard Crater. (b) Yerkes Crater is a pre-mare crater with multiple central peaks. The wall and rim of Yerkes Crater remain intact, and the floor was filled with subsequent mare basalts. Two volcanic vents (green arrow) are identified near Yerkes Crater. (c) Secondary crater clusters are outlined by orange line. The sky-blue dashed lines show the ejecta from Proclus crater; wrinkle ridges near craters were also denoted using yellow dashed lines.
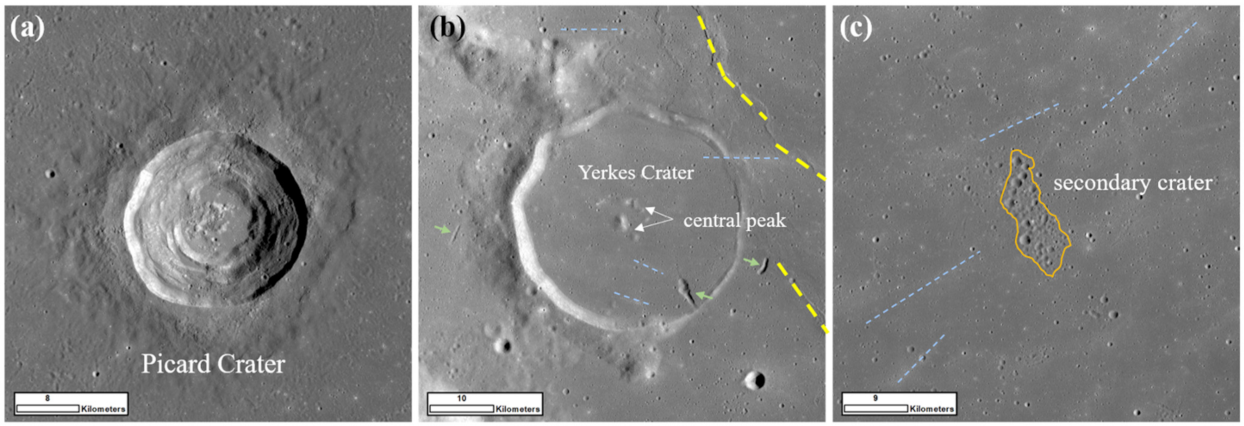
Figure 4.
(a) A representative impact melt deposit in the western rim of the Crisium basin. This impact melt candidate is 10 km in diameter with a rough surface structure. The white lines denote this impact melt deposit. (b) The RGB map based on M3 reflectance data indicates that this deposit has a feldspathic-rich signature. Red: IBD1000; green: IBD2000; blue: Re 750.
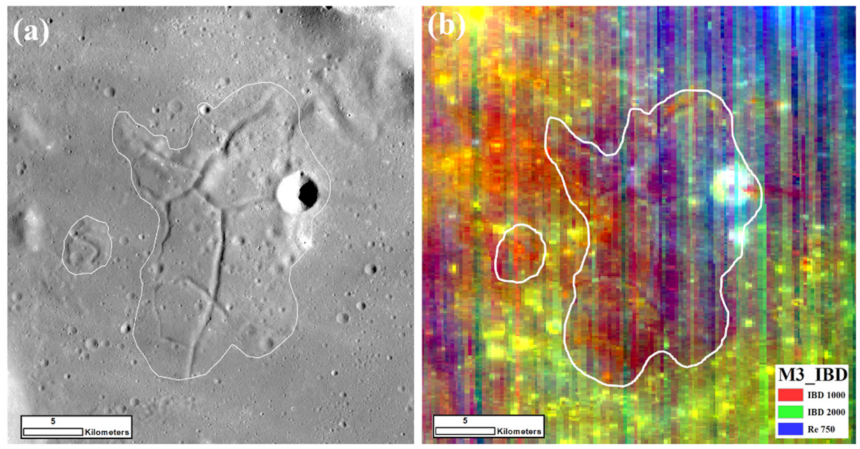
Figure 5.
Wrinkle ridges in the Crisium basin. (a) Linear ridges and (b) arc-shaped ridges. The yellow dashed lines denoted the orientations of wrinkle ridges and sky-blue dashed line shows the restricted ejecta orientation. AA’ shows the location of the profile in Figure 5c. (c) The topographic profile of the blue line AA’.
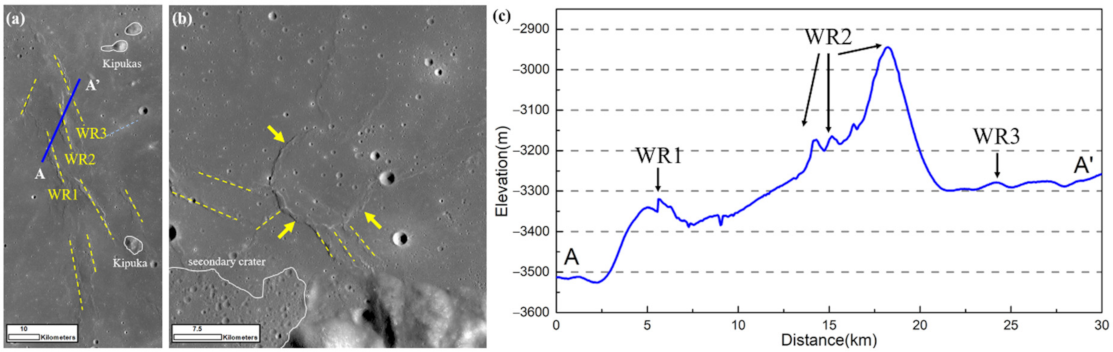
Figure 6.
Volcanic cones in the Crisium basin. (a) An intact volcanic cone inside the Lick crater has a subcircular summit crater without the well-developed gap. (b) A typical C-class cone with a diameter of 5.8 km. 9 C-class domes were found in this basin. (c) A special type of cone is morphologically similar to the C-class cone, but there are two opposite gaps. (d) Topography of a C-class cone in Figure 6b. A total of 11 volcanic cones were highlighted in the geological map shown in Figure 13. The white arrows point out the locations of cons in the Crisium basin.
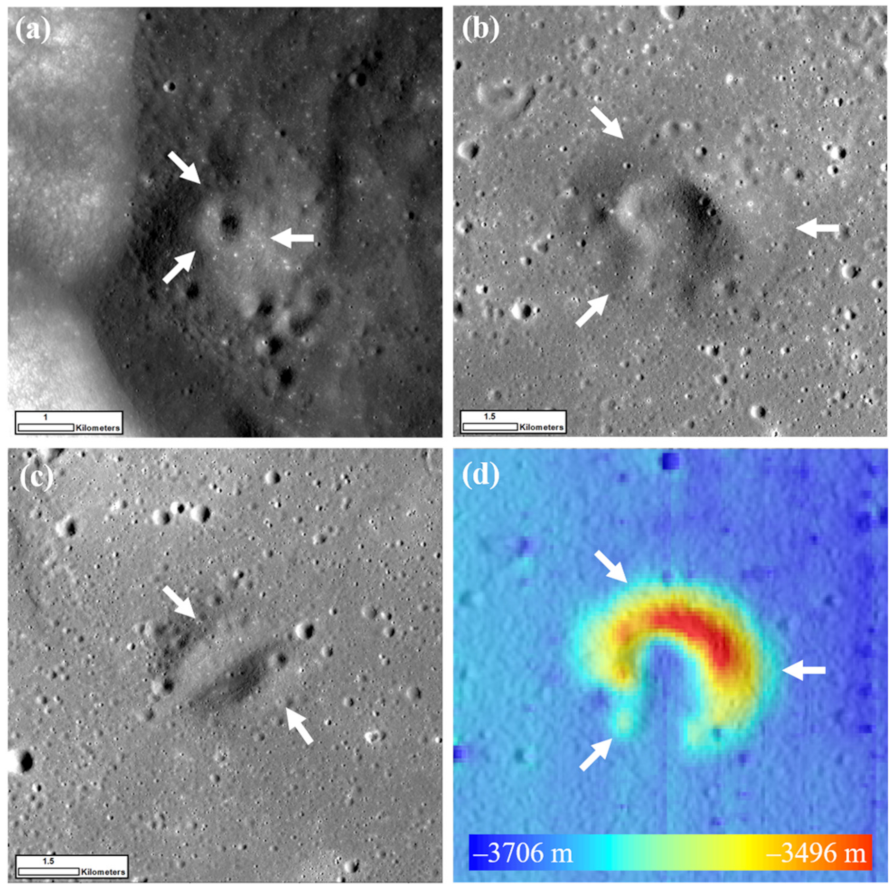
Figure 7.
(a) The clustered kipukas (white polygons) in the eastern maria of the Crisium basin. The white arrows point out three pre-mare craters. A volcanic vent with a length of 3.5 km is marked (green arrow). (b) The RGB map of clustered kipukas in Figure 7a suggests potential highland materials.

Figure 8.
Maps of the (a) TiO2 abundance, (b) FeO abundance, (c) Mg#, and (d) Th content around the Crisium basin. The base map is a LOLA DEM. The black lines represent the boundaries of mare and highlands.
Figure 8.
Maps of the (a) TiO2 abundance, (b) FeO abundance, (c) Mg#, and (d) Th content around the Crisium basin. The base map is a LOLA DEM. The black lines represent the boundaries of mare and highlands.
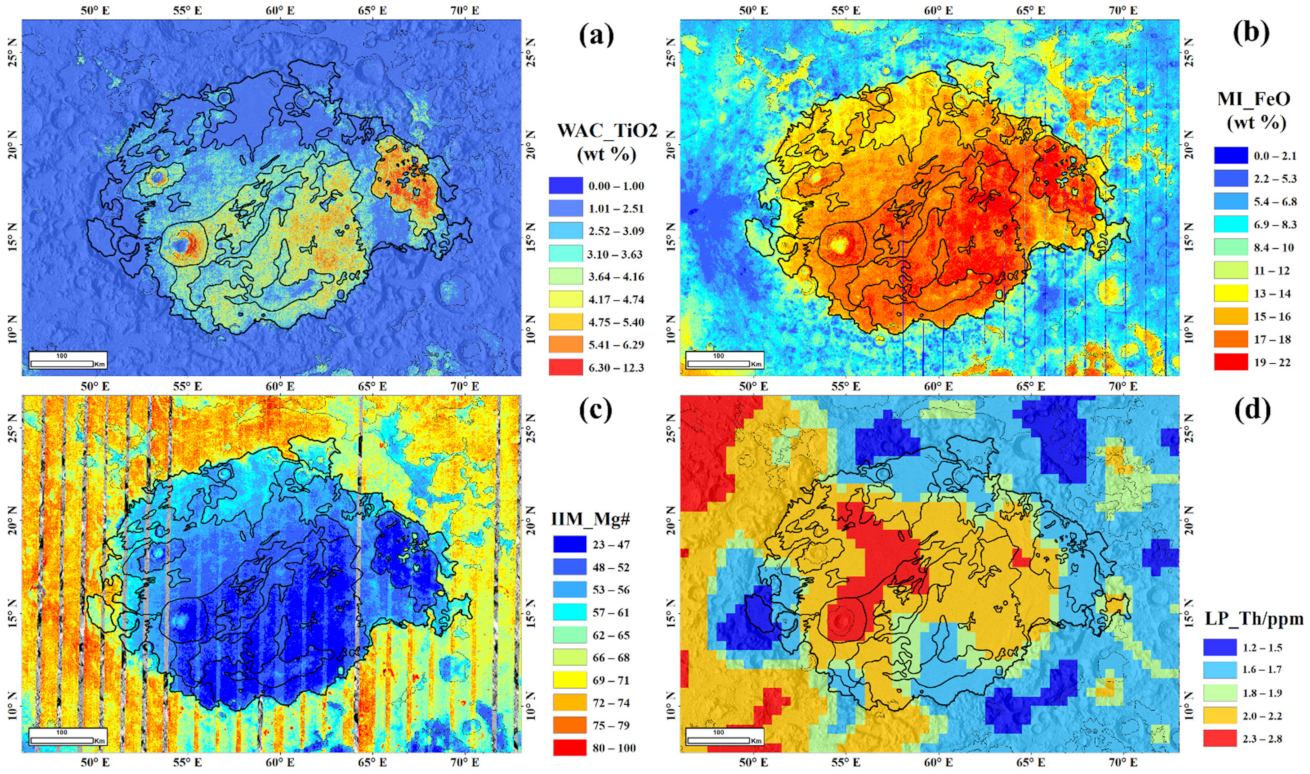
Figure 9.
(a) The M3 reflectance map at 750 nm and (b) the RGB map using IBD1000 (red), IBD2000 (green), and Re 750 (blue) of the Crisium basin. The labeled spectra of these sky-blue points are shown in Figure 10 (c) M3 spectral survey of small craters in the Crisium basin and the spatial distribution of HCP/LCP ratios derived from the MGM method. (d) Pyroxene map based on the interpolation of (c) using Kriging interpolation technique.
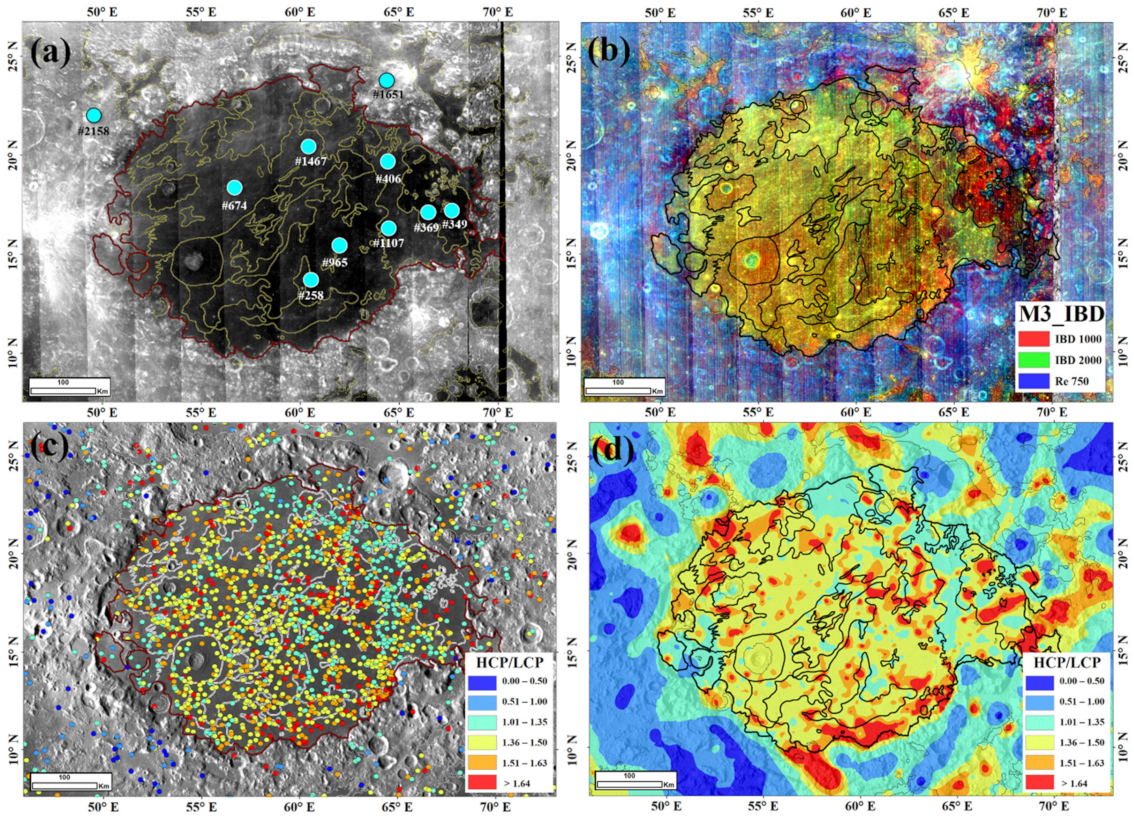
Figure 10.
M3 reflectance spectra and mineral compositions in the Crisium basin. (a) BC I versus BC II diagram of spectra of small craters in mare and highlands. Natural pyroxenes from Adams (1974) and Cloutis and Gaffey (1991) [60] and synthetic pyroxenes from Klima et al. (2011) [61] are also used to distinguish pyroxene composition. (b) BC I versus IBDR diagram modified from Gaffey et al. (1993) [62] and Varatharajan et al. (2014) [63]. Cpx: clinopyroxene; Opx: orthopyroxene; Ol: Olivine; OL: monomineralic olivine assemblages; OC: ordinary chondrites; BA: basaltic achondrite [62]. (c) The 3D scatter plot of pyroxene absorption bands and HCP/LCP ratios in four mare units (Im1, Im2, Im3, and EIm, which are defined in the next section). The representative spectra after smoothing (d) and continuum removal (e) from small fresh craters in four mare units and highland massifs are labeled in Figure 9a.
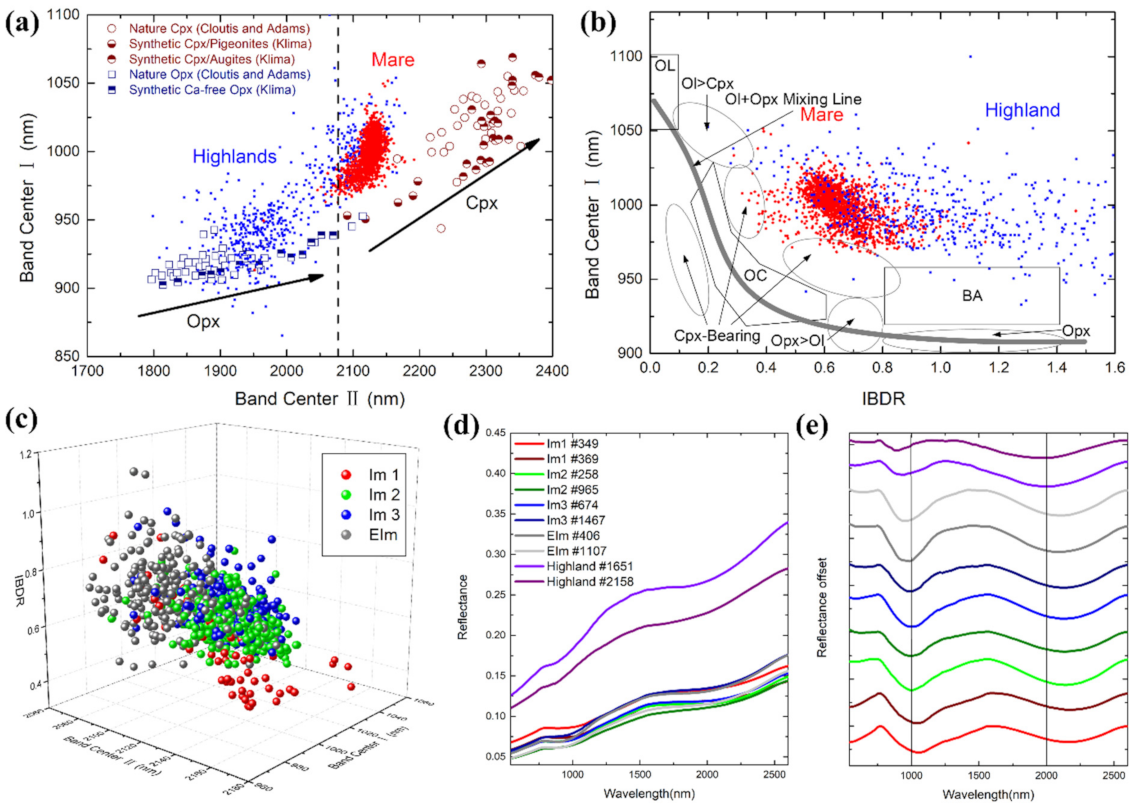
Figure 11.
(a) The continuum-removed spectra of small fresh craters exhibit a broad absorption at 1000 nm, which indicates an olivine-rich component. Three dashed lines are the absorption centers of olivine near 900 nm, 1050 nm, and 1200 nm, respectively. (b) The positions of these craters are labeled in the Crisium basin. The insets of (c) #722, (d) #103, and (e) an exposure of olivine in highland massifs in Figure 11b demonstrate the topography of these olivine-rich craters.
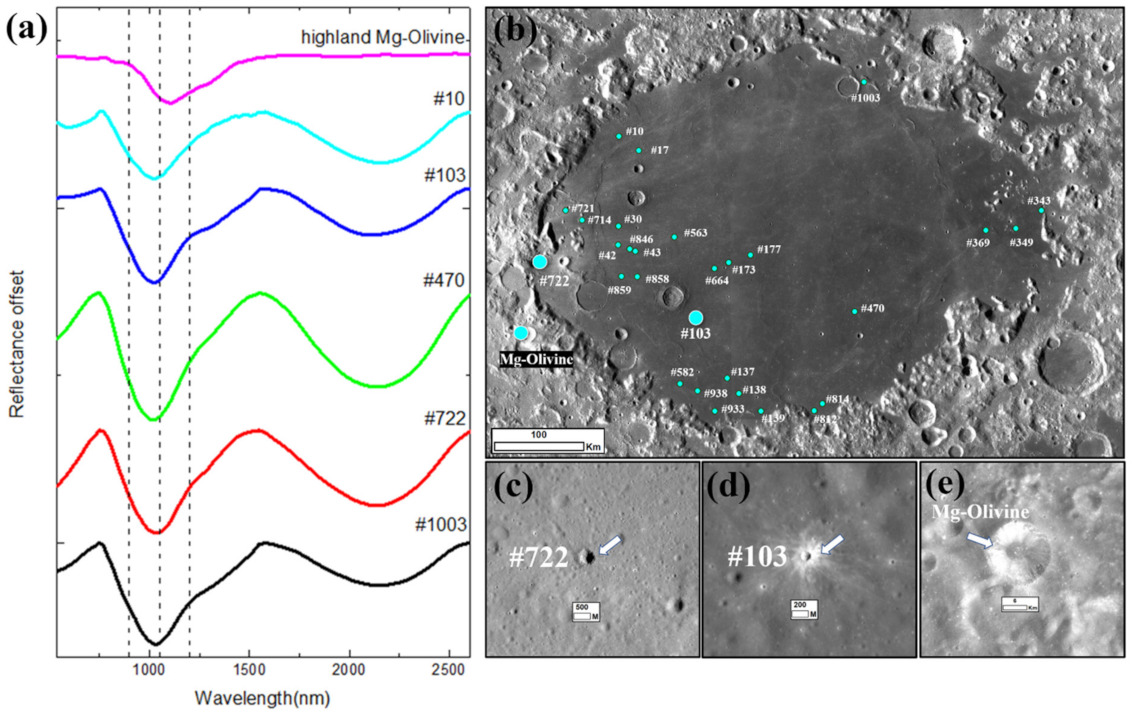
Figure 12.
(a) False-color composite map derived from Kaguya-MI data with red (750 nm/415 nm), green (750 nm/950 nm), and blue (415 nm/750 nm). The cumulative crater frequency plots and AMAs of mare units ((b) Im1, (c) Im2, (d) Im3 and (e) EIm) are analyzed in Table 1 for details.
Figure 12.
(a) False-color composite map derived from Kaguya-MI data with red (750 nm/415 nm), green (750 nm/950 nm), and blue (415 nm/750 nm). The cumulative crater frequency plots and AMAs of mare units ((b) Im1, (c) Im2, (d) Im3 and (e) EIm) are analyzed in Table 1 for details.
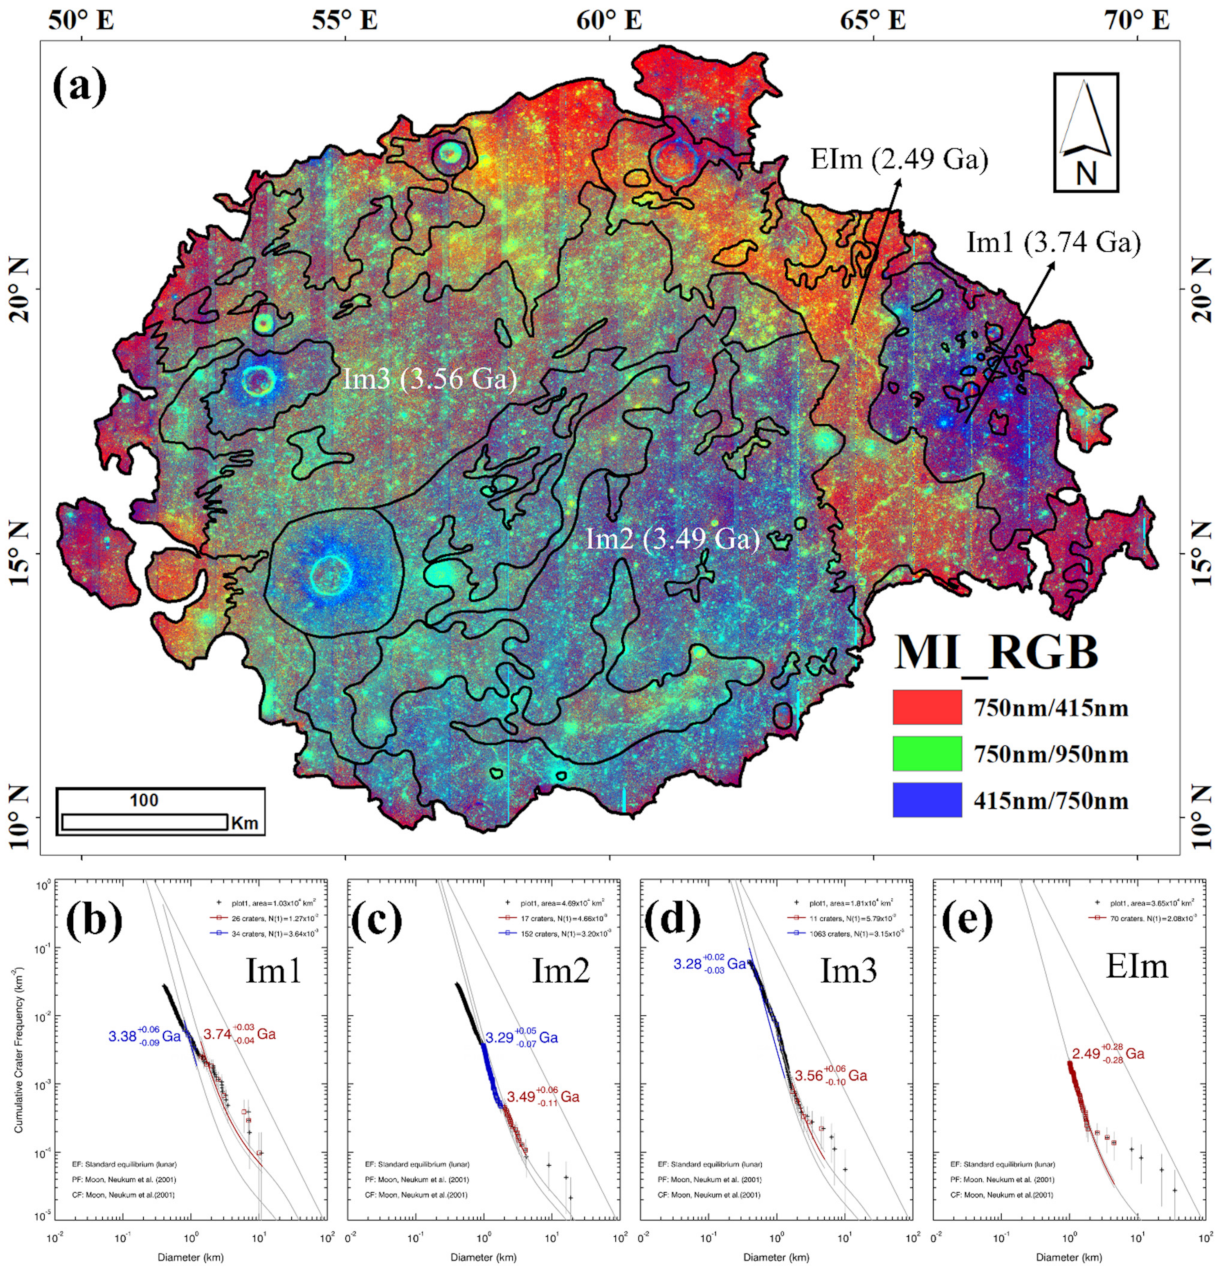
Figure 13.
The geologic map of the Crisium basin.


Table 1.
The mare units in the Crisium basin.
| Unit | Numder of Craters (D > 400 m) | Area (km2) | Model Ages in This Study (Kaguya-TC) | Hiesinger et al. (2011). (LROC-WAC) | Boyce et al. (1978) (Lunar Orbiter 5) | Average Values of Compisition | |||
|---|---|---|---|---|---|---|---|---|---|
| TiO2(wt.%) | FeO (wt.%) | Mg# | Th(ppm) | ||||||
| Im1 | 284 | 10,303 | 3.27/3.60 Ga | 3.2/3.5 Ga | 4.92 ± 1.17 | 17.1 ± 2.02 | 48.1 ± 3.54 | 1.73 ± 0.16 | |
| Im2 | 1372 | 46,904 | 3.04/3.49 Ga | 3.2/3.5 Ga | 3.85 ± 0.98 | 17.9 ± 1.65 | 47.5 ± 2.43 | 1.95 ± 0.20 | |
| Im3 | 1111 | 36,507 | 2.71/2.78 Ga | 3.5/3.65 Ga | 2.42 ± 0.92 | 15.5 ± 1.24 | 52.5 ± 2.60 | 2.11 ± 0.21 | |
| EIm | 477 | 18,070 | 2.95/2.97 Ga | 2.5/3.2 Ga | 2.02 ± 1.07 | 15.7 ± 1.82 | 52.9 ± 2.77 | 1.88 ± 0.17 | |
Publisher’s Note: MDPI stays neutral with regard to jurisdictional claims in published maps and institutional affiliations. |
© 2021 by the authors. Licensee MDPI, Basel, Switzerland. This article is an open access article distributed under the terms and conditions of the Creative Commons Attribution (CC BY) license (https://creativecommons.org/licenses/by/4.0/).
Share and Cite
MDPI and ACS Style
Lu, X.; Cao, H.; Ling, Z.; Fu, X.; Qiao, L.; Chen, J. Geomorphology, Mineralogy, and Geochronology of Mare Basalts and Non-Mare Materials around the Lunar Crisium Basin. Remote Sens. 2021, 13, 4828. https://doi.org/10.3390/rs13234828
AMA Style
Lu X, Cao H, Ling Z, Fu X, Qiao L, Chen J. Geomorphology, Mineralogy, and Geochronology of Mare Basalts and Non-Mare Materials around the Lunar Crisium Basin. Remote Sensing. 2021; 13(23):4828. https://doi.org/10.3390/rs13234828
Chicago/Turabian StyleLu, Xuejin, Haijun Cao, Zongcheng Ling, Xiaohui Fu, Le Qiao, and Jian Chen. 2021. "Geomorphology, Mineralogy, and Geochronology of Mare Basalts and Non-Mare Materials around the Lunar Crisium Basin" Remote Sensing 13, no. 23: 4828. https://doi.org/10.3390/rs13234828
Note that from the first issue of 2016, this journal uses article numbers instead of page numbers. See further details here.