Article

Land Use Classification of VHR Images for Mapping Small-Sized Abandoned Citrus Plots by Using Spectral and Textural Information

by
Sergio Morell-Monzó
1,*,
María-Teresa Sebastiá-Frasquet
1 and
Javier Estornell
2
1
Instituto de Investigación para la Gestión Integrada de Zonas Costeras, Universitat Politècnica de València, C/Paraninfo, 1, 46730 Grau de Gandia, Spain
2
Geo-Environmental Cartography and Remote Sensing Group, Universitat Politècnica de València, Camí de Vera s/n, 46022 Valencia, Spain
*
Author to whom correspondence should be addressed.
Remote Sens. 2021, 13(4), 681; https://doi.org/10.3390/rs13040681
Submission received: 25 January 2021 / Revised: 5 February 2021 / Accepted: 10 February 2021 / Published: 13 February 2021

Abstract

:
Agricultural land abandonment is an increasing problem in Europe. The Comunitat Valenciana Region (Spain) is one of the most important citrus producers in Europe suffering this problem. This region characterizes by small sized citrus plots and high spatial fragmentation which makes necessary to use Very High-Resolution images to detect abandoned plots. In this paper spectral and Gray Level Co-Occurrence Matrix (GLCM)-based textural information derived from the Normalized Difference Vegetation Index (NDVI) are used to map abandoned citrus plots in Oliva municipality (eastern Spain). The proposed methodology is based on three general steps: (a) extraction of spectral and textural features from the image, (b) pixel-based classification of the image using the Random Forest algorithm, and (c) assignment of a single value per plot by majority voting. The best results were obtained when extracting the texture features with a 9 × 9 window size and the Random Forest model showed convergence around 100 decision trees. Cross-validation of the model showed an overall accuracy of the pixel-based classification of 87% and an overall accuracy of the plot-based classification of 95%. All the variables used are statistically significant for the classification, however the most important were contrast, dissimilarity, NIR band (720 nm), and blue band (620 nm). According to our results, 31% of the plots classified as citrus in Oliva by current methodology are abandoned. This is very important to avoid overestimating crop yield calculations by public administrations. The model was applied successfully outside the main study area (Oliva municipality); with a slightly lower accuracy (92%). This research provides a new approach to map small agricultural plots, especially to detect land abandonment in woody evergreen crops that have been little studied until now.

Graphical Abstract

1. Introduction

The Comunitat Valenciana (CV) region is located in eastern Spain. Its weather conditions, soil characteristics and water availability have made this region one of the richest agricultural areas in the Mediterranean basin [1,2]. The CV region is the most important citrus producer in Spain with an area of 160,912 ha, about 60% of the national area of this crop according to the Survey on Crop Areas and Yields of 2019 [3]. Spain is the most important citrus producer in the European Union (EU) and the fifth highest producer in the world [4]. However, in recent years, there has been a massive abandonment of these agricultural holdings. In the CV region there has been a decrease of 15% in citrus areas from 2008 to 2018 (from 188,650 ha to 161,944 ha) [5,6] and an increase in abandoned areas is expected due to the socio-economic changes that are taking place in the EU [7].
Monitoring this issue is an important point for land and landscape management, but also for creating a citrus inventory and making annual yield estimations. Currently there are no public cartographic sources of land use to map land abandonment at plot resolution with appropriate thematic detail. The Spanish Land Occupation Information System (SIOSE) is an object-based and hierarchical database of land use/land cover in Spain. SIOSE allows the identification of abandoned areas, but its minimum area of representation is 2 ha. On the other hand, the Geographic Information System for Agricultural Plots (SIGPAC) is available in the member states of the EU. This database has cadastral plot resolution and identifies as abandoned plots next land uses: unproductive land, grassland and arable land. However, there are other plots classified as crops (e.g., citrus) that are actually abandoned. Therefore, it is possible to estimate the abandoned area through SIGPAC, but its insufficient thematic detail inevitably causes an underestimation of the abandoned area. In addition, this system is periodically updated manually, which can cause errors and unregistered changes during the update period.
Traditionally, land use maps such as SIOSE or SIGPAC have been generated through either photo-interpretation or visiting agricultural plots directly, because of the high level of accuracy required for further administrative actions [1]. Nowadays, remote sensing is a powerful tool for obtaining maps that can replace the creation of manual land use maps with a more efficient personal resources use. Land abandonment has been previously approached by remote sensing by other authors [8,9,10,11,12]. These previous studies have been conducted in areas that do not require high spatial resolution, with MODIS and Landsat products. However, detecting abandoned citrus plots in the CV region by remote sensing is challenging due to the high spatial fragmentation and small size of the agricultural plots which makes necessary the use of high-resolution products. Furthermore, previous studies have focused on land abandonment of crops with fast phenological dynamics. However, land abandonment in woody evergreen crops (e.g., citrus) has been little studied. Previous studies on citrus already showed serious discrepancies between agriculture census data and satellite-derived cropland area using medium-resolution satellite imagery as Landsat [13]. Sentinel-2 images overcome some of these limitations and showed its potential in agricultural applications [14,15], however in areas with high spatial fragmentation they may be not enough [16,17]. The Sentinel-2 satellite images did not show enough accuracy to identify abandoned plots in our study area due to resolution limitations and the small size of the plots, for this reason, the use of higher resolution images is recommended [18].
Highly fragmented areas force the use of Very High-Resolution (VHR) images. However, the use of VHR image time series is costly from an economic and operational point of view, which forces us to focus on procedures that use a single image (mono-temporal approaches). In addition, VHR images usually have limitations derived from their low spectral resolution, which makes mapping vegetation difficult especially for very similar covers. The limitations of low spectral resolution can be reduced using robust machine learning algorithms and textural image analysis [19].
There is a wide set of techniques for the extraction of texture features: statistical methods such as the Gray Level Co-Occurrence Matrix (GLCM) [20], Local Binary Patterns [21], filtering techniques such as energy filters [22] or Gabor filters [23], methods based on wavelet decomposition [24] and methods derived from geostatistical functions [25]. Texture measures quantitatively describe relationships of Digital Numbers (DN) values of neighbor pixels [26]. Texture features provide contextual information that allows us to differentiate patterns in the spatial distribution of objects in the image and increases classification accuracy.
As far as we know there are no previous studies on land abandonment which use VHR images and texture features. However, the GLCM features have shown to improve classification accuracy [27], especially in high resolution images [19,28,29,30]. There are previous studies which use GLCM texture features and VHR images to map vegetation and determine the health status of trees [19,28]. These studies share characteristics with the detection of abandonment in citrus since an abandoned plot shows a growth of wild vegetation and trees in poor health conditions. In these cases, GLCM features and the Random Forests algorithm were used. There are also previous studies on the identification of citrus plots using VHR images but these studies did not focus on identifying abandoned plots. These studies are generally based on two types of approaches. The first group is based on the extraction of spectral and textural features of the plot [31,32], while the second group is based on the detection of trees [1,33]. The second approach has several limitations, the most important the fine spatial resolution images needed to detect a single citrus tree. In addition, the development of wild vegetation during land abandonment can mask citrus trees and makes more difficult their identification. Although single tree approach is widely applied in precision agriculture to analyze intra-plot variations, information of land abandonment at level tree is not so relevant. The objective of land abandonment studies is to classify the whole plots into a unique category what can be done considering their spectral and textural information. The use of textural information for a single tree approach will require more advanced algorithms to extract and classify them as abandoned.
Since 2017 a VHR airborne image is available annually for the entire CV region through the Valencian Cartographic Institute (ICV). These images are currently used to update the SIGPAC of the CV region. In 2011, Amorós et. al. [1] created a methodology to identify citrus plots automatically. The main goal of this methodology was to detect plots containing citrus at the cadastral plot level using a multi-stage object detection approach to identify the citrus trees [34]. These advances allowed automating the classification of citrus plots to update the SIGPAC annually. However, this methodology does not allow to differentiate between citrus plots in production or abandoned. In the current context of land abandonment in the CV region, it is especially important to develop a procedure to map abandoned citrus plots to avoid overestimating the productive area.
In this work we present a multistage methodological approach to detect abandoned plots in areas with a predominance of citrus. Our approach is based on three general steps: First, a textural feature extraction based on the GLCM was performed from the Normalized Difference Vegetation Index (NDVI) of the high-resolution airborne images. Then, a supervised pixel-based classification was performed using the Random Forests algorithm. Finally, a refinement of the classification based on majority voting within each plot was carried out to classify each cadastral plot with a unique value.

2. Data and Methods

This section describes the proposed methodology to detect abandoned plots in areas with a predominance of citrus. A classification based on three types of plots was proposed (Figure 1): (a) Not in production—these are plots where bare soil occupies most of the plot surface. These plots are in replacement periods. In this class, trees may be planted but are not yet productive. (b) In production—these are plots with citrus productive cultivation. In this class, the citrus crop occupies most of the plot surface. (c) Abandoned—these are abandoned plots dominated by wild vegetation that show obvious signs of abandonment.
The detection of abandoned plots is based on the spectral and textural differences caused by the growth of wild vegetation, the loss of vigor of the trees (decreased foliar density and greenness) and the loss of regular spatial patterns of the crop. A more detailed description of the ecological succession of an abandoned plot can be found in Morell et. al., 2020 [18].

2.1. Study Area and Data

The study area is divided into 4 locations of the CV region with a predominance of citrus. The main study area is in the municipality of Oliva (Figure 2), a coastal city in the CV region that covers an area of 59,600 ha, of which 50% is available for agriculture. Most of this area is located on a coastal plain with high agrological capacity [35,36]. However, urban expansion and tourism compete with agricultural land uses and are promoting land abandonment. The main crop in this area is citrus, which represents more than 95% of the crops in the area [37]. In this area, the citrus plots have an average extension of 0.32 ha according to SIGPAC.
Additionally, 3 complementary areas of 435 ha with a predominance of citrus were chosen in the municipalities of: Bellreguard-Almoines, Benicull-Polinyà del Xúquer and Nules (Figure 2).
The VHR images used were provided by the Valencian Cartographic Institute (ICV). The ICV provides an annual image (VHR) of the entire Valencian Region with a spatial resolution of 0.25 m and four spectral bands: R (430 nm), G (530 nm), B (620 nm) and NIR (720 nm). These images were taken using an UltraCam Eagle UC-E-1-50016095-f80 camera from the company Vexcel Imaging GmbH © with a Qioptic Vexcel HR Digaron sensor. The images were taken on different dates in each study area (Table 1).
The ground truth dataset was collected during a field survey conducted between 11 and 14 July 2019 in the main study area (Oliva). Stratified random sampling with proportional distribution was performed. A set of 240 plots in an area of 98 ha was selected (80 not in production, 80 in production and 80 abandoned). These plots were used to train and validate the model. In addition, 270 plots were digitalized and classified in the complementary study areas (Table 1). To avoid errors during the photointerpretation process of the plots, the 2018 and 2020 images of the ICV were also used. These plots were used to test the model outside the study area.

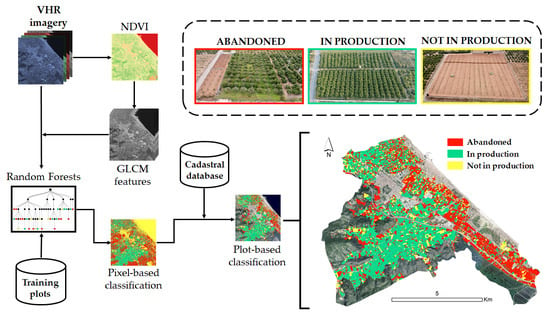
2.2. Image Processing and Classification

Image processing is described as follows (Figure 3). The images were geometrically corrected and radiometrically calibrated by Vexcel Imaging GmbH©. Then, the images were resampled at 1 m resolution to reduce computing time and a mosaic was computed with the tiles that cover each study area. Then, the images were pre-processed to extract the GLCM-based texture features using the GLCMTextures package [38] using an R 4.0.3 environment [39]. The standard procedure for the automatic extraction of GLCM texture features is based on a grey level image considering the panchromatic band or calculating the first principal component of multispectral images [40]. However, our imagery does not have a panchromatic band and performing a Principal Component Analysis would mean a loss of interpretability of our information. For that reason, the NDVI transformation was used to extract the GLCM textural features. This approach was used by other authors successfully [41,42].
The NDVI band was discretized in 32 gray levels to compute the GLCM measures. Then, 4 kernels with different window sizes were created (3 × 3, 5 × 5, 7 × 7, and 9 × 9) and 7 texture measures were computed. The texture measures were calculated in an invariant spatial direction that is the average of the four directions: 0°, 45°, 90°, and 135°. This omnidirectional approach was chosen as the crops do not present a specific direction.
Only 7 texture measures were computed out of the 14 originally proposed by [20]. These texture measures are the most widely used in remote sensing and image analysis [43]: mean, variance, contrast, dissimilarity, homogeneity, angular second moment (ASM), and entropy.
G L C M   M e a n µ =   i , j = 0 N 1 i P i , j
G L C M   V a r i a n c e σ 2 =   i , j = 0 N 1 P i , j i µ 2
C o n t r a s t =   i , j = 0 N 1 P i , j i j 2
D i s s i m i l a r i t y = i , j = 0 N 1 P i , j i j
H o m o g e n e i t y = i , j = 0 N 1   P i , j 1 + i j 2
A n g u l a r   S e c o n d   M o m e n t   A S M =   i , j = 0 N 1 P i , j 2
E n t r o p y =   i , j = 0 N 1 P i , j [ l n P i , j ]   w h e r e   0 *   l n 0 =   0
where N is the number of rows or columns in the GLCM (equal to the number of gray levels), i are the row indices of the GLCM matrix (equal to gray level of reference cell), j are the column indices of the GLCM matrix (equal to gray level of neighboring cell) and Pi,j is the Probability (relative frequency) of neighboring cells having gray levels i and j.
Pixel-based classification was done using the RandomForests (RF) algorithm [44], which is a non-parametric algorithm commonly used in remote sensing for supervised classifications [45,46]. The RF classifier consists of a set of classification trees such that each one is trained with an independent random vector and with the same distribution for each tree. Therefore classifier consists of an ensemble of classifiers {h(x,Θk), k = 1,…,} where the {Θk} are independent, identically distributed random vectors, and X is an input pattern [47].
In training, the algorithm creates multiple classification trees, each one trained on a bootstrapped sample of the original training data, and searches only across a randomly selected subset of the input variables to determinate a split for each node. Therefore, trees require a measure of variable selection and a measure of the division purity to construct the nodes. The Gini Diversity Index was used as a measure of impurity. For a given training set T, selecting one case at random and saying that it belongs to some class Ci, the Gini Index can be written as [46]:
j i ( C i , T / T )   C j , T / T
where ʃ(Ci,T)/|T|is the probability that the selected case belongs to class Ci.
In RF different classification trees are combined in the form of weak predictors, this means that the prediction of the model is determined by the majority vote of the trees. For this reason, RF is actually an assembly model that uses the bagging technique to combine the predictions of various decision trees. Bagging (or bootstrap aggregating) consists of training each decision tree with a bootstrapped sample (random selection with replacement) from the original training data set. At each bagging, 2⁄3 of the training data set is randomly selected to train each individual tree. Trees grow to their full extent without pruning. Even so, overfitting does not occur due to the use of bootstrapped samples to train individual trees and the fact that the model consists of a multitude of independently trained trees with random samples.
Our RF model was created using the randomForest package [48] from the caret API [49] using an R 4.0.3 environment [39]. Five classification models were trained using 100 decision trees. These models were trained with pixels extracted from 210 training plots out of the total 240 plots from the main study area. The first model took as independent variables (input variables) the pixel values of the R (430 nm), G (530 nm), B (620 nm) and NIR (720 nm) bands of the image. The remaining 4 models were trained with the pixel value of the spectral bands and the 7 texture features, each one at a different window size (3 × 3, 5 × 5, 7 × 7, and 9 × 9). The models took as the dependent variable (output variable) the type of coverage according to our classification: not in production, in production and abandoned.
The image resulting from the pixel-based classification was segmented using the cadastral database. Then, these segments were used to enhance the classification results of the pixel based Random Forests algorithm using the majority voting within each segment [18]. This procedure creates an object-based map where each object is a cadastral plot [50] and improves the accuracy of pixel-based classification by removing misclassified pixels, within homogeneous segments, known as salt-and-pepper noise [51]. Finally, urban and forest plots were masked using the cadastral database and the Forestry Territorial Action Plan of the CV region.

2.3. Validation and Accuracy Assessment

An important issue in classifying remote sensing images is evaluating the results in terms of accuracy. Our approach was validated from two different points of view. First the pixel-based accuracy was evaluated (that is, the accuracy before the majority voting refinement). Second, the plot-based accuracy was evaluated (that is, the accuracy after the majority voting refinement). This double information allows us to know the performance improvements generated by the GLCM measures and the improvements generated by the majority voting.
The accuracy assessment was carried out through an 8-fold cross validation. In each step a balanced set of 30 plots was used for validation. The average accuracy and standard deviation of the pixel-based classification were obtained using a balanced set of pixels extracted from the 30 validation plots at each step. Then, average accuracy, standard deviation and average confusion matrix of the plot-based classification was obtained using the same 30 validation plots through the 8-folds cross-validation. Additionally, the most accurate model was tested in the complementary areas and the plot-based accuracy was obtained. The model was applied in the complementary areas without any additional training data to test if the model can generalize outside of the training area. To this end a set of validation plots were identified by photointerpretation for each complementary area (Table 1).

2.4. Feature Importance and Model Pruning

The Boruta feature selection algorithm [52] was used to select the relevant features for classification. Boruta is a wrapping method around Random Forest classification algorithm. This algorithm is based on a backward removal of features that are not relevant, but it implements some improvements over the traditional Recursive Feature Elimination [53,54].
The measure of importance used by Boruta is the Z score. The importance measure of an attribute is obtained as the loss of accuracy of classification caused by the random permutation of attribute values between objects. It is computed separately for all trees which use a given attribute for classification. Then the mean decrease in accuracy is divided by its standard deviation is obtained for computing the Z score:
Z score = (MDA)/(σ),
Since we cannot use Z score directly to decide if importance of any given attribute is significant (that is, whether it is discernible from importance which may arise from random fluctuations), Boruta compares the importance of real variables with the importance of random variables by design, called shadow features. Then it removes the features that are less important than the best shadow variable and repeats the process iteratively for a few steps [55].
This approach was used to decide which variables are significantly important for our classification. Further, a ranking of importance of variables was carried out using the Z score, and then a pruning of the model was carried out, removing the less relevant variables recursively.

3. Results

3.1. Model Tunning

The five models were trained with an increasing number of trees up to 500 and the out-of-bag error (OOB error) was used as a measure of precision. All models showed convergence before 100 decision trees. After the 100 trees, the models did not generate an out-of-bag error reduction (Figure 4), therefore the models were trained with 100 trees. The training history also showed a better performance of the models that include spectral and GLCM textural features regarding the spectral model (Figure 4).

3.2. Classification and Accuracy Assesment

A summary of the average accuracy and its standard deviation for each model obtained through cross-validation can be observed in Table 2. The average accuracy of the pixel-based and plot-based classification is shown separately. The least accurate model was the one that only included spectral variables. This model showed a pixel-based classification accuracy of 71% and a plot-based classification accuracy of 91%. The most accurate model was the one that included spectral and GLCM textural features at a 9×9 window size with a pixel-based classification accuracy of 87% and a plot-based accuracy of 95%. However, models that included spectral and GLCM textural features with 5×5 and 7×7 window sizes also showed a similar accuracy. Table 3 shows the performance of the model in terms of precision, recall, and F1-score for the plot-based classification.
Adding GLCM textural features resulted in an accuracy improvement of up to 16% for pixel-based classification. As the window size was increased, there was a decrease in noise in the pixel-based classification (Figure 5). The noise reduction in the 3×3 window size model regarding the spectral model led to an improvement in object-based classification. However, in the models with larger window sizes the noise reduction did not lead to an improvement in the object-based classification compared with the 3×3 window size model. This is because as the noise from the pixel-based classification is reduced, the improvement capacity of the majority voting refinement is smaller. On the other hand, the use of majority voting refinement led to an improvement in accuracy in all cases. The most notable accuracy improvement was in the model that only includes spectral features where the accuracy improved by 20%.
For the most accurate model (9 × 9 GLCM model classification), the highest producer’s accuracy (98%) was obtained for the category not in production (Table 4). This category is more easily detectable due to the spectral differences compared to the two other categories. The in production and abandoned categories obtained a producer’s accuracy of 91% and 96%, respectively. User’s accuracy for categories not in production, in production and abandoned was 95%, 96%, and 94%, respectively.
According to the cadastral database and our masking process, the main study area contains 14,953 agricultural plots occupying an area of 2949 ha. Our most accurate model detected 2373 plots not in production (345 ha), 6064 plots in production (1513 ha), and 6516 abandoned plots (1091 ha) (Figure 6). There is a high concentration of abandoned plots in the coastal zone due to the lower agronomic capacity of the soils and the prospects for urban growth. In the coastal area, many owners keep their plots without agricultural interest, and they expect future urban development processes. There is also a high concentration of abandoned plots adjacent to urban areas where future urban expansion is expected. The plots in production and not in production are located in the inner area, where the soils are more productive, and the crops are less exposed to the cold winds from the east [18]. According to our results, 31% of the plots classified as citrus by SIGPAC are abandoned.
The most accurate model in the main study area was tested in the three complementary areas (Figure 7). According to the photo-interpreted plots, the model has a high overall accuracy (93%) (Table 5). The high accuracy obtained indicates that the model can be applied outside the study area, although the accuracy was lower than in the training area. The most accurate class was not in production, while the most inaccurate class was the abandoned class. This is due to the spectral similarity of the abandoned and in production plots.

3.3. Variables Importance and Model Pruning

Figure 8 shows the variables importance ranking for each model. According to the Boruta test, all variables showed significant importance for classification. Regarding the spectral variables, all the models showed that the most important band is the NIR followed by the blue, red, and green bands. Furthermore, the NIR was always among the three most important features. Regarding the GLCM texture measures, the most important feature was the contrast for all models. The second most important GLCM texture feature was dissimilarity for the largest window sizes (5 × 5, 7 × 7 and 9 × 9) and mean for the smallest window model (3 × 3). The ASM texture feature was the least important, although it also passed the Boruta significance test.
Recursive pruning of the 9 × 9 window size model showed a gradual decrease in accuracy (Figure 9). This behavior matches with the Boruta results which indicated that all the variables are significant for the classification. The greatest loss of accuracy occurred in the last three steps of pruning where the most important features, which are contrast and dissimilarity, are removed. The elimination of the ASM did not cause a decrease in the accuracy of the model and it could be proposed for elimination.

4. Discussion

The proposed methodology was appropriate for mapping land abandonment in citrus crops at cadastral plot resolution. The combination of spectral information and texture features allowed high classification accuracies. The results confirmed that adding GLCM texture features to spectral information improves classification accuracy for detecting land abandonment. The overall accuracy of the pixel-based classification was 87% and the overall accuracy of the plot-based classification was 95%. These results represent important improvements compared to the use of Sentinel 2 images [18]. Our accuracy levels are similar to previous studies using GLCM features and the RF algorithm in VHR images in comparable contexts, such as vegetation mapping and health status, which obtained overall accuracies between 88–97% [19,28].
The best results were obtained when generating the texture features from a 9x9 window size. The model accuracy increased as the window size increased due to the reduction of salt and pepper noise. This is because as the window size increases, the texture features better capture regular citrus planting patterns. However, increasing the window size too much can decrease accuracy due to the inclusion of pixels from adjacent plots. This is an important point to consider in areas with small sized plots such as our study area where the average plot size is 0.32 ha.
All features are statistically significant for classification. However, the most important features were contrast and dissimilarity together with the NIR and blue bands. NIR and contrast were among the most important in all models. Dissimilarity increased while blue band decreased in importance as window size increased. On the other hand, the ASM feature was the least important in all the models.
The proposed methodology is an accurate and efficient alternative to generate land abandonment maps since it allows obtaining maps with high accuracy from a reduced set of training data. In addition, the limitations of Sentinel-2 for areas with high spatial fragmentation was overcome thanks to the use of VHR images [16,17,18]. We created a complete map of abandoned citrus plots in the Oliva municipality for the year 2019, that detected a 31% of erroneously classified plots in the current methodology used by the public administration. The trained model was also tested outside the training area. However, its performance was about 3% lower than in the main study area. This difference can be explained considering that photointerpretation can offer some limitations to define the classes of the test plots, requiring additional field data for validating the complementary study areas. In addition, we recommend adjusting the window size to the needs of each area. The window size can be adjusted by evaluating the performance of the classifier in each study area or by using automatic processes to define the window size [56]. These results indicate that the proposed methodology is scalable to other citrus areas of the CV region.
The availability of an annual VHR image of the entire CV region enables to generate land abandonment maps in key areas from manageable field data sets. Furthermore, these land abandonment maps are perfectly integrated with the information from SIGPAC and other methodologies for citrus detection [1]. Combining these data sources could generate valuable information for managing the land abandonment problem and improve the citrus inventory in the CV region. This new information could correct the overestimation of citrus crop yield through SIGPAC. However, this approach is not limited only to the CV region. This approach could be implemented in other areas of the planet with citrus crops. VHR images are becoming more common. In addition to airborne images, the increasing availability of satellite images with fine spectral and spatial resolutions encourage to develop further research on the land abandonment issue. This new information would help us to improve the accuracy of the citrus inventory and annual yield, especially in areas with small plots or that have land abandonment problems. Finally, this approach could be adapted to other types of crops with regular planting pattern where abandonment is associated with the growth of wild vegetation and the loss of vigor of evergreen crops.

5. Conclusions

In this paper, a methodology for mapping abandoned citrus plots in highly fragmented areas from VHR images with four spectral bands (430 nm, 530 nm, 620 nm, and 720 nm) is presented. The proposed methodology combines spectral information and GLCM-based texture features from the NDVI to generate a pixel-based classification using Random Forests. Then, a unique classification value is assigned to each plot by majority voting. The best results were obtained when generating the texture features from a 9x9 window size. The proposed methodology allowed to obtain satisfactory results with an overall accuracy of 95%. Model uses 7 texture features: mean, variance, contrast, dissimilarity, homogeneity, angular second moment, and entropy. All features showed statistically significant importance for classification. However, the most important were contrast, dissimilarity, and homogeneity together with the spectral bands. This methodology allowed creating a complete map of abandoned plots in the municipality of Oliva (CV Region) and it could be applied in other areas and other type of crops. This new methodological approach could correct the citrus yield overestimation generated by the current data sources available by public administrations. However, evaluating the performance of the model in areas far from the training area requires further study. This research provides new information to map small agricultural plots, especially to detect land abandonment in woody evergreen crops that have been little studied until now.

Author Contributions

Conceptualization, S.M.-M., M.-T.S.-F and J.E.; formal analysis, S.M.-M.; investigation, S.M.-M., M.-T.S.-F. and J.E.; methodology, S.M.-M., J.E. and M.-T.S.-F.; resources, S.M.-M.; software, S.M.-M.; writing—original draft, S.M.-M.; writing—review and editing, J.E. and M.-T.S.-F. All authors have read and agreed to the published version of the manuscript.

Funding

This research was funded by regional government of Spain, Generalitat Valenciana, within the framework of the research project AICO/2020/246 and the APC was also funded by the research project AICO/2020/246.

Institutional Review Board Statement

Not applicable.

Informed Consent Statement

Not applicable.

Data Availability Statement

The VHR imagery used in this study are available through the Valencian Spatial Data Infrastructure (IDEV) of the Valencian Cartographic Institute (ICV): http://www.idev.gva.es/es (accessed on 25 January 2021).

Conflicts of Interest

The authors declare no conflict of interest.

References

  1. Amorós López, J.; Izquierdo Verdiguier, E.; Gómez Chova, L.; Muñoz Marí, J.; Rodríguez Barreiro, J.Z.; Camps Valls, G.; Calpe Maravilla, J. Land cover classification of VHR airborne images for citrus grove identification. ISPRS J. Photogramm. Remote Sens. 2011, 66, 115–123. [Google Scholar] [CrossRef]
  2. Instituto Valenciano de Investigaciones Agrarias (IVIA). Citricultura Valenciana: Gestión Integrada de Plagas y Enfermedades en Cítricos. Available online: http://gipcitricos.ivia.es/citricultura-valenciana (accessed on 25 December 2020).
  3. Ministerio de Agricultura y Pesca, Alimentación y Medio Ambiente. ESYRCE: Encuesta Sobre Superficies y Rendimientos del año 2019; Ministerio de Agricultura y Pesca, Alimentación y Medio Ambiente: Madrid, Spain, 2019. [Google Scholar]
  4. Noguera, J. Viabilidad y competitividad del sistema citrícola valenciano. Boletín Asoc. Geógrafos Españoles 2010, 52, 81–99. [Google Scholar]
  5. Ministerio de Agricultura y Pesca, Alimentación y Medio Ambiente. ESYRCE: Encuesta Sobre Superficies y Rendimientos del año 2008; Ministerio de Agricultura y Pesca, Alimentación y Medio Ambiente: Madrid, Spain, 2008. [Google Scholar]
  6. Ministerio de Agricultura y Pesca, Alimentación y Medio Ambiente. ESYRCE: Encuesta Sobre Superficies y Rendimientos del año 2018; Ministerio de Agricultura y Pesca, Alimentación y Medio Ambiente: Madrid, Spain, 2018. [Google Scholar]
  7. Rounsevell, M.D.A.; Reginster, I.; Araújo, M.B.; Carter, T.R.; Dendoncker, N.; Ewert, F.; House, J.I.; Kankaanpää, R.; Leemans, R.; Metzger, M.J.; et al. A coherent set of future land use change scenarios for Europe. Agric. Ecosyst. Environ. 2006, 114, 57–68. [Google Scholar] [CrossRef]
  8. Löw, F.; Prishchepov, F.; Waldner, F.; Dubovyk, O.; Akramkhanov, A.; Biradar, C.; Lamers, J. Mapping Cropland Abandonment in the Aral Sea Basin with MODIS Time Series. Remote Sens. 2018, 10, 159. [Google Scholar] [CrossRef] [Green Version]
  9. Alcántara, C.; Kuemmerle, T.; Prishchepov, A.V.; Radeloff, V.C. Mapping abandoned agriculture with multi-temporal MODIS satellite data. Remote Sens. Environ. 2012, 124, 334–347. [Google Scholar] [CrossRef]
  10. Estel, S.; Kuemmerle, T.; Alcántara, C.; Levers, C.; Prishchepov, A.V.; Hostert, P. Mapping farmland abandonment and recultivation across Europe using MODIS NDVI time series. Remote Sens. Environ. 2015, 163, 312–325. [Google Scholar] [CrossRef]
  11. Yin, H.; Prishchepov, A.V.; Kuemmerle, T.; Bleyhl, B.; Buchner, J.; Radeloff, V.C. Mapping agricultural land abandonment from spatial and temporal segmentation of Landsat time series. Remote Sens. Environ. 2018, 210, 12–24. [Google Scholar] [CrossRef]
  12. Grădinaru, S.R.; Kienast, F.; Psomas, A. Using multi-seasonal Landsat imagery for rapid identification of abandoned land in areas affected by urban sprawl. Ecol. Indic. 2019, 96, 79–86. [Google Scholar] [CrossRef]
  13. Schrivastava, R.J.; Gebelein, J.L. Land cover classification and economic assessment of citrus groves using remote sensing. ISPRS J. Photogramm. Remote Sens. 2007, 61, 341–353. [Google Scholar] [CrossRef]
  14. Ramírez, M.; Martínez, L.; Montilla, M.; Sarmiento, O.; Lasso, J.; Diaz, S. Obtaining agricultural land cover in Sentinel-2 satellite images with drone image injection using Random Forest in Google Earth Engine. Rev. Teledetección 2020, 56, 35–48. [Google Scholar]
  15. Campos-Taberner, M.; García-Haro, F.J.; Martínez, B.; Gilabert, M.A. Deep learning for agricultural land use classification from Sentinel-2. Rev. Teledetección 2020, 56, 35–48. [Google Scholar] [CrossRef]
  16. Vajsová, B.; Fasbender, D.; Wirnhardt, C.; Lemajic, S.; Devos, W. Assessing Spatial Limits of Sentinel-2 Data on Arable Crops in the Context of Checks by Monitoring. Remote Sens. 2020, 12, 2195. [Google Scholar] [CrossRef]
  17. Vajsová, B.; Fasbender, D.; Wirnhardt, C.; Lemajic, S.; Sima, A.; Astrand, P. Applicability Limits of Sentine-2 Data Compared to Higher Resolution Imagery for CAP Checks by Monitoring; JRC Technical Report: JRC115564; Publications Office of the European Union: Luxembourg, 2019; ISBN 978-92-76-01935-0. [Google Scholar]
  18. Morell-Monzó, S.; Estornell, J.; Sebastiá-Frasquet, M.T. Comparison of Sentinel-2 and High-Resolution Imagery for Mapping Land Abandonment in Fragmented Areas. Remote Sens. 2020, 12, 2062. [Google Scholar] [CrossRef]
  19. Feng, Q.; Liu, J.; Gong, J. UAV Remote Sensing for Urban Vegetation Mapping Using Random Forest and Texture Analysis. Remote Sens. 2015, 7, 1074–1094. [Google Scholar] [CrossRef] [Green Version]
  20. Haralick, M.R.; Shanmugan, K.; Distein, I. Textural Features for Image Classification. IEEE Trans. Syst. Man Cybern. 1973, 3, 610–620. [Google Scholar] [CrossRef] [Green Version]
  21. Wang, L.; He, D.-C. Texture classification using texture spectrum. Pattern Recognit. 1990, 23, 905–910. [Google Scholar] [CrossRef]
  22. Laws, K.I. Texture Image Segmentation. Ph.D. Dissertation, University Southern California, Los Angeles, CA, USA, January 1980. [Google Scholar]
  23. Jain, A.K.; Farrokhnia, F. Unsupervised texture segmentation using Gabor filters. Pattern Recognit. 1991, 24, 1167–1186. [Google Scholar] [CrossRef] [Green Version]
  24. Mallat, S.G. A theory for multiresolution signal decomposition: The wavelet representation. IEEE Trans. Pattern Anal. Mach. Intell. 1989, 11, 674–693. [Google Scholar] [CrossRef] [Green Version]
  25. Balaguer, A.; Ruiz, L.A.; Hermosilla, T.; Recio, J.A. Definition of a comprehensive set of texture semivariogram features and their evaluation for object-oriented image classification. Comput. Geosci. 2010, 36, 231–240. [Google Scholar] [CrossRef]
  26. Hall-Beyer, M. Practical guidelines for choosing GLCM textures to use in landscape classification tasks over a range of moderate spatial scales. Int. J. Remote Sens. 2017, 38, 1312–1338. [Google Scholar] [CrossRef]
  27. Lan, Z.; Liu, Y. Study on Multi-Scale Window Determination for GLCM Texture Description in High-Resolution Remote Sensing Image Geo-Analysis Supported by GIS and Domain Knowledge. ISPRS Int. J. Geo-Inf. 2018, 7, 175. [Google Scholar] [CrossRef] [Green Version]
  28. Wang, H.; Zhao, Y.; Pu, R.; Zhang, Z. Mapping Robinia Pseudoacacia Forest Health Conditions by Using Combined Spectral, Spatial, and Textural Information Extracted from IKONOS Imagery and Random Forest Classifier. Remote Sens. 2015, 7, 9020–9044. [Google Scholar] [CrossRef] [Green Version]
  29. Jia, L.; Zhou, Z.; Li, B. Study of SAR Image Texture Feature Extraction Based on GLCM in Guizhou Karst Mountainous Region. In Proceedings of the 2012 2nd International Conference on Remote Sensing, Environment and Transportation Engineering, Nanjing, China, 1–3 June 2012.
  30. Stumpf, A.; Kerle, N. Object-oriented mapping of landslides using Random Forests. Remote Sens. Environ. 2011, 115, 2564–2577. [Google Scholar] [CrossRef]
  31. Gil-Yepes, J.L.; Ruiz, L.A.; Recio, J.A.; Balaguer-Beser, A.; Hermosilla, T. Description and validation of a new set of object-based temporal geostatistical features for land-use/land-cover change detection. ISPRS J. Photogramm. Remote Sens. 2016, 121, 77–91. [Google Scholar] [CrossRef]
  32. Ruiz, L.A.; Recio, J.A.; Fernández-Sarría, A.; Hermosilla, T. A feature extraction software tool for agricultural object-based image analysis. Comput. Electron. Agric. 2011, 76, 284–296. [Google Scholar] [CrossRef] [Green Version]
  33. Recio, J.A.; Hermosilla, T.; Ruiz, L.A.; Palomar, J. Automated extraction of tree and plot-based parameters in citrus orchards from aerial images. Comput. Electron. Agric. 2013, 90, 24–34. [Google Scholar] [CrossRef]
  34. Amorós-López, J.; Izquierdo-Verdiguier, E.; Gómez-Chova, L.; Muñoz-Marí, J.; Rodríguez-Barreiro, J.Z.; Camps-Valls, G.; Calpe-Maravilla, J. Multi-stage robust scheme for citrus identification from high resolution airborne images. In Image and Spatial Processing for Remote Sensing XIV, 1st ed.; Bruzzone, L., Notarnicola, C., Posa, F., Eds.; SPIE: Cardiff, UK, 2008; Volume 7109, p. 710908. [Google Scholar]
  35. Viñals, M.J. Secuencias Estratigráficas y Evolución Morfológica del Extremo Meridional del Golfo de Valencia (Cullera-Dénia). In El Cuaternario del País Valenciano, 1st ed.; Universitat de València-AEQUA: Valencia, Spain, 1995. [Google Scholar]
  36. Viñals, M.J. El Marjal de Oliva-Pego: Geomorfología y Evolución de un Humedal Costero Mediterráneo, 1st ed.; Conselleria de Agricultura y Medio Ambiente, Generalitat Valenciana: Valencia, Spain, 1996. [Google Scholar]
  37. Geleralitat Valenciana. Portal Estadístico de la Generalitat Valenciana. Fichas Municipales 2020. Available online: http://www.pegv.gva.es/es/fichas (accessed on 25 December 2020).
  38. Ilich, A. GLCMTextures. Available online: http://doi.org/10.5281/zenodo.4310187 (accessed on 25 December 2020).
  39. R Core Team. R: A Language and Environment for Statistical Computing; R Foundation for Statistical Computing: Viena, Austria, 2020; Available online: https://www.R-project.org/ (accessed on 25 December 2020).
  40. Huang, X.; Liu, X.; Zhang, L. A Multichannel Gray Level Co-Ocurrence Matrix for Multi/Hyperspectral Image Texture Representation. Remote Sens. 2014, 6, 8424–8445. [Google Scholar] [CrossRef] [Green Version]
  41. Akar, Ö.; Güngör, O. Integrating multiple texture methods and NDVI to the Random Forest classification algorithm to detect tea and hazelnut plantation areas in northeast Turkey. Int. J. Remote Sens. 2015, 36, 442–464. [Google Scholar] [CrossRef]
  42. Jin, Y.; Liu, X. Land-cover mapping using Random Forest classification and incorporating NDVI time-series and texture: A case study of central Shandong. Int. J. Remote Sens. 2018, 39, 8703–8723. [Google Scholar] [CrossRef]
  43. Hall-Beyer, M. GLCM Texture: A Tutorial v. 3.0 March 2017. PRISM Univ. Calg. Digit. Repos. 2017. [Google Scholar] [CrossRef]
  44. Breiman, L. Random Forests—Random Features; Technical Report 567; Statistics Department, University of California: Berkeley, CA, USA, 1999. [Google Scholar]
  45. Gislason, P.O.; Benediktsson, J.A.; Sveinsson, R.J. Random Forests for land cover classification. Pattern Recognit. Lett. 2006, 27, 294–300. [Google Scholar] [CrossRef]
  46. Pal, M. Random forest classifier for remote sensing classification. Int. J. Remote Sens. 2005, 26, 217–222. [Google Scholar] [CrossRef]
  47. Breiman, L. Random Forests. Mach. Learn. 2001, 45, 5–32. [Google Scholar] [CrossRef] [Green Version]
  48. Liaw, A.; Wiener, M. Classification and regression by randomForest. R News 2002, 2, 18–22. [Google Scholar]
  49. Kunh, M. Caret: Classification and Regression Training, R package version 4.0.3; 2020. Available online: https://cran.r-project.org/web/packages/caret/caret.pdf (accessed on 25 December 2020).
  50. Ghorbanian, A.; Kakooei, M.; Amani, M.; Mahdavi, S.; Mohammadzadeh, A.; Hasanlou, M. Improved land cover map of Iran using Sentinel imagery withing Google Earth Engine and novel automatic workflow for land cover classification using migrated training samples. ISPRS J. Photogramm. Remote Sens. 2020, 167, 276–288. [Google Scholar] [CrossRef]
  51. Wulder, M.A.; Coops, N.C.; Roy, D.P.; White, J.C.; Hermosilla, T. Land cover 2.0. Int. J. Remote Sens. 2018, 39, 4254–4284. [Google Scholar] [CrossRef] [Green Version]
  52. Kursa, M.B.; Rudncki, A. Feature Selection with Boruta Package. J. Stat. Softw. 2010. Available online: https://www.jstatsoft.org/article/view/v036i11 (accessed on 25 December 2020).
  53. Degenhardt, F.; Seifert, S.; Szymczak, S. Evaluation of variable selection methods for random forests and omics data sets. Brief. Bioinform. 2017, 20, 492–503. [Google Scholar] [CrossRef] [Green Version]
  54. Kumar, S.S.; Shaikh, T. Empirical Evaluation of the Performance of Feature Selection Approaches on Random Forests. In Proceedings of the 2017 International Conference on Computer and Applications (ICCA), Doha, United Arab Emirates, 6–7 September 2017. [Google Scholar]
  55. Kursa, M.B.; Jankowski, A.; Rudnicki, W.R. Boruta—A system for Feature Selection. Fundam. Inform. 2010, 101, 271–285. [Google Scholar] [CrossRef]
  56. Franklin, S.E.; Wulder, M.A.; Lavigne, M.B. Automated derivation of geographic window sizes for use in remote sensing digital image texture. Comput. Geosci. 1996, 22, 665–673. [Google Scholar] [CrossRef]
Figure 1. Aerial view of the three types of plots classified: (a) abandoned, (b) in production and (c) not in production.
Remotesensing 13 00681 g001
Figure 2. Study area. On the left the Comunitat Valenciana (CV) region and the study areas: (a) Oliva, (b) Bellreguard-Almoines, (c) Benicull-Polinyà del Xúquer and (d) Nules. On the right the main study area in Oliva municipality and the plots classified during the field survey.
Remotesensing 13 00681 g002
Figure 3. Workflow describing the image processing and classification.
Remotesensing 13 00681 g003
Figure 4. Random Forest models training history. The plot shows the evolution of the out-of-bag error as the number of trees increases. All models converge before training 100 decision trees.
Remotesensing 13 00681 g004
Figure 5. Example of reducing salt and pepper noise by adding Gray Level Co-Occurrence Matrix (GLCM) textural features. The noise decreases as the window size increases and this causes an increase in the accuracy of the pixel-based classification. (a) true color image, (b) spectral model classification, (c) 3 × 3 GLCM model classification, (d) 5 × 5 GLCM model classification, (e) 9 × 9 GLCM model classification, (f) plot-based classification.
Remotesensing 13 00681 g005
Figure 6. Land abandonment map of the Oliva municipality in 2019.
Remotesensing 13 00681 g006
Figure 7. Land abandonment map obtained in the complementary areas: (a) Bellreguard / Almoines, (b) Benicull / Polinyà del Xuquer, (c) Nules.
Remotesensing 13 00681 g007
Figure 8. Feature importance ranking of each model. The red line indicates the limit of significance in the Boruta test.
Remotesensing 13 00681 g008
Figure 9. Recursive pruning of the best model (Spectral + 9 × 9 GLCM features). The complete model contains 11 features. These features were recursively eliminated according to the Boruta ranking without eliminating spectral characteristics. The last pruning contains only the 4 spectral bands.
Remotesensing 13 00681 g009
Table 1. Reference data and image acquisition date in each study area.
Study AreaPlots Number Reference Data AcquisitionImage Acquisition Date
Oliva (a)240Field survey 114 and 15 May 2019
Bellreguard-Almoines (b)90Photointerpretation14 May 2019
Benicull-Polinyà del Xúquer (c)90Photointerpretation15 June 2019
Nules (d)90Photointerpretation17 June 2019
1 The field survey was conducted between 11 and 14 July 2019.
Table 2. Average accuracy of each model in pixel-based classification and plot-based classification through an 8-folds cross validation.
ModelAverage Pixel AccuracyStandard Deviation Pixel AccuracyAverage Plot AccuracyStandard Deviation Plot Accuracy
Spectral features0.710.040.910.07
Spectral + 3 × 3 GLCM features0.840.030.950.05
Spectral + 5 × 5 GLCM features0.860.030.950.05
Spectral + 7 × 7 GLCM features0.860.030.950.06
Spectral + 9 × 9 GLCM features0.870.030.950.04
Table 3. Precision, recall, and F1-score averages of each model through 8-folds cross-validation.
ModelPrecisionRecallF1-Score
Not in ProductionIn ProductionAbandonedNot in ProductionIn ProductionAbandonedNot in ProductionIn ProductionAbandoned
Spectral features0.940.900.920.990.860.880.960.870.89
Spectral + 3 × 3 GLCM features0.970.930.950.960.940.940.960.930.94
Spectral + 5 × 5 GLCM features0.970.930.950.960.940.940.960.930.94
Spectral + 7 × 7 GLCM features0.970.950.930.980.910.950.970.930.94
Spectral + 9 × 9 GLCM features0.960.960.940.980.910.960.960.920.95
Table 4. Average confusion matrix obtained through 8-folds cross-validation.
Reference
Not in ProductionIn ProductionAbandonedAverage User’s Accuracy
PredictedNot in production0.980.040.010.95
In production0.010.910.030.96
Abandoned0.010.050.960.94
Average Producer’s Accuracy0.980.910.96
Table 5. Overall accuracy the in complementary areas.
Overall accuracyProducer’s AccuracyUser’s Accuracy
Not in ProductionIn ProductionAbandonedNot in ProductionIn productionAbandoned
Bellreguard-Almoines (b)0.981.01.00.931.00.940.91
Benicull-Polinyà del Xúquer (c)0.881.00.930.700.860.850.95
Nules (d)0.921.00.970.830.910.910.96
Average0.931.00.970.820.920.910.97
Publisher’s Note: MDPI stays neutral with regard to jurisdictional claims in published maps and institutional affiliations.

