
The DLR FireBIRD Small Satellite Mission: Evaluation of Infrared Data for Wildfire Assessment


1
German Aerospace Center (DLR), German Remote Sensing Data Center (DFD), Münchener Str. 20, 82234 Oberpfaffenhofen, Germany
2
The Remote Sensing Technology Institute (IMF), Münchener Str. 20, 82234 Oberpfaffenhofen, Germany
*
Author to whom correspondence should be addressed.
Remote Sens. 2021, 13(8), 1459; https://doi.org/10.3390/rs13081459
Submission received: 1 March 2021
/
Revised: 4 April 2021
/
Accepted: 7 April 2021
/
Published: 9 April 2021
(This article belongs to the Special Issue Proximal and Remote Sensing in the MWIR and LWIR Spectral Range)
Abstract
:Wildfires significantly influence ecosystem patterns and processes on a global scale. In many cases, they pose a threat to human lives and property. Through greenhouse gas emissions, wildfires also directly contribute to climate change. The monitoring of such events and the analysis of acquired data is crucial for understanding wildfire and ecosystem interactions. The FireBIRD small satellite mission, operated by the German Aerospace Center (DLR), was specifically designed for the detection of wildfires. It features a higher spatial resolution than available with other Earth-observation systems. In addition to the detection of active fire locations, the system also allows the derivation of fire intensity by means of the Fire Radiative Power (FRP). This indicator can be used as a basis to derive the amount of emitted pollutant, which makes it valuable for climate studies. With the FireBIRD mission facing its end of life in 2021, this study retrospectively evaluates the performance of the system through an inter-comparison with data from two satellite missions of the National Aeronautics and Space Administration (NASA) and discusses the potential of such a system. The comparison is performed regarding both geometrical and radiometric aspects, the latter focusing on the FRP. This study uses and compares two different methods to derive the FRP from FireBIRD data. The data are analyzed regarding six major fire incidents in different regions of the world. The FireBIRD results are in accordance with the reference data, showing a geometrical overlapping rate of 83% and 84% regarding MODIS (Moderate-resolution Imaging Spectroradiometer) and VIIRS (Visible Infrared Imaging Radiometer Suite) overpasses in close temporal proximity. Furthermore, the results show a positive bias in FRP of about 11% compared to MODIS.
Keywords:
wildfire assessment; FireBIRD; TET-1; BIROS; active fire; MODIS; VIIRS; fire radiative power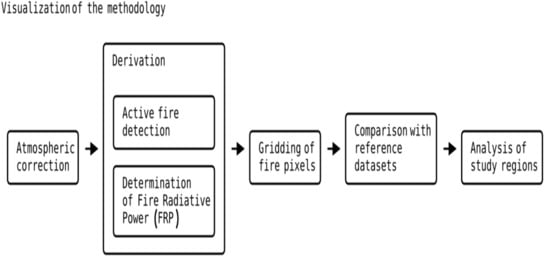
1. Introduction
Wildfires represent a predominant disturbance factor in a variety of biomes worldwide. They have played a crucial role in affecting the Earth’s surface for millions of years [1]. Van Wees and van der Werf could show that forest loss has increased significantly in many parts of the world since 2000, and that these dynamics are strongly linked to fire [2]. Next to direct fire effects such as impact on human lives and property, wildfire events have been found to considerably contribute to global warming through GHG (greenhouse gas) emissions [3,4]. Consecutively, the quantification of the amount of gaseous and particulate pollutants emitted through burning vegetation represents a major focus on global change studies [5]. Satellite remote sensing provides the means to monitor large geographical areas, with recurrence cycles of several times per day. The use of spaceborne, thermal sensors does not only allow the derivation of the spatial extent and temporal duration of ongoing fire events, but also enables the determination of the burn intensity. This measure is usually derived in the form of the Fire Radiative Power (FRP). It is directly related to the amount of ignited biomass at the moment of the satellite’s overpass, which in turn can be used as a proxy for the amount of emitted pollutant [6].
FireBIRD is a satellite constellation consisting of two small satellites, which are specifically designed for the detection of high temperature anomalies. The mission is operated by the German Aerospace Center (DLR). Both satellites carry an infrared camera system receptive in the mid- and long wave infrared ranges (MWIR/LWIR), as well as in the visible and near-infrared (NIR) ranges [7]. The sensor system has been named HSRS (Hot Spot Recognition System). Opposed to the MWIR and LWIR instrument, the NIR sensor is not oriented in nadir direction, but faces a 6 backward orientation. It can therefore not be used in conjunction with the aforementioned bands. The sensor system’s spatial resolution of 178 m is superior to mid-resolution systems currently in operation, such as the MODIS (Moderate-resolution Imaging Spectroradiometer) instrument onboard the National Aeronautics and Space Administration (NASA) Aqua/Terra satellites and the VIIRS (Visible Infrared Imaging Radiometer Suite) sensor onboard the Suomi-NPP (Suomi National Polar-orbiting Partnership) as well as NOAA-20 (National Oceanic and Atmospheric Administration) satellites. The same applies to the SLSTR (Sea and Land Surface Temperature Radiometer) instrument onboard the Sentinel-3 A/B satellites, which are operated by ESA (European Space Agency). Although the thermal anomalies products of MODIS and VIIRS have been available for years and represent the de-facto standard in satellite-based, global active fire monitoring, the SLSTR product has been published only recently. With this dataset, active fire detections are available for the mid-morning and evening low-Earth orbit timeslots, similar to MODIS Terra. The used algorithm has been found to detect fires of lower FRP compared to MODIS [8]. It is available through the ESA World Fire Atlas [9], which is still in a prototypical state at the time of writing. Comparisons between MODIS and VIIRS regarding FRP have been performed by Li et al. [10,11], who found that especially fires of low intensity are regularly missed in the MODIS MOD14A1 product (see [12]). Moreover, in the wildfire domain, FireBIRD FRP data has been used in the field of volcano activity assessment (see [13,14]). Satellite missions with higher spatial resolution, such as Landsat-TIRS (Thermal Infrared Sensor) or Sentinel-2 MSI (MultiSpectral Instrument), feature a prolonged recurrence cycle of several days before they can observe a region of interest a second time. Since wildfires often only last for some days, these systems are not suited for fire monitoring purposes.
Unlike the mentioned missions, FireBIRD is not a continuously recording system. Data acquisitions need to be triggered for each specific incident by human interaction. Comparisons with other data sources are therefore only possible for selected occasions. Equivalent to HSRS, the spectral bands of MODIS, VIIRS, and SLSTR also allow the derivation of the FRP. This information is included in the MODIS MOD14A1 [12], VIIRS VNP14A1 [15], and the SLSTR FRP products, respectively. All three datasets are based on approaches developed by Wooster et al. [5,16] to derive the FRP, which primarily use information from the MWIR spectral range. To allow comparability of FireBIRD data with the reference data sources, this study uses the above-mentioned method to derive FRP information from FireBIRD data. Additionally, a further method developed by Dozier [17] is tested and compared to the approach by Wooster et al. This latter method uses information from both the MWIR as well as the LWIR range.
2. Materials and Methods
This study analyzes and evaluates thermal anomaly data acquired by the two experimental small satellites of the DLR FireBIRD mission, namely the Technology Experiment Carrier-1 (TET-1) and the Berlin InfraRed Optical System (BIROS). To assess the spatial and radiometric accuracy of the data, two widely used datasets are used as references. These are, first, the NASA MOD14A1 thermal anomaly product [12], derived from the MODIS sensor onboard the Aqua and Terra satellites. Secondly, the NASA VNP14A1 product [15], based on data from the VIIRS sensor onboard Suomi-NPP. These reference datasets can be acquired through the NASA Fire Information for Resource Management System (FIRMS [18]).
The first satellite, TET-1, has been launched in July 2012, with BIROS following in June 2016. They are configured to fly sun-synchronously in a low-Earth orbit at approximately 560 km altitude. Although BIROS is still active, TET-1 has reached his end of life and has thus been decommissioned in 2020. With both satellites in orbit, the potential repetition rate was less than three days with across track acquisitions. Table 1 shows an overview of the FireBIRD mission and the specifications for each HSRS sensor.
The FireBIRD HSRS is a push broom sensor system with a ground sampling distance of 178 m for the infrared channels. Using double sampling, each pixel is recorded with two different integration times of 4000 μs and 500 μs, respectively. The first value is suited for normal temperature observations.
However, acquisitions using this setting suffer from saturation of the infrared bands when high temperature events above 900 K are recorded [20]. This effect does not occur when the shorter integration time is used. To obtain high quality results, each recording is done using both integration times simultaneously. The acquisition lines of both integration times are then combined in a post processing step, yielding an increased radiometric dynamic range without band saturation. This process is called band staggering. It allows a spatial sampling step size of only half the effective pixel size [13].
Due to this high resolution combined with high radiometric sensitivity, the FireBIRD sensors allow a more detailed analysis of active fires compared to MODIS and VIIRS [21].
All processing steps, which were performed in this study in order to allow a comparison between the different systems, are depicted in Figure 1.
Both the MWIR and the LWIR spectral range can be used to discriminate high temperature areas on the Earth’s surface. However, according to the Wien’s displacement law, the MWIR band is better suited for the detection than LWIR, since higher temperature events have a higher radiant power at shorter wavelengths. The method developed by Wooster [5] et al. exclusively uses MWIR band information to derive the FRP. This method is known to be very robust, and has thus been selected as the method of choice for the MOD14A1 and VNP14A1 products. However, this method is only satisfactorily applicable for high temperature events, which range between 600 K and 1500 K. For fire events of less intensity, the method is known to underestimate the actual intensity [6]. To circumvent this shortcoming, the bi-spectral method can be used, which uses both the MWIR as well as to LWIR band [17]. This method allows for a more accurate determination of FRP for lower intensity fire events. However, the requirement of an exact co-registration of both bands makes this method vulnerable to disturbances. Both methods, the bi-spectral one and the one by Wooster et al., are used and compared in this research. For convenience, the method by Wooster is referred to as MWIR, while the bi-spectral method is referred to as MWIR/LWIR in consecutive sections.
2.1. Atmospheric Correction of FireBIRD Infrared Band Information
To obtain results of optimal quality, the top-of-atmosphere (TOA) HSRS radiance data has to be calibrated regarding radiometric parameters. As a first step, all nadir looking channels (MWIR, LWIR, and the red channel in case of daytime acquisitions) are co-registered using the MWIR band as reference image. Consecutively, the stacked images are geo-coded manually to obtain an accurate positioning on the Earth’s surface, using auxiliary data such as administrative boundaries, roads, and rivers. Several further external data sources are required in order to perform the atmospheric correction [14]:
- The emissivity of the surface is derived from the ASTER (Advanced Spaceborne Thermal Emission and Reflection Radiometer) GED (Global Emissivity Database [22]). Unfortunately, the ASTER sensor does not feature a MWIR band. Therefore, the emissivity can only be derived using the LWIR information. The emissivity of the combined ASTER bands at 8.6 μm and 9.1 μm is used as these bands are similar to the LWIR band of HSRS. A high spatial resolution global MWIR emissivity database is not available. Therefore, following Salisbury and D’Aria [23] and Giglio et al. [24], the approximation was chosen for the processing since it was found to be more valid than the regularly used assumption of .
- Since atmospheric water vapor, which strongly influences the radiation, cannot be derived from the available HSRS bands, the dataset of the MODIS MOD05 water vapor product [25] featuring the shortest temporal distance to the FireBIRD acquisition is used as an external source.
- As the water vapor also depends on the topographical elevation of the ground, the ASTER GDEM (Global Digital Elevation Model [26]) is used as an auxiliary dataset during the atmospheric correction. This correction is based on look-up tables derived from the MODTRAN-5 radiative transfer code [27]. Finally, the resulting MWIR and LWIR surface radiances are converted to surface temperatures according to Planck’s equation.
The processing steps of the atmospheric correction are described consecutively. An exhaustive description is provided by Klein et al. [6]. The following equations are taken from this source without alteration. The surface radiance is calculated using the following formula:
k refers to the channel index (1 for MWIR, 2 for LWIR), is the thermal path radiance, is the atmospheric ground-to-sensor transmittance, is the emissivity, is the surface radiance, T is the surface temperature, and is the downwelling thermal flux on the surface. The MWIR signal is slightly influenced by the solar irradiation (). Therefore, during daytime, Equations (2) and (3) have to be used for the MWIR channel to calculate .
is the MWIR surface reflectance, is the solar zenith angle, is the MWIR extraterrestrial solar irradiance, is the atmospheric nadir transmittance. The exponent represents the transmittance of the slant path corresponding to .
2.2. FireBIRD Active Fire Detection and Analysis at Subpixel Level
2.2.1. Active Fire Detection
The fire detection method is similar to the method originally developed for the HSRS onboard the BIRD satellite, the precursor of the FireBIRD mission [28]. BIRD featured the same MWIR and LWIR band ranges as FireBIRD. In the updated version used for FireBIRD, the red band is used to exclude cloud and sun glint pixels for daytime scenes, instead of the NIR band. First, a threshold is applied to the MWIR/LWIR band surface temperature in order to derive potential fire pixels. Secondly, the final fire pixels are derived using a contextual approach.
2.2.2. FRP Derivation
As described above, two different approaches are performed for the derivation of the FRP. First, the MWIR method by Wooster [5] is used, which represents a straightforward approach by exclusively using the MWIR information (Equation (4)):
and are the MWIR radiances of the fire as well as the background pixels, respectively. is a constant depending on the MWIR channel spectral response function of the corresponding sensor.
The second approach follows the bi-spectral method of Dozier [17]. The following system of nonlinear Equation ((5)) has to be solved in order to derive the subpixel temperature of the fire () and the fraction of the pixel covered by fire p.
MWIR and LWIR surface radiances of the potential fire pixels are used as an input for these equations. They can be solved for the two unknowns ( and p), given that the background temperature is known. Using the MWIR/LWIR approach, the FRP is derived as the difference of the power of the subpixel temperature and the background temperature using Equation (6). The multiplication of the pixel size and p yields , which represents the subpixel area of the active fire (in m2).
2.3. Gridding
To allow a comparison of the results from FireBIRD as well as the MODIS and VIIRS reference data considering their differing spatial resolutions, each identified active fire location is assigned to a grid cell in a homogenous, hexagonal grid. The H3 Hexagonal Hierarchical Spatial Index [29] is used to obtain a mesh of grid cells, in which each cell covers an equally sized area of the Earth’s surface. This geospatial indexing further allows the efficient aggregating and querying of the study site data. An approximate cell size of 1 km2 is used. This size reflects the resolution of the MODIS thermal sensor at nadir. Due to geometric distortions towards the edge of the swath, a MODIS active fire pixel can actually cover an area of a size up to several square kilometers. A grid size thus coarse, however, would diminish the advantages of the HSRS sensor’s higher resolution, which is one of the study points in this research.
Since the FireBIRD as well as the reference sensors all feature differing spatial resolutions, the FRP values are normalized by area using the exact size of the respective pixel, yielding a measure of FRP per ha. In case of the MODIS and VIIRS reference data, the archived vector product from the FIRMS website is used, where each point represents merely the centroid of the original raster pixel. The size of the original pixel is therefore calculated using the respective attribute fields (scan and track, respectively). For each pixel centroid, the correlating grid cell is determined and the normalized FRP value for each fire pixel is stored for each cell. The average is determined consecutively. These steps are performed separately for each sensor, as well as for each overpass. As a reference, the entirety of vector points featuring the closest temporal and spatial vicinity to the respective FireBIRD overpass is selected from the original FIRMS dataset.
2.4. Methodology of Comparison
The comparison of FireBIRD data to the reference datasets are analyzed regarding the following criteria. The term fire grid cellsubsequently refers to a cell in the hierarchical grid containing at least one active fire location. Accordingly, the term non-fire grid cell refers to a grid cell where this is not the case.
- True positives (TP): The ratio between the number of fire grid cells in the FireBIRD data which correspond to the reference data, and the total number of fire grid cells in this reference data.
- False negatives (FN): The ratio between the number of non-fire grid cells in the FireBIRD data which do not correspond to the reference data, and the total number of fire grid cells in this reference data.
- False positives (FP): The ratio between the number of fire grid cells in the FireBIRD data which do not correspond to the reference data, and the total number of fire grid cells in this reference data. To illustrate that the given number refers to fire grid cells supplementary to the ones in the reference, the value 1.0 is added to represent those reference cells. The resulting ratio is therefore always ≥1.
The criterion of true negatives (TN) represents the ratio between the number of non-fire grid cells in the FireBIRD data which correspond to the reference data, and the total number of non-fire grid cells in the reference data. However, since the total number of grid cells not featuring active fires greatly predominates the number of cells which do, this true negative ratio is implicitly very close to 1. This is, however, mostly due to the size of the study region. This measure therefore does not represent a meaningful value for this kind of study. The same applies to the overall accuracy [30]. These measures have therefore been omitted in the statistical analysis.
2.5. Description of Study Regions
For the selection of study sites, the wildfire mapping activations of the Center for Satellite-Based Crisis Information (ZKI) at the German Aerospace Center (DLR) have been used as a guideline. The study sites presented in Table 2 comprise all six activations primarily based on FireBIRD data for the years of 2016 to 2020.
3. Results and Discussion
This chapter lists the results of the performed analysis in both graphical and tabular form. The following figures (Figure 3, Figure 4, Figure 5, Figure 6, Figure 7 and Figure 8) depict the FireBIRD data for all six areas of interest, alongside with the reference data from MODIS and VIIRS. Since the MWIR method shows the greatest correspondence between all datasets, this method is used as the basis for the FireBIRD figures. The visualizations show the mean FRP of the sensor acquisitions of the three different satellite systems. The values are normalized by area using the respective spatial resolution of each sensor, yielding a measure of FRP in MW per ha. The color gradient from blue to yellow indicates the increasing of values on a range from below 0.25 MW/ha to above 2.5 MW/ha. The Figure 3, Figure 5, Figure 7 and Figure 8 show composites of several overpasses of each sensor for each study region, which results in a denser filling of the grids than would be possible with a single overpass. This is due to the shifting of coordinate center points between overpasses, and is especially recognizable in the MODIS visualizations.
Table A1 lists the analysis results, separated by FireBIRD overpass. This table is placed in the appendix section. For each overpass of FireBIRD, the closest overpass of Aqua/Terra MODIS as well as Suomi-NPP VIIRS is specified. The column Offset (min) indicates how temporally far apart the overpass of the reference satellite was, compared to FireBIRD. The values of the other columns are given in ratios of FireBIRD results in relation to the respective reference, if not specified otherwise. All parameters are determined using the MWIR as well as the MWIR/LWIR method. The columns cells and ref cells indicate how many of the grid cells intersect with active fire data from FireBIRD and the reference, respectively. Based on these values, the column cell ratio indicates the correspondence between both datasets. The column TP FRP ratio illustrates the relationship of the mean FRP values contained in the FireBIRD and the reference data for grid cells where both sensors recorded active fires (true positives). Equivalent to this, the column TP mean bias shows the averaged sum of FRP bias values between FireBIRD and the reference data for each true positive. The columns TP, FN, and FP represent ratios of true positives, false negatives and false positives, as described in the methodology section.
Table 3 represents an extraction of Table A1. This shorter version shows the summarizing results instead of separate results for each overpass. It is important to note that these results are obtained by considering each individual data point contained within the complete set of overpasses, instead of averaging the overpass mean values. To assess the influence of the time lag between FireBIRD and the respective reference satellite, the concluding analysis is performed twice: Once considering only the FireBIRD overpasses with a time lag to the reference overpass of less than 45 min, yielding a subset of five overpasses. In a second step, the analysis is also conducted for the complete dataset, covering all 14 overpasses. This second run also takes data into account which shows a significant temporal difference between FireBIRD and the respective reference satellite. The result is thus less expressive. The results are separated by reference sensor. For each category, the upper row shows the results regarding MODIS, the lower one refers to VIIRS. All values are given in fractions (the result obtained with FireBIRD divided by the reference result).
The fire grid cells of the FireBIRD data which correspond to the reference is given in the first line, named true positives (TP). FireBIRD shows a spatial correspondence of 83% and 84% compared to MODIS and VIIRS, respectively, in case the MWIR method is used, and the analysis is performed on the dataset with similar acquisition time. When the complete dataset is analyzed, which shows time lags of up to 12 h, these numbers decrease to 75% and 54% regarding MODIS and VIIRS, respectively. The MWIR/LWIR method yields slightly fewer corresponding results for both datasets regarding MODIS. For VIIRS, the results show an identical correspondence for both methods regarding the subset, and a slight superiority of the MWIR method regarding the complete dataset.
The false negatives (FN), given in the next line of the table, indicate how much actual fires were missed, according to the reference. The MWIR method shows rates of 17% and 16% for the subset with a time lag of below 45 min, and 25% and 46% for the complete dataset. These values are complementary to the true positive values.
The false positives (FP) indicate fire locations detected by FireBIRD, which are not included in the reference data. A ratio of 1.0 refers to a perfect match between both data sources, meaning that no false positives occur. Accordingly, a ratio of 1.5 indicates an overestimation of 50%. Regarding the subset, HSRS shows an overestimation according to MODIS of 124%, while the comparison with VIIRS shows 78% additional area (referring to the number of affected grid cells). When using the full dataset, HSRS detects an additional area of 192% and 117% when compared to the area detected by MODIS and VIIRS, respectively. This does not inherently mean that the additional FireBIRD detections are false, however. In fact, this number rather reflects the increased detection capabilities facilitated by the higher spatial resolution and radiometric sensitivity of the HSRS sensor. Therefore, the term additional positives would be more appropriate. Such a situation is clearly observable in Figure 7, when comparing the results by HSRS and MODIS. Since it cannot be stated whether the false positives and false negatives are caused by shortcomings either in the FireBIRD data or in the reference data, only true positives, referring to fire locations detected by both FireBIRD and the reference, are considered for the radiometric analysis. This analysis is performed by a comparison of yielded FRP results between the systems.
Figure 4.
FireBIRD active fire data (derived using the MWIR method) and reference data for a fire event in Palestine and Israel, November 2016. (a) shows active fires derived from a single FireBIRD/HSRS overpass (25 November 2016), pigmented by FRP. (b) shows MODIS active fire data of the Aqua/Terra overpass in closest temporal vicinity to the respective FireBIRD overpass. (c) shows VIIRS active fire data of the Suomi-NPP overpass in closest temporal vicinity to the respective FireBIRD overpass. Background: Stamen/OpenStreetMap shaded terrain map, shown in gray scale.

Figure 5.
FireBIRD active fire data (derived using the MWIR method) and reference data for a fire event in Chile, January 2017. (a) shows active fires derived from two FireBIRD/HSRS overpasses (26–31 January 2017), pigmented by FRP. (b) shows MODIS active fire data of the Aqua/Terra overpasses in closest temporal vicinity to the respective FireBIRD overpasses. (c) shows VIIRS active fire data of the two Suomi-NPP overpasses in closest temporal vicinity to the respective FireBIRD overpasses. Background: Stamen/OpenStreetMap shaded terrain map, shown in gray scale.

As can be seen in the next line of the table, named TP FRP ratio, the FRP values derived from FireBIRD data are 11% higher on average than the reference data when the MWIR method is used on the subset with similar acquisition times. This result is in accordance with findings by Wooster et al. [5], who calculated a difference of 15% for the HSRS on the BIRD satellite with regard to a MODIS reference. In comparison to VIIRS, the FireBIRD average FRP values are 31% higher, representing a considerable bias with respect to MODIS. This is due to a lack of available FireBIRD active fire detections regarding the VIIRS reference, in the subset with a time lap of less than 45 min. Although the FireBIRD dataset with corresponding, timely MODIS overpasses contains 1398 fire detections in total (when using the LWIR method), only 346 detections are available for corresponding VIIRS overpasses. The MODIS results are thus considered to be more representative. Regarding the complete dataset, the difference to MODIS accounts for 24%, as well as 15% for VIIRS. When using the MWIR/LWIR method, the results range between 195% and 156% for both reference datasets.
The MWIR method shows a higher degree of correspondence than MWIR/LWIR between FireBIRD and the reference results, since the same method is used for both products. The bias regarding reference FRP values is significantly greater in most cases when the LWIR/MWIR method is used. However, since the MWIR method is known to underestimate low intensity fires (<600 K), the real FRP values must be considered to be higher, and thus closer to the results of the MWIR/LWIR method.
Although the methodology of deriving the FRP is different in these methods, they are both based on the same process of determining whether a pixel does contain an active fire. This means that the total number of determined active fires is identical for both methods. The slightly lower number when using the MWIR/LWIR method can be explained by the higher numerical complexity of the required subpixel analysis for this method. Detections are neglected when it is impossible to solve the calculation for and p numerically, as described in the methodology section. The MWIR method represents a simpler approach, which is advantageous in some cases because it is applicable to the complete set of active fire pixels.
Figure 6.
FireBIRD active fire data (derived using the MWIR method) and reference data for a fire event in California/USA, December 2017. (a) shows active fires derived from a single FireBIRD/HSRS overpass (12 December 2017), pigmented by FRP. (b) shows MODIS active fire data of the Aqua/Terra overpass in closest temporal vicinity to the respective FireBIRD overpass. (c) shows VIIRS active fire data of the Suomi-NPP overpass in closest temporal vicinity to the respective FireBIRD overpass. Background: Stamen/OpenStreetMap shaded terrain map, shown in gray scale.

Figure 7.
FireBIRD active fire data (derived using the MWIR method) and reference data for a fire event in California/USA, November 2018. (a) shows active fires derived from four FireBIRD/HSRS overpasses (10–21 November 2018), pigmented by FRP. (b) shows MODIS active fire data of the Aqua/Terra overpasses in closest temporal vicinity to the respective FireBIRD overpasses. (c) shows VIIRS active fire data of the Suomi-NPP overpasses in closest temporal vicinity to the respective FireBIRD overpasses. Background: Stamen/OpenStreetMap shaded terrain map.

The analysis of the subset as well as the full dataset shows, as expected, that the FireBIRD results are more similar to the reference the closer the overpass times of the sensors are to one another.
Several influencing factors have to be considered when interpreting the results of the accuracy analysis. First, the temporal difference in overpass times of the different sensors plays a significant role. This can be seen by the higher concordance of FireBIRD and reference results when only a short time lag (of less than 45 min) lies between the overpasses, opposed to the results when the time lag is not considered (as can be seen on the left-hand and right-hand side of Table 3, respectively). Since the development of the fire front line can be very dynamic, and biomass consumption can happen at a rapid pace, detections at different points in time necessarily show considerable differences. Also, a complete change in atmospheric and near-surface conditions could occur between two overpasses: Clouds could appear or vanish, and smoke plumes may cover areas which have clearly been visible previously. Secondly, the significant differences in spatial resolutions of FireBIRD and the reference datasets represent a further parameter that may distort the significance and validity of the results. Thirdly, due to the rather low accuracy of the FireBIRD geolocation system, all scenes have to be geo-coded and rectified. Since the presented analysis requires an exact spatial matching of FireBIRD and reference data, an inadequate rectification introduces inaccuracies. Finally, the observation angle limits the sensor’s possibility to distinguish different features. Detection accuracy generally declines with a higher off-nadir angle, which makes the comparison of observations resulting from differing angles error prone.
Figure 8.
FireBIRD active fire data (derived using the MWIR method) and reference data for a fire event in New South Wales/Australia, November 2019. (a) shows active fires derived from two FireBIRD/HSRS overpasses (9 November 2019 and 14 November 2019), pigmented by FRP. (b) shows MODIS active fire data of the Aqua/Terra overpasses in closest temporal vicinity to the respective FireBIRD overpasses. (c) shows VIIRS active fire data of the Suomi-NPP overpasses in closest temporal vicinity to the respective FireBIRD overpasses. Background: Stamen/OpenStreetMap shaded terrain map.

4. Conclusions
The results presented here are based on an inter-comparison between different sensors. Several influencing factors complicate the derivation of exact results. Nevertheless, this methodology is regarded as the most appropriate way under real-world conditions. It could be shown that the FireBIRD system shows a satisfactory performance, featuring a spatial concordance of 83% compared to MODIS and 84% compared to VIIRS when the reference overpass occurs in close temporal proximity. FireBIRD generally detects a higher number of active fires than the reference sensors, which can be attributed to its higher spatial resolution and radiation sensitivity. The radiometric accuracy regarding FRP is high when the MWIR method is used, which is the same one as in the reference products. With this method, the bias in FRP is 11% on average compared to MODIS, regarding the subset with low temporal differences between the overpasses.
The similarity is lower for the VIIRS reference regarding the subset, accounting for a bias of 31%. This difference can be attributed to the lower expressiveness of this subset, due to a lack of available FireBIRD active fire detections. The analysis of the complete dataset, irrespective of overpass times, yields a positive bias of 15% for VIIRS. This number rises considerably when the MWIR/LWIR method is used. However, considering that the MWIR method is known to underestimate FRP, real intensity values can be regarded to range between the results of both methods. The FireBIRD data is thus found to show high similarity in results compared to the MODIS and VIIRS references, both regarding the accuracy in geometry and radiometry. Furthermore, the additional use of the LWIR band is beneficial for the derivation of FRP regarding fires with low intensity.
In conclusion, FireBIRD is a highly capable system in terms of radiometric sensitivity and spatial accuracy. It enables the monitoring and analysis of individual fire events with a higher resolution than available with other Earth-observation systems. Although experimental, FireBIRD features performance parameters similar to leading satellite/sensor systems such as Aqua/Terra MODIS and Suomi-NPP/NOAA-20 VIIRS, and thus demonstrates the operability of small satellite missions. The operation of such satellites in a constellation setting would allow for a high repetition rate and an improved workload balance, and thereby diminishes the requirement that scene acquisitions still have to be tasked manually.
Author Contributions
Conceptualization, M.N., S.P., D.K. and T.R.; Data curation, M.N. and S.P.; Formal analysis, M.N.; Methodology, M.N., S.P. and R.R.; Project administration, D.K.; Supervision, D.K. and T.R.; Validation, M.N.; Visualization, M.N.; Writing—original draft, M.N.; Writing—review & editing, M.N., S.P., R.R., D.K. and T.R. All authors have read and agreed to the published version of the manuscript.
Funding
This research received no external funding.
Data Availability Statement
FireBIRD data is available through the DLR-EOC EOWEB® GeoPortal (https://eoweb.dlr.de/egp/). A registration is required. MODIS and VIIRS active fire data is available through the NASA Fire Information for Resource Management System (FIRMS, https://firms.modaps.eosdis.nasa.gov).
Conflicts of Interest
The authors declare no conflict of interest.
Appendix A

Table A1.
Inter-comparison of DLR FireBIRD and NASA MODIS/VIIRS active fire results. The values in the two bottom rows, named subset and complete dataset, are derived from all detected fires in all overpasses, and do not represent average values of the overpasses listed above. The abbreviation TP refers to true positives, FN and FP refer to false negatives and false positives, respectively.
| Sensor | Timestamp UTC | Cells | Mean FRP | Reference | Offset (min) | Ref Cells | Ref Mean FRP | Cell Ratio | TP FRP Ratio | TP Mean Bias (MW) | TP | FN | FP | ||||||||
|---|---|---|---|---|---|---|---|---|---|---|---|---|---|---|---|---|---|---|---|---|---|
| MWIR | MWIR/ LWIR | MWIR | MWIR/ LWIR | MWIR | MWIR/ LWIR | MWIR | MWIR/ LWIR | MWIR | MWIR/ LWIR | MWIR | MWIR/ LWIR | MWIR | MWIR/ LWIR | MWIR | MWIR/ LWIR | ||||||
| Portugal 2016/08 | |||||||||||||||||||||
| TET-1 | 2016/08/11, 13:35:32 | 113 | 110 | 0.53 | 0.78 | M6/Aqua | −48 | 13 | 0.32 | 8.69 | 8.46 | 2.88 | 3.16 | 0.36 | 0.41 | 0.62 | 0.62 | 0.38 | 0.38 | 9.08 | 8.85 |
| V1/Suomi-NPP | −24 | 68 | 0.75 | 1.66 | 1.62 | 0.99 | 1.32 | −0.01 | 0.26 | 0.82 | 0.81 | 0.18 | 0.19 | 1.84 | 1.81 | ||||||
| TET-1 | 2016/08/12, 02:28:55 | 89 | 88 | 0.52 | 0.79 | M6/Aqua | 5 | 49 | 0.29 | 1.82 | 1.8 | 2.41 | 3.39 | 0.5 | 0.86 | 0.76 | 0.73 | 0.24 | 0.27 | 2.06 | 2.06 |
| V1/Suomi-NPP | 10 | 68 | 0.59 | 1.31 | 1.29 | 1.12 | 1.64 | 0.08 | 0.42 | 0.88 | 0.88 | 0.12 | 0.12 | 1.43 | 1.41 | ||||||
| TET-1 | 2016/08/13, 13:51:32 | 58 | 54 | 1.02 | 1.21 | M6/Aqua | −20 | 21 | 0.76 | 2.76 | 2.57 | 1.4 | 1.59 | 0.42 | 0.62 | 0.52 | 0.52 | 0.48 | 0.48 | 3.24 | 3.05 |
| V1/Suomi-NPP | 29 | 34 | 1.84 | 1.71 | 1.59 | 0.81 | 0.89 | −0.37 | −0.21 | 0.88 | 0.88 | 0.12 | 0.12 | 1.82 | 1.71 | ||||||
| TET-1 | 2016/08/14, 02:44:57 | 71 | 70 | 0.25 | 0.35 | M6/Aqua | 33 | 16 | 0.15 | 4.44 | 4.38 | 1.65 | 2.68 | 0.11 | 0.26 | 0.88 | 0.81 | 0.12 | 0.19 | 4.56 | 4.56 |
| V1/Suomi-NPP | −36 | 38 | 0.17 | 1.87 | 1.84 | 3.06 | 3.88 | 0.27 | 0.38 | 0.76 | 0.76 | 0.24 | 0.24 | 2.11 | 2.08 | ||||||
| Palestine 2016/11 | |||||||||||||||||||||
| TET-1 | 2016/11/25, 11:19:03 | 15 | 14 | 0.13 | 0.53 | M6/Aqua | 76 | 3 | 0.08 | 5.0 | 4.67 | None | None | None | None | 0.0 | 0.0 | 1.0 | 1.0 | 6.0 | 5.67 |
| V1/Suomi−NPP | 31 | 6 | 1.36 | 2.5 | 2.33 | 0.2 | 0.72 | −1.27 | −0.45 | 0.83 | 0.83 | 0.17 | 0.17 | 2.67 | 2.5 | ||||||
| Chile 2017/01 | |||||||||||||||||||||
| TET-1 | 2017/01/26, 06:37:54 | 1137 | 1083 | 0.96 | 1.85 | M6/Aqua | 29 | 583 | 1.1 | 1.95 | 1.86 | 0.96 | 1.8 | −0.05 | 1.01 | 0.85 | 0.82 | 0.15 | 0.18 | 2.1 | 2.03 |
| V1/Suomi-NPP | −675 | 441 | 1.01 | 2.58 | 2.46 | 1.05 | 1.72 | 0.05 | 0.73 | 0.54 | 0.52 | 0.46 | 0.48 | 3.04 | 2.94 | ||||||
| TET-1 | 2017/01/31, 06:24:03 | 43 | 41 | 0.25 | 0.4 | M6/Aqua | −3 | 7 | 0.13 | 6.14 | 5.86 | 3.91 | 7.29 | 0.33 | 0.72 | 0.71 | 0.71 | 0.29 | 0.29 | 6.43 | 6.14 |
| V1/Suomi-NPP | 46 | 33 | 0.29 | 1.3 | 1.24 | 1.29 | 1.88 | 0.09 | 0.29 | 0.73 | 0.7 | 0.27 | 0.3 | 1.58 | 1.55 | ||||||
| California/US 2017/12 | |||||||||||||||||||||
| TET-1 | 2017/12/12, 11:30:12 | 118 | 116 | 0.54 | 0.82 | M6/Aqua | 142 | 28 | 0.17 | 4.21 | 4.14 | 3.95 | 6.06 | 0.62 | 1.06 | 0.43 | 0.43 | 0.57 | 0.57 | 4.79 | 4.71 |
| V1/Suomi-NPP | 74 | 51 | 0.39 | 2.31 | 2.27 | 2.69 | 3.71 | 0.73 | 1.2 | 0.8 | 0.78 | 0.2 | 0.22 | 2.51 | 2.49 | ||||||
| California/US 2018/11 | |||||||||||||||||||||
| TET-1 | 2018/11/10, 00:19:25 | 126 | 125 | 0.65 | 0.72 | M6/Aqua | 223 | 21 | 0.74 | 6.0 | 5.95 | 1.11 | 1.22 | 0.09 | 0.19 | 0.57 | 0.57 | 0.43 | 0.43 | 6.43 | 6.38 |
| V1/Suomi-NPP | 188 | 101 | 1.23 | 1.25 | 1.24 | 0.64 | 0.7 | −0.45 | −0.37 | 0.98 | 0.98 | 0.02 | 0.02 | 1.27 | 1.26 | ||||||
| TET-1 | 2018/11/12, 13:14:28 | 137 | 128 | 0.87 | 0.98 | M6/Aqua | 192 | 66 | 0.59 | 2.08 | 1.94 | 2.11 | 2.13 | 0.72 | 0.76 | 0.79 | 0.76 | 0.21 | 0.24 | 2.29 | 2.18 |
| V1/Suomi-NPP | 161 | 120 | 0.57 | 1.14 | 1.07 | 1.77 | 1.85 | 0.48 | 0.54 | 0.85 | 0.83 | 0.15 | 0.17 | 1.29 | 1.23 | ||||||
| TET-1 | 2018/11/14, 13:19:13 | 91 | 91 | 0.43 | 1.4 | M6/Aqua | 209 | 9 | 0.16 | 10.11 | 10.11 | 3.78 | 10.27 | 0.43 | 1.42 | 0.56 | 0.56 | 0.44 | 0.44 | 10.56 | 10.56 |
| V1/Suomi-NPP | 203 | 2 | 0.85 | 45.5 | 45.5 | 0.59 | 3.5 | −0.35 | 2.12 | 0.5 | 0.5 | 0.5 | 0.5 | 46.0 | 46.0 | ||||||
| BIROS | 2018/11/21, 05:17:39 | 23 | 23 | 0.14 | 0.4 | M6/Terra | 640 | 1 | 0.06 | 23.0 | 23.0 | None | None | None | None | 0.0 | 0.0 | 1.0 | 1.0 | 24.0 | 24.0 |
| V1/Suomi-NPP | −246 | 4 | 0.1 | 5.75 | 5.75 | 3.23 | 9.09 | 0.19 | 0.71 | 0.75 | 0.75 | 0.25 | 0.25 | 6.0 | 6.0 | ||||||
| New South Wales/AU 2019/11 | |||||||||||||||||||||
| BIROS | 2019/11/09, 23:14:29 | 783 | 744 | 0.35 | 0.49 | M6/Terra | −285 | 290 | 0.49 | 2.7 | 2.57 | 0.98 | 1.23 | −0.01 | 0.13 | 0.65 | 0.64 | 0.35 | 0.36 | 3.05 | 2.93 |
| V1/SUOMI-NPP | -219 | 437 | 0.52 | 1.79 | 1.7 | 0.89 | 1.11 | −0.07 | 0.07 | 0.5 | 0.49 | 0.5 | 0.51 | 2.29 | 2.22 | ||||||
| BIROS | 2019/11/14, 23:11:33 | 222 | 203 | 0.41 | 0.56 | M6/Terra | 516 | 27 | 0.2 | 8.22 | 7.52 | 3.81 | 4.55 | 1.05 | 1.33 | 0.26 | 0.26 | 0.74 | 0.74 | 8.96 | 8.26 |
| V1/SUOMI−NPP | −228 | 370 | 0.69 | 0.6 | 0.55 | 0.38 | 0.54 | −0.54 | −0.4 | 0.12 | 0.11 | 0.88 | 0.89 | 1.48 | 1.44 | ||||||
| Subset t < 45 min | 0.84 | 1.56 | 6.43 | 2.26 | 2.16 | 1.11 | 1.97 | 0.0 | 0.97 | 0.83 | 0.81 | 0.17 | 0.19 | 2.24 | 2.17 | ||||||
| 9.29 | 7.13 | 6.82 | 1.31 | 1.75 | −0.03 | 0.23 | 0.84 | 0.84 | 0.16 | 0.16 | 1.78 | 1.73 | |||||||||
| Complete dataset | 0.65 | 1.11 | 172.93 | 2.67 | 2.55 | 1.24 | 1.95 | 0.07 | 0.76 | 0.75 | 0.73 | 0.25 | 0.27 | 2.92 | 2.82 | ||||||
| 155.0 | 1.71 | 1.63 | 1.15 | 1.56 | 0.0 | 0.31 | 0.54 | 0.52 | 0.46 | 0.48 | 2.17 | 2.11 | |||||||||
References
- Bowman, D.; Balch, J.; Artaxo, P.; Bond, W.; Carlson, J.; Cochrane, M.; D’Antonio, C.; DeFries, R.; Doyle, J.; Harrison, S. Fire in the Earth system. Science 2009, 324, 481–484. [Google Scholar] [CrossRef] [PubMed]
- van Wees, D.; van der Werf, G. The contribution of fire to a global increase in forest loss. In Proceedings of the EGU General Assembly Conference Abstracts, Vienna, Austria, 4–8 May 2020; European Geosciences Union: Vienna, Austria, 2020. [Google Scholar]
- Withey, K.; Berenguer, E.; Palmeira, A.; Espírito-Santo, F.; Lennox, G.; Silva, C.; Aragão, L.; Ferreira, J.; França, F.; Malhi, Y. Quantifying immediate carbon emissions from El Niño-mediated wildfires in humid tropical forests. Philos. Trans. R. Soc. B Biol. Sci. 2018, 373, 20170312. [Google Scholar] [CrossRef] [PubMed] [Green Version]
- Surawski, N.; Sullivan, A.; Roxburgh, S.; Polglase, P. Estimates of greenhouse gas and black carbon emissions from a major Australian wildfire with high spatiotemporal resolution. J. Geophys. Res. Atmos. 2016, 121, 9892–9907. [Google Scholar] [CrossRef]
- Wooster, M.J.; Zhukov, B.; Oertel, D. Fire radiative energy for quantitative study of biomass burning: Derivation from the BIRD experimental satellite and comparison to MODIS fire products. Remote Sens. Environ. 2003, 86, 83–107. [Google Scholar] [CrossRef]
- Klein, D.; Richter, R.; Strobl, C.; Schläpfer, D. Solar Influence on Fire Radiative Power retrieved with the Bispectral Method. IEEE Trans. Geosci. Remote Sens. 2019, 57, 4521–4528. [Google Scholar] [CrossRef]
- Halle, W.; Asam, S.; Borg, E.; Fischer, C.; Frauenberger, O.; Lorenz, E.; Klein, D.; Nolde, M.; Paproth, C.; Plank, S. FireBIRD—Small satellite or wild fire assessment. In Proceedings of the International Geoscience and Remote Sensing Symposium IGARSS, Valencia, Spain, 22–27 July 2018. [Google Scholar]
- Xu, W.; Wooster, M.J.; He, J.; Zhang, T. First study of Sentinel-3 SLSTR active fire detection and FRP retrieval: Night-time algorithm enhancements and global intercomparison to MODIS and VIIRS AF products. Remote Sens. Environ. 2020, 248, 111947. [Google Scholar] [CrossRef]
- European Space Agency (ESA). ESA Sentinel-3 World Fires Atlas Prototype. Available online: https://s3worldfireatlas.esa.int (accessed on 25 May 2020).
- Li, F.; Zhang, X.; Kondragunta, S.; Csiszar, I. Comparison of fire radiative power estimates from VIIRS and MODIS observations. J. Geophys. Res. Atmos. 2018, 123, 4545–4563. [Google Scholar] [CrossRef]
- Li, F.; Zhang, X.; Kondragunta, S. Biomass burning in Africa: An investigation of fire radiative power missed by MODIS using the 375 m VIIRS active fire product. Remote Sens. 2020, 12, 1561. [Google Scholar] [CrossRef]
- Giglio, L.; Justice, C. MOD14A1 MODIS/Terra Thermal Anomalies/Fire Daily L3 Global 1km SIN Grid V006 [Data Set]; NASA EOSDIS Land Processes DAAC: Sioux Falls, SD, USA, 2015. [CrossRef]
- Di Traglia, F.; Calvari, S.; D’Auria, L.; Nolesini, T.; Bonaccorso, A.; Fornaciai, A.; Esposito, A.; Cristaldi, A.; Favalli, M.; Casagli, N. The 2014 effusive eruption at Stromboli: New insights from in situ and remote-sensing measurements. Remote Sens. 2018, 10, 2035. [Google Scholar] [CrossRef] [Green Version]
- Plank, S.; Nolde, M.; Richter, R.; Fischer, C.; Martinis, S.; Riedlinger, T.; Schoepfer, E.; Klein, D. Monitoring of the 2015 Villarrica volcano eruption by means of DLR’s experimental TET-1 satellite. Remote Sens. 2018, 10, 1379. [Google Scholar] [CrossRef] [Green Version]
- Schroeder, W.; Giglio, L. VIIRS/NPP Thermal Anomalies/Fire Daily L3 Global 1km SIN Grid V001 [Data Set]; NASA EOSDIS Land Processes DAAC: Sioux Falls, SD, USA, 2018. [CrossRef]
- Wooster, M.J.; Xu, W.; Nightingale, T. Sentinel-3 SLSTR active fire detection and FRP product: Pre-launch algorithm development and performance evaluation using MODIS and ASTER datasets. Remote Sens. Environ. 2012, 120, 236–254. [Google Scholar] [CrossRef]
- Dozier, J. A method for satellite identification of surface temperature fields of subpixel resolution. Remote Sens. Environ. 1981, 11, 221–229. [Google Scholar] [CrossRef]
- National Aeronautics and Space Administration (NASA). Fire Information for Resource Management System (FIRMS). Available online: https://firms.modaps.eosdis.nasa.gov (accessed on 1 February 2021).
- German Aerospace Center (DLR). FireBIRD—A DLR Satellite System for Forest Fires and Early Fire Detection. German Aerospace Center (DLR) e.V., Oberpfaffenhofen-Wessling. Available online: https://www.dlr.de/firebird/PortalData/79/Resources/dokumente/FireBIRD_Broschuere_HighRes_v3_english.pdf (accessed on 2 February 2021).
- Atwood, E.C.; Englhart, S.; Lorenz, E.; Halle, W.; Wiedemann, W.; Siegert, F. Detection and characterization of low temperature peat fires during the 2015 fire catastrophe in Indonesia using a new high-sensitivity fire monitoring satellite sensor (FireBird). PLoS ONE 2016, 11, e0159410. [Google Scholar] [CrossRef] [PubMed] [Green Version]
- Fischer, C.; Klein, D.; Kerr, G.; Stein, E.; Lorenz, E.; Frauenberger, O.; Borg, E. Data Validation and Case Studies using the TET-1 Thermal Infrared Satellite System. Int. Arch. Photogramm. Remote Sens. Spat. Inf. Sci. 2015, XL-7/W3, 1177–1182. [Google Scholar] [CrossRef] [Green Version]
- Hulley, G.C.; Hook, S.J.; Abbott, E.; Malakar, N.; Islam, T.; Abrams, M. The ASTER Global Emissivity Dataset (ASTER GED): Mapping Earth’s emissivity at 100 meter spatial scale. Geophys. Res. Lett. 2015, 42, 7966–07976. [Google Scholar] [CrossRef]
- Salisbury, J.W.; D’Aria, D.M. Emissivity of terrestrial materials in the 3 μm to 5 μm atmospheric window. Remote Sens. Environ. 1994, 47, 345–361. [Google Scholar] [CrossRef]
- Giglio, L.; Kendall, J.D.; Justice, C.O. Evaluation of global fire detection algorithms using simulated AVHRR infrared data. Int. J. Remote Sens. 1999, 20, 1947–1985. [Google Scholar] [CrossRef]
- Gao, B.-C.; Kaufman, Y.J. Algorithm Technical Background Document. The MODIS Near-IR Water Vapor Algorithm Product ID: MOD05-Total Precipitable Water; Remote Sensing Division, Code 7212; Naval Research Laboratory: Washington, DC, USA, 1998. [Google Scholar]
- National Aeronautics and Space Administration (NASA). ASTER Global Digital Elevation Map Announcement. Available online: https://asterweb.jpl.nasa.gov/gdem.asp (accessed on 3 February 2021).
- Berk, A.; Hawes, F.; van den Bosch, J.; Anderson, G.P. MODTRAN5.4.0 User’s Manual; Spectral Sciences Inc.: Burlington, MA, USA, 2016. [Google Scholar]
- Zhukov, B.; Lorenz, E.; Oertel, D.; Wooster, M.; Roberts, G. Space-borne detection and characterization of fires during the bi-spectral infrared detection (BIRD) experimental small satellite mission (2001–2004). Remote Sens. Environ. 2006, 100, 29–51. [Google Scholar] [CrossRef]
- Uber Engineering. H3: Uber’s Hexagonal Hierarchical Spatial Index. Brodsky, I./Uber Engineering. Available online: https://eng.uber.com/h3/ (accessed on 4 February 2021).
- Plank, S.; Martinis, S. A fully automatic burnt area mapping processor based on AVHRR imagery—A timeline thematic processor. Remote Sens. 2018, 10, 341. [Google Scholar] [CrossRef] [Green Version]
- Thomson Reuters. Fires Kill 4 People in Portugal, 1000 Evacuated on Madeira; Khalip, A., Ed.; Thomson Reuters: New York City, NY, USA, 2016; Available online: https://www.reuters.com/article/us-portugal-wildfires-idUSKCN10L0W7 (accessed on 3 February 2021).
- Center for Satellite-Based Crisis Information (ZKI). DLR FireBIRD Mission Provides Data of Recent Fires in Portugal; ZKI/DLR: Oberpfaffenhofen, Germany, 2016; Available online: https://activations.zki.dlr.de/de/activations/items/ACT129.html (accessed on 4 February 2021).
- Thomson Reuters. Wildfires Tear Across Israel, Netanyahu Calls Arsonists ‘Terrorists’; Amichai, A., Ed.; Thomson Reuters: New York City, NY, USA, 2016; Available online: https://www.reuters.com/article/us-israel-fires-idUSKBN13J0YJ (accessed on 4 February 2021).
- Center for Satellite-Based Crisis Information (ZKI). DLR FireBIRD Mission Provides Data of Recent Fires in Israel and the West Bank; ZKI/DLR: Oberpfaffenhofen, Germany, 2016; Available online: https://activations.zki.dlr.de/de/activations/items/ACT131.html (accessed on 4 February 2021).
- Thomson Reuters. Chile Declares State of Emergency Due to Massive Wildfires; Esposito, A., Ed.; Thomson Reuters: New York City, NY, USA, 2017; Available online: https://www.reuters.com/article/us-chile-wildfire-idUSKBN1542XI (accessed on 4 February 2021).
- Center for Satellite-Based Crisis Information (ZKI). Fire Disaster in Chile—ZKI Uses FireBIRD to Deliver Situational Information; ZKI/DLR: Oberpfaffenhofen, Germany, 2017; Available online: https://activations.zki.dlr.de/de/activations/items/ACT133.html (accessed on 4 February 2021).
- Cable News Network (CNN). Southern California Fires Growing Quickly, Forcing Thousands to Evacuate; Vercammen, P., Ed.; CNN: Atlanta, GA, USA, 2017; Available online: https://edition.cnn.com/2017/12/05/us/ventura-county-fire-california/index.html (accessed on 4 February 2021).
- Center for Satellite-Based Crisis Information (ZKI). FireBIRD Monitors Forest Fires in California; ZKI/DLR: Oberpfaffenhofen, Germany, 2017; Available online: https://activations.zki.dlr.de/de/activations/items/act137.html (accessed on 4 February 2021).
- British Broadcasting Corporation (BBC). California Wildfire Declared ‘Largest in State’s History’; BBC: London, UK, 2018; Available online: https://www.bbc.com/news/world-us-canada-45093636 (accessed on 4 February 2021).
- Center for Satellite-Based Crisis Information (ZKI). Fire Disaster in California—DLR Supports with FireBIRD Data; ZKI/DLR: Oberpfaffenhofen, Germany, 2018; Available online: https://activations.zki.dlr.de/de/activations/items/ACT139.html (accessed on 4 February 2021).
- Thomson Reuters. Australia’s Massive Fires Could Become Routine, Climate Scientists Warn; Green, M., Ed.; Thomson Reuters: New York City, NY, USA, 2020; Available online: https://www.reuters.com/article/us-climate-change-australia-report/australias-massive-fires-could-become-routine-climate-scientists-warn-idUSKBN1ZD06W (accessed on 4 February 2021).
- Center for Satellite-Based Crisis Information (ZKI). FireBIRD Monitors Fires in Australia; ZKI/DLR: Oberpfaffenhofen, Germany, 2019; Available online: https://www.dlr.de/eoc/de/desktopdefault.aspx/tabid-13297/23615_read-59537 (accessed on 4 February 2021).
Figure 1.
Schematic representation of the processing workflow.

Figure 2.
Results of atmospheric correction and FRP derivation for a TET-1 overpass covering the fire event in California/US, 10 November 2018, at 19:25 UTC. (a) shows the atmospherically corrected MWIR band, together with a gray boundary indicating the derived fire pixels. Sub-figure (b) shows the same fire pixels with their subsequently derived FRP values.

Figure 3.
FireBIRD active fire data (derived using the MWIR method) and reference data for a fire event in northern Portugal, August 2016. (a) shows active fires derived from four FireBIRD/HSRS overpasses (11–14 August 2016), pigmented by FRP. (b) shows MODIS active fire data of the Aqua/Terra overpasses in closest temporal vicinity to the respective FireBIRD overpasses. (c) shows VIIRS active fire data of the Suomi-NPP overpasses in closest temporal vicinity to the respective FireBIRD overpasses. Background: Stamen/OpenStreetMap shaded terrain map, shown in gray scale.

| Mission | Satellite | Sensor | |||
|---|---|---|---|---|---|
| Orbit | 560 km sun-synchronous | Dimensions | 83 cm × 54 cm × 62 cm | Infrared Sensor | mid-infrared: 3.400–4.200 μm (Nadir), |
| Inclination | 97.6 | Total Mass | ca. 130 kg | thermal infrared: 8.500–9.300 μm (Nadir) | |
| Mission Operations | German Remote Sensing Data Center, German Space Operations Center | Payload Mass Infrared Sensor | ca. 14 kg | Optical Sensor | vis green: 0.460–0.560 μm (6 forward), vis red: 0.565–0.725 μm (Nadir), |
| Mission Planning | <1.5 years | Power | 200 W DC | near infrared: | |
| Mission Duration | >2.5 years | Communications | S-Band, UHF | 0.790–0.930 μm (6 backward) | |
Table 2.
Description of study incidents.
| Incident | Brief Description of the Wildfires Analyzed, as Reported by the Center for Satellite-Based Crisis Information (ZKI) |
|---|---|
| Portugal August 2016 | In August 2016, wildfires were raging in northern Portugal as well as on Madeira. An emergency has been declared for the region of Porto. Four persons were killed, and more than 1000 inhabitants had to be evacuated [31]. |
| ZKI: DLR FireBIRD mission provides data of recent fires in Portugal (19 August 2016, https://activations.zki.dlr.de/de/activations/items/ACT129.html [32]) | |
| Palestine & Israel November 2016 | Wildfires occurred in the Israeli forests west of Jerusalem as well as the West Bank in November 2016. The city of Haifa was severely affected, tens of thousands of people had to leave their homes. Fortunately, no deaths or serious injuries have been reported [33]. |
| ZKI: DLR FireBIRD mission provides data of recent fires in Israel and the West Bank (1 December 2016, https://activations.zki.dlr.de/de/activations/items/ACT131.html [34]) | |
| Chile January 2017 | Due to massive wildfire outbreaks, Chile had to declare a state of emergency after the fires had devastated an area of several thousands of square kilometers northeast of Concepción. The fires comprised 18 separate blazes, which were intensified by strong winds and a heat wave [35]. |
| ZKI: Fire disaster in Chile—ZKI uses FireBIRD to deliver situational information (24 January 2017, https://activations.zki.dlr.de/de/activations/items/ACT133.html [36]) | |
| California/USA December 2017 | Southern California experienced several rapidly moving brush fires in December 2017. Tens of thousands of residents had to be evacuated [37]. |
| ZKI: FireBIRD monitors forest fires in California (19 December 2017, https://activations.zki.dlr.de/de/activations/items/act137.html [38]) | |
| California/USA November 2018 | California suffered the largest wildfires in the state’s history in summer 2018. Several civilians were killed in the flames [39]. |
| ZKI: Fire disaster in California—DLR supports with FireBIRD data (15 November 2018, https://activations.zki.dlr.de/de/activations/items/ACT139.html [40]) | |
| New South Wales/Australia November 2019 | Fires devastated more than 11 mil. hectares in Australia in the fire season of 2019/2020. Over 2000 homes were destroyed, 28 persons have been killed [41]. |
| ZKI: FireBIRD monitors fires in Australia (27 November 2019, https://www.dlr.de/eoc/de/desktopdefault.aspx/tabid-13297/23615_read-59537 [42]) |
Table 3.
Results of the inter-comparison between FireBIRD and the reference datasets, regarding both the subset and the complete dataset. M6 refers to the MODIS MOD14A1 product (version 6) while V1 refers to the VIIRS VNP14A1 product (version 1).
Table 3.
Results of the inter-comparison between FireBIRD and the reference datasets, regarding both the subset and the complete dataset. M6 refers to the MODIS MOD14A1 product (version 6) while V1 refers to the VIIRS VNP14A1 product (version 1).
| Overpasses t < 45 min | All Overpasses (t < 12 h) | ||||
|---|---|---|---|---|---|
| MWIR | MWIR/LWIR | MWIR | MWIR/LWIR | ||
| True positive ratio | M6 | 0.83 | 0.81 | 0.75 | 0.73 |
| V1 | 0.84 | 0.84 | 0.54 | 0.52 | |
| False negative ratio | M6 | 0.17 | 0.19 | 0.25 | 0.27 |
| V1 | 0.16 | 0.16 | 0.46 | 0.48 | |
| False positive ratio | M6 | 2.24 | 2.17 | 2.92 | 2.82 |
| V1 | 1.78 | 1.73 | 2.17 | 2.11 | |
| TP FRP ratio | M6 | 1.11 | 1.97 | 1.24 | 1.95 |
| V1 | 1.31 | 1.75 | 1.15 | 1.56 | |
| TP mean bias (MW) | M6 | 0.0 | 0.97 | 0.07 | 0.76 |
| V1 | −0.03 | 0.23 | 0.0 | 0.31 | |
Publisher’s Note: MDPI stays neutral with regard to jurisdictional claims in published maps and institutional affiliations. |
© 2021 by the authors. Licensee MDPI, Basel, Switzerland. This article is an open access article distributed under the terms and conditions of the Creative Commons Attribution (CC BY) license (https://creativecommons.org/licenses/by/4.0/).
Share and Cite
MDPI and ACS Style
Nolde, M.; Plank, S.; Richter, R.; Klein, D.; Riedlinger, T. The DLR FireBIRD Small Satellite Mission: Evaluation of Infrared Data for Wildfire Assessment. Remote Sens. 2021, 13, 1459. https://doi.org/10.3390/rs13081459
AMA Style
Nolde M, Plank S, Richter R, Klein D, Riedlinger T. The DLR FireBIRD Small Satellite Mission: Evaluation of Infrared Data for Wildfire Assessment. Remote Sensing. 2021; 13(8):1459. https://doi.org/10.3390/rs13081459
Chicago/Turabian StyleNolde, Michael, Simon Plank, Rudolf Richter, Doris Klein, and Torsten Riedlinger. 2021. "The DLR FireBIRD Small Satellite Mission: Evaluation of Infrared Data for Wildfire Assessment" Remote Sensing 13, no. 8: 1459. https://doi.org/10.3390/rs13081459
Note that from the first issue of 2016, this journal uses article numbers instead of page numbers. See further details here.