
The Restoration Potential of the Grasslands on the Tibetan Plateau

State Key Laboratory of Grassland Agro-Ecosystems, Key Laboratory of Grassland Livestock Industry Innovation, Ministry of Agriculture and Rural Affairs, Engineering Research Center of Grassland Industry, Ministry of Education, College of Pastoral Agriculture Science and Technology, Lanzhou University, Lanzhou 730000, China
*
Author to whom correspondence should be addressed.
Remote Sens. 2022, 14(1), 80; https://doi.org/10.3390/rs14010080
Submission received: 3 December 2021
/
Revised: 20 December 2021
/
Accepted: 22 December 2021
/
Published: 24 December 2021
(This article belongs to the Topic Climate Change and Environmental Sustainability)
Abstract
:While the alpine grassland ecosystems on the Tibetan Plateau (TP) have generally improved in recent years, some grasslands still suffer from varying degrees of degradation. Studying the restoration potential (R) of the grasslands on the TP is crucial to the conservation and restoration of its alpine grassland ecosystems. Few studies have assessed the restoration value of the alpine grasslands on the TP. We attempt to estimate the actual (ANPP) and potential net primary productivity (PNPP) of the grasslands on the TP. On this basis, we defined R as the “gap” between the current and highest achievable levels of restoration of a grassland. Then, R estimates were yielded for the alpine grasslands on the TP, which we used to analyze the restoration value of these grasslands. Specifically, based on the meteorological data for the period 2001–2019, in conjunction with remote-sensing imagery acquired by a moderate-resolution imaging spectroradiometer for the same period, the Carnegie–Ames–Stanford approach model was selected to produce ANPP estimates for the grasslands on the TP. Then, the Thornthwaite memorial model, the principle of similar habitats, and the Chikugo model, were employed to generate PNPP estimates for these grasslands. In addition, the R of these grasslands was then assessed based on the difference between their PNPP and ANPP. The main results are summarized as follows. (1) A multiyear mean R of 332.33 g C·m–2 (81.59% of the ANPP) was determined for the grasslands on the TP over the period 2001–2019. A notable spatial distribution pattern of high Rs in the southwestern, eastern and middle parts of the TP, and low Rs in the northwestern part of the TP were also identified. Most of the grasslands in areas such as the southern part of Nagqu, the southwestern part of Ngari, Xigaze, Garze Tibetan Autonomous Prefecture, Aba Tibetan and Qiang Autonomous Prefecture, Gannan Tibetan Autonomous Prefecture, Huangnan Tibetan Autonomous Prefecture, Haibei Tibetan Autonomous Prefecture, Guoluo Tibetan Autonomous Prefecture and Yushu Tibetan Autonomous Prefecture were found to have high restoration value. (2) Grasslands with a stable R account were the highest proportion (76.13%) of all the grasslands on the TP, followed by those with a decreasing R (19.62%) and those with an increasing R (4.24%). Grasslands with an increasing R were mainly concentrated in the southern part of Xigaze, and parts of Yushu Tibetan Autonomous Prefecture, Guoluo Tibetan Autonomous Prefecture and Garze Tibetan Autonomous Prefecture. (3) Analysis based on the local conditions of the TP revealed a high restoration value for three types of grassland (i.e., alpine meadows, mountain meadows, and temperate meadow steppes), the grasslands distributed at altitudes of 3000–4000 m, and the grasslands located in the warm temperate zone. The results of this study are expected to provide scientific and theoretical support for the formulation of policies and measures aimed at conserving grasslands, as well as restoring ecosystems and degraded grasslands on the TP.
1. Introduction
Grasslands are one of the most widely distributed ecosystems across the globe and account for approximately 25% of the Earth’s land area [1]. In addition, grasslands are a vital natural resource and play an irreplaceable role in areas such as climate regulation, wind breaking, sand fixation, biodiversity conservation, water and soil conservation, and the maintenance of ecological balance. It also be noted that grassland around the world are faced with the risk of degradation [2]. This is particularly true for those on the Tibetan Plateau (TP), about half of which (49%) are alpine grasslands [2]. Although the alpine grassland ecosystems on the TP have generally improved in recent years, some grasslands still suffer from varying degrees of degradation. The unique ecological and environmental conditions on the TP present a tremendous challenge to grassland restoration once degradation occurs [3].
The restoration of grassland ecosystems depends strongly on the restoration of grassland vegetation [4]. Grassland restoration measures applied to the TP have included fertilization, reseeding, enclosure-assisted afforestation, and manual grassland cultivation. However, enclosure-assisted afforestation is a “double-edged sword,” as long-term enclosures may reduce the number of species, nutrient value, and soil fertility and may place stress on non-enclosed areas [3]. In recent years, the concept of close-to-nature (CTN) restoration has garnered extensive attention, and has been effectively applied to vegetation restoration. CTN restoration does not completely dispense with conventional manual restoration measures, but instead employs them to help an ecosystem achieve sustainable restoration primarily through self-regulation. This is also a measure suitable for alpine grassland restoration [5].
The groundwork for grassland restoration and ecological reconstruction should center on understanding the present and potential grassland distribution patterns within the study area, that is, answering scientific questions such as to what level the natural grasslands can be restored if the adverse factors are eliminated. Limitations in areas such as manpower, material resources, and policies determine which grasslands can be restored and conserved, so prioritizing the restoration of some degraded grassland areas is currently a relatively good option [6]. However, the CTN restoration potential (R) and spatial distribution pattern of the alpine grasslands on the TP remain unclear. Studying the R of the grasslands on the TP is vital to the conservation and restoration of its grassland ecosystems.
Net primary productivity (NPP) can accurately reflect the growth conditions of grassland vegetation, and is sensitive to climate change and human activity [7], making it a suitable metric for assessing the R of grasslands. Few studies have examined R, and they have used inconsistent methods, as evidenced by the following examples. Venter et al. [8] analyzed the degradation and R of vegetation in South Africa over the period 1986–2019, based on the trend of the enhanced vegetation index, calculated using Sen’s slope and the Mann–Kendall test. Gao et al. [9]. and Zhao et al. [10]. divided the Loess Plateau through superimposition of factors such as terrain, soil, vegetation, and climate, and assessed the R of the vegetation on the Loess Plateau based on the maximum vegetation coverage in certain areas that conformed to the principle of similar habitats (PSH), which states that areas with similar habitats are similar in the R of their vegetation. Li et al. [11]. developed a comprehensive R assessment model for sand vegetation in alpine river valleys using the analytic hierarchy process, combined with the fuzzy comprehensive evaluation method, to investigate the R of different types of sand vegetation. Emamian et al. [12]. determined the future potential restored vegetation conditions and the optimal areas for implementing restoration projects in northeastern Iran by analyzing two indices, the future restoration dispersal index and the future uncertainty dispersal index. Through the analysis of a “chronotoposequence”, De et al. [13]. discovered that grassland reestablishment could restore soil health in the midwestern United States, with the greatest improvements occurring at high altitudes. Gao et al. [14]. estimated the potential productivity of forests in the Chinese province of Jilin based on Paterson’s climate vegetation and productivity index model.
While few studies have investigated R, models have been extensively used to estimate potential NPP (PNPP). Many studies have calculated PNPP based on the improved Carnegie–Ames–Stanford approach (CASA) models: Pan and Xu [15] calculated the PNPP of vegetation in China from 1981 to 2015 through simulations by an improved CASA model, coupled with potential normalized difference vegetation index (NDVI) data. Li et al. [16]. calculated the PNPP using an improved CASA model and quantified the human impact on the NPP in the Shiyang River Basin over the period 2001–2014, based on the NPP estimates yielded by the CASA model. Lv et al. [17]. employed an improved CASA model to generate PNPP estimates for Larix principis-rupprechtii trees in China over the period 2001–2010. Ren et al. [18]. produced PNPP estimates for natural vegetation in China from 1982 to 2012, through simulations performed using an improved comprehensive and sequential classification system in conjunction with an improved CASA model.
Other studies have adopted the Thornthwaite memorial (TM) model to estimate PNPP: Li et al. [19]. estimated the PNPP in Inner Mongolia over the period 1982–2015 using an improved TM model, and on this basis analyzed the impact of climate change and human activity on the grasslands in this region through NPP analysis. Based on the TM model, Sun et al. [20]. calculated an annual mean PNPP of 1314 g C·m–2 for the vegetation in Yunnan, Guizhou, and Sichuan over 2007–2016. Zhang et al. [21]. estimated PNPP for the Shiyang River Basin over 1999–2007, based on the TM model. Jahelnabi et al. [22]. used the TM model to estimate the PNPP of the vegetation in the Gadarif State in eastern Sudan. Yin et al. [23]. produced PNPP and actual NPP (ANPP) estimates for the Hengduan Mountains based on the TM and CASA models, to represent the impact of human activity on the ANPP based on its difference from the PNPP. Zhou et al. [24]. calculated the ANPP and PNPP in the Heihe River Basin from 2001 to 2010, based on the CASA and TM models driven by several types of data, and used the difference between these two measures to represent the impact of human activity on NPP in an effort to evaluate the impacts of human activity and climate change on desertification.
Some studies have employed other models to estimate PNPP. For example, Del Grosso et al. [25]. developed a model based on precipitation and temperature (termed as the National Center for Ecological Analysis and Synthesis model) to calculate the global PNPP, which they compared with the results yielded by the Miami and Schuur models. Wu et al. [26]. produced PNPP estimates for the city of Guangzhou based on the Chikugo model, and combined them with ANPP estimates yielded by the CASA model to establish a relative contribution index to quantitatively analyze and evaluate the impact of human activity on NPP. Tsunekawa et al. [27]. identified potential hotspot areas of desertification and land degradation by comparing PNPP and ANPP estimates yielded by the Chikugo model, and an improved CASA model. Based on the classification indices-based (CI) model, Lin et al. [28] generated NPP estimates for potential terrestrial vegetation in China over 1961–2006, and calculated an annual range of 1.93–4.54 Pg C for the total NPP of potential terrestrial vegetation in China under present climatic conditions [29]. Zhao et al. [30] employed the CI model to yield NPP estimates for each potential type of vegetation in Inner Mongolia over the period 1982–2009, based on an integrated orderly classification system.
The aforementioned studies have the following main shortcomings: (1) only a few studies have investigated the R of alpine grasslands, and the definition of and methods used to study R are inconsistent; (2) most studies are focused on the impact of climate and human activity on NPP, while only a few assess R; (3) only one method is employed to produce PNPP or R estimates, and they lack controls for comparison.
The TP region is less disturbed by human activities and is an ideal region to study climate and environmental changes [31]. In reality, even without human disturbances, there are many kinds of natural abiotic (e.g., drought) and biotic (e.g., natural grazing) disturbances. In this study, we define PNPP as the top-level in the TP, which not only excludes human disturbances, but also excludes all natural abiotic and biotic disturbances. PNPP is an ideal top-level state, which may not be necessarily achievable in reality.
We attempted to estimate the ANPP and PNPP of the grasslands on the TP, and defined R as the “gap” between the current and highest achievable levels (theoretic) of restoration of a grassland. Then, R estimates were produced for the alpine grasslands on the TP, and were used to analyze the restoration value of these grasslands. Specifically, the CASA model was selected to generate ANPP estimates, whereas the TM model, the PSH, and the Chikugo models were used to produce PNPP estimates (referred to as PNPP1, PNPP2, and PNPP3, respectively). The difference between the PNPP and ANPP of a grassland was defined as its R. In addition, the R of the grasslands on the TP and its trend over the period 2001–2019 were quantified. The degradation conditions and restoration value of the grasslands on the TP were analyzed based on their R. The results of this study can be used to scientifically identify the current level of restoration, R, and restoration value of different grasslands, and they can provide empirical support for guiding grassland restoration on the TP and relevant R calculation methods.
2. Materials and Methods
2.1. Overview of the Study Area
With an area of approximately 257.24 × 10⁴ km2 (accounting for one-third of China’s total grassland area and approximately 26.8% of China’s total land area), the TP (26°00′12″–39°46′50″N, 73°18′52″–104°46′59″E) is as an important pastoral region of China that extends across a total of 201 county-level administrative divisions in six provincial regions (Qinghai, Tibet, Xinjiang, Sichuan, Gansu, and Yunnan). This region has a wealth of grassland resources, and is home to 17 wide-ranging types of grassland, including alpine steppes, alpine meadows, alpine meadow steppes, and alpine deserts [32] (Figure 1).
2.2. Data Sources and Preprocessing
2.2.1. Meteorological Data
The interpolated monthly precipitation and temperature data for the periods 2001–2019 used in this study were obtained from the National Earth System Science Data Center, National Science and Technology Infrastructure of China (http://www.geodata.cn, accessed on 12 September 2021). The reliability estimation of the dataset has been verified by Peng et al. [33] (spatial resolution: 1 km).
2.2.2. Total Solar Radiation (SOL) Data
Monthly total SOL was calculated using the Area Solar Radiation tool of ArcGIS software. The digital elevation model (DEM) data used in this study that originated from the Shuttle Radar Topography Mission data (spatial resolution: 90 m) (http://srtm.csi.cgiar.org/, accessed on 11 September 2021.) was published by the United States National Aeronautics and Space Administration (NASA) [34]. The data were resampled to 1 km for subsequent analysis. The DEM data were also used to calculate PNPP2.
2.2.3. Moderate-Resolution Imaging Spectroradiometer (MODIS) Data
The MOD13A3 and MCD43A4 products provided by NASA’s earth observing system data and information system were used in this study. The MOD13A3 product provided monthly NDVI data with a spatial resolution of 1 km. The MCD43A4 product provided daily MODIS band 1–7 surface albedo data, corrected by the bidirectional reflectance distribution function and with a spatial resolution of 500 m. In this study, MODIS band 2 and 6 data extracted from the MCD43A4 product were used to calculate the land surface water index (LSWI), which was input into the CASA model to calculate NPP.
The abovementioned data were subjected to three treatments, namely, format conversion, mosaicking, and projection, using the MODIS reprojection tool. The processed data were in Geo-TIFF format, and were projected onto the World Geodetic System (WGS)-1984 Albers coordinate system. In addition, all the data were resampled to 1 km and cropped to produce imagery data for the TP. Moreover, monthly LSWI data were synthesized using the maximum-value composite (MVC) technique for subsequent analysis [35].
2.2.4. Grassland Type Data and Climate Zone Data
2.3. ANPP
The CASA model—currently the most commonly used tool for estimating NPP [38]—was selected to yield the NPP estimates. This model estimated NPP primarily based on the absorbed photosynthetically active radiation (APAR) and light-use efficiency ε through the following Equation (1):
where SOL is the total solar radiation (MJ·m–2), calculated using a digital elevation model in ArcGIS software [34]; FPAR is the fraction of the photosynthetically active radiation absorbed by the vegetation canopy, which depends on the NDVI and its maximum and minimum values, the simple ratio index and its maximum and minimum values, and the FPAR and its maximum and minimum values for each vegetation type (see Zhu et al. [38] for the detailed calculation procedure); ε is the light-use efficiency (g C·m–2), which is calculated from the monthly mean temperature, the mean temperature of the optimal month for plant growth, the LSWI, and the maximum light-use efficiency in ideal conditions ε* (ε* was set in this study to the global general value of 0.389 g C·m–2) (see Xu et al. for the detailed calculation procedure) [39].
2.4. PNPP
2.4.1. TM Model
The TM is employed in this study to estimate PNPP1. This model was developed through the incorporation of a revised variant of the Thornthwaite potential evapotranspiration model to the Miami model, and its effectiveness has been confirmed in previous research. Specifically, the TM model estimates PNPP1 based on the relationship between evapotranspiration and carbon sequestration, with precipitation and temperature as inputs. This approach is more accurate than that used by the Miami model [19]. PNPP1 is calculated using the following Equations (2)–(4):
where PNPP1 is the annual potential net primary productivity (g C·m–2), v is the actual annual mean evapotranspiration (mm), L is the annual mean evapotranspiration (mm), t is the annual mean temperature (°C), and r is the annual total precipitation (mm). The t and r values are derived from the spatially interpolated precipitation and temperature data for the study area for 2001–2019 (spatial resolution: 1 km; format: GeoTIFF; projected into the WGS-1984 Albers coordinate system).
2.4.2. PSH
The PSH is adopted to analyze the PNPP2 in the study area. The principle behind PSH is that areas with similar habitats are similar in terms of the ultimate level of restoration (i.e., R) of grasslands [9,10]. Based on this principle, the following procedure was used to analyze PNPP2. First, the grasslands on the TP were divided into 17 types (e.g., alpine steppes, alpine meadows, alpine meadow steppes, temperate steppes, and alpine deserts). Then, they were divided into six types by altitude: lower than 2000 m, 2000–3000 m, 3000–4000 m, 4000–5000 m, 5000–6000 m, and higher than 6000 m. Finally, they were divided into eight types based on the climate zone where they were located: the temperate, south subtropical, north subtropical, warm temperate, plateau subfrigid, plateau subtemperate, plateau frigid, and plateau temperate zones. The subsequent superimposition of the obtained types of grassland and masking of the non-grasslands yielded a total of 261 computational subareas. The mean NPP over the period 2001–2019 was calculated for each computational subarea. The maximum NPP in each subarea was considered its PNPP2.
2.4.3. Chikugo Model
The Chikugo model is used to produce PNPP3 estimates. Since it considers only four factors (i.e., radiation, evaporation, temperature, and precipitation), this model is suitable for calculating PNPP, as shown in the following Equations (5) and (6) [26]:
where RDI is the annual mean radiative dryness, Rn is the net radiation received by the land surface (MJ·m–2), L is the evaporative heat loss (mm), t is the annual mean temperature (°C), and r is the annual precipitation (mm). See Section 2.4.1 for the data and formats used to calculate PNPP3.
2.5. Restoration Potential (R)
The R of a natural grassland is defined as the difference between its PNPP and ANPP, as shown in the following Equations (7)–(9):
The procedure for using each of the TM and Chikugo models to calculate R is as follows. First, the selected model was used to calculate the PNPP for each year. Then, the maximum-value composite technique was employed to calculate the maximum PNPP (PNPPm1 and PNPPm3) over the period 2001–2019. Finally, Rk was determined by subtracting the mean ANPP over the 19-year period from PNPPm1 and PNPPm3. The calculation process based on PSH was relatively simple; it dose not need to use the maximum-value composite technique. The PNPP2 obtained in Section 2.4.2 was the PNPPm2 of PSH. The process is described in more detail below (Figure 2). The method of calculating Ra (the aboveground part of grassland) is the same as above.
2.6. Trend Analysis
Theil–Sen median trend analysis combined with the Mann–Kendall test was performed to evaluate the R trends and distribution patterns on the TP over the period 2001–2019. The results were categorized into five scenarios: a significant increase in R; a slight increase in R; a stable and unchanged R; a slight decrease in R; and a significant decrease in R. Due to a near absence of areas with an NPP slope of 0, the following rules were defined in this study, based on the actual situation for the Theil–Sen median analytical process: areas with NPP slopes below −3, between −3 and 3, and greater than 3 were considered to have undergone a decrease in R, no change in R, and an increase in R, respectively. The significance of the obtained trends was checked using the Mann–Kendall test at a 0.05 confidence level. The trends were considered statistically significant if Z > 1.96, or < −1.96, and statistically nonsignificant if −1.96 ≤ Z ≤ 1.96. The reader can see Yuan et al. and Gao et al. [40,41] for the detailed calculation procedure.
3. Results
3.1. Comparison of Three Types of R
Driven by the 2001–2019 PNPP and ANPP data for the TP, the TM model, the PSH, and the Chikugo model were used to calculate the mean R for the period 2001–2019. The means yielded by these three methods are referred to as the mean R1, R2, and R3, respectively. The mean R1, R2, and R3 were also averaged. The results are presented in Figure 3. Specifically, the mean R1, R2, and R3 were respectively 293.56, 647.62, and 55.82 g C·m−2,with an average of 332.33 g C·m−2. As can be easily seen in Figure 2, despite the difference between the mean R1, R2, and R3, the three methods yielded similar spatial R distribution patterns. R was high in the southwestern, eastern and middle parts of the TP, but with slightly low values in the northwestern part of the TP.
Figure 4 and Figure 5 show line graphs plotted based on the R data for the TP for the period 2001–2019, to depict the interannual variation of the R and Ra of the grasslands on the TP, respectively (in Figure 5, R1a, R2a, and R3a refer to the Ra values obtained using the TM model, the PSH, and the Chikugo model, respectively). Analysis of these two figures revealed the following. The R of the grasslands on the TP basically exhibited a tendency to level off over the 19-year period. The R reached its maximum of 349.27 g C·m−2 and its minimum of 316.90 g C·m−2 in 2008 and 2017, respectively. The interannual variation of Ra basically agreed with that of the overall R. The maximum (69.92 g C·m−2) and minimum (61.95 g C·m−2) values of Ra appeared in 2008 and 2001, respectively.
3.2. The Trends of R
The R data for the period 2001–2019 were examined by Theil–Sen median trend analysis. The significance of the results was checked by the Mann–Kendall test. On this basis, R trends were obtained for the TP for the period 2001–2019, as shown in Figure 6. Coupling analysis revealed five scenarios: significant upward, slight upward, stable, slight downward, and significant downward trends. As shown in Figure 6, grasslands with a decreasing R were concentrated primarily in the western and northern parts of the TP, whereas those with a decreasing R were located mainly in the central part of the TP. Overall, three types of R trend (upward, downward, and unchanged) could be identified from Figure 5 for the grasslands on the TP. Grasslands with a stable R account had the highest proportion (76.13%) of all the grasslands on the TP, followed by those with a decreasing R (19.62%) and those with a increasing R (4.24%).
3.3. R Analysis Based on the Type of Grassland
Figure 7 and Figure 8 show plots produced based on the R data for the period 2001–2019 to depict the multiyear mean R and interannual R trend of each type of grassland on the TP for 2001–2019, respectively. Analysis of these two figures identified tropical shrub tussocks, tropical tussocks, warm tussocks, and warm shrub tussocks as the types of grassland with high R values, ranging from approximately 510.21 to 619.71 g C·m–2 and fluctuating more significantly than those of other types of grassland. However, these four types of grassland accounted for a small proportion of the grasslands on the TP. In comparison, the figures also showed low and non-significant interannually fluctuating R for temperate steppe deserts, lowland meadows, temperate deserts, alpine desert steppes, temperate desert steppes, and alpine deserts, giving the restoration of these types of grassland low value. Alpine meadows, mountain meadows, and temperate meadow steppes, accounting for a large proportion of the grasslands on the TP, were associated with high Rs (412.46, 476.71, and 376.41 g C·m–2, respectively), with mountain meadows having the highest R of these four types of grassland.
3.4. Analysis of Grassland R by Altitude
Figure 9 is the spatial distribution of the altitude on the TP. It used the DEM data in Section 2.2.2. Figure 10 is a histogram of the R data for the period 2001–2019, showing the multiyear mean R of the grasslands on the TP in each of the six altitude ranges specified in Section 2.4.2. Grasslands distributed at altitudes lower than 2000 m and higher than 6000 m were associated with high Rs. However, as these grasslands accounted for an extremely small proportion of the grasslands on the TP, their restoration was of low value. The dominant types of grassland on the TP were distributed primarily in the altitude ranges of 2000–3000, 3000–4000, 4000–5000, and 5000–6000 m and were associated with high Rs, as evidenced by their multiyear mean Rs of 301.68, 379.66, 346.40, and 263.63 g C·m−2, respectively, the grasslands located at altitudes of 3000–4000 m having the highest R.
3.5. Analysis of Grassland R by Climate Zone
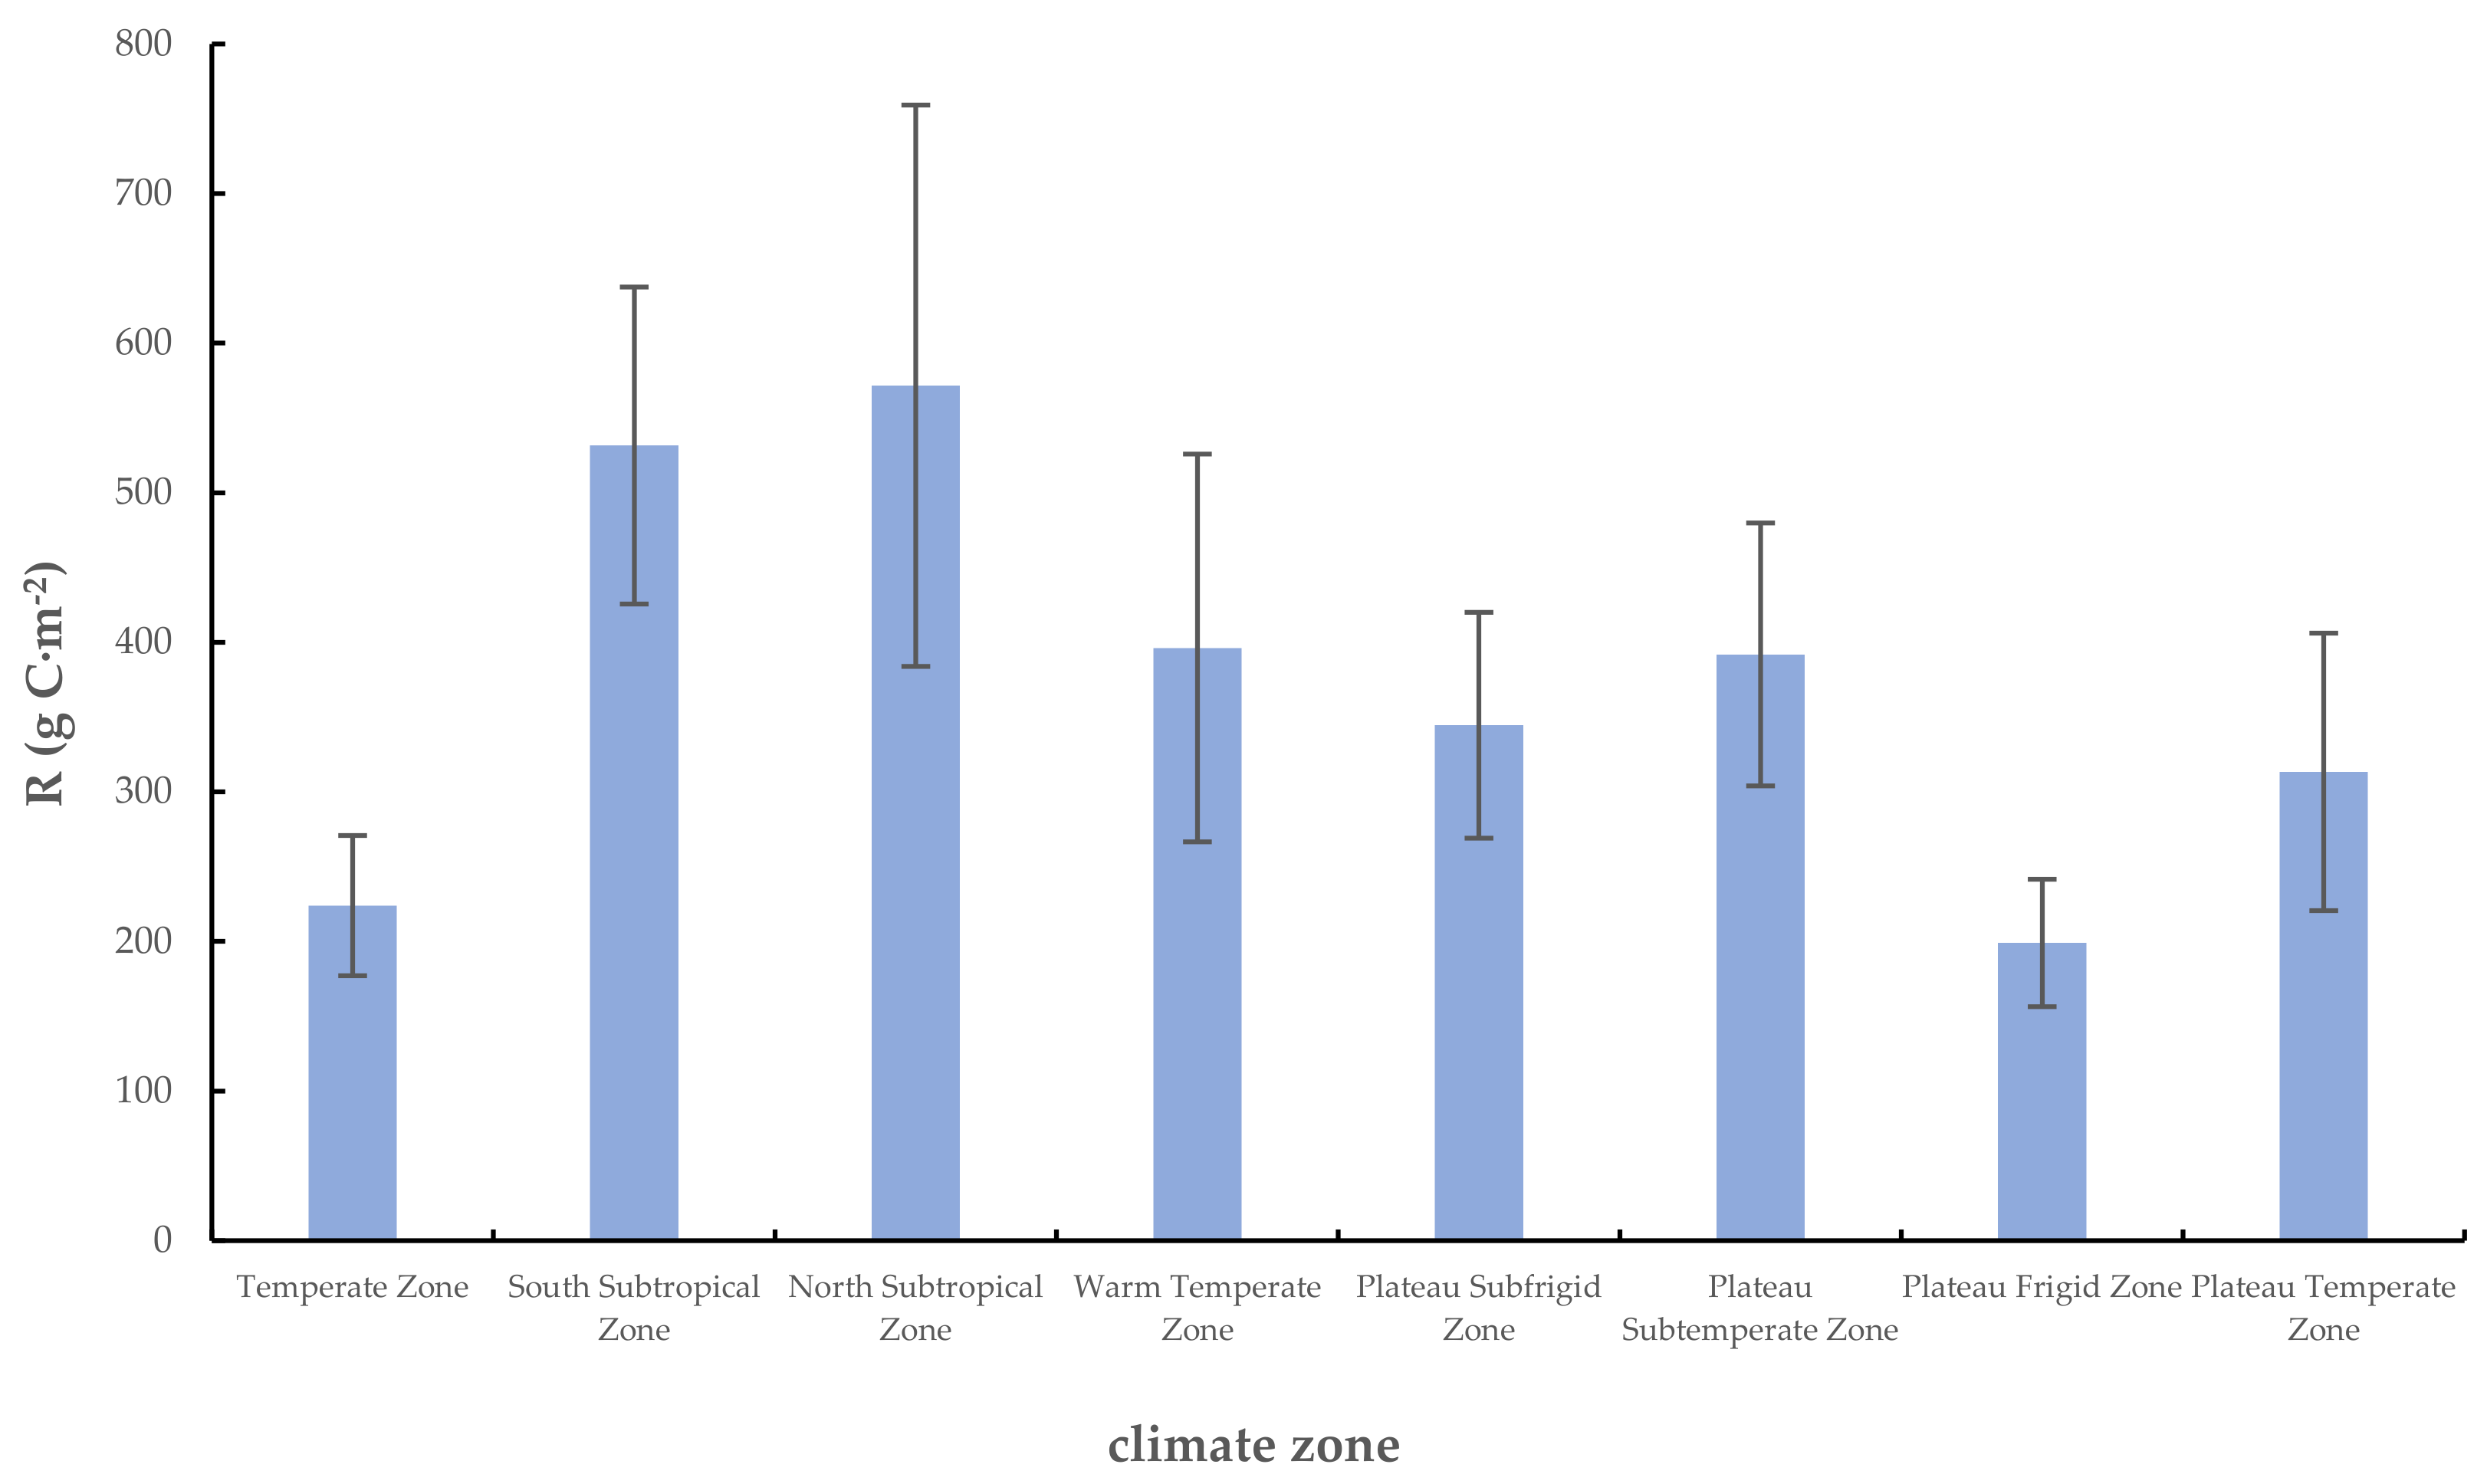
Figure 11 is the spatial distribution of the climate zone on the TP. It used the climate zone data in Section 2.2.4. Figure 12 presents a histogram of the R data of 2001–2019 to show the multiyear mean R of the grasslands in each of the eight climate zones specified in Section 2.4.2. The grasslands distributed in the north subtropical and south subtropical zones clearly had the highest Rs. However, because these grasslands accounted for a very small proportion of the grasslands on the TP, their restoration was of very low value. The multiyear mean Rs of the grasslands distributed in the other six climate zones (temperate, warm temperate, plateau subfrigid, plateau subtemperate, plateau frigid, and plateau temperate) were 223.97, 396.24, 344.55, 391.90, 199.02, and 313.38 g C·m−2, respectively, and the grasslands in the warm temperate and plateau frigid had the highest and lowest Rs, respectively.
4. Discussion
4.1. Research Methods
All the model-based methods used in this study have been validated in previous relevant studies, summarized as follows. Li et al. [16]. calculated PNPP using an improved CASA model and quantified the human impact (mean: 203.68 g C·m−2) on the NPP in the Shiyang River Basin in 2001–2014 based on ANPP estimates yielded by the CASA model. Wu et al. [26]. estimated PNPP for the city of Guangzhou using the Chikugo model and calculated the NPP loss (mean: 841.54 g C·m−2) due to land-use and land-cover changes based on the ANPP estimates yielded by the CASA model. Tsunekawa et al. [27]. identified potential hotspot areas in terms of desertification and land degradation by comparing the PNPP and ANPP estimates yielded by the Chikugo model and an improved CASA model. Tong et al. [42]. calculated the human-induced NPP (mean: 454.83 g C·m–2) in five northwestern provinces of China over 2000–2015, based on ANPP and PNPP estimates yielded by the CASA and TM models. Gao et al. [9]. and Zhao et al. [10]. divided the Loess Plateau into regions through the superimposition of factors such as terrain, soil, vegetation, and climate, and then evaluated the R of the Loess Plateau based on the maximum vegetation coverage in certain areas using the PSH. Based on the TM model, Sun et al. [20] determined an annual mean PNPP of 1314 g C·m–2 for vegetation in Yunnan, Guizhou, and Sichuan over the period 2007–2016. Zhang et al. [21]. estimated PNPP for the Shiyang River Basin over the period 1999–2007, based on the TM model. Jahelnabi et al. [22]. used the TM model to generate PNPP estimates for vegetation in the Gadarif state, eastern Sudan. Yin et al. [23] estimated PNPP and ANPP for the Hengduan Mountains based on the TM and CASA models, and represented the impact of human activity on ANPP as the difference between ANPP and PNPP. Zhou et al. [24]. calculated the ANPP and PNPP in the Heihe River Basin for 2001–2010, based on the CASA and TM models driven by several types of data, and then used the difference between these two measures to represent the impact of human activity on NPP, with the goal of evaluating the impact of human activity and climate change on desertification.
It can be seen that estimates varied considerably by method and region. Most published studies employed one method to produce NPP estimates for their areas of interest, and their results likely differed due to the difference between the methods used. In this study, drawing lessons from previous research experience, we calculated the Rs of the TP using three PNPP calculation methods, and averaged the results to reduce the possible errors arising from the models and methods.
4.2. Contribution to Carbon Sequestration
Grassland carbon sequestration is a problem that is drawing growing attention from countries around the world, and more people have begun to pay attention to the potential value of grasslands as carbon sinks [43]. Many believe that grasslands are perpetual carbon sinks, and that maintaining their present conditions alone can help to achieve a carbon sink effect, but this is not the case [44]. The conservation and restoration of the available grasslands are a top priority for to the goal of enhancing the carbon sequestration capacity of grasslands. Future plans should focus on preserving the low-temperature habitats of alpine grasslands, conserving the available soil carbon stock, and improving the carbon sequestration capacity of soils in temperate grasslands. Alpine grasslands merit more attention since they are highly effective at sequestering carbon while being vulnerable [45].
Fang et al. [46] found that the total amount of carbon sequestered by terrestrial vegetation in China ranged from 0.096 to 0.106 Pg C/a over the period 1981–2000. Yan et al. [47] identified the presence of large carbon sinks in the alpine meadows in the southwestern, southern, eastern, and northeastern parts of the TP. This distribution pattern basically matched that of R found in this study. Du et al. [48]. noted that future grassland restoration could increase the potential organic carbon stock of alpine grassland soils on the TP by 0.83 pg at depths of 0–40 cm, suggesting that the restoration of alpine grasslands on the TP is crucial for improving their carbon sequestration capacity. Simulations performed by Chang et al. [49] revealed the following: (1) the implementation of restoration management could markedly increase the organic carbon content of soils in degraded alpine meadow steppes on the TP over the period 2011–2030; (2) this practice can allow slightly degraded winter pastoral grasslands and moderately degraded summer pastoral grasslands to sequester carbon at rates of 0.04 and 2.0 Mg C ha−1 yr−1, respectively; (3) once managed through improvement practices, the degraded Tibetan grasslands can contribute an annual carbon sink of 0.022–0.059 Pg C yr−1. These results on the restoration of degraded grasslands on the TP are indicative of its huge potential for mitigating greenhouse gas emissions through soil carbon sequestration. All the above predictions were based on the restoration of degraded grasslands on the TP, and are therefore particularly important for this research field.
In this study, multiyear mean R was 332.33 g C·m−2 for the natural grasslands on the TP over the period 2001–2019. A mean NPP of 407.30 g C·m−2 was determined for the grasslands on the TP. These findings suggest that 81.59% of the inherent NPP of the grasslands on the TP has yet to recover, that a large gap still exists between the current and highest achievable levels of restoration of the grasslands on the TP, and that the grasslands on the TP have very high restoration value. Restoring the grasslands on the TP to the highest possible level will greatly improve grassland carbon sequestration in China.
4.3. Which Grasslands on the TP Are Worthy of Restorative Efforts?
Prudent selection of target areas for restoration is a topic of study that has yet to be explored, presenting a challenge to future grassland restoration [50]. Diagnosis of the degree of degradation of a grassland is a basis and prerequisite for its ecological restoration [51]. In this study, R was defined as the gap between the highest achievable and current levels of restoration of a grassland. Quantifiable based on NPP, this measure can be adopted as a criterion for determining the restoration value of grasslands at specific locations, which can then be used to identify the parts of the TP where CTN grassland restoration would yield maximum benefits if given priority. In addition, future R trends were calculated in this study for the grasslands on the TP, which provide a guarantee of future accuracy to the results of this study.
High Rs are found for the grasslands in the southwestern, eastern and middle parts of the TP. More specifically, directing restorative efforts to the grasslands in areas such as the southern part of Nagqu, the southwestern part of Ngari, Xigaze, Garze Tibetan Autonomous Prefecture, Aba Tibetan and Qiang Autonomous Prefecture, Gannan Tibetan Autonomous Prefecture, Huangnan Tibetan Autonomous Prefecture, Haibei Tibetan Autonomous Prefecture, Guoluo Tibetan Autonomous Prefecture and Yushu Tibetan Autonomous Prefecture should produce the best results. This distribution pattern is consistent with that of hydrothermal resources on the TP, whereas the temperature and R distribution patterns are in even greater agreement. Therefore, temperature and grassland type may be the leading factors affecting the R of the grasslands on the TP, which echoes the findings of many studies that changes in NPP are predominantly affected by temperature.
Our analysis, based on the type of grassland and the local conditions of the TP, revealed that three types of grassland, namely, alpine meadows, mountain meadows, and temperature meadow steppes, are distributed widely across the TP, and that each have an R greater than 350 g C·m−2, with the mountain meadows having an R as high as 476.71 g C·m−2. Prioritizing the CTN restoration of these three types of grassland may generate good results. Altitude-based analysis reveals good restoration value for all the grasslands distributed at altitudes of 2000–6000 m. With a mean R of 379.66 g C·m−2, grasslands located at altitudes of 3000–4000 m have the highest restoration value. Climate zone–based analysis shows an R above 300 g C·m−2 for all the grasslands of the warm temperate, plateau subfrigid, plateau frigid, and plateau temperate zones. Prioritization of the restoration of these grasslands may yield good results. With an R as high as 396.24 g C·m−2, grasslands in the warm temperate zone have the most restoration value.
4.4. Limitations
This study still has some limitations. When the CASA model was used to calculate NPP, ε was set to the global general value of 0.389 g C·MJ−1. However, opinions on ε remain divided. For example, for the maximum ε of steppes in China, Wang et al. [52] gave 0.608–1.000 g C·MJ−1 as the range, while Hunt [53] reported 3.5 g C·MJ−1 as its sole value. Therefore, further discussion is required to identify a method better suited for estimating the maximum ε of the grasslands on the TP. The CASA, TM, and Chikugo models used in this study are all climate models that estimate NPP by only considering climate factors, which may lead to some uncertainty. Moreover, derived from spatial interpolation, the meteorological data used in this study contribute some uncertainty. In addition, due to the interpolation accuracy of meteorological data, the temperature and precipitation in the Himalayan region in this study may be high, which ultimately leads to the overestimation of R of the Himalayan region in this study. Finally, we define PNPP as the ideal PNPP without considering any factors other than climate, including human disturbance, natural abiotic and biological disturbance. However, in reality, even without human disturbances, there are many kinds of natural abiotic (e.g., drought) and biotic (e.g., natural grazing) disturbances. This may contribute some uncertainty.
5. Conclusions
In this study, R, defined as the difference between PNPP and NPP, was calculated using three methods. Focus was given to the examination of the spatial distribution and spatial and temporal variations of the R of the natural grasslands on the TP, with the goal of providing theoretical support for grassland conservation and restoration in this region. The main conclusions of this study are summarized below.
First, a multiyear mean R of 332.33 g C·m–2 was determined for the grasslands on the TP over 2001–2019. A notable spatial distribution pattern of high Rs in the southwestern, eastern and middle parts of the TP, and low Rs in the northwestern part of the TP was also identified. Grassland restoration had the best prospects in these areas. The R of the grasslands on the TP over the study area was found to have changed non-significantly over the period examined.
Second, grasslands with a stable R were found to account for the highest proportion (76.13%) of the grasslands on the TP, followed by those with a downward trend in R (19.62%), and those with an upward R (4.24%). Grasslands with an increasing R were mainly concentrated in the southern part of Xigaze and parts of Yushu Tibetan Autonomous Prefecture, Guoluo Tibetan Autonomous Prefecture and Garze Tibetan Autonomous Prefecture. Conservation measures should be implemented to prevent the degradation of the grasslands in these areas, whose restorative value will continue to increase in the future.
Finally, analysis based on the type of grassland and the local conditions of the TP revealed that CTN restoration of three types of grassland—alpine meadows, mountain meadows, and temperate meadow steppes—may produce good results. Of these three types of grassland, mountain meadows had the highest restoration value. Of the grasslands located at different altitudes and in different climate zones, those located at altitudes of 3000–4000 m and those in the warm temperate zone had the highest restoration value. For the specific urban areas of the TP, most of the grasslands in areas such as the southern part of Nagqu, the southwestern part of Ngari, Xigaze, Garze Tibetan Autonomous Prefecture, Aba Tibetan and Qiang Autonomous Prefecture, Gannan Tibetan Autonomous Prefecture, Huangnan Tibetan Autonomous Prefecture, Haibei Tibetan Autonomous Prefecture, Guoluo Tibetan Autonomous Prefecture and Yushu Tibetan Autonomous Prefecture were found to have high restoration value.
Author Contributions
Conceptualization, R.W., Q.F. and T.L.; methodology, R.W.; software, Z.J.; validation, Q.F. and T.L.; formal analysis, R.W.; investigation, Z.J.; resources, Q.F. and T.L.; data curation, Q.F.; writing—original draft preparation, R.W.; writing—review and editing, R.W. and Q.F.; visualization, Q.F.; supervision, Q.F.; project administration, Q.F. and T.L.; funding acquisition, Q.F. and T.L. All authors have read and agreed to the published version of the manuscript.
Funding
This research was funded by National Key Research and Development Program of China Project: 2019YFC0507701; National Natural Science Foundation of China: 41805086; National Natural Science Foundation of China: 41801191; Consulting Project of the Engineering Academy of China: 2021-HZ-5; Consulting Project of the Engineering Academy of China: 2020-XZ-29; Fundamental Research Funds for the Central Universities of Lanzhou University: lzujbky-2021-kb13; Supported by China Agriculture Research System of MOF and MARA.
Institutional Review Board Statement
Not applicable.
Informed Consent Statement
Not applicable.
Data Availability Statement
The interpolated monthly precipitation and temperature data for the periods 2001–2019 used in this study were obtained from the National Earth System Science Data Center, National Science and Technology Infrastructure of China (http://www.geodata.cn accessed on 12 September 2021). The digital elevation model (DEM) data used in this study that originated from the Shuttle Radar Topography Mission data (spatial resolution: 90 m) (http://srtm.csi.cgiar.org/ accessed on 11 September 2021.) was published by the United States National Aeronautics and Space Administration (NASA).
Conflicts of Interest
The authors declare no conflict of interest.
References
- Liu, Y.; Zhang, Z.; Tong, L.; Khalifa, M.; Wang, Q.; Gang, C.; Wang, Z.; Li, J.; Sun, Z. Assessing the effects of climate variation and human activities on grassland degradation and restoration across the globe. Ecol. Indic. 2019, 106, 105504. [Google Scholar] [CrossRef]
- Wang, Y.; Ren, Z.; Ma, P.; Wang, Z.; Niu, D.; Fu, H.; Elser, J.J. Effects of grassland degradation on ecological stoichiometry of soil ecosystems on the Qinghai-Tibet Plateau. Sci. Total Environ. 2020, 722, 137910. [Google Scholar] [CrossRef]
- Sun, J.; Fu, B.; Zhao, W.; Liu, S.; Liu, G.; Zhou, H.; Shao, X.; Chen, Y.; Zhang, Y.; Deng, Y. Optimizing grazing exclusion practices to achieve Goal 15 of the sustainable development goals in the Tibetan Plateau. Sci. Bull. 2021, 66, 1493–1496. [Google Scholar] [CrossRef]
- He, L.; Bin, J.; Deng, D.; Yan, W.; Chen, D. Review on progress in vegetation close-to-nature recovery. J. Sichuan For. Sci. Technol. 2017, 38, 18–21. [Google Scholar]
- He, J.; Bu, H.; Hu, X.; Feng, Y.; Li, S.; Zhu, J.; Liu, G.; Wang, Y.; Nan, Z. Close-to-nature restoration of degraded alpine grasslands: Theoretical basis and technical approach. Chin. Sci. Bull. 2020, 65, 3898–3908. (In Chinese) [Google Scholar] [CrossRef]
- Strassburg, B.B.; Iribarrem, A.; Beyer, H.L.; Cordeiro, C.L.; Crouzeilles, R.; Jakovac, C.C.; Junqueira, A.B.; Lacerda, E.; Latawiec, A.E.; Balmford, A.; et al. Global priority areas for ecosystem restoration. Nature 2020, 586, 724–729. [Google Scholar] [CrossRef] [PubMed]
- Li, Q.; Gao, S.; Zhang, C.; Wang, R.; Zhou, N.; Li, J.; Guo, Z.; Chang, C. Assessment of the Impacts of Climate Change and Human Activities on the Dynamic Grassland Change in Inner Mongolia. Geogr. Geo-Inf. Sci. 2019, 35, 99–104. [Google Scholar]
- Venter, Z.S.; Scott, S.L.; Desmet, P.G.; Hoffman, M.T. Application of Landsat-derived vegetation trends over South Africa: Potential for monitoring land degradation and restoration. Ecol. Indic. 2020, 113, 106206. [Google Scholar] [CrossRef]
- Gao, H.; Pang, G.; Li, Z.; Cheng, S. Evaluating the potential of vegetation restoration in the Loess Plateau. Acta Geogr. Sin. 2017, 72, 863–874. [Google Scholar]
- Zhao, G.; Mu, X.; Tian, P.; Gao, P.; Sun, W.; Xu, W. Prediction of Vegetation Variation and Vegetation Restoration Potential in the Loess Plateau. J. Soil Water Conserv. 2021, 35, 205–212. [Google Scholar]
- Li, H.; Qin, W.; Zhang, T.; Shen, W. Comprehensive evaluation model for revegetation potentiality on moving sandy land in alpine valley of Tibet, China. Trans. Chin. Soc. Agric. Eng. 2015, 31, 220–228. [Google Scholar]
- Emamian, A.; Rashki, A.; Kaskaoutis, D.G.; Gholami, A.; Opp, C.; Middleton, N. Assessing vegetation restoration potential under different land uses and climatic classes in northeast Iran. Ecol. Indic. 2021, 122, 107325. [Google Scholar] [CrossRef]
- De, M.; Riopel, J.A.; Cihacek, L.J.; Lawrinenko, M.; Baldwin-Kordick, R.; Hall, S.J.; McDaniel, M.D. Soil health recovery after grassland reestablishment on cropland: The effects of time and topographic position. Soil Sci. Soc. Am. J. 2020, 84, 568–586. [Google Scholar] [CrossRef]
- Gao, W.; Lei, X.; Fu, L. Impacts of climate change on the potential forest productivity based on a climate-driven biophysical model in northeastern China. J. For. Res. 2020, 31, 2273–2286. [Google Scholar] [CrossRef] [Green Version]
- Pan, J.; Xu, B. Modeling spatial distribution of potential vegetation NPP in China. Chin. J. Ecol. 2020, 39, 1001–1012. [Google Scholar]
- Li, C.; Fan, Y.; Cao, H.; Han, H. Impact of human activities on net primary productivity based on the CASA model: A case study of the Shiyang River Basin. Arid. Land Geogr. 2018, 41, 142–151. [Google Scholar]
- Lv, Z.; Li, W.; Huang, X.; Zhang, Z. Larix principis-rupprechtii Growth Suitability Based on Potential NPP under Climate Change Scenarios in Hebei Province. Sci. Silvae Sin. 2019, 55, 37–44. [Google Scholar]
- Ren, Z.; Zhu, H.; Shi, H.; Liu, X. Spatiotemporal-Distribution Pattern Variation of Net Primary Productivity in Potential Natural Vegetation and Its Response to Climate and Topography in China. Acta Agrestia Sin. 2017, 25, 474–485. [Google Scholar]
- Li, H.; Hong, Y.; Deng, G.; Wu, R.; Zhang, H.; Zhao, J.; Guo, X. Impact of climate change and human activities on net primary productivity of grasslands in Inner Mongolia, China during 1982–2015. Chin. J. Appl. Ecol. 2021, 32, 415–424. [Google Scholar]
- Sun, Z.; Wu, J.; Liu, F.; Shao, T.; Liu, X.; Chen, Y.; Long, X.; Rengel, Z. Quantitatively assessing the effects of climate change and human activities on ecosystem degradation and restoration in southwest China. Rangel. J. 2019, 41, 335–344. [Google Scholar] [CrossRef]
- Zhang, C.; Wang, X.; Li, J.; Hua, T. Roles of climate changes and human interventions in land degradation: A case study by net primary productivity analysis in China’s Shiyanghe Basin. Environ. Earth Sci. 2011, 64, 2183–2193. [Google Scholar] [CrossRef]
- Jahelnabi, A.E.; Wu, W.; Boloorani, A.D.; Salem, H.M.; Nazeer, M.; Fadoul, S.M.; Khan, M.S. Assessment the Influence of Climate and Human Activities in Vegetation Degradation using GIS and Remote Sensing Techniques. Contemp. Probl. Ecol. 2020, 13, 685–693. [Google Scholar] [CrossRef]
- Yin, L.; Dai, E.; Zheng, D.; Wang, Y.; Ma, L.; Tong, M. What drives the vegetation dynamics in the Hengduan Mountain region, southwest China: Climate change or human activity? Ecol. Indic. 2020, 112, 106013. [Google Scholar] [CrossRef]
- Zhou, W.; Sun, Z.; Li, J.; Gang, C.; Zhang, C. Desertification dynamic and the relative roles of climate change and human activities in desertification in the Heihe River Basin based on NPP. J. Arid. Land 2013, 5, 465–479. [Google Scholar] [CrossRef] [Green Version]
- Del, G.S.; Parton, W.; Stohlgren, T.; Zheng, D.L.; Bachelet, D.; Prince, S.; Hibbard, K.; Olson, R. Global potential net primary production predicted from vegetation class, precipitation, and temperature. Ecology 2010, 91, 923–925. [Google Scholar]
- Wu, Y.; Wu, Z.; Yu, S. Quantitative assessment of the impacts of human activities on net primary productivity. Chin. J. Appl. Ecol. 2017, 28, 2535–2544. [Google Scholar]
- Tsunekawa, A.; Ito, T.Y.; Shinoda, M.; Nemoto, M.; Suhama, T.; Ju, H.; Shimizu, H. Methodology for assessment of desertification based on vegetation degradation using net primary productivity (NPP) as a key indicator. PHYTON Ann. Rei Bot. 2004, 45, 185–192. [Google Scholar]
- Lin, H. The Classification Indices-Based Model for NPP According to the Integrated Orderly Classification System of Grassland and Its Application. In CO2 Sequestration and Valorization, 2nd ed.; Morgado, C., Esteves, V., Eds.; BoD—Books on Demand: Norderstedt, Germany, 2014; pp. 171–224. [Google Scholar]
- Lin, H.; Zhao, J.; Liang, T.; Bogaert, J.; Li, Z. A Classification Indices-Based Model for Net Primary Productivity (Npp) and Potential Productivity of Vegetation in China. Int. J. Biomath. 2012, 5, 1260009. [Google Scholar] [CrossRef]
- Zhao, J.; Shi, Y.; Wang, D. Analysis of spatial distribution features of potential vegetation NPP in Inner Mongolia based on the IOCS. J. Nat. Resour. 2012, 27, 1870–1880. [Google Scholar]
- Liu, H.; Gao, J.; Zhang, H.; Ma, X.; Xu, X. Human Disturbance Monitoring and Assessment in the Biodiversity Conservation Priority Area China. J. Geo-Inf. Sci. 2017, 19, 1456–1465. [Google Scholar]
- Feng, Q.; Gao, X.; Huang, X.; Yu, H.; Liang, T. Remote sensing dynamic monitoring of grass growth in Qinghai-Tibet plateau from 2001 to 2010. J. Lanzhou Univ. Nat. Sci. 2011, 47, 76–81, 90. [Google Scholar]
- Peng, S.; Ding, Y.; Liu, W.; Li, Z. 1 km monthly temperature and precipitation dataset for China from 1901 to 2017. Earth Syst. Sci. Data 2019, 11, 1931–1946. [Google Scholar] [CrossRef] [Green Version]
- Jin, X.; Yang, L. Solar Radiation Calculation under Complex Topography Based on ArcGIS. J. Anhui Agric. Sci. 2014, 42, 7952–7955, 7973. [Google Scholar]
- Liu, J.; Meng, B.; Ge, J.; Gao, J.; Yin, J.; Hou, M.; Feng, Q.; Liang, T. Spatio-temporal dynamic changes of grassland NPP in Gannan prefecture, as determined by the CASA model. Acta Prataculturae Sin. 2019, 28, 19–32. [Google Scholar]
- Department of Animal Husbandry and Veterinary Medicine, Ministry of Agriculture of the People’s Republic of China; National Animal Husbandry and Veterinary Station. Rangeland Resources of China; Science and Technology of China Press: Beijing, China, 1996; pp. 147–337.
- Wang, J.; Zuo, W. Geographic Atlas of China; Sinomap Press: Beijing, China, 2010; p. 35. [Google Scholar]
- Zhu, W.; Pan, Y.; Zhang, J. Estimation of Net Primary Productivity of Chinese Terrestrial Vegetation Based on Remote Sensing. J. Plant Ecol. Former. Acta Phytoecol. Sin. 2007, 31, 413–424. [Google Scholar]
- Xu, H.; Wang, X.; Zhang, X. Alpine grasslands response to climatic factors and anthropogenic activities on the Tibetan Plateau from 2000 to 2012. Ecol. Eng. 2016, 92, 251–259. [Google Scholar] [CrossRef]
- Yuan, L.; Jiang, W.; Shen, W.; Liu, Y.; Wang, W.; Tao, L.; Zheng, H.; Liu, X. The spatio-temporal variations of vegetation cover in the Yellow River Basin from 2000 to 2010. Acta Ecol. Sin. 2013, 33, 7798–7910. [Google Scholar]
- Gao, X.; Dong, S.; Li, S.; Xu, Y.; Liu, S.; Zhao, H.; Yeomans, J.; Li, Y.; Shen, H.; Wu, S.N. Using the random forest model and validated MODIS with the field spectrometer measurement promote the accuracy of estimating aboveground biomass and coverage of alpine grasslands on the Qinghai-Tibetan Plateau. Ecol. Indic. 2020, 112, 106114. [Google Scholar] [CrossRef]
- Tong, L.; Liu, Y.; Zhang, Z.; Li, X.; Wang, Q.; Li, J. Quantitative assessment on the relative effects of climate variation and human activities on grassland dynamics in Northwest China. Res. Soil Water Conserv. 2020, 27, 202–210. [Google Scholar]
- Zhao, N.; Zhuang, Y.; Jin, L.; WuYun, Q.; Zhao, J. Evaluation of Potential and Value on Grassland Carbon Sink-A Case Study in Xilinhot of Inner Mongolia, China. In Advanced Materials Research, 2nd ed.; Wu, J., Yang, J., Nakagoshi, N., Lu, X., Xu, H., Eds.; Trans Tech Publications Ltd.: Bäch, Switzerland, 2012; Volume 524–527, pp. 2562–2565. [Google Scholar]
- Smith, P. Do grasslands act as a perpetual sink for carbon? Glob. Change Biol. 2014, 20, 2708–2711. [Google Scholar] [CrossRef]
- Yang, W.; Liu, Y.; Zhao, J.; Chang, X.; Wiesmeier, M.; Sun, J.; Lopez-Vicente, M.; Garcia-Ruiz, R.; Gomez, J.A.; Zhou, H.; et al. SOC changes were more sensitive in alpine grasslands than in temperate grasslands during grassland transformation in China: A meta-analysis. J. Clean. Prod. 2021, 308, 127430. [Google Scholar] [CrossRef]
- Fang, J.; Guo, Z.; Piao, S.; Chen, A. Terrestrial vegetation carbon sinks in China, 1981–2000. Sci. China Ser. D Earth Sci. 2007, 50, 1341–1350. [Google Scholar] [CrossRef]
- Yan, L.; Zhou, G.; Wang, T.; Hu, T.; Sui, X. The spatial and temporal dynamics of carbon budget in the alpine grasslands on the Qinghai-Tibetan Plateau using the Terrestrial Ecosystem Model. J. Clean. Prod. 2015, 107, 195–201. [Google Scholar] [CrossRef]
- Du, Y.; Zhou, G.; Guo, X.; Cao, G. Spatial distribution of grassland soil organic carbon and potential carbon storage on the Qinghai Plateau. Grassl. Sci. 2019, 65, 141–146. [Google Scholar] [CrossRef]
- Chang, X.; Zhu, X.; Wang, S.; Cui, S.; Luo, C.; Zhang, Z.; Wilkes, A. Impacts of management practices on soil organic carbon in degraded alpine meadows on the Tibetan Plateau. Biogeosciences 2014, 11, 3495–3503. [Google Scholar] [CrossRef] [Green Version]
- Torok, P.; Brudvig, L.A.; Kollmann, J.; Price, J.N.; Tothmeresz, B. The present and future of grassland restoration. Restor. Ecol. 2021, 29, e13378. [Google Scholar] [CrossRef]
- Wen, L.; Dong, S.; Zhu, L.; Li, X.; Shi, J.; Wang, Y.; Ma, Y. The construction of Grassland Degradation Index for Alpine Meadow in Qinghai-Tibetan Plateau. Procedia Environ. Sci. 2010, 2, 1966–1969. [Google Scholar] [CrossRef] [Green Version]
- Wang, B.; Wang, J.; Yang, Y.; Chang, S.; Chen, X.; Liu, A. Algorithm improvements for two important parameters of FPAR and maximum solar energy utilization efficiency. Acta Prataculturae Sin. 2013, 22, 220–228. [Google Scholar]
- Hunt, E.R. Relationship between woody biomass and PAR conversion efficiency for estimating net primary production from NDVI. Int. J. Remote Sens. 1994, 15, 1725–1730. [Google Scholar]
Figure 1.
Distribution of different types of grassland on the TP.
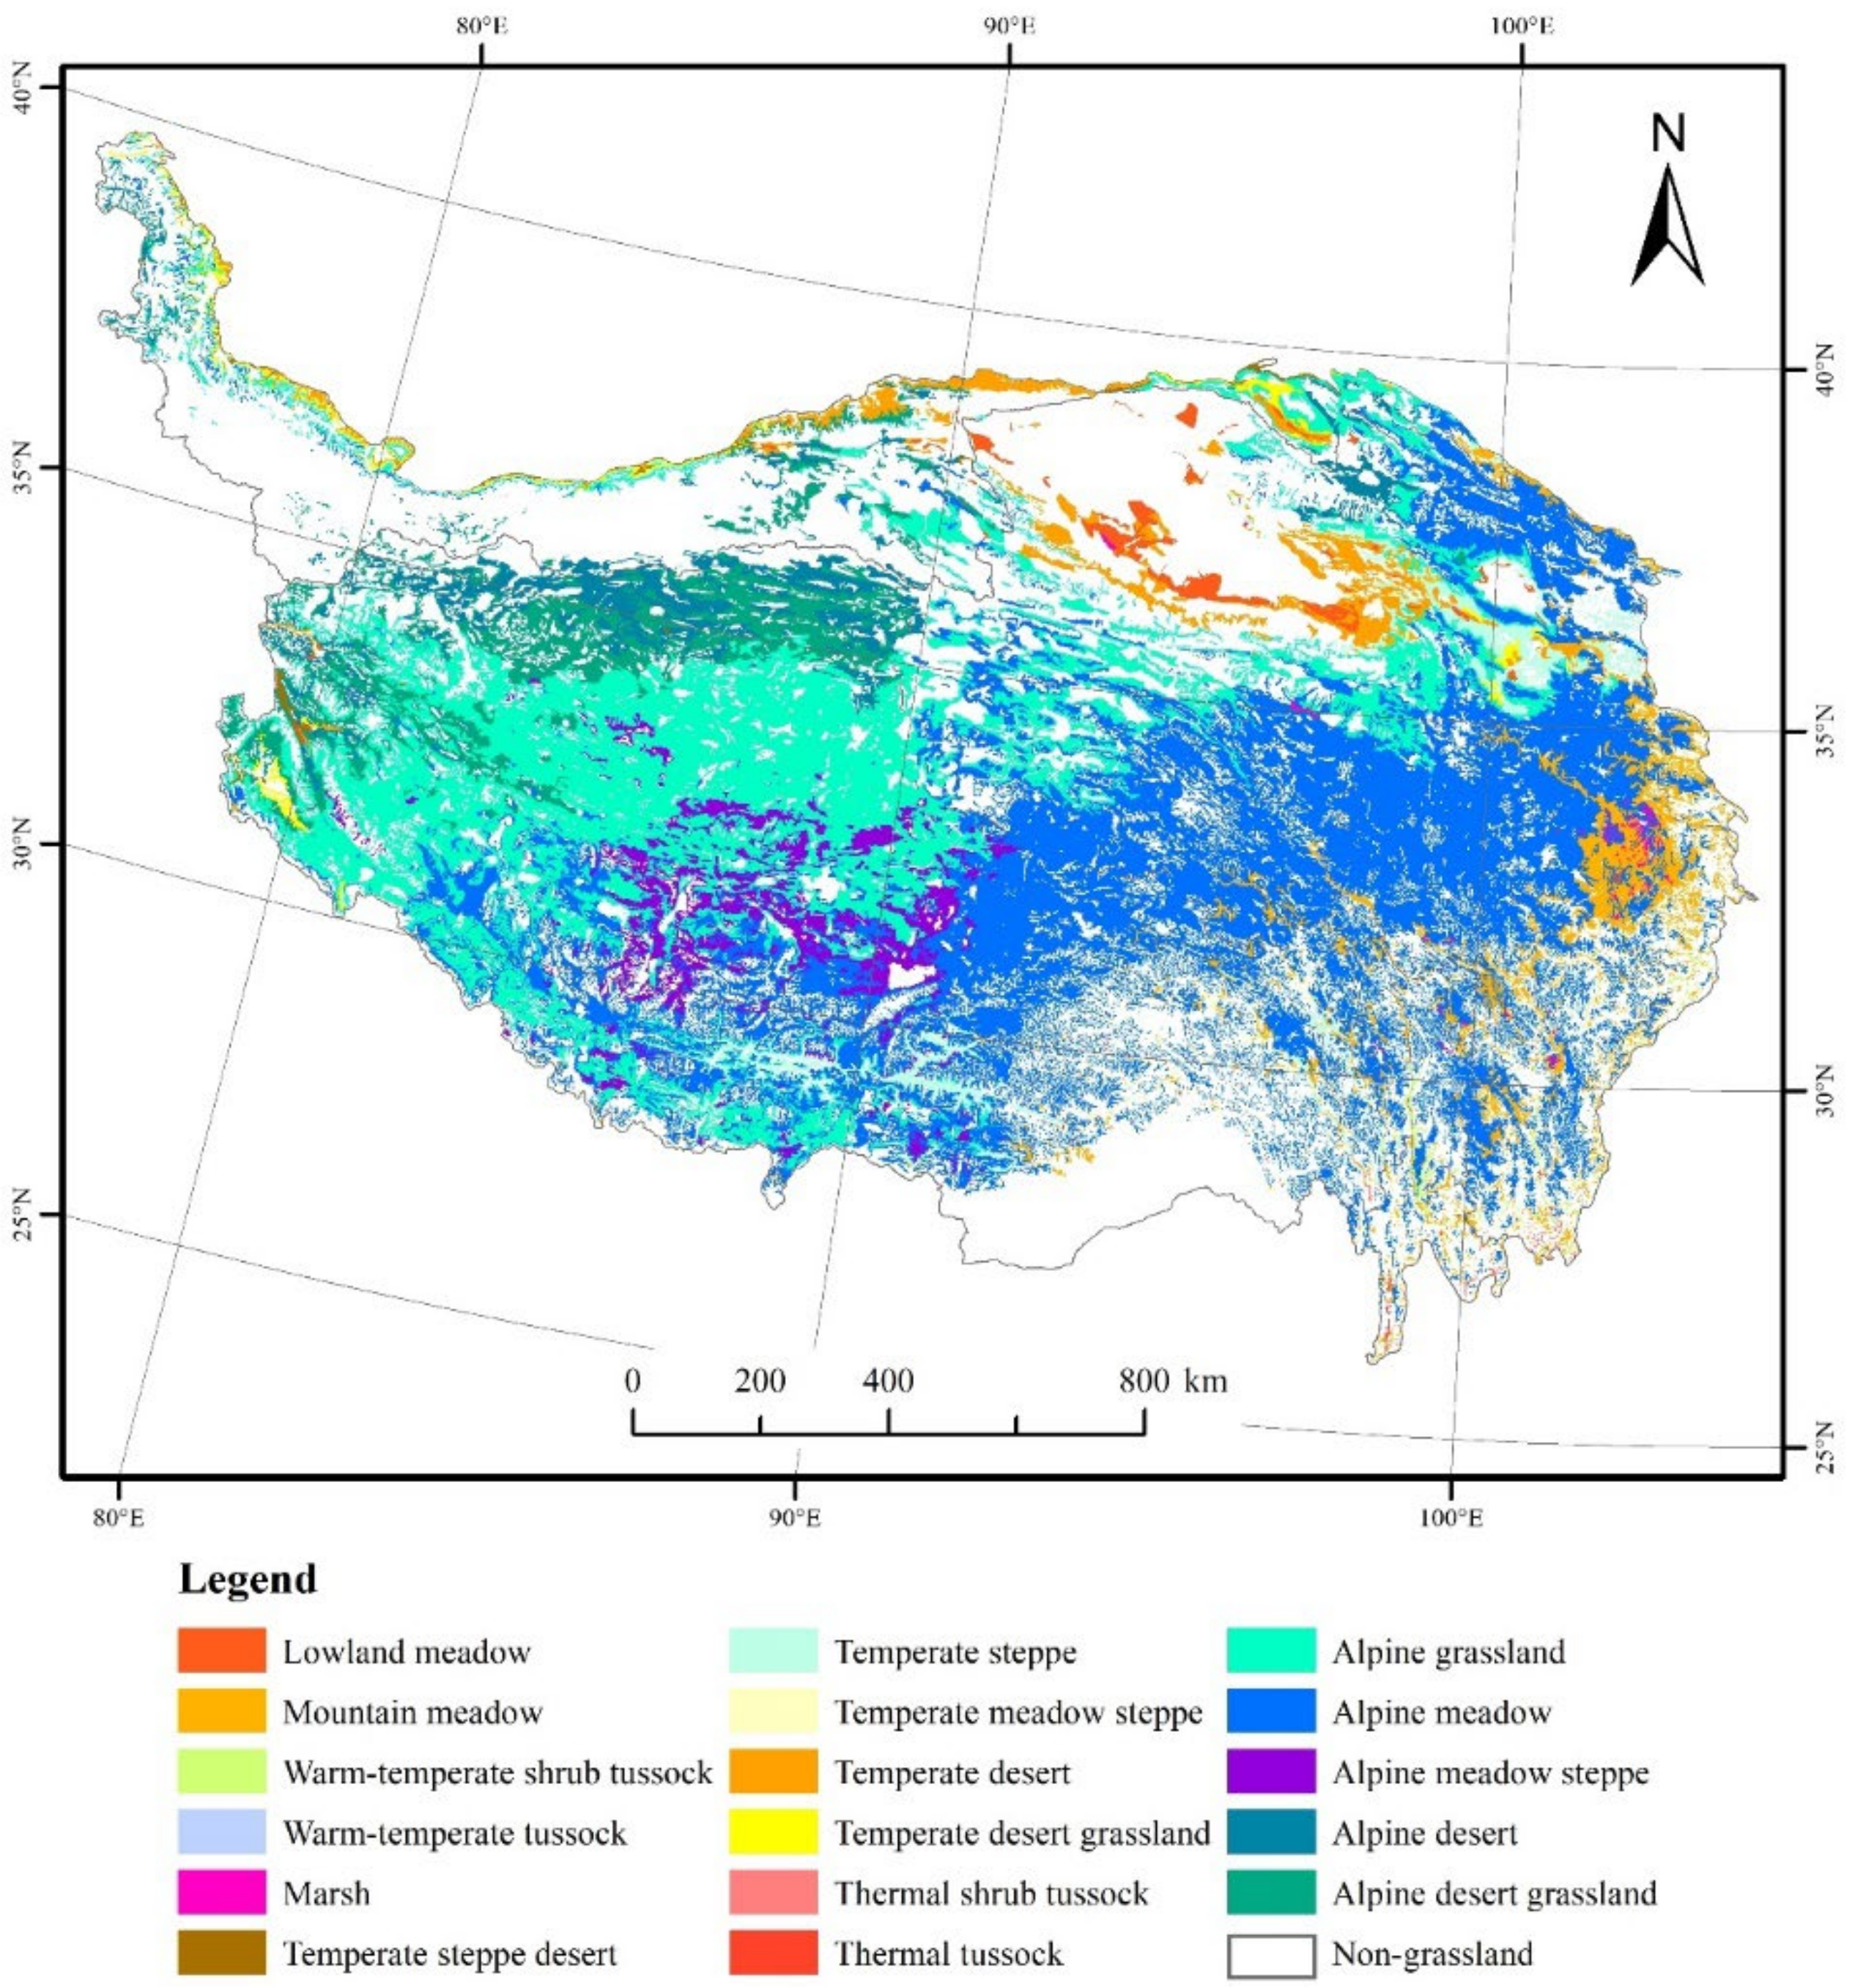
Figure 2.
Flow chart of the calculation of R.

Figure 3.
Spatial distribution patterns of the R1, R2, R3 and R of the natural grasslands on the TP over the period 2001–2019; (a–d) represent R1, R2, R3 and R, respectively.
Figure 3.
Spatial distribution patterns of the R1, R2, R3 and R of the natural grasslands on the TP over the period 2001–2019; (a–d) represent R1, R2, R3 and R, respectively.

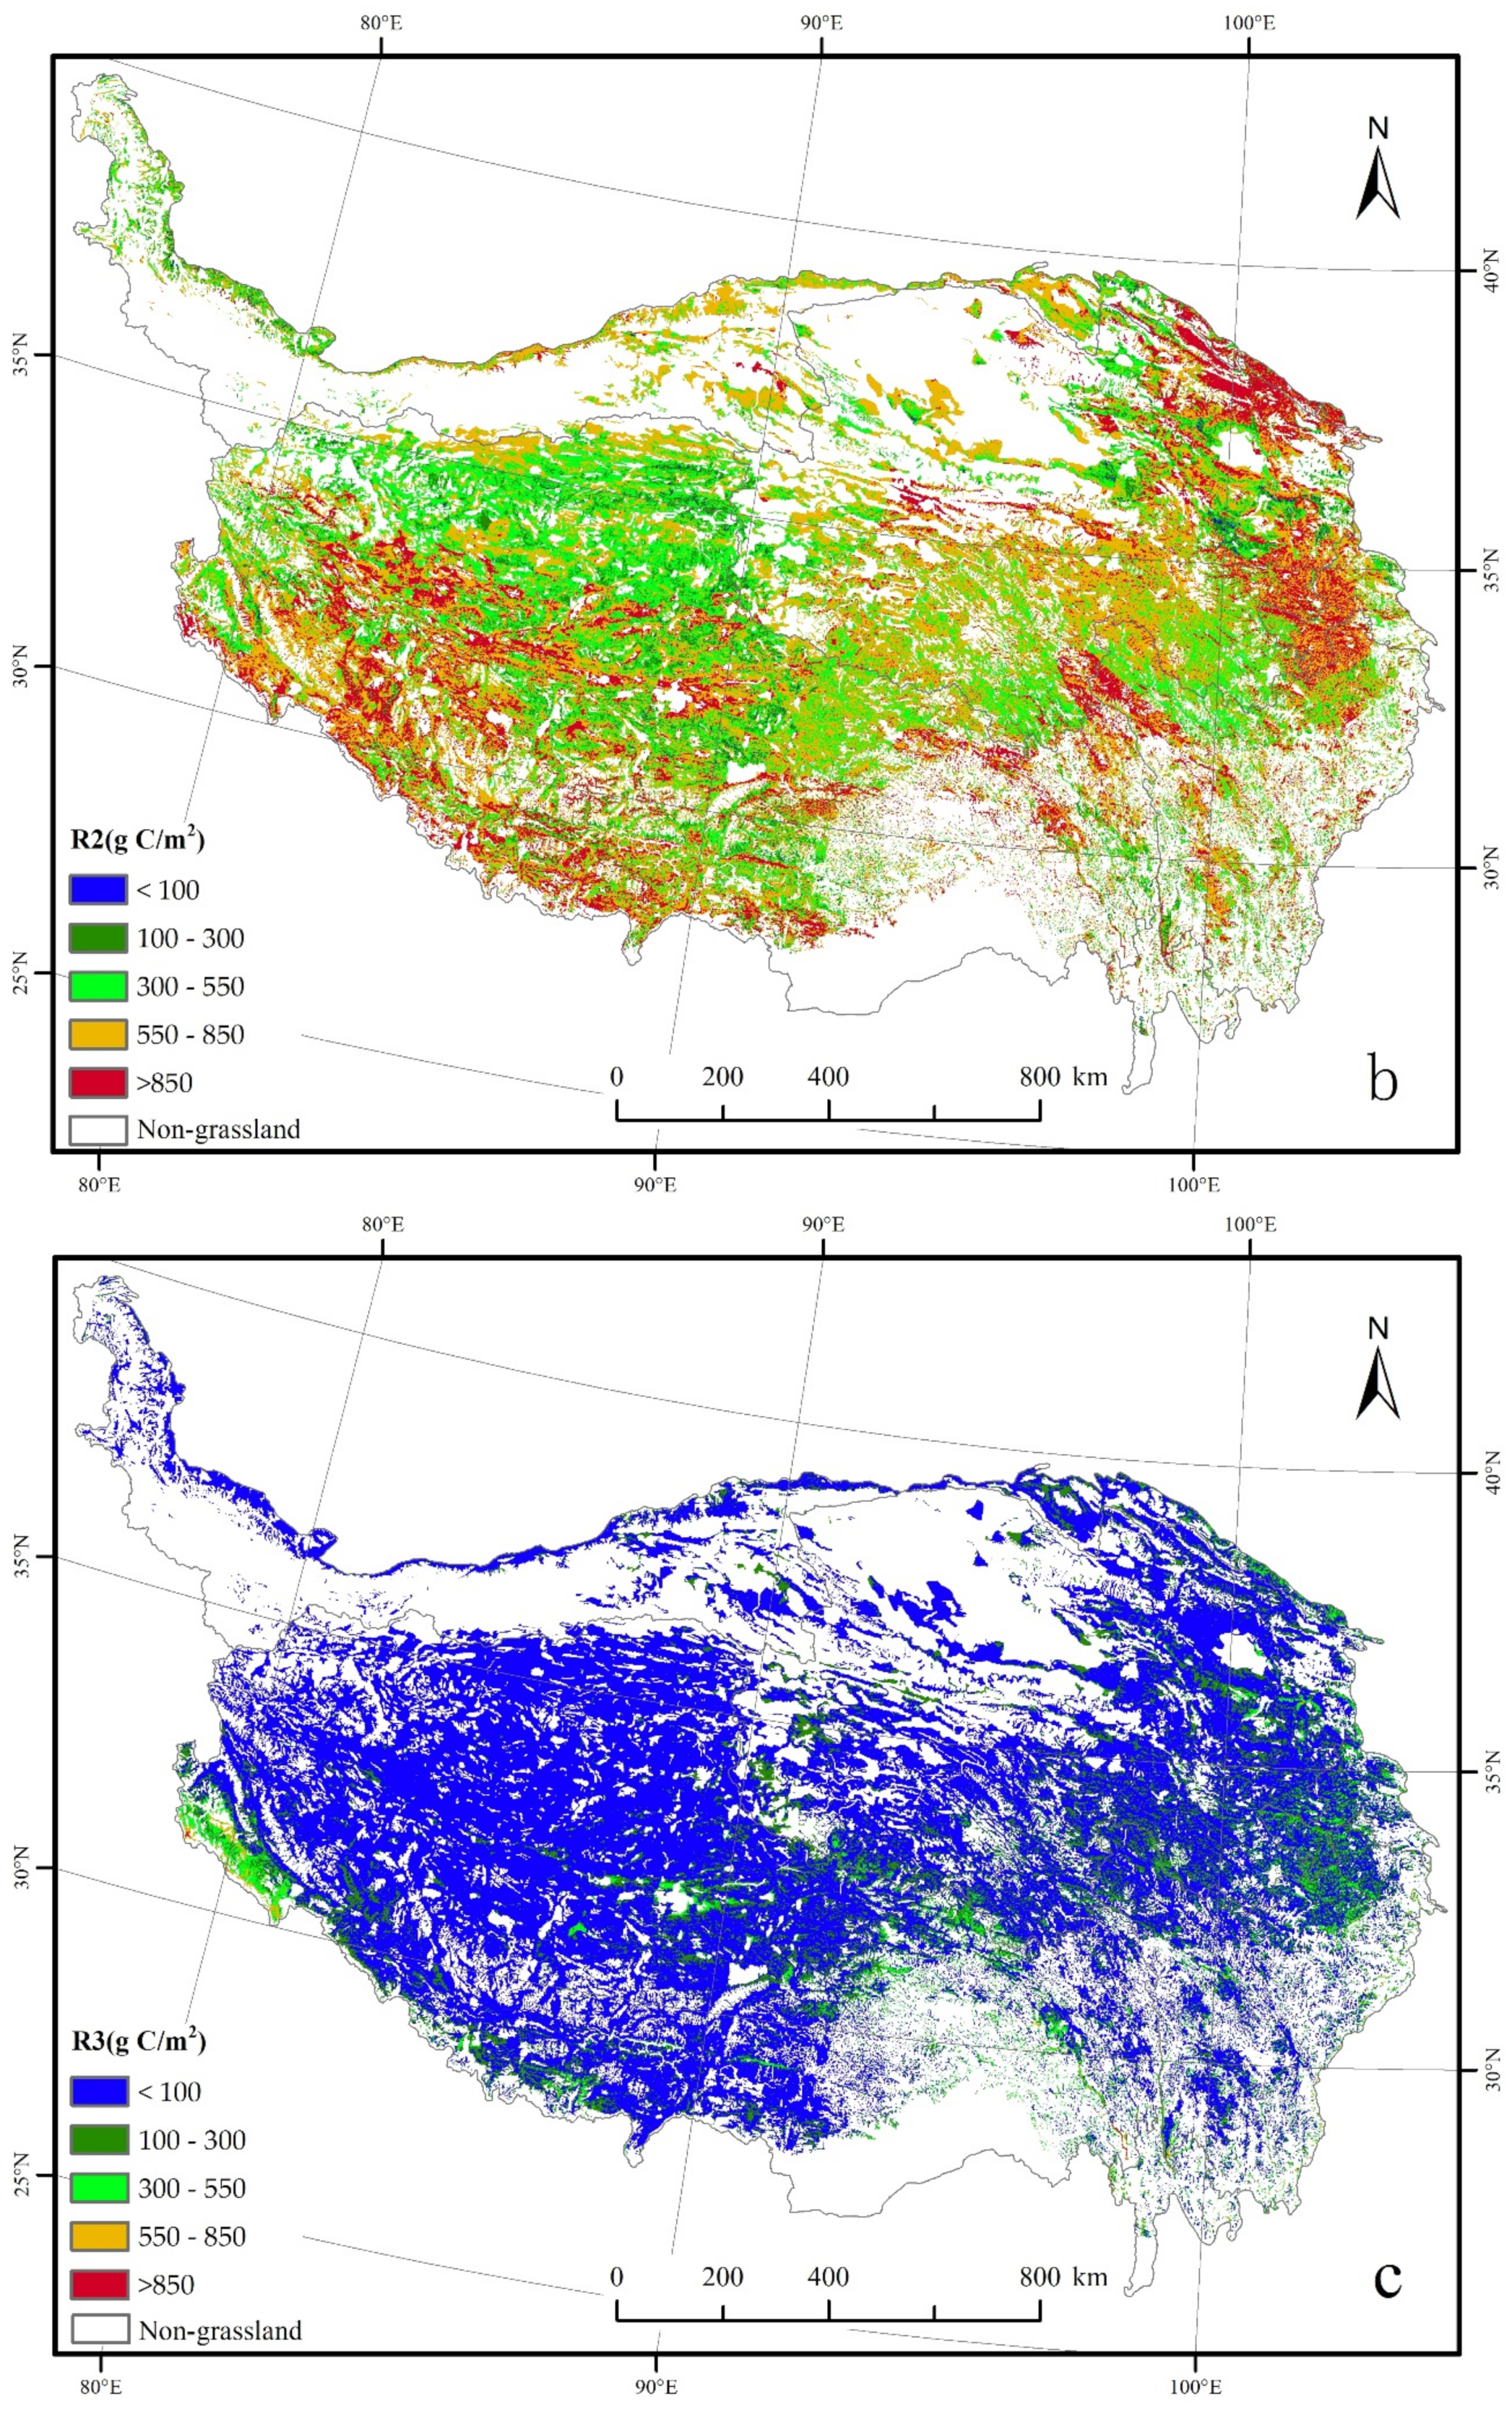

Figure 4.
Interannual variation of the R of the grasslands on the TP over the period 2001−2019.

Figure 5.
Interannual variation of the Ra (aboveground recovery potential) of the grasslands on the TP over the period 2001−2019.
Figure 5.
Interannual variation of the Ra (aboveground recovery potential) of the grasslands on the TP over the period 2001−2019.

Figure 6.
R trends of the grasslands on the TP over the period 2001–2019.
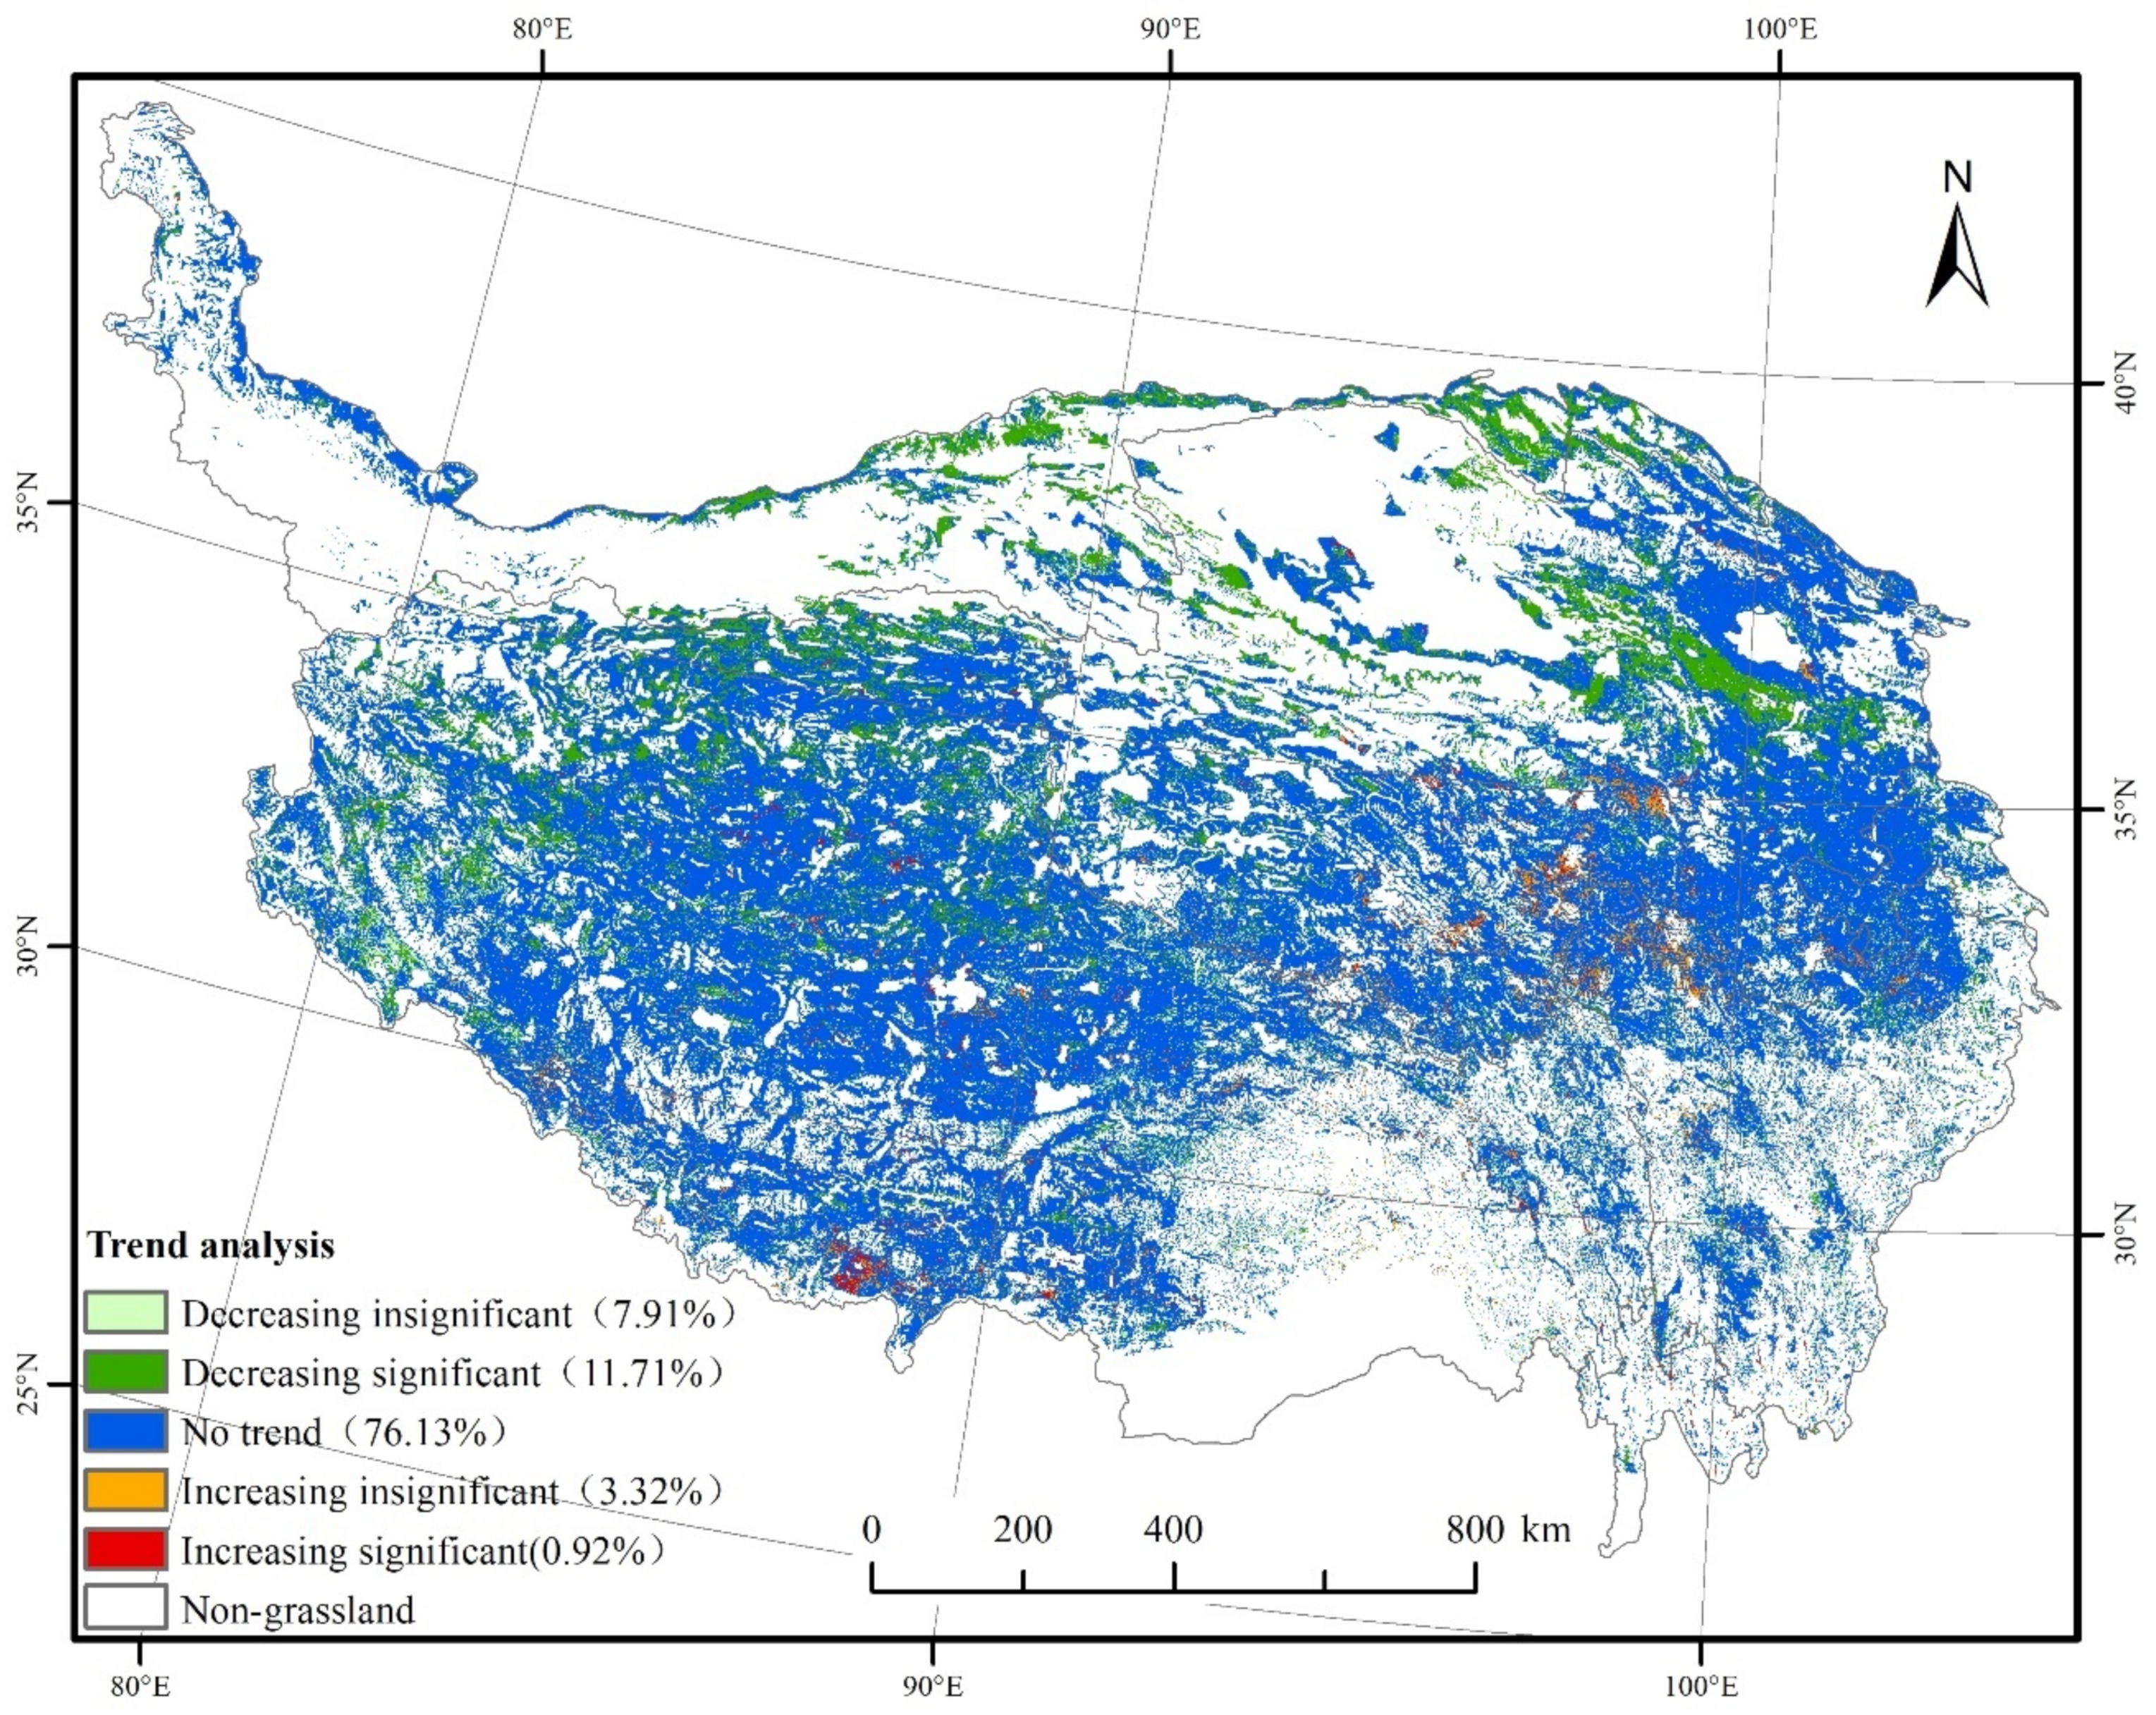
Figure 7.
Statistics of the R of each type of grassland on the TP over the period 2001−2019.

Figure 8.
Interannual variation of the R of each type of grassland on the TP over the period 2001−2019.
Figure 8.
Interannual variation of the R of each type of grassland on the TP over the period 2001−2019.

Figure 9.
Spatial distribution of the altitude on the TP.
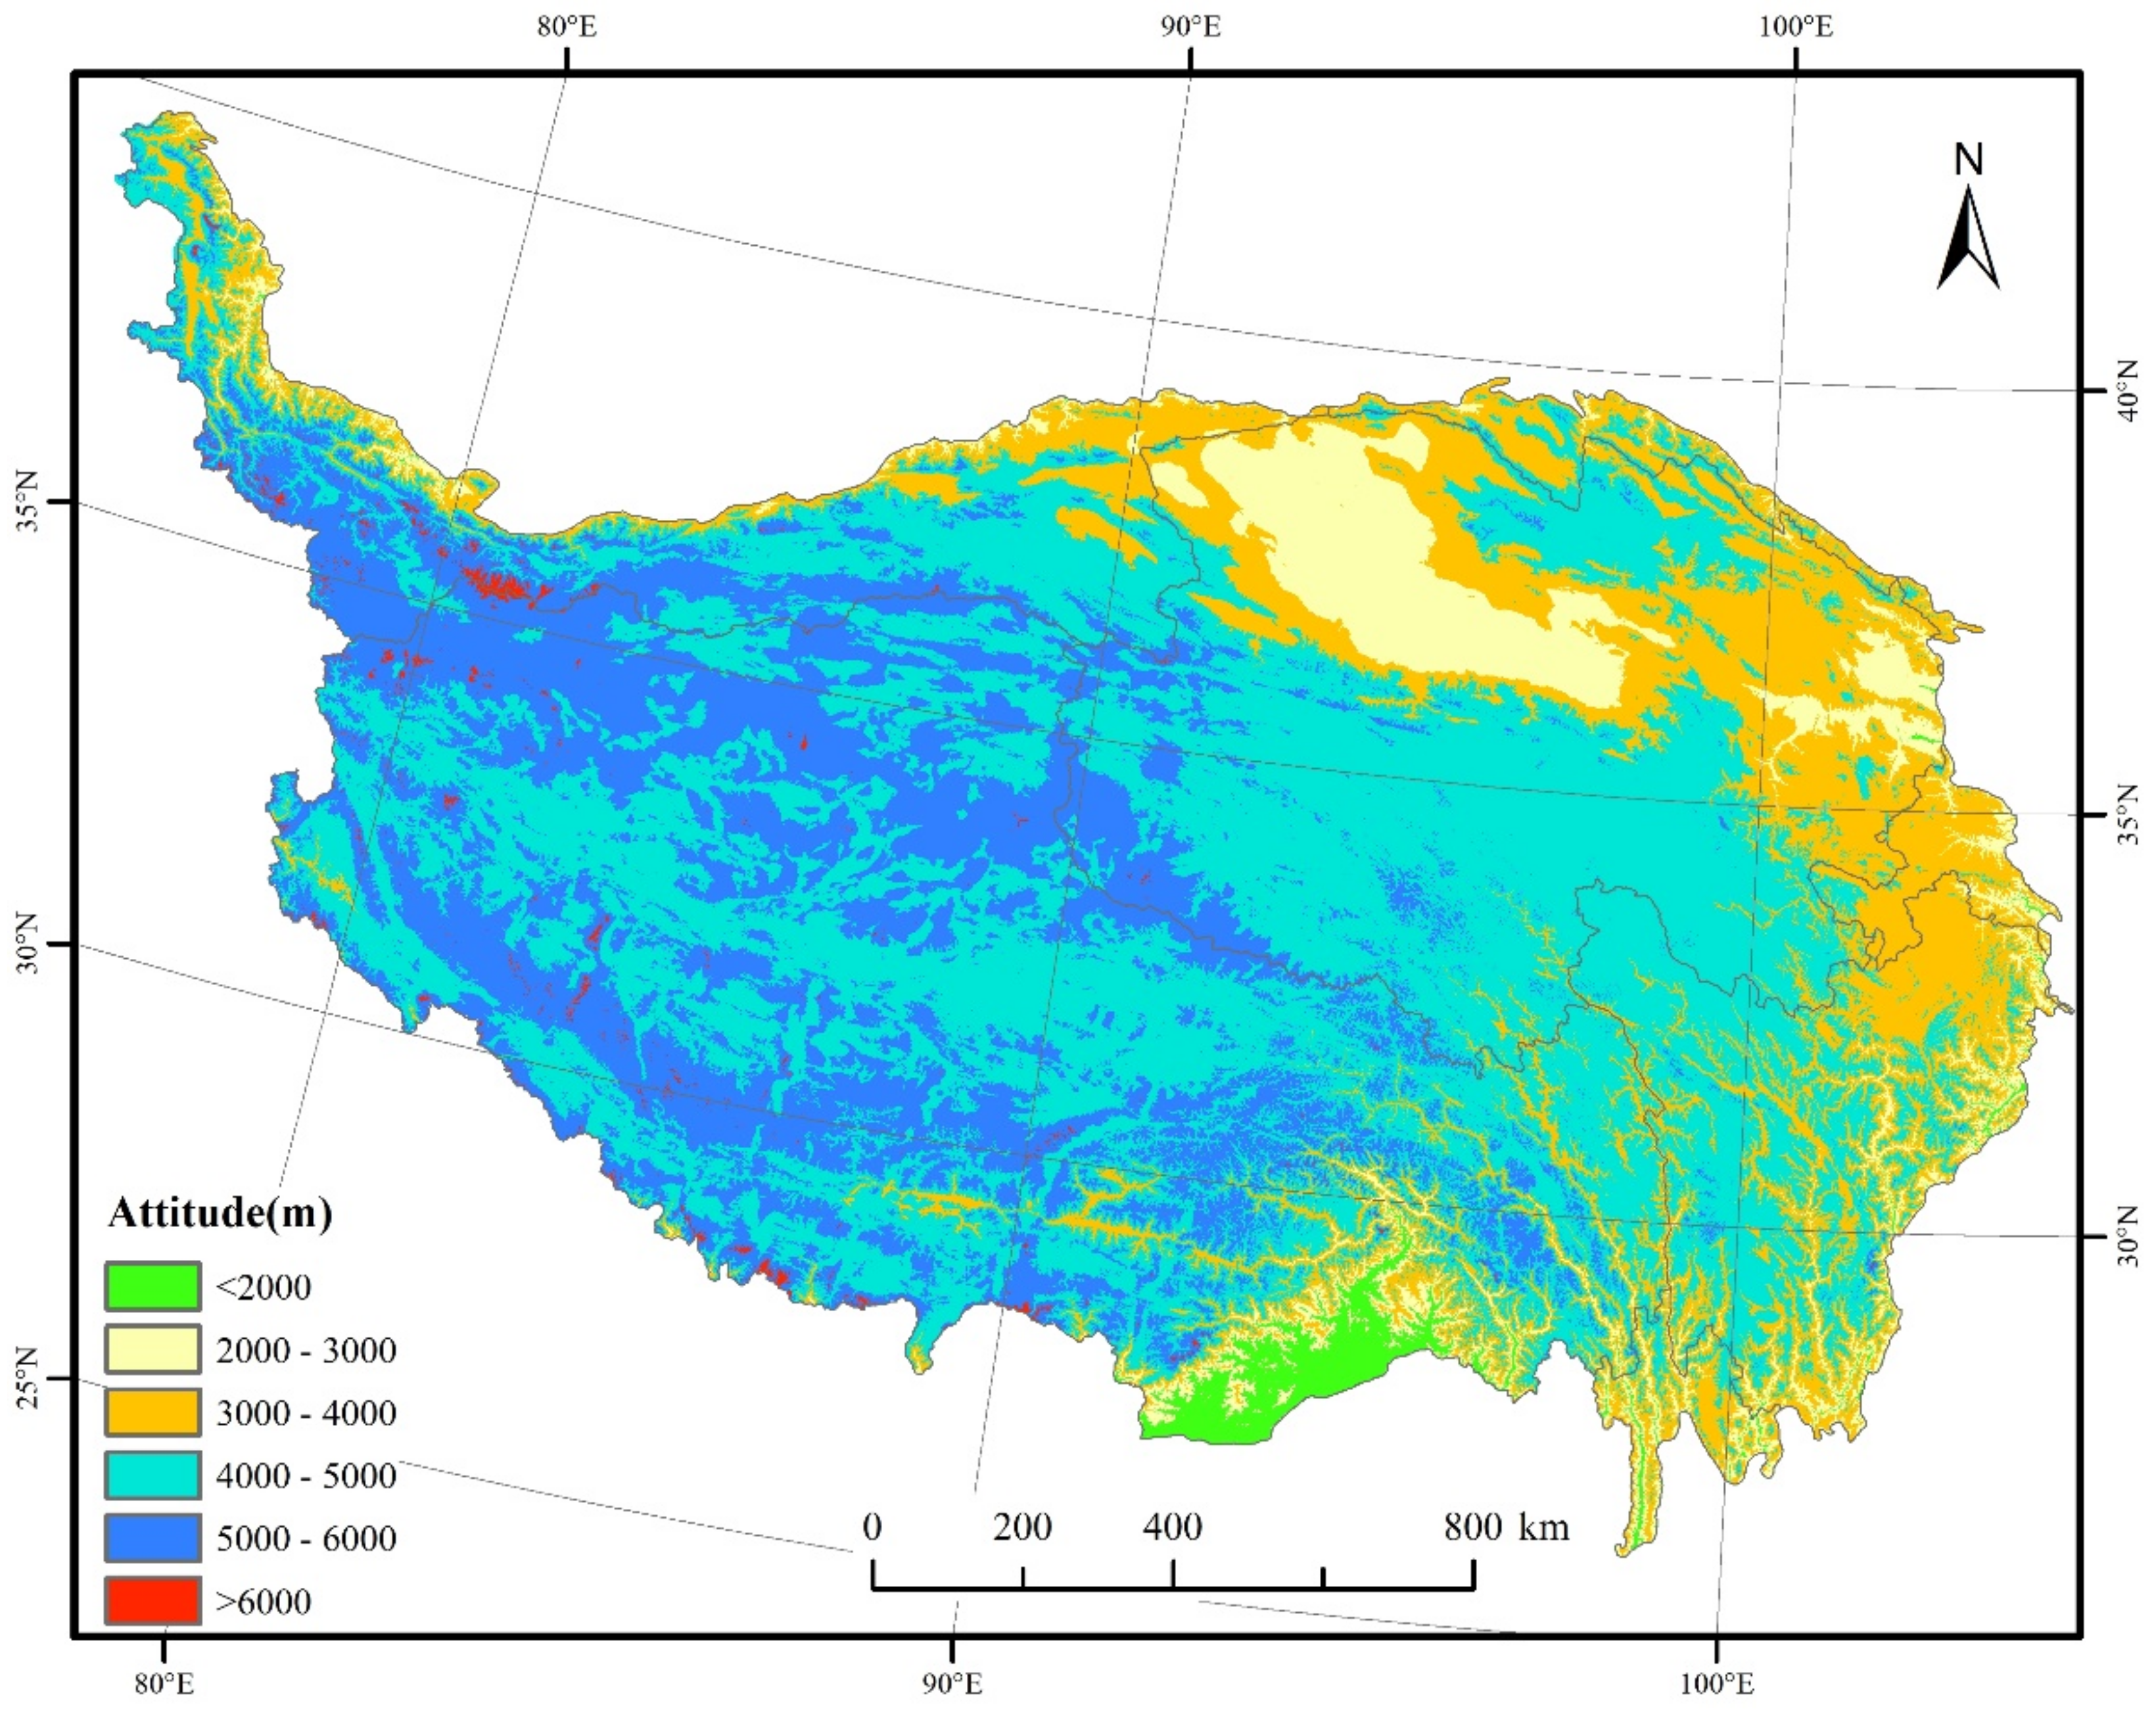
Figure 10.
R statistics for the grasslands on the TP located in different altitude ranges over the period 2001‒2019.
Figure 10.
R statistics for the grasslands on the TP located in different altitude ranges over the period 2001‒2019.

Figure 11.
Spatial distribution of the climate zone on the TP.

Figure 12.
R statistics for the grasslands in each climate zone on the TP over the period 2001–2019.
Figure 12.
R statistics for the grasslands in each climate zone on the TP over the period 2001–2019.
Publisher’s Note: MDPI stays neutral with regard to jurisdictional claims in published maps and institutional affiliations. |
© 2021 by the authors. Licensee MDPI, Basel, Switzerland. This article is an open access article distributed under the terms and conditions of the Creative Commons Attribution (CC BY) license (https://creativecommons.org/licenses/by/4.0/).
Share and Cite
MDPI and ACS Style
Wang, R.; Feng, Q.; Jin, Z.; Liang, T. The Restoration Potential of the Grasslands on the Tibetan Plateau. Remote Sens. 2022, 14, 80. https://doi.org/10.3390/rs14010080
AMA Style
Wang R, Feng Q, Jin Z, Liang T. The Restoration Potential of the Grasslands on the Tibetan Plateau. Remote Sensing. 2022; 14(1):80. https://doi.org/10.3390/rs14010080
Chicago/Turabian StyleWang, Ruijing, Qisheng Feng, Zheren Jin, and Tiangang Liang. 2022. "The Restoration Potential of the Grasslands on the Tibetan Plateau" Remote Sensing 14, no. 1: 80. https://doi.org/10.3390/rs14010080
Note that from the first issue of 2016, this journal uses article numbers instead of page numbers. See further details here.