
Marine Litter Detection by Sentinel-2: A Case Study in North Adriatic (Summer 2020)

e-GEOS, 00156 Rome, Italy
Remote Sens. 2022, 14(10), 2409; https://doi.org/10.3390/rs14102409
Submission received: 16 March 2022
/
Revised: 20 April 2022
/
Accepted: 16 May 2022
/
Published: 17 May 2022
(This article belongs to the Special Issue Remote Sensing for Mapping and Monitoring Anthropogenic Debris)
Abstract
:Aggregates of floating materials detected in North Adriatic in six Sentinel-2 scenes of August 2020 have been investigated. Most of the floating materials were identified by the chlorophyll red edge and consisted of vegetal materials, probably conveyed by rivers and exchanged with the lagoons. Traces of marine litter were looked for in the spectral anomalies of the Red Edge bands, assuming changes of the red edge in pixels where marine litter was mixed with vegetal materials. About half of the detected patches were unclassified due to the weakness of the useful signal (pixel filling percentage < 25%). The classification produced 59% of vegetal materials, 16% of marine litter mixed with vegetal materials and 22% of intermediate cases. A small percentage (2%) was attributed to submerged vegetal materials, found in isolated patches. The previous percentages were obtained with a separation criterion based on arbitrary thresholds. The patches were more concentrated at the mouths of the northern rivers, less off the Venice lagoon, and very few outside the Po River, with the minimal river outflow during the period. Sentinel-2 is a valid tool for the discrimination of marine litter in aggregates of floating matter. The proposed method requires validation, and the North Adriatic is an excellent site for field work, as in summer many patches of floating matter form in proximity to the coast.
1. Introduction
Marine litter is a global problem as the most durable and persistent part of marine litter consists of plastic. Human-made polymers can travel long distances and accumulate in high concentrations in central oceanic areas. While plastic debris ingested by marine mammals, fish, seabirds, turtles, and other marine organisms causes starvation and death, trophic transfer mechanisms of plastic entering the food web (bio-accumulation and bio-magnification) are not yet thoroughly understood [1,2]. The accumulation of plastic in the ocean is a global environmental concern if present-day rates are projected into the next decades.
According to [3], plastic hotspots are defined as either a component of the system that directly or indirectly contributes to plastic leakage and impact, or areas that can be acted upon to mitigate plastic leakage or its resulting impacts. Plastic hotspots in marine areas are estuaries, industrial or civilian areas, ports, areas of intense fishing activity, and busy shipping lanes. Significant actions in waste management have been taken in European Mediterranean countries since 2013 [4].
Satellite-based detection of marine litter would contribute to the identification of most plastic-infested areas and relative hotpots. Spatial and spectral resolution are crucial in marine litter detection. Satellites can detect floating agglomerates (patches) of size comparable with the pixel size; therefore, sparse fragments are always missed and often small patches as well. The floating materials include a plethora of materials of natural origin—produced by the sea (seagrass, micro- and macro-algae, cyanobacteria), caused by organic processes (slicks and foams), and of terrestrial origin naturally conveyed to the sea (driftwood and terrestrial vegetation)—or of anthropogenic origin (plastic, processed wood, paper, fabrics, rubber). Marine litter includes items that have been deliberately discarded, unintentionally lost, or carried by the wind. The satellite sensor’s spectral resolution is crucial to discriminating between the different types of floating materials.
Sentinel-2 satellite of the European Copernicus Programme is a potential tool for marine litter monitoring [5,6,7]. The MSI sensor provides free-of-charge multi-spectral data at 10, 20, and 60 m spatial resolution over a large swath area (290 km) every two or three days at middle latitudes. Sentinel-2 is used for seagrass mapping [8,9] and “sargassum” [10,11] and cyanobacteria blooms [12], and its potential in detecting plastic has been investigated in many studies [13,14,15,16,17,18]. Limits and potentials of Sentinel-2 in marine litter detection have been also discussed [15,19].
The Northern Adriatic basin, at the northern tip of the Adriatic Sea, bears the impact of several rivers and lagoons in a densely inhabited, industrialized, and intensively cultivated area. The presence of marine litter is apparent in samples collected during ship surveys [20,21], reported in studies focusing on the accumulation areas of the Mediterranean Sea [22,23] as well as in fishermen’s reports describing the frequent presence of ‘rasi’, or stripes of foam mixed with garbage washed ashore by storms (local press). Most anthropogenic debris in the North Adriatic appears to consist of plastics [21]. An extensive review of studies focused on plastic in the Adriatic Sea is provided in [24].
The aim of this study is to investigate the presence of marine litter in North Adriatic by Sentinel-2. In order to do so, the limits of Sentinel-2 outlined in previous studies were also been carefully investigated. The paper is structured as follows: data used, pre-processing steps, and the methodology adopted to detect the aggregates of floating materials and discriminate marine litter are illustrated in Section 2. Section 3 illustrates the results obtained in North Adriatic in August 2020 and in other months of the same year. Section 4 includes a discussion on the limits of marine litter detection by Sentinel-2 as outlined in previous studies, on the results obtained in North Adriatic, and on specific meteo-oceanographic conditions which foster the aggregation of sparse fragments in large patches, crucial for satellite detection of marine litter. Conclusions are drawn in Section 5.
The results of this study represent the first attempt at marine litter detection by Sentinel-2 in North Adriatic and as such require validation. In the summer, the North Adriatic offers a sort of natural laboratory, as large patches of floating matter frequently form in proximity to the coast and can be easily reached for field work.
2. Materials and Methods
2.1. Satellite Data
The North Adriatic Sea is a shallow depth basin in the northernmost region of the Mediterranean Sea. The basin is located within a densely inhabited, industrialized, and intensively cultivated area and is surrounded by many river mouths and two lagoons (Figure 1). The basin is characterized by a dominant cyclonic circulation with a marked sea-level range (relatively to the Mediterranean area).
Sentinel-2 covers North Adriatic in 4 tiles, namely 33TQL at NW, 33TUL at NE, 33TQQ at SW, and 33TUK at SE every two or three days. The data used in this study are 6 of the 13 scenes acquired in August 2020, listed in Table 1. Six scenes were selected, excluding 4 scenes due to cloud coverage and 3 other scenes due to wind. Calm or weak wind at the acquisition time appears to be a necessary condition for the detection of the floating patches, as even a moderate wind can disperse the patches in small fragments below the detection capability of Sentinel-2. This and other conditions of observability of marine litter will be discussed in Section 4.3. Other northeastern tiles (33TUL) in different months have also been used.
2.2. Pre-Processing Steps
Sentinel-2 Top of Atmosphere (TOA) reflectance (level L1C) has been processed through the ACOLITE Dark Spectrum Fitting (DSF) algorithm for atmospheric and sun glint correction [25,26]. Every single tile was processed individually (without mosaicking the tiles) to avoid remapping interpolations.
ACOLITE provides atmospheric corrected reflectance over a regular grid at 10 m for every band, regardless of the original band spatial resolution (10, 20, and 60 m for Sentinel-2). However, while 10 m band reflectance is pixel-by-pixel different, 20 and 60 m band reflectance is replicated 4 and 36 times respectively, according to the sensor’s spatial resolution. In this study, visible (bands 2, 3, 4), Red Edge (5, 6, 7) and NIR (8) bands have been used. Their common spatial resolution is 20 m, therefore the 10 m bands 2, 3, 4, and 8 have been binned at 20 m spatial resolution. The band binning of the ACOLITE output is simplified by the position of the 4 replicated values of the 20 m bands, which identify the 4 pixels of the 10 m bands (with different values) that must be averaged. All the bands used in this study have the same spatial resolution (20 m) and the extracted pixel spectra consist of reflectance at this spatial resolution.
One of the limits of Sentinel-2 in marine litter detection outlined in previous studies is that individual spectra seem affected by ‘spectral distortion due to band mismatch’ [19], but the spectral distortion is due to a conceptual error done in data binning. Indeed, the availability of 10 m gridded ACOLITE output has often been misconstrued, and pixel spectra have been composed using the 10 m gridded outputs of ACOLITE regardless of their original spatial resolution. In these spectra, reflectance at different spatial resolutions of 10, 20, and 60 m are mixed together (Figures 3 and 4 in [19]), but reflectance at a spatial resolution of 10, 20, and 60 m are average reflectance over sea surfaces of 100, 400, and 3600 m2 respectively, which means a different target for each band. This error affects several previous studies aimed at detecting detect marine litter or plastic by Sentinel-2 [19].
2.3. Detection of Floating Materials
The patches of floating materials are easily detected in band 8 (NIR) as any floating material at the sea surface is more reflective than seawater. An example of the used procedure is illustrated in Figure 2, showing that floating patches, but also boats, wakes, and other disturbances (shallow bottom) have bright signatures in NIR (Figure 2b). A mask has been used to clear the patches (Figure 2c), and the pixels brighter than 0.02 have been selected (Figure 2d).
In the six processed Sentinel-2 scenes (in Table 1) 5358 pixels containing floating materials have been detected. Average and RMS of the pixel spectra are shown in Figure 3a, in three intervals of band 8. The red edge of the averaged spectra suggests that most of the detected material is of vegetal origin, and the spectra are similar to floating seagrass endmembers [27]. The RMS, larger in Red Edge and NIR (band 8) than in the visible bands, is an encouraging sign, as variability in these bands could reflect the mixing of different materials at the sea surface. Figure 3b shows the pixel spectra of maximum reflectance found in band 8. The low figure of maximum reflectance in band 8 (0.118) indicates that the vegetal materials are not due to blooms, as the maximum reflectance in band 8 during blooms is usually higher (more than 0.25 in “sargassum”, “ulva”, “trichodesmium’ [28] and “syringodium” endmembers spectra [29]). These two considerations—that most of the patches in the North Adriatic consist of vegetal materials but are not produced by natural blooms—indicate that most of the detected materials, including the presumed marine litter, float at sea surface level. This is a crucial point, as the ability of Sentinel-2 to detect marine litter is probably limited to floating materials, as discussed in Section 4.1.
The max in band 8 is reached in pixels at the maximum density of aggregation (in actual patches). Such pixels might for instance be filled by floating materials pushed by winds along a coastal front, or by marine organisms emerging during a bloom. In these conditions, floating matter apparently fills 100% of the pixel area but leaves different interstitial room for seawater. Large fragments leave more interstitial space than small fragments. A low max in band 8 indicates large fragments, such as marine litter and sparse vegetal materials, and a high max in band 8 indicates small particles, such as marine organisms during blooms.
A suggested measure to better discriminate the type of material by comparison with endmember spectra is to subtract the seawater signal from the pixel spectrum [19]. This measure is crucial for the analysis of the visible bands, where the sea signal is strong and highly variable from area to area, less for Red Edge and NIR bands where the sea signal is almost null. The subtraction of the seawater signal was not adopted in this study because only the Red Edge bands and NIR were used for classification. The visible bands are included in the shown spectra to verify the absence of sun glint affected and anomalous pixels in general.
2.4. Discrimination of Marine Litter
A preliminary consideration in discriminating marine litter in the North Adriatic is that at the Sentinel-2 resolution of 20 m per pixel (400 m2 of sea surface), it is unlikely for a pixel area to be filled exclusively by marine litter; more probably marine litter will be mixed with floating vegetable materials. This consideration is based on the abundance of floating vegetal materials found (Figure 3a) and on the observation that marine litter and vegetal fragments are aggregated together, by the same surface transport patterns, in large patches. Proxies of marine litter have been searched in anomalies of the Red Edge bands, as materials of vegetal origin are characterized by the red edge while marine litter is not. Visible and NIR bands have not been used for discrimination because the sea color dominates the changes due to the different floating materials and all the different materials have a positive peak in band 8 (NIR).
The most practical way to detect anomalies in the Red Edge bands is to introduce the differences and , which represent the gaps between the bands, and the ratio , which indicates how much of the gap between and is still present between and . The pixels found are reported in Figure 4a using on the x-axis and on the y-axis. Pixels with higher than fill the right quadrants, and pixels with higher than fill the upper quadrants. The relative configuration of the Red Edge bands () is shown in each quadrant.
The distribution is centered around and . In most of the pixels, and are positive, which means red edge. The red edge portion in this plot is the upper-right quadrant, where is higher than and is higher than . Traces of marine litter have been searched near the lower-right quadrant, not far from the mean but with some anomalies.
The pixels have been classified as fully filled by vegetal materials (in green, in Figure 4a) if , intermediate (in orange) for and mixed marine litter and vegetal (in red) if . These thresholds have been arbitrarily chosen. The top-20 pixels in band 8 in these classes are shown in Figure 5.
The fourth class identified are pixels with a flat spectrum in bands 5, 6 and 7 (namely, ), which have not been classified (in grey, in Figure 4a). Considering the abundance of vegetal materials, flat spectrum in the red edge means pixels scarcely filled by floating matter. Figure 4b shows that this class of pixels (in grey) has reflectance less than 0.03, which, with the maximum in band 8 of 0.12 (Figure 3b), corresponds to filling percentages < 25%. These pixels could be also mucilage (or sea snot), sometimes emerging in North Adriatic [30,31]. In summer 2018, ‘in situ’ observations of ARPAE regional monitoring unit (www.arpae.it, Annual Report 2018) reported mucilage filaments south of the Po estuary that have been detected in a Sentinel-2 scene acquired on 7 August 2018, shown in Figure 6a. In the extracted spectra (213), the range of b5, b6 and b7 was less than 0.01 in 94% of cases. Many previous studies report that the spectral response of plastic is flat, and it could be argued that these pixels could be the ‘true’ spectral anomalies of marine litter or plastics. However, as in the case of marine litter, it is unlikely for plastic items to fill a pixel area on their own, with no vegetal fragments, so this hypothesis was ruled out.
The fifth class of pixels found is peculiar, and consists of the pixels lined up in the upper-left quadrant in Figure 4a. Most of these pixels have been detected in a single patch shown in Figure 6b. The spectra, also shown in Figure 6b, have been attributed to sub-merged vegetal materials, as they conform to the spectra of submerged green leaf [32].
Examples of classification are illustrated in Figure 7, where marine litter is surrounded by other pixels differently classified. Marine litter spectra (in red) show some anomalies as compared to other spectra, but it’s not clear whether the anomalies are due to actual mixing of different materials or to spectral distortions of the data. Indeed, previous studies suggest that Sentinel-2 spectra could be randomly affected by noise due to sensor’s artifacts. The issue is discussed in Section 4.1.
3. Results
3.1. North Adriatic in August 2020
The described methodology has been applied to the six Sentinel-2 scenes selected in August 2020 in North Adriatic. Out of a total of 5358 pixels found, 3281 (61%) have not been classified. Of the remaining 2077, 59% were classified as vegetal materials, 22% as intermediate, 16% as mixed marine litter and vegetal matter, and 2% as submerged vegetal materials. The patches of floating materials detected (classified and unclassified) are shown in Figure 8a, and the pixels, including marine litter, are superimposed in red in Figure 8b. The two distributions do not show substantial differences, and marine litter seems geographically distributed like the rest of the floating matter. It is worth noting that the same materials reappear several times in these maps, as the floating matter moved from place to place, reappearing in different places from one image to another. It was never possible to track the same patch at intervals of two to three days because the patches either drifted or simply disappeared, disassembled by the wind to then re-aggregate elsewhere. These maps show where the floating matter was more frequently detected in the six scenes.
Most floating patches were detected near the northern coast, an area that includes several river outlets and a lagoon (Figure 8). The high concentration decreases westwards and offshore, in keeping with the cyclonic surface circulation reinforced by occasional north-easterly summer ‘bora’ winds. The patches are located along the surface fronts which separate riverine and offshore waters (Figure 9), which is a further indication that these materials float at the sea surface. The largest amounts of floating materials were detected on the 16 and 21 of August after intense showers and the lowest on the 28 of August (not shown), but quantitative data are not too reliable because Sentinel-2 can detect only large patches, and the aggregation in large patches is fostered or inhibited by variable meteo-oceanographic conditions, as discussed in Section 4.3.
3.2. Marine Litter near the Northern Coast in Other Periods
The northern coast was investigated in other months using the 33TUL tile of Sentinel-2. In summer 2020, the scenario on the 19 of July (Figure 10a), 17 of September (Figure 10b), and 25 of October (not shown) was similar to the one found in August. In a few clear scenes in winter 2020 (Figure 10c,d), the floating matter was either absent or consisted of sparse and thin filaments in correspondence with sharp coastal fronts. As most of the floating vegetal materials in the North Adriatic seems conveyed by rivers or exchanged with the lagoons, it is unlikely that these loads cease to reach the sea in winter. The reasons large patches go undetected in winter are discussed in Section 4.3.
4. Discussion
4.1. Discrimination of Marine Litter by Sentinel-2
The results obtained in this study require some clarifications, as previous studies reported that the Sentinel-2 pixel spectra are affected by noise due to the sensor’s artifacts. This noise would cause spectral distortions that compromise the marine litter detection capability of Sentinel-2 [19]. The premise of the issue was that unexpected ‘wiggling’ was observed in the Red Edge and NIR bands of “sargassum” (Figure 8 in [19]), while the same target spectra detected by lower spatial resolution satellites do not show ‘wiggling’ at all. A smoothing over 5 × 5 pixels of Sentinel-2 was recommended to reduce this effect, but this measure would strongly reduce the (already critical) detection capability of Sentinel-2. The ‘wiggling’ effect was attributed to the sensor’s artifacts and was considered a spectral distortion affecting Sentinel-2 data.
The ‘wiggling’ effect noted for “sargassum” is observed also in the case of “trichodesmium” cyanobacteria, detected by Sentinel-2 during a bloom offshore Queensland (AUS) and shown in Figure 11a. The large RMS of the Red Edge bands in the averaged spectra (Figure 11b) means ‘wiggling’ in these bands, shown in Figure 11c for pixels around b8 = 0.2.
Figure 11a, obtained with a RGB composition accurately stretched, reveals the tri-dimensional scenario of the “trichodesmium” bloom. Cyanobacteria are variously distributed in the euphotic zone several meters deep and are disposed over differently oriented submerged oblique surfaces. The ‘wiggling’ effect observed in “sargassum” and “trichodesmium” spectra of Sentinel-2 might reflect the complex tri-dimensional distribution of marine organisms during blooms and therefore be due to the variety of the submerged distributions. In this case, statistics of the ‘wiggling’ effect could provide more information about these natural blooms. It is worth noting that the suggested measure of smoothing over 5 × 5 pixels of Sentinel-2 [19] reduces the ‘wiggling’ effect simply because it makes “sargassum” and “trichodesmium” Sentinel-2 spectra more similar to the spectra detected by satellites at lower spatial resolution. Appendix A illustrates the case of water pixels partially filled by emerging objects that also show ‘wiggling’ in the Red Edge and NIR bands. In this case, the ‘wiggling’ effect is justified by the variety of different geometries of observations.
A further element enforcing the observation that the ‘wiggling’ effect is not due to the sensor’s artifacts but to a complex tri-dimensional distribution of floating matter is that ‘wiggling’ does not affect the floating patches detected in North Adriatic. Figure 12a shows some large patches heading SW, which is a rare opportunity as wind drifting patches are usually much smaller. In these patches, which do not include a submerged fraction as they are pushed by the wind, the ‘wiggling’ effect is minimal, as shown in Figure 12c.
Also, the patches detected in the six scenes of August 2020, which consist of vegetal materials sometimes mixed with marine litter, show less ‘wiggling’ than “trichodesmium”. Figure 13 shows the average (Figure 13a) and RMS (Figure 13b) of the differences , , and for “trichodesmium” and for North Adriatic patches, plotted for increasing values of band 8. The RMS in North Adriatic is about half that for “trichodesmium”, despite the former consisting of mixed materials and the latter only of cyanobacteria.
Other factors which potentially degrade the accuracy of Sentinel-2 data are bidirectional reflectance effects [15], which can reach 0.01 in Red Edge bands [33], and atmospheric correction, with RMS < 0.01 in the Red Edge and <0.005 in NIR [34]. Both errors could explain the small differences between the Red Edge bands on which the classification is based (Figure 5). However, both errors similarly affect large sea areas, and the Red Edge anomalies detected in adjacent pixels (Figure 7) are not due to these sources of noise.
In conclusion, the detection of marine litter by Sentinel-2 seems plausible for the North Adriatic. The floating matter simply floats at sea surface level or can be just slightly below the surface; thus, Red Edge anomalies are due to the different types of floating materials and not to a complex tri-dimensional distribution. The adopted classification methodology requires substantial validation work: the first point to clarify is if traces of marine litter in North Adriatic can be detected by anomalies of the Red Edge bands of Sentinel-2; the second, is if the adopted classification actually reflects a progressive decrease in marine litter content from ‘mixed’ to ‘intermediate’ and from ‘intermediate’ to ‘vegetal’ pixels.
4.2. Results in North Adriatic
Marine litter evidence is provided by Sentinel-2 only if the floating matter is aggregated in large patches, typically in the proximity of rivers and lagoons. In North Adriatic, marine litter was found wherever large patches were detected (Figure 8b).
The areas deserving punctual investigations of marine litter hotspots are the northern coast (Marano lagoon and surrounding rivers) and the NW coast (Venice lagoon and surrounding rivers), where large patches were more frequently detected (Figure 8). It is not clear whether the fewer patches detected along the NW coast are due to fewer river outlets (patches locally formed) or they have drifted westwards from the northern coast. The few patches detected around the Po estuary could be due to the annual minimal outflow in August 2020, and the area should be investigated in other seasons [35]. No large patches were detected along the NE coast (including the Gulf of Trieste, Slovenian, and Croatian coasts), and information about marine litter is not available. In these areas, marine litter could be absent or equally present, as sparse floating materials or organized in small patches are missed at the Sentinel-2 spatial resolution.
An attempt was made to verify if marine litter along the northern coast were due to the touristic presence, huge in summer and peaking in mid-August. Other summer scenes in July (Figure 10a), September (Figure 10b), and October (not shown) show that marine litter was present as in August; hence, marine litter does not seem correlated to the touristic presence.
4.3. Observability of Marine Litter by Sentinel-2
Sentinel-2 detects patches of comparable size to the pixel area and misses sparse fragments and small patches. The missed amount at 20 m spatial resolution can reach 90% of the total amount of floating matter detected at 1 m, as reported by spatial sensitivity analysis of seagrass patches [29]. This would confirm the ability of Sentinel-2 to detect the presence or absence of marine litter where possible, i.e., where large patches of floating matter form. The conditions of observability listed below consist of meteo-oceanographic scenarios fostering the aggregation of floating debris in large patches.
The main condition is calm or weak wind at the acquisition time. Three clear sky scenes in August 2020 (on 6, 11, and 23 in Table 1) were discarded because most of the patches had been fragmented and dispersed by the wind. The patches detected in these windy scenes (Figure 14) resemble the extended chain-like trails and Langmuir stripes observed in the case of wind acting on tsunami-washed debris [36]. The formation of organized windrows of seagrass was observed for wind speed > 10 ms−1, but drifting patches in North Adriatic have been observed with weaker wind. An important threshold that remains unestablished is the wind speed necessary to disperse the patches.
Other conditions are the occurrence of heavy rains and weak and stable winds in the previous days. The first increases the discharged river loads, the second fosters the growth of large patches by progressive accumulation along coastal fronts; conversely, a few hours of moderate wind seem to disperse the patches. The last condition pertains to the role played by the coastal fronts, with possible relevance to seasonal differences. Coastal fronts act as a substrate where floating matter accumulates; therefore, many sharp fronts provide many accumulation areas. The stratification offshore the Po estuary was investigated in [37], and the results—strong stratification in summer (May to October) and vertical homogeneity in winter—can be extended to the whole basin. Strong stratification causes fresh river waters to float to the surface, forming thin and extended plumes, which are frequently moved by the wind and by the surface current. Thus, in summer, there are plenty of surface fronts where marine litter accumulates. In winter, vertical homogeneity causes rivers’ plumes that are deeper and less extended horizontally, offering less shelter to the formation of large patches. These factors could explain why large patches of floating matter were not detected in winter images (Figure 10).
5. Conclusions
This study is an attempt to detect marine litter by Sentinel-2 in North Adriatic in August 2020. Most of the floating matter found is vegetal and—since the largest amounts were detected after intense showers—probably originated on land and conveyed to sea by the rivers. The role played by the lagoons should be taken into account in cases of extreme tidal events. Reliable results in terms of the presence or absence of marine litter were obtained only for pixels filled at more than 25% with the floating matter. The classification produced ‘vegetal’ pixels (59%), marine litter contaminated pixels (16%), and 22% of ‘intermediate’ pixels, using arbitrary thresholds. Different thresholds in the classification method could erode or increase the previous percentages.
Equally contaminated areas resulted from the northern coast, more specifically the area comprised between the Tagliamento and Isonzo rivers that include the Marano lagoon, and the NW coast, outside the Venice lagoon. No information is available for the area close to the NE coast (the Gulf of Trieste, Slovenian, and Croatian coasts) scarcely affected by large patches of floating matter. No significant results were obtained around the Po estuary due to the minimal river outflow in August 2020. In summer, the North Adriatic is an excellent area for validation assessment as many extended patches form at a short distance from the coast. In winter, meteo-oceanographic conditions don’t foster the formation of large patches.
The detection of marine litter by Sentinel-2 seems plausible if the marine litter is aggregated with other floating materials. In cases of coincident natural blooms, reliable detection of marine litter seems less likely.
Funding
This research received no external funding.
Data Availability Statement
Copernicus Open Access Hub.
Acknowledgments
Copernicus Sentinel mission for providing open access to Sentinel-2/MSI data and Elena Cantoni for revising the text.
Conflicts of Interest
The author declares no conflict of interest.
Appendix A
The Floating Piers in Lake Iseo (Summer 2016)
The ‘Floating Piers’ artwork was installed by artist Christo in June–July 2016 in lake Iseo, an internal lake in northern Italy. The piers consist of three walks 16 m wide connecting the small islands of the lake (Figure A1). The artworks, captured by three Sentinel-2 scenes on 21, 28 June and on 1st July, offer the opportunity to observe water pixels partially occupied by the same target (the piers) in different scenes, i.e., with different acquisition geometries (one Sentinel-2 tile was different) and different atmospheric corrections.
Figure A1.
The Floating Piers in Lake Iseo (by Christo, June–July 2016) observed by Sentinel-2. The piers were detected in 274 pixels in three Sentinel-2 scenes.
Figure A1.
The Floating Piers in Lake Iseo (by Christo, June–July 2016) observed by Sentinel-2. The piers were detected in 274 pixels in three Sentinel-2 scenes.

The piers were detected in 274 pixels. Considering that the piers were 16 m wide, most of the detected pixels were filled at more than 50% by water. The first aspect investigated is the filling percentage of the pixel area, estimated using band 8. The filling percentage was obtained for each scene by scaling band 8 with the maximum value found over the large platform, which pixel was assumed 100% filled (Figure A2a). The filling percentages (averaged in the three dates) shown in Figure A2b seem realistic, considering the width of the pier (16 m) and the pixel size (20 m). The daily filling percentages in the same pixel plotted in Figure A2c show that the error in the three dates was within a 10% margin, which is a good estimate. The pixel spectra are affected by huge ‘wiggling’ in the Red Edge bands. The spectra shown in Figure A2d, around b8 = 0.2, correspond to pixel filled at about 66% by water, considering the maximum in band 8 of 0.6 (Figure A2e).
Figure A2.
(a) Max of band 8 found within the enlarged platform. (b) Pixel filling percentages (percent) along the pier. (c) Filling percentages of the same pixels in the three dates. (d) The ‘wiggling’ effect for pixels comprised in a small range of band 8. (e) Spectra of the pixel with max in band 8 in the three Sentinel-2 scenes.
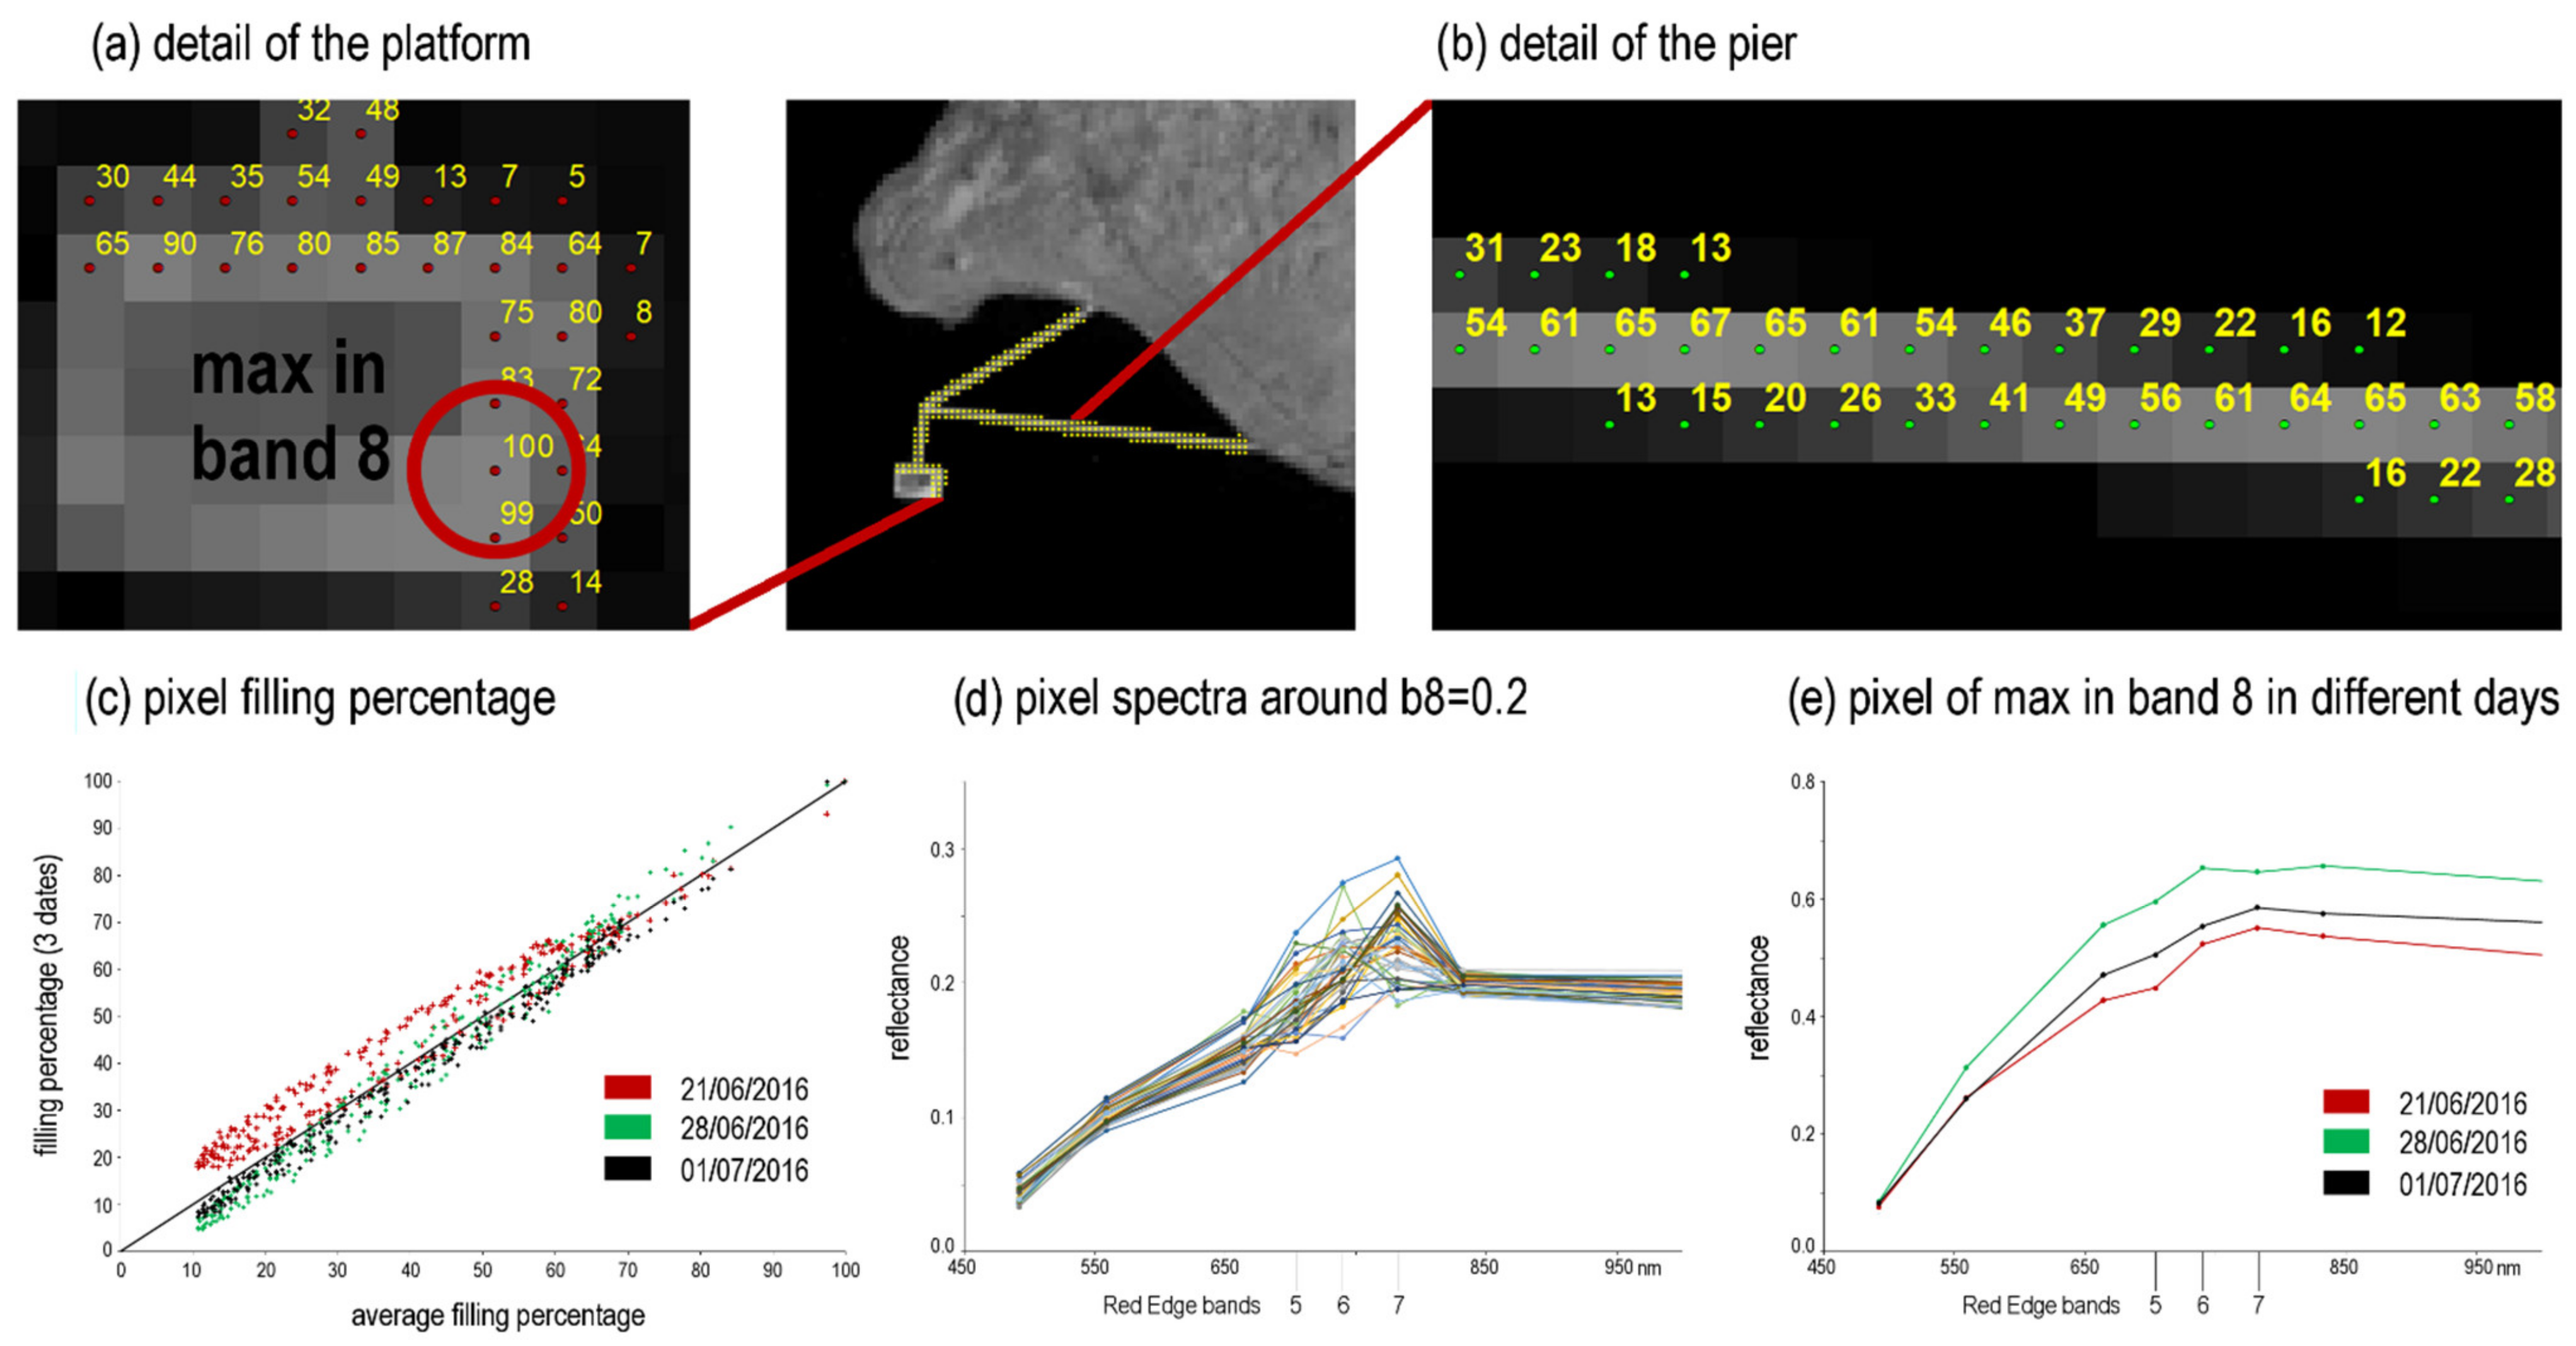
The huge presence of ‘wiggling’ is due to the variety of sun, target, and satellite geometries on which these pixels, filled at 34% by the floating piers that emerge from water, are detected by Sentinel-2. Finally, the effects of the atmospheric correction estimated in the pixel with the maximum in band 8, a pixel which is not affected by ‘wiggling’, are shown in Figure A2e.
References
- Deudero, S.; Alomar, C. Mediterranean marine biodiversity under threat: Reviewing influence of marine litter on species. Mar. Pollut. Bull. 2015, 98, 58–68. [Google Scholar] [CrossRef] [PubMed]
- Maximenko, N.; Corradi, P.; Law, K.L.; Van Sebille, E.; Garaba, S.P.; Lampitt, R.S.; Galgani, F.; Martinez-Vicente, V.; Goddijn-Murphy, L.; Veiga, J.M.; et al. Toward the Integrated Marine Debris Observing System. Front. Mar. Sci. 2019, 6, 447. [Google Scholar] [CrossRef] [Green Version]
- UNEP. Marine Litter: An Analytical Overview; Intergovernmental Oceanographic Commission of The United Nations Educational, Scientific and Cultural Organisation: Paris, France, 2005. [Google Scholar]
- Galgani, F.; Claro, F.; Depledge, M.; Fossi, C. Monitoring the impact of litter in large vertebrates in the Mediterranean Sea within the European Marine Strategy Framework Directive (MSFD): Constraints, specificities and recommendations. Mar. Environ. Res. 2014, 100, 3–9. [Google Scholar] [CrossRef] [PubMed] [Green Version]
- Hafeez, S.; Wong, M.S.; Abbas, S.; Kwok, C.Y.T.; Nichol, J.; Lee, K.H.; Tang, D.; Pun, L. Detection and Monitoring of Marine Pollution Using Remote Sensing Technologies. In Monitoring of Marine Pollution, Houma Bachari Fouzia; IntechOpen: London, UK, 2018. [Google Scholar] [CrossRef] [Green Version]
- Martínez-Vicente, V.; Clark, J.R.; Corradi, P.; Aliani, S.; Arias, M.; Bochow, M.; Bonnery, G.; Cole, M.; Cózar, A.; Donnelly, R.; et al. Measuring Marine Plastic Debris from Space: Initial Assessment of Observation Requirements. Remote Sens. 2019, 11, 2443. [Google Scholar] [CrossRef] [Green Version]
- Garaba, S.P.; Arias, M.; Corradi, P.; Harmel, T.; de Vries, R.; Lebreton, L. Concentration, anisotropic and apparent colour effects on optical reflectance properties of virgin and ocean-harvested plastics. J. Hazard. Mater. 2021, 406, 124290. [Google Scholar] [CrossRef]
- Traganos, D.; Reinartz, P. Mapping Mediterranean seagrasses with Sentinel-2 imagery. Mar. Pollut. Bull. 2018, 134, 197–209. [Google Scholar] [CrossRef] [Green Version]
- Carpenter, S.; Byfield, V.; Felgate, S.L.; Price, D.M.; Andrade, V.; Cobb, E.; Strong, J.; Lichtschlag, A.; Brittain, H.; Barry, C.; et al. Using Unoccupied Aerial Vehicles (UAVs) to Map Seagrass Cover from Sentinel-2 Imagery. Remote Sens. 2022, 14, 477. [Google Scholar] [CrossRef]
- Descloitres, J.; Minghelli, A.; Steinmetz, F.; Chevalier, C.; Chami, M.; Berline, L. Revisited Estimation of Moderate Resolution Sargassum Fractional Coverage Using Decametric Satellite Data (S2-MSI). Remote Sens. 2021, 13, 5106. [Google Scholar] [CrossRef]
- Wang, M.; Hu, C. Automatic extraction of Sargassum features from Sentinel-2 MSI images. IEEE Trans. Geosci. Remote Sens. 2021, 59, 2579–2597. [Google Scholar] [CrossRef]
- Viso-Vázquez, M.; Acuña-Alonso, C.; Rodríguez, J.L.; Álvarez, X. Remote Detection of Cyanobacterial Blooms and Chlorophyll-a Analysis in a Eutrophic Reservoir Using Sentinel-2. Sustainability 2021, 13, 8570. [Google Scholar] [CrossRef]
- Themistocleous, K.; Papoutsa, C.; Michaelides, S.; Hadjimitsis, D. Investigating Detection of Floating Plastic Litter from Space Using Sentinel-2 Imagery. Remote Sens. 2020, 12, 2648. [Google Scholar] [CrossRef]
- Topouzelis, K.; Papakonstantinou, A.; Garaba, S.P. Detection of floating plastics from satellite and unmanned aerial systems (Plastic Litter Project 2018). Int. J. Appl. Earth Obs. Geoinf. 2019, 79, 175–183. [Google Scholar] [CrossRef]
- Topouzelis, K.; Papageorgiou, D.; Karagaitanakis, A.; Papakonstantinou, A.; Arias Ballesteros, M. Remote Sensing of Sea Surface Artificial Floating Plastic Targets with Sentinel-2 and Unmanned Aerial Systems (Plastic Litter Project 2019). Remote Sens. 2020, 12, 2013. [Google Scholar] [CrossRef]
- Kikaki, A.; Karantzalos, K.; Power, C.A.; Raitsos, D.E. Remotely Sensing the Source and Transport of Marine Plastic Debris in Bay Islands of Honduras (Caribbean Sea). Remote Sens. 2020, 12, 1727. [Google Scholar] [CrossRef]
- Biermann, L.; Clewley, D.; Martínez -Vicente, V.; Topouzelis, K. Finding Plastic Patches in Coastal Waters using Optical Satellite Data. Sci. Rep. 2020, 10, 5364. [Google Scholar] [CrossRef] [Green Version]
- Ciappa, A.C. Marine plastic litter detection offshore Hawai’i by Sentinel-2. Mar. Pollut. Bull. 2021, 168, 112457. [Google Scholar] [CrossRef]
- Hu, C. Remote detection of marine debris using satellite observations in the visible and near infrared spectral range: Challenges and potentials. Remote Sens. Environ. 2021, 259, 112414. [Google Scholar] [CrossRef]
- Zeri, C.; Adamopoulou, A.; Varezić, D.B.; Fortibuoni, T.; Viršek, M.K.; Kržan, A.; Mandic, M.; Mazziotti, C.; Palatinus, A.; Peterlin, M.; et al. Floating plastics in Adriatic waters (Mediterranean Sea): From the macro- to the micro-scale. Mar. Pollut. Bull. 2018, 136, 341–350. [Google Scholar] [CrossRef]
- Campanale, C.; Suaria, G.; Bagnuolo, G.; Baini, M.; Galli, M.; De Rysky, E.; Ballini, M.; Aliani, S.; Fossi, M.C.; Uricchio, V.F. Visual observations of floating macro litter around Italy (Mediterranean Sea). Mediterr. Mar. Sci. 2019, 20, 271–281. [Google Scholar] [CrossRef]
- Liubartseva, S.; Coppini, G.; Lecci, R.; Creti, S. Regional approach to modelling the transport of floating plastic debris in the Adriatic Sea. Mar. Pollut. Bull. 2016, 103, 115–127. [Google Scholar] [CrossRef]
- Mansui, J.; Darmon, G.; Ballerini, T.; van Canneyt, O.; Ourmieres, Y.; Miaud, C. Predicting marine litter accumulation patterns in the Mediterranean basin: Spatio-temporal variability and comparison with empirical data. Prog. Oceanogr. 2016, 182, 102268. [Google Scholar] [CrossRef]
- Schmid, C.; Cozzarini, L.; Zambello, E. A critical review on marine litter in the Adriatic Sea: Focus on plastic pollution. Environ. Pollut. 2021, 273, 116430. [Google Scholar] [CrossRef]
- Harmel, T.; Chami, M.; Tormos, T.; Reynaud, N.; Danis, P.-A. Sunglint correction of the Multi-Spectral Instrument (MSI)-SENTINEL-2 imagery over inland and sea waters from SWIR bands. Remote Sens. Environ. 2018, 204, 308–321. [Google Scholar] [CrossRef]
- Vanhellemont, Q. Adaptation of the dark spectrum fitting atmospheric correction for aquatic applications of the Landsat and Sentinel-2 archives. Remote Sens. Environ. 2019, 225, 175–192. [Google Scholar] [CrossRef]
- Dogliotti, A.I.; Gossn, J.I.; Vanhellemont, Q.; Ruddick, K.G. Detecting and Quantifying a Massive Invasion of Floating Aquatic Plants in the Río de la Plata Turbid Waters Using High Spatial Resolution Ocean Color Imagery. Remote Sens. 2018, 10, 1140. [Google Scholar] [CrossRef] [Green Version]
- Hu, C.; Feng, L.; Hardy, R.F.; Hochberg, E.J. Spectral and spatial requirements of remote measurements of pelagic Sargassum macroalgae. Remote Sens. Environ. 2015, 167, 229–246. [Google Scholar] [CrossRef]
- Dierssen, H.M.; Chlus, A.; Russell, B. Hyperspectral discrimination of floating mats of seagrass wrack and the macroalgae Sargassum in coastal waters of Greater Florida Bay using airborne remote sensing. Remote Sens. Environ. 2015, 167, 247–258. [Google Scholar] [CrossRef]
- Schiaparelli, S.; Castellano, M.; Povero, P.; Sartoni, G.; Cattaneo-Vietti, R. A benthic mucilage event in North-Western Mediterranean Sea and its possible relationships with the summer 2003 European heatwave: Short term effects on littoral rocky assemblages. Mar. Ecol. 2007, 28, 341–353. [Google Scholar] [CrossRef]
- Acar, U.; Yılmaz, O.S.; Çelen, M.; Ateş, A.M.; Gülgen, F.; Balık Şanlı, F. Determination of Mucilage in The Sea of Marmara Using Remote Sensing Techniques with Google Earth Engine. Int. J. Environ. Geoinform. 2021, 8, 423–434. [Google Scholar] [CrossRef]
- Gower, J.; Doerffer, R.; Borstad, G.A. Interpretation of the 685 nm peak in water-leaving radiance spectra in terms of fluorescence, absorption and scattering, and its observation by MERIS. Int. J. Remote Sens. 1999, 20, 1771–1786. [Google Scholar] [CrossRef]
- Kremezi, M.; Karathanassi, V. Correction of the BRDF Effects on Sentinel-2 Ocean Images. In Proceedings of the IGARSS 2019—2019 IEEE International Geoscience and Remote Sensing Symposium, Yokohama, Japan, 28 July–2 August 2019; pp. 9010–9013. [Google Scholar] [CrossRef]
- Vanhellemont, Q. Sensitivity analysis of the dark spectrum fitting atmospheric correction for metre- and decametre-scale satellite imagery using autonomous hyperspectral radiometry. Opt. Express 2020, 28, 29948–29965. [Google Scholar] [CrossRef] [PubMed]
- Van der Wal, M.; van der Meulen, M.; Tweehuijsen, G.; Peterlin, M.; Palatinus, A.; Kovac Viršek, M. (Eds.) SFRA0025: Identification and assessment of riverine input of (Marine) litter. In Report for Michail Papadoyannakis, DG Environment, United Kingdom; Eunomia Research & Consulting Ltd.: Bristol, UK, 2015; Volume 186. [Google Scholar]
- Matthews, J.P.; Ostrovsky, L.; Yoshikawa, Y.; Komori, S.; Tamura, H. Dynamics and early post-tsunami evolution of floating marine debris near Fukushima Daiichi. Nat. Geosci. 2017, 10, 598–603. [Google Scholar] [CrossRef]
- Jeffries, M.A.; Lee, C.M. A climatology of the northern Adriatic Sea’s response to bora and river forcing. J. Geophys. Res. 2007, 112, C03S02. [Google Scholar] [CrossRef]
Figure 1.
Mosaic of the Sentinel-2 scenes over North Adriatic (4 tiles on 13th of August 2020, ‘true colour’ RGB combination) with the indication of main rivers (white) and lagoons (yellow).
Figure 1.
Mosaic of the Sentinel-2 scenes over North Adriatic (4 tiles on 13th of August 2020, ‘true colour’ RGB combination) with the indication of main rivers (white) and lagoons (yellow).
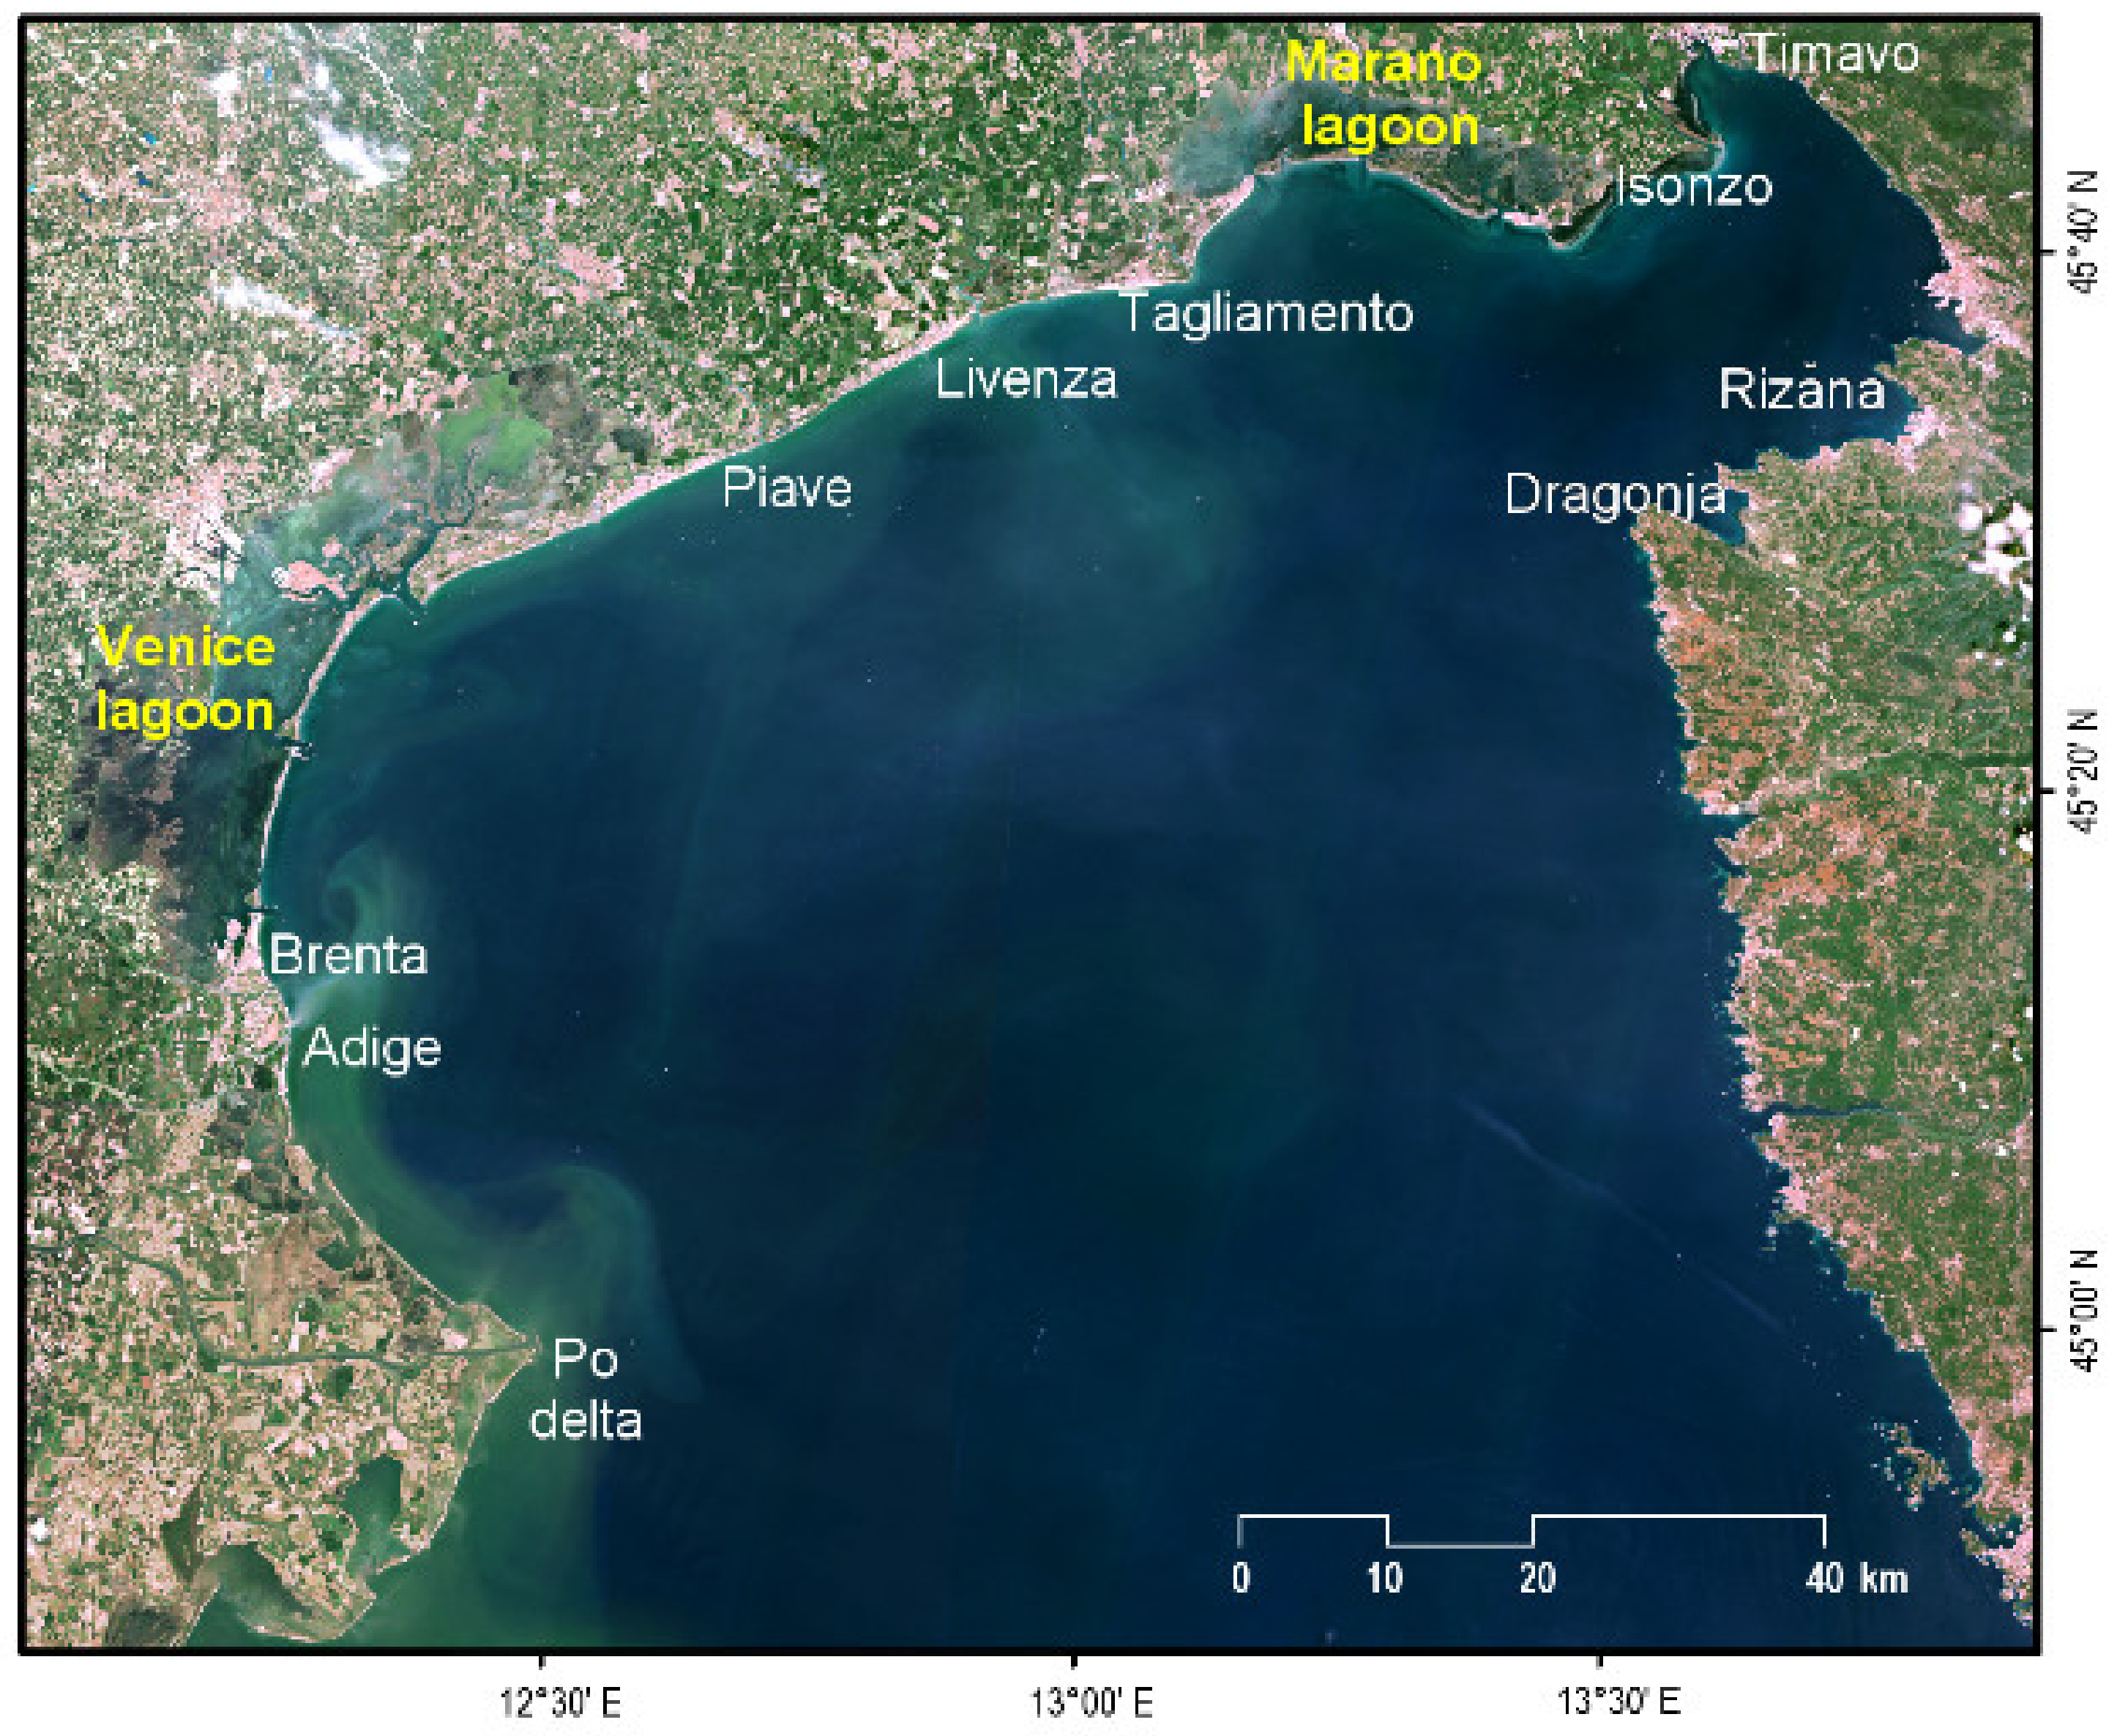
Figure 2.
(a) Patches of floating materials, boats, and wakes in the visible channels. (b) NIR (band 8 of Sentinel-2). (c) Mask applied around the patches. (d) Detected patches using the threshold of 0.02 in band 8 (Sentinel-2 tile: 33TUL, 21 August 2020).
Figure 2.
(a) Patches of floating materials, boats, and wakes in the visible channels. (b) NIR (band 8 of Sentinel-2). (c) Mask applied around the patches. (d) Detected patches using the threshold of 0.02 in band 8 (Sentinel-2 tile: 33TUL, 21 August 2020).

Figure 3.
(a) Average and RMS of the floating patches spectra detected in August 2020 in North Adriatic. (b) Band 8 top-20 maximum reflectance spectra on different dates of August 2020.
Figure 3.
(a) Average and RMS of the floating patches spectra detected in August 2020 in North Adriatic. (b) Band 8 top-20 maximum reflectance spectra on different dates of August 2020.
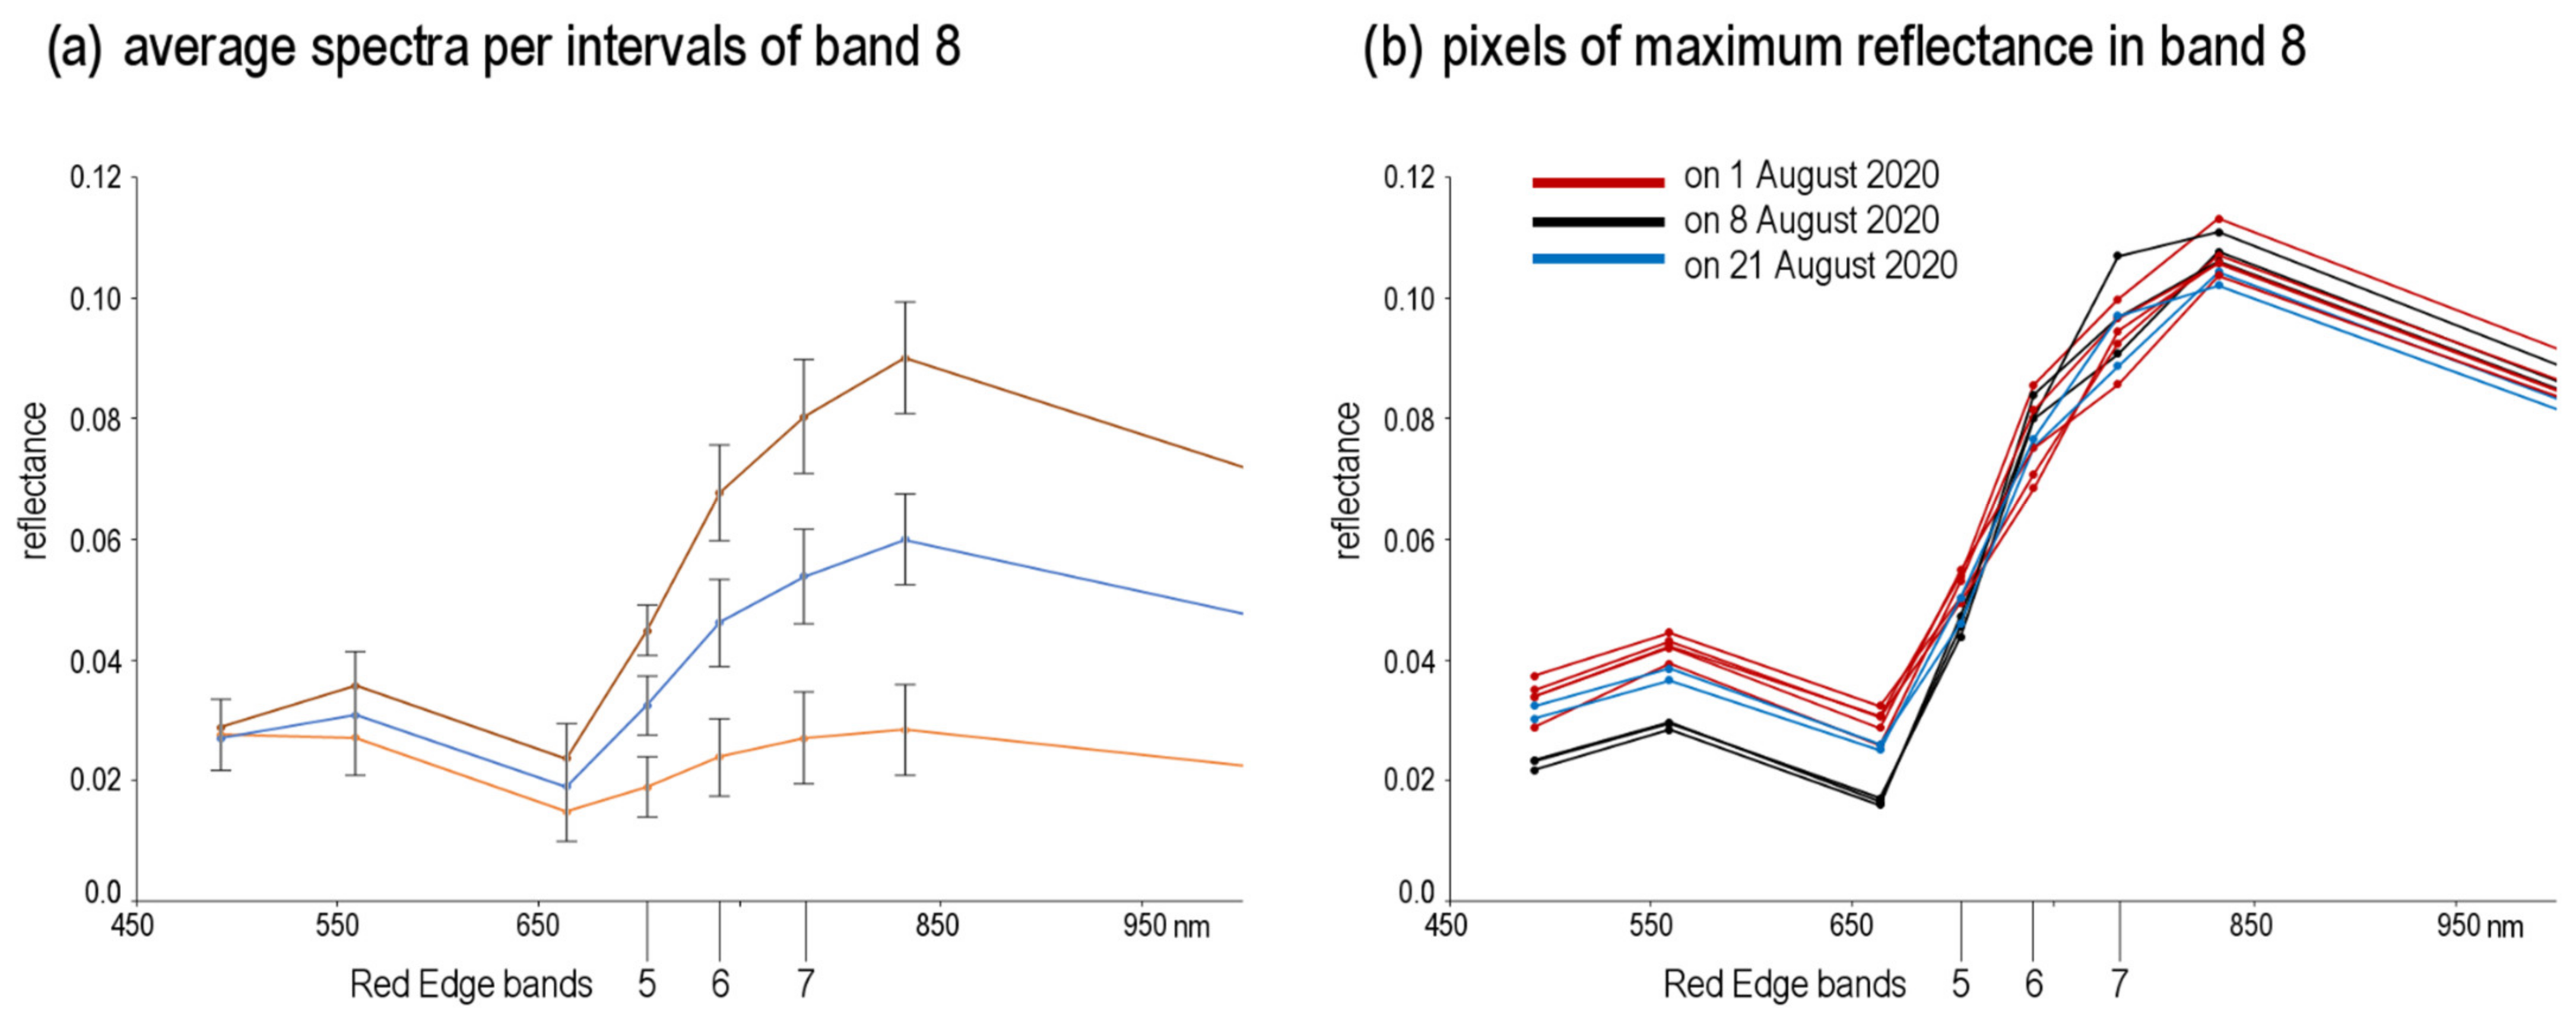
Figure 4.
(a) Classification method based on spectral differences (x-axis) and (y-axis); ; the grey polygon fits the condition: . (b) Classified pixels plotted vs. band 8 (NIR).
Figure 4.
(a) Classification method based on spectral differences (x-axis) and (y-axis); ; the grey polygon fits the condition: . (b) Classified pixels plotted vs. band 8 (NIR).
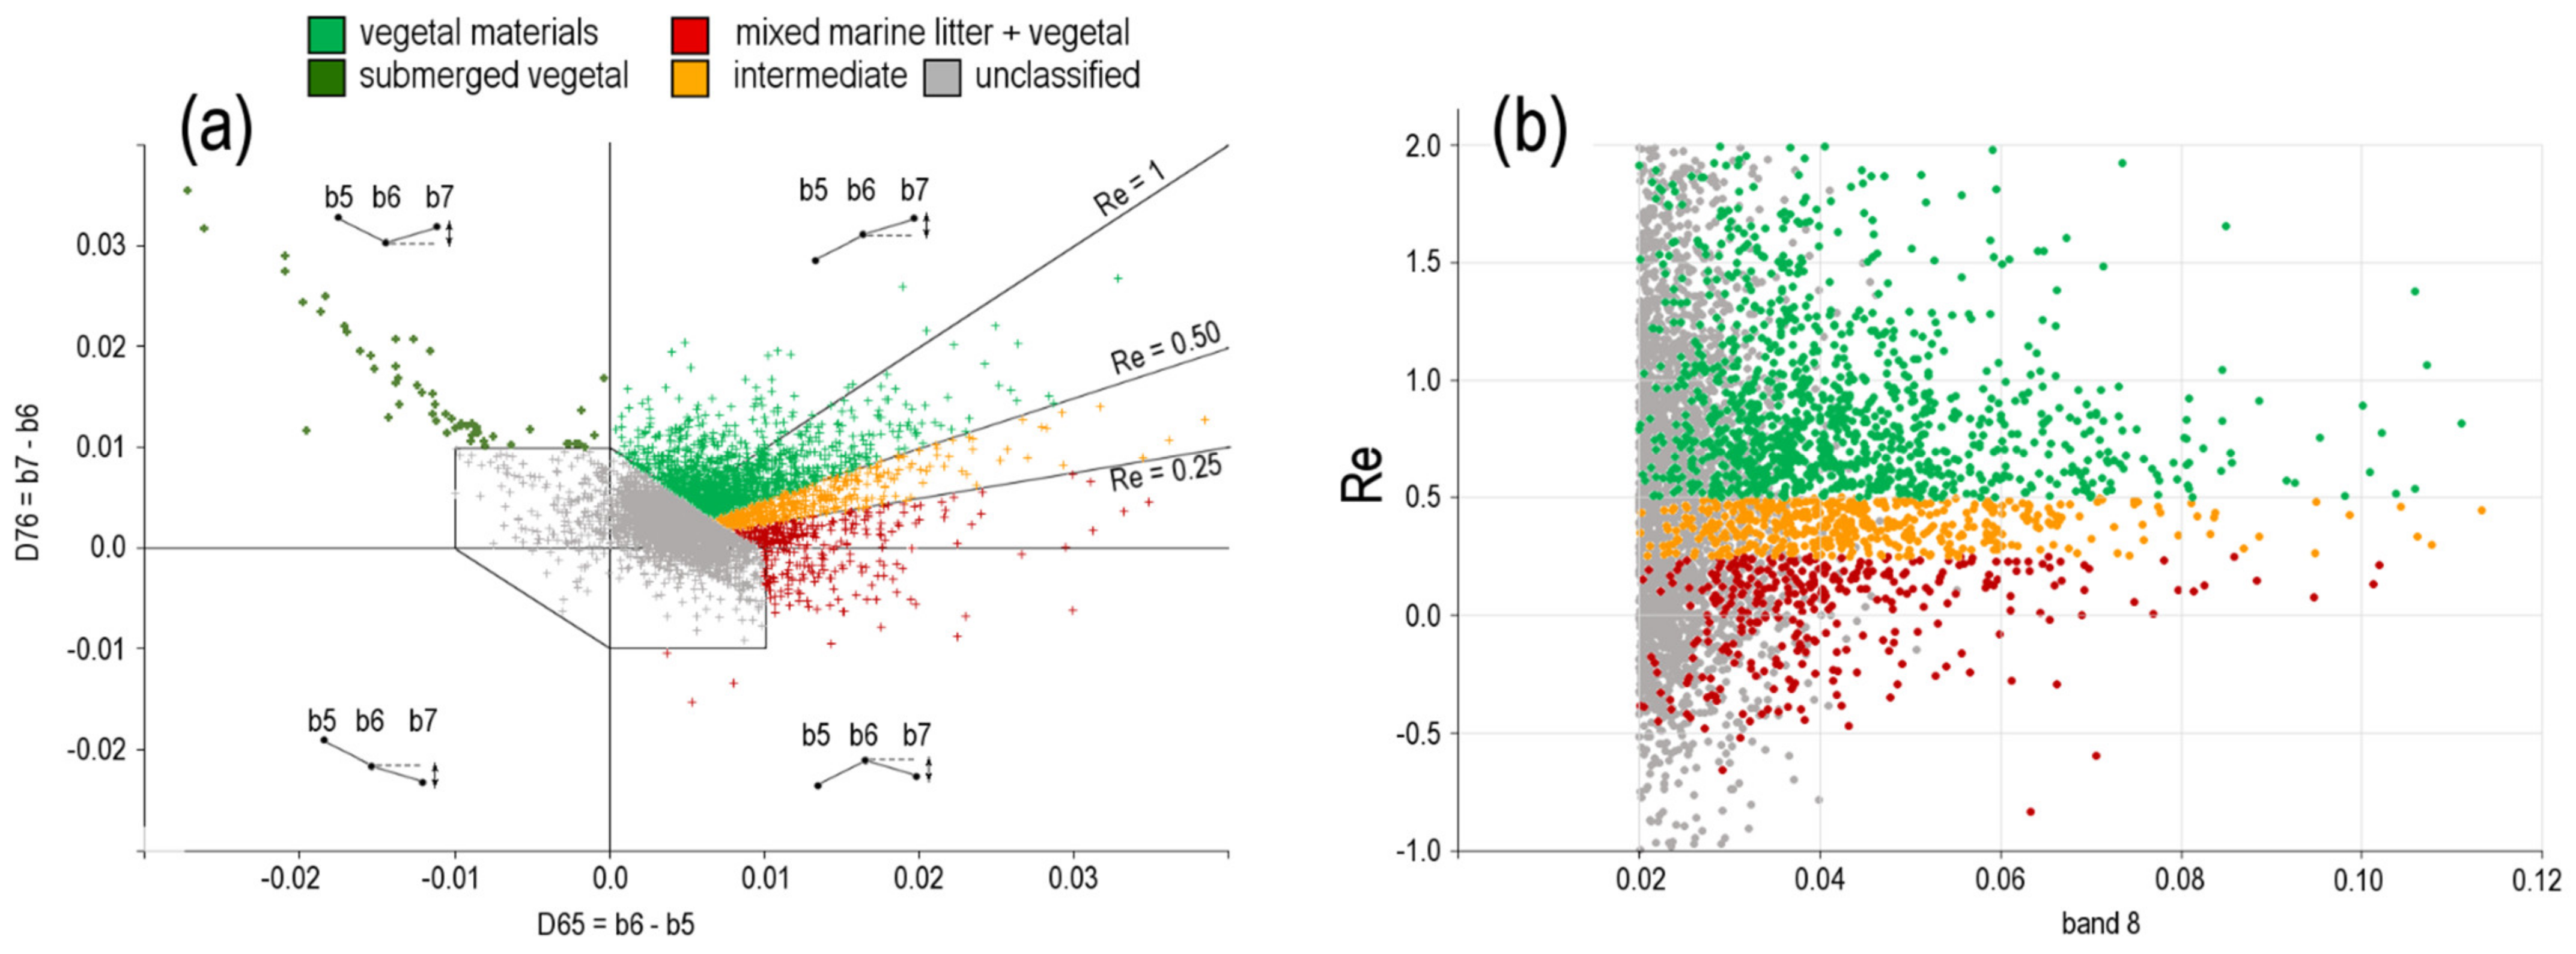
Figure 5.
Spectra of ‘mixed’ (a), ‘intermediate’ (b) and ‘vegetal’ (c) classified matter detected in North Adriatic in August 2020 (top-20 pixels in band 8 for each class).
Figure 5.
Spectra of ‘mixed’ (a), ‘intermediate’ (b) and ‘vegetal’ (c) classified matter detected in North Adriatic in August 2020 (top-20 pixels in band 8 for each class).

Figure 6.
(a) Mucilage spectra south of the Po estuary (top-10 pixels in band 8) detected in a Sentinel-2 scene acquired in summer 2018. (b) Pixel spectra classified as submerged vegetal materials detected in August 2020.
Figure 6.
(a) Mucilage spectra south of the Po estuary (top-10 pixels in band 8) detected in a Sentinel-2 scene acquired in summer 2018. (b) Pixel spectra classified as submerged vegetal materials detected in August 2020.

Figure 7.
Examples of marine litter spectra (in red) surrounded by different pixels in actual patches detected in North Adriatic in August 2020.
Figure 7.
Examples of marine litter spectra (in red) surrounded by different pixels in actual patches detected in North Adriatic in August 2020.

Figure 8.
(a) Spatial distribution of the detected patches (including ‘unclassified’ pixels) on 6 dates of August 2020. (b) Spatial distribution of marine litter superimposed in red. The patches were enlarged to be visible at this scale. The maps indicate where floating matter was more frequently detected and not the total amount, because the same floating materials moved from one date to the next.

Figure 9.
Most relevant distributions of floating matter in August 2020 in different areas of North Adriatic.
Figure 9.
Most relevant distributions of floating matter in August 2020 in different areas of North Adriatic.

Figure 10.
Classified patches in other months of summer 2020, on 19 July (a) and 17 September (b), and unclassified patches in winter 2020, on 16 March (c) and 14 February 2021 (d).
Figure 10.
Classified patches in other months of summer 2020, on 19 July (a) and 17 September (b), and unclassified patches in winter 2020, on 16 March (c) and 14 February 2021 (d).

Figure 11.
(a) “Trichodesmium” cyanobacteria bloom detected on 11 November 2020 off Gold Coast (QLD), eastern Australia (Sentinel-2 tile: T56JNS). (b) Averaged spectra and RMS around b8 = 0.35, b8 = 0.15 and b8 = 0.05. (c) Pixel spectra around b8 = 0.2 largely affected by ‘wiggling’.
Figure 11.
(a) “Trichodesmium” cyanobacteria bloom detected on 11 November 2020 off Gold Coast (QLD), eastern Australia (Sentinel-2 tile: T56JNS). (b) Averaged spectra and RMS around b8 = 0.35, b8 = 0.15 and b8 = 0.05. (c) Pixel spectra around b8 = 0.2 largely affected by ‘wiggling’.
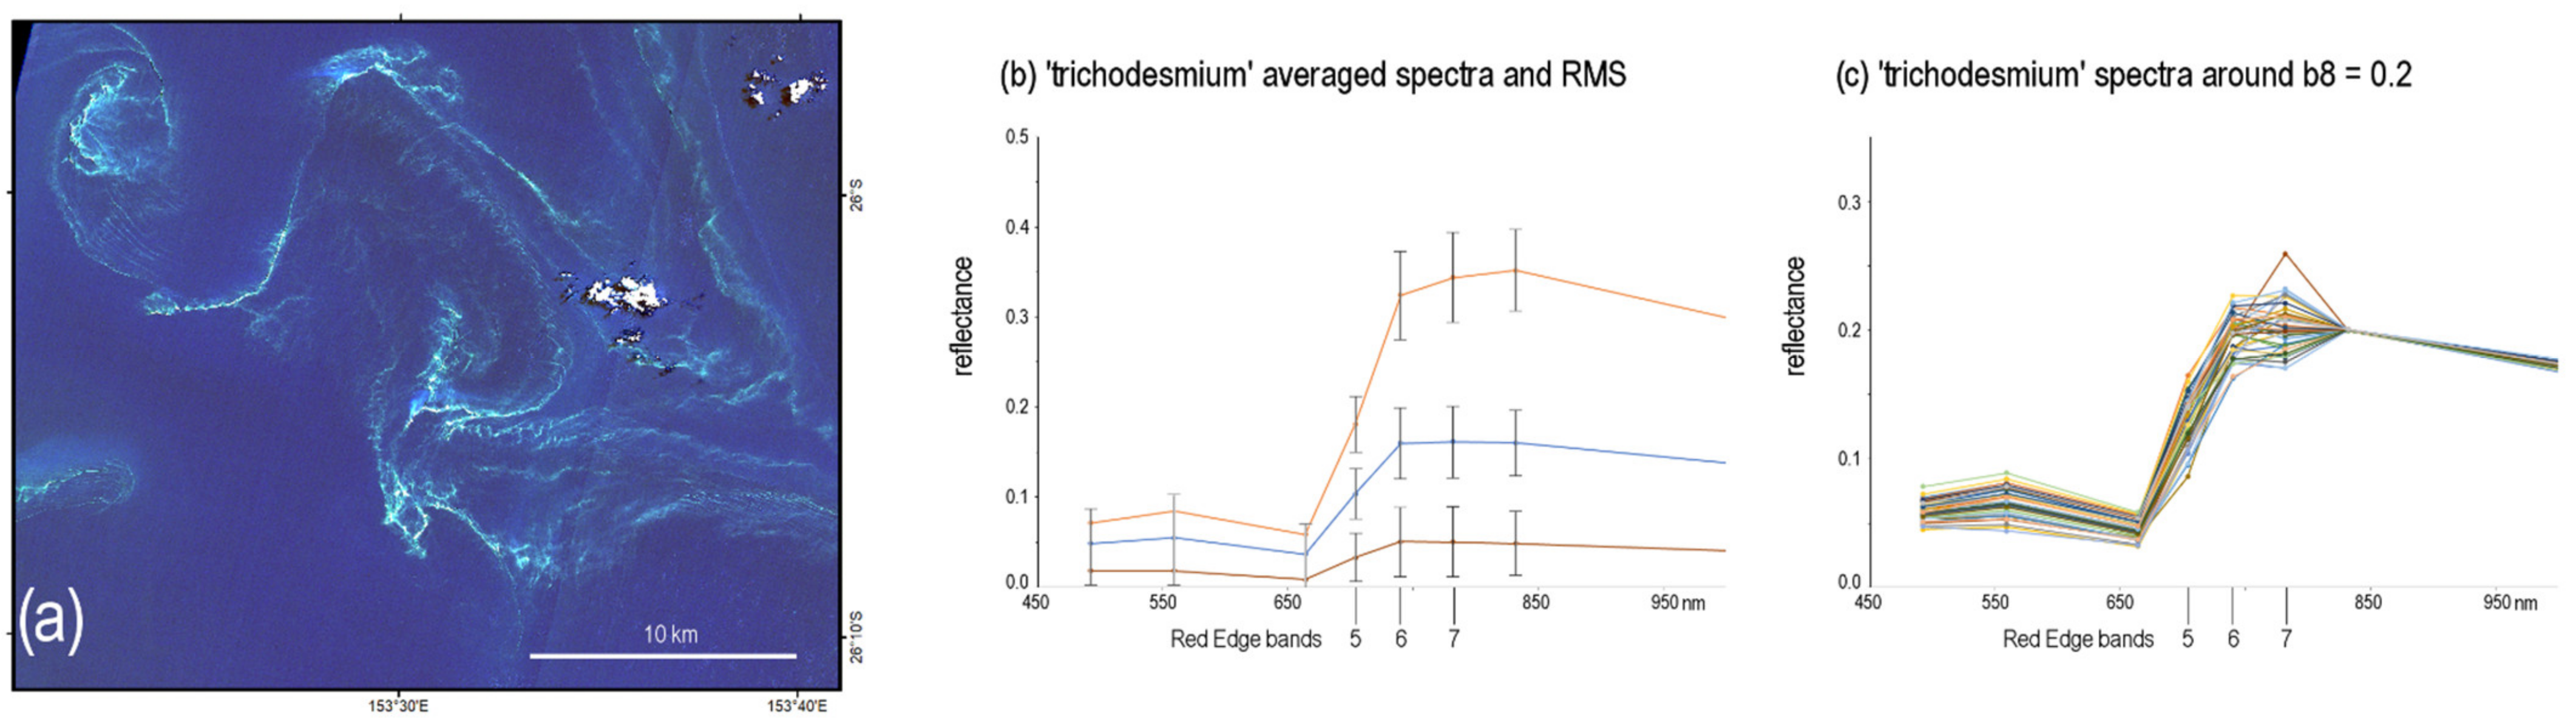
Figure 12.
(a) Floating patches detected in North Adriatic on 21 August 2021 (Sentinel-2 tile: 33TUL, western edge). (b) Selected patch in band 8 and (c) relative pixel spectra.
Figure 12.
(a) Floating patches detected in North Adriatic on 21 August 2021 (Sentinel-2 tile: 33TUL, western edge). (b) Selected patch in band 8 and (c) relative pixel spectra.
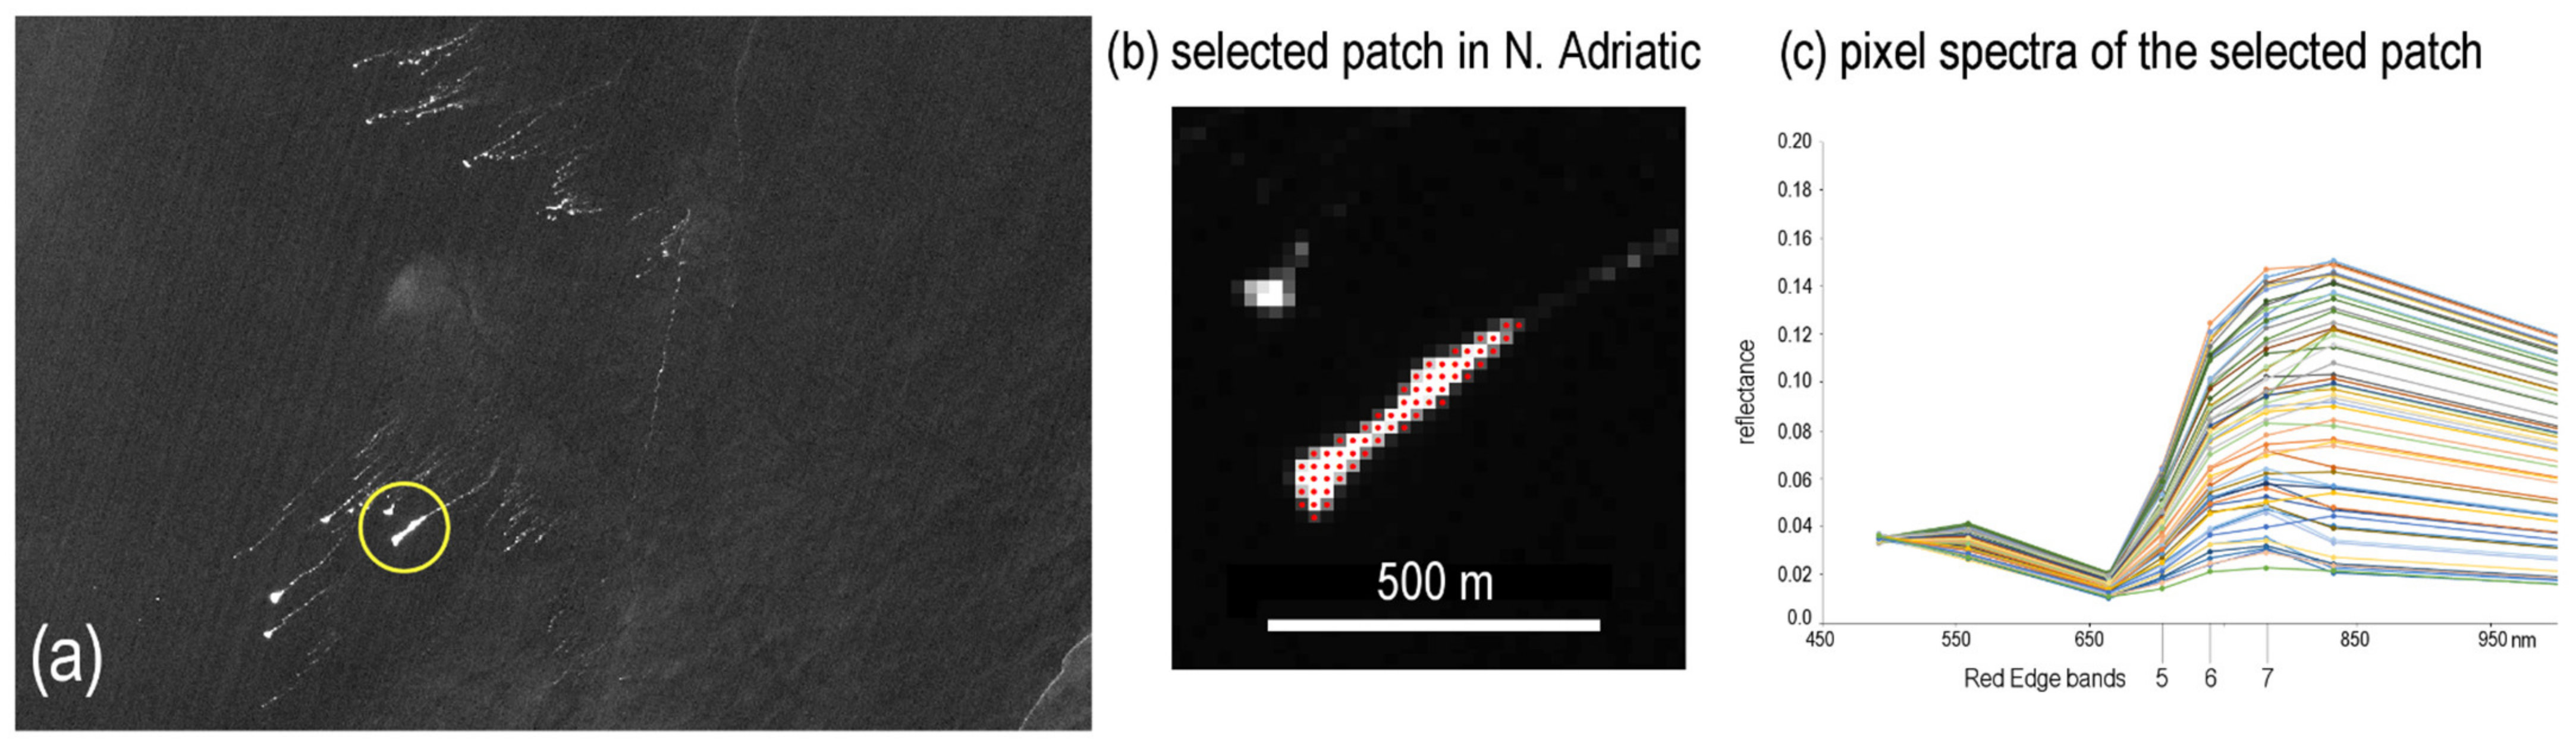
Figure 13.
(a) Average and (b) RMS of , and for “trichodesmium” bloom and for North Adriatic patches.
Figure 13.
(a) Average and (b) RMS of , and for “trichodesmium” bloom and for North Adriatic patches.

Figure 14.
Drifting patches on the windy dates of Table 1 (in band 8). (a) NW wind. (b) NE wind.
Figure 14.
Drifting patches on the windy dates of Table 1 (in band 8). (a) NW wind. (b) NE wind.


Table 1.
Sentinel-2 scenes acquired in August 2020 in North Adriatic.
| Date | Processed | Not Processed |
|---|---|---|
| 1st of August | X | |
| 3rd of August | Cloudy | |
| 6th of August | Windy | |
| 8th of August | X | |
| 11th of August | Windy | |
| 13th of August | X | |
| 16th of August | X | |
| 18th of August | Cloudy | |
| 21th of August | X | |
| 23th of August | Windy | |
| 26th of August | Cloudy | |
| 28th of August | X | |
| 31th of August | Cloudy |
Publisher’s Note: MDPI stays neutral with regard to jurisdictional claims in published maps and institutional affiliations. |
© 2022 by the author. Licensee MDPI, Basel, Switzerland. This article is an open access article distributed under the terms and conditions of the Creative Commons Attribution (CC BY) license (https://creativecommons.org/licenses/by/4.0/).
Share and Cite
MDPI and ACS Style
Ciappa, A.C. Marine Litter Detection by Sentinel-2: A Case Study in North Adriatic (Summer 2020). Remote Sens. 2022, 14, 2409. https://doi.org/10.3390/rs14102409
AMA Style
Ciappa AC. Marine Litter Detection by Sentinel-2: A Case Study in North Adriatic (Summer 2020). Remote Sensing. 2022; 14(10):2409. https://doi.org/10.3390/rs14102409
Chicago/Turabian StyleCiappa, Achille Carlo. 2022. "Marine Litter Detection by Sentinel-2: A Case Study in North Adriatic (Summer 2020)" Remote Sensing 14, no. 10: 2409. https://doi.org/10.3390/rs14102409
Note that from the first issue of 2016, this journal uses article numbers instead of page numbers. See further details here.