
Exploring the Potential of UAV LiDAR Data for Trunk Point Extraction and Direct DBH Measurement
by
 , , and
Baokun Feng
1, 
Sheng Nie
2,3,*,
Cheng Wang
1,2,3,4,
Xiaohuan Xi
2,3,
Jinliang Wang
1,
Guoqing Zhou
4 and
Haoyu Wang
4 1
Faculty of Geography, Yunnan Normal University, Kunming 650500, China
2
International Research Center of Big Data for Sustainable Development Goals, Beijing 100094, China
3
Key Laboratory of Digital Earth Science, Aerospace Information Research Institute, Chinese Academy of Sciences, Beijing 100094, China
4
College of Geomatics and Geoinformation, Guilin University of Technology, Guilin 541004, China
*
Author to whom correspondence should be addressed.
Remote Sens. 2022, 14(12), 2753; https://doi.org/10.3390/rs14122753
Submission received: 15 April 2022
/
Revised: 3 June 2022
/
Accepted: 7 June 2022
/
Published: 8 June 2022
Abstract
:The accurate measurement of diameter at breast height (DBH) is one of the essential tasks for biomass estimation at an individual tree scale. This paper aims to explore the potential of unmanned aerial vehicle (UAV) based light detection and ranging (LiDAR) for trunk point extraction and direct DBH measurement. First, the trunk point cloud for each tree is extracted based on UAV LiDAR data by the multiscale cylindrical detection method. Then, the DBH is directly measured from the point cloud via the multiscale ring fitting. Lastly, we analyze the influence of scanning angle and mode on trunk point extraction and DBH measurement. The results show that the proposed method can obtain high accuracy of trunk point extraction and DBH measurement with real (R2 = 0.708) and simulated (R2 = 0.882) UAV LiDAR data. It proves that the UAV LiDAR data is feasible to directly measure the DBH. The highest accuracy was obtained with the scanning angles ranging from 50 to 65 degrees. Additionally, as the number of routes increases, the accuracy increases. This paper demonstrates that the UAV LiDAR can be used to directly measure the DBH, providing the scientific guidance for UAV path planning and LiDAR scanning design.
1. Introduction
Global temperature increases caused by increased carbon emissions [1,2], forest carbon stock, and sequestration capacity have received increasing attention [3,4,5]. Previous studies demonstrated that accurate measurement of diameter at breast height (DBH) is beneficial to forest biomass systems, thereby reducing the uncertainty in carbon stock estimation [6,7]. Therefore, it is essential to accurately measure the DBH. Although traditional DBH determination methods, such as field measurement, can accurately retrieve DBH [8], they are limited in practical applications since they are labor-intensive and time-consuming.
The light detection and ranging (LiDAR) technology has been actively studied for DBH measurement. Especially, terrestrial laser scanning (TLS) has been widely used for trunk point extraction and DBH measurement [9]. Ye et al. [10] proposed a robust least squares ellipse fitting method under the elliptic assumption for DBH estimation. Liu et al. [11] used octree segmentation, connected component labeling, and random Hough transform (RHT) to identify trunks and estimate DBH from TLS data. Jan et al. [12] used the density-based spatial clustering of applications with noise (DBSCAN) and random sample consistency (RANSAC) for TLS-based DBH estimation. Although the TLS-based methods showed their unique advantage in measuring DBH, the TLS also has several limitations. First, the acquisition of TLS point clouds in forestry requires multi-station scanning and registration of multi-station data, which is time-consuming and labor-intensive to collect and preprocess large-scale data. Additionally, TLS has a spatial limitation to application because it needs to be manually carried to reach the area of interest, often requires challenging field access, and often requires a field team [13]. Second, the high density of TLS point clouds and alignment of multi-station data lead to data redundancy and also require high hardware requirements.
Compared with TLS, airborne laser scanning (ALS) and unmanned aerial vehicle (UAV) LiDAR have the advantages of fast acquisition speed and smaller data volume, allowing to collect point cloud data over a large area [14,15]. However, ALS and UAV LiDAR use a top-to-bottom scanning mode to acquire point cloud data, leading to the sparse distribution of trunk point clouds, which is a great challenge for trunk point extraction and direct DBH measurement from ALS or UAV LiDAR data. Most previous studies indirectly extracted the DBH from ALS or UAV LiDAR data through the DBH estimation models. The DBH estimation models can be divided into parametric and non-parametric models. The parametric DBH models were based on multiple regression with individual tree parameters (tree height, crown width, and density) [16,17,18,19]. In non-parametric models, the machine learning algorithms, such as random forest [15,20], support vector machine [21], and artificial neural network [22], were first used to extract individual tree features and then estimate DBH. However, both parametric and non-parametric models require field DBH measurement for model development, limiting their practical applicability. Therefore, the direct measurement of DBH is essential. To our best knowledge, several previous studies attempted to directly measure DBH from ALS or UAV LiDAR data [23,24,25,26,27]. These existing studies have successfully estimated the DBH from extremely high-density LiDAR point data, and proven that tilted scanning can increase the trunk point cloud density so as to achieve accurate measurement of DBH [28]. However, the feasibility of their method in relatively low-density point clouds has not been demonstrated. Additionally, these studies did not assess the effect of scanning degree on trunk point extraction and DBH measurement.
This paper aims to explore the potential of relatively low-density UAV LiDAR data for trunk point extraction and direct DBH measurement as well as assess the effects of scanning angles and scanning modes. The main contributions of this paper are as follows: (1) The trunk point cloud of each tree from original UAV LiDAR data is extracted through the multiscale cylindrical detection method. (2) An effective direct method is proposed to measure the DBH from the trunk point cloud based on the multiscale ring fitting. (3) The effects of scanning angles and modes on trunk point extraction and DBH measurement are analyzed. This paper is the first attempt to analyze the influence of scanning angles and modes on trunk point extraction and direct DBH measurement, and it will provide scientific guidance for the planning of UAV routes and LiDAR scanning design.
2. Materials
2.1. Study Area
The study area is located at the Huailai Remote Sensing Comprehensive Experiment Station of the Chinese Academy of Sciences, Hebei Province (40°20′N, 115°47′E). The average annual temperature is 10.1 °C, with a maximum temperature of 39 °C and a minimum temperature of −20 °C. The average annual precipitation total is about 370 mm. The average annual wind speed is 3.4 m/s, and the climate type is monsoon climate of medium latitudes [29]. The average altitude of the study area is 482 m, the terrain is flat, and there are rich types of land cover such as broad-leaved forest, coniferous forest, cultivated land, buildings, etc. The broad-leaved artificial poplar forest in the station is the research object of this study (as shown in Figure 1). The study area is approximately rectangular, with a length of 38 m and a width of 21 m, and an area of 798 m2.
Figure 1a shows the location of the study area, Figure 1b shows each individual tree location of the study area, and Figure 1c shows the collected point cloud data and profiles. The point cloud profiles indicate that there are fewer shrubs in the understory of the study area. Additionally, at least some of the tree trunks are visible in point cloud, and thus, it is possible to detect them.
2.2. Real UAV LiDAR Data
The experimental data were collected in July 2021 using a six-rotor UAV with a RIEGL VUX-1 (RIEGL Laser Measurement System GmbH, Horn, Austria) LiDAR system [30] with a UAV flight speed of 8 m/s, flight altitude of 100 m, LiDAR scanning frequency of 550 kHz, and line scanning mode. The point density of LiDAR data is 110 pts/m2. The main parameters are summarized in Table 1. Data from a total of 19 valid routes were obtained for the direct DBH measurement, the UAV LiDAR data with different routes were spliced by strip adjustment. The scanning angles of all the routes are provided in Table 2.
2.3. Simulated UAV LiDAR Data
Collecting sufficient real data is challenging mainly due to the UAV jitter and cost, which limits the exploration of the effect of different scanning angles on the direct DBH measurement. To overcome this limitation, the LESS model [31,32] (http://lessrt.org/, accessed on 14 April 2022) established by Jianbo Qi’s team at Beijing Forestry University was used to generate simulated UAV LiDAR data in this study. LESS is a ray-tracing-based 3D radiative transfer model that simulates remote sensing data in large-scale and realistic 3D scenes. It also provides a user-friendly graphical user interface (GUI) and a set of tools to help build scenes and set parameters. The parameter settings of the simulated data are shown in Table 3; the point density of simulated LiDAR data is 100 pts/m2, which is lower than that of the real data. The number of simulated data routes is 38, and the scanning angle interval between routes is 5 degrees. Figure 2 shows the simulated scene, point cloud data, and profiles. The scene is constructed according to the 1:1 equal scale of the real study area in Figure 1. The field-measured individual tree parameters (such as tree location, DBH, tree species) were adopted to build the scene.
2.4. Field-Measured Data
Field measurements were conducted in July 2021, and a total of 143 individual trees in the study area were measured, including tree species, coordinates, and DBH. The DBH was directly measured for each tree using a DBH ruler (accuracy = 1 mm), and the data for trees with a DBH smaller than 5 cm was discarded. Figure 3 provides the distribution of field-measured DBH values in the study area. The coordinates were measured and recorded using the Global Positioning System (GPS) real-time kinematic. The final errors of tree positions are generally less than 5 cm.
3. Methods
This paper investigates the potential of UAV LiDAR data for trunk point extraction and direct DBH measurement. Additionally, the influence of scanning angles and modes on their accuracies is analyzed. Figure 4 depicts the flowchart of this study. First, the real and simulated UAV LiDAR data were obtained with the designed scanning angles and modes and various scanning angles and modes, respectively. Then, those real and simulated data were preprocessed, including noise removal, point cloud filtering, and normalization. Third, the trunk point cloud for each tree was extracted from UAV LiDAR data based on the multiscale cylindrical detection method. Fourth, the DBH was measured based on the sliced trunk point clouds using a multiscale ring fitting method. Lastly, we analyzed the effects of scanning angles and modes on trunk point extraction and DBH measurement. In this study, the LiDAR data were preprocessed using the PCM (PCM was developed by the team of Prof. Cheng Wang, Chinese Academy of Sciences, http://www.lidarcas.cn/soft, accessed on 14 April 2022) software, and the other operations were implemented by python programming.
3.1. Trunk Point Extraction
We used a multiscale cylindrical detection method to extract trunk point cloud data from UAV LiDAR data, which is described in detail as follows.
(1) Point cloud preprocessing. The influence of surface topography on the subsequent extraction process is eliminated through the point cloud preprocessing. First, the point cloud data were classified into ground and non-ground points. In recent years, several filtering methods have been proposed for various natural and urban scenes [33,34,35,36,37,38]. Among them, the cloth simulation filtering (CSF) [34] algorithm is used, which is suitable for plain areas with flat terrain. Second, the ground points were interpolated to generate the digital terrain model (DTM) (resolution of 0.25 m) using the inverse distance weighted (IDW) method. Lastly, the point cloud data was normalized along with the Z-coordinate, removing elevation information.
(2) Coarse extraction of the trunk point cloud data. The tree-apexes of broad-leaved forests are not obvious, and the trunk parts have fewer branches (as shown in Figure 5a). Therefore, this study coarsely extracted the trunk point clouds using a multiscale cylinder. The normalized point cloud with an elevation range of 0.5–2 m was selected as the seed point (see Figure 5a). Then, the multiscale cylinder was constructed using the z-direction of the unmarked seed point p (the red point in Figure 5b) as the cylinder rotation axis and r as the radius, where the value of r is determined according to the range of DBH values in the study area. The cylindrical point set T was obtained by clipping the normalized point cloud using a multiscale cylinder. Given that the seed point cloud may contain trunk and branch points, the physical form of the tree was used to determine whether the point set T belonged to the trunk point cloud. Since the tree trunk is generally a near cylinder, the trunk point cloud was uniformly distributed in the vertical direction. Additionally, the heights of all trees in this study area were higher than 2 m. Therefore, the cylindrical point set T was regarded as the trunk point cloud in this study when the point set T was uniformly distributed in the vertical direction and its maximum height was greater than 2 m. If T was the trunk point cloud, all points in T were marked; in contrast, only point p was marked to avoid repeated calculation. The above process was repeated until all seed points were marked, as shown in Figure 5c. The different colors in Figure 5c represent different segmented trunk point clouds during coarse extraction.
(3) Fine extraction of the trunk point cloud. The point cloud may be over-segmented during the process of coarse extraction (as shown in Figure 5c), which may significantly affect the DBH measurement. To better conduct the subsequent DBH measurement, we needed to merge the over-segmented trunk point clouds through fine extraction. There are two key steps to implement it. First, the center coordinates of each trunk point in the XOY plane were first calculated based on the coarsely extracted point cloud. Second, the trunk points whose centers were close (Euclidean distance is less than 1 m) were merged, as shown in Figure 5d.
(4) Accuracy evaluation. The trunk extraction accuracy was evaluated using the ratio of the number of correctly extracted tree trunks to the ground-truth. The positions of each tree can be erroneous due to the poor signal of GPS in the forest. Thus, the Euclidean distance in the XOY plane between the extracted trunk point cloud and the coordinates measured by GPS were used for the determination of correctly extracted tree trunks.
3.2. Direct Measurement of DBH
For direct measurement of DBH, a ring fitting-based method is proposed to overcome the sparse distribution of UAV point clouds and non-circular trunk cross-section. The proposed method was conducted as follows.
(1) Trunk point cloud slices. For TLS data, only point cloud slices with a height of about 1.3 m are generally obtained to measure DBH [39,40]. However, our study selected the point clouds with elevations ranging from 0.5 to 2 m to measure the DBH because it can not only ensure enough trunk points, but also exclude branch points that affect the DBH measurement.
(2) Parameter setting of rings. This paper adopted a multiscale ring fitting for DBH measurement instead of RANSAC or Hough transform, which are typical methods suitable for ordered point clouds. The centers of the multiscale rings were first determined. The centers of the rings were drawn inside the outer rectangle of the sliced point cloud in the XOY plane projection at an interval of 1 cm (the black dots in Figure 6a represent the center positions of the multiscale rings). Then, the radius range of the multiscale rings was determined, where the minimum and maximum radiuses of the large circle in each ring were 3 cm and the half of the larger side of the outer rectangle, respectively. The radius difference between the large and small circles was 1 cm. Finally, the multiscale rings were constructed with the determined circle center positions and radius sizes.
(3) DBH measurement. The ring with the largest number of points was considered as the best fitting ring, as shown in Figure 6b. Lastly, the average of large and small circle diameters in the best fitting ring was computed as the DBH.
(4) Accuracy assessment. The accuracy of DBH is evaluated using the coefficient of determination (R2) [41,42,43,44] and the square root of mean squared error (RMSE, in m) [45].
where and represent the field-measured DBH and UAV LiDAR-derived DBH of the tree i, respectively. represents the average of all field-measured DBH values, and n is the number of trees.
3.3. Influence of Scanning Angles and Modes on Trunk Point Extraction and DBH Measurement
UAV LiDAR data acquired by vertical scanning from top to bottom can cause the sparsity of obtained point clouds in the trunk in forest areas, which is not conducive to the extraction of individual tree parameters. Thus, in this study, a tilt scanning pattern was used for data acquisition. Figure 7a–c compares the schematic diagram of vertical and tilt scanning and their point cloud profiles, showing a significantly different density of the obtained trunk point cloud with different scanning angles. When the scanning angle is too large, most of the obtained point clouds are canopy points; in contrast, when the scanning angle is too small, the number of trunk points is small due to the sheltering of tree canopies. Additionally, the point could density is affected by the scanning mode [28]. Figure 8 depicts different scanning modes, including single-route, double-route, triple-route, and quadruple-route. In this paper, the influence of the scanning angles and scanning modes on trunk point extraction and DBH measurement were analyzed on the UAV LiDAR data. We employed the LESS [31,32] model to simulate UAV LiDAR data for multiple routes with a scanning angle range of 45–90 degrees (interval of 5 degrees).
4. Results and Discussion
4.1. Trunk Point Extraction and DBH Measurement
Table 4 shows the accuracies of trunk point extraction and DBH measurement based on all routes of real and simulated UAV LiDAR data. Figure 9 depicts the scatter plots of field-measured DBH versus estimated DBH using all routes of real and simulated UAV LiDAR data. The results show that the trunk extraction accuracy is extremely high (>95%) for both data. Additionally, the accuracy of DBH estimation is high for both data, as indicated by large R2 and small RMSE values. This proves the feasibility of UAV LiDAR data for direct DBH measurement. Further, the results also indicate that the DBH measurement accuracy is higher for the simulated data than the real data, which is mainly due to the noise in the real data introduced by the cluttered grass and shrubs in the forest understory.
4.2. The Effects of Scanning Angles and Modes on Trunk Point Extraction and DBH Measurement
4.2.1. Scanning Angle
Table 5 and Figure 10 analyze the results of trunk point extraction and DBH measurement for UAV LiDAR data with different scanning angles. The results show that the extraction accuracy and DBH are the highest when the scanning angle is in the range of 50–60 and 55–65 degrees, respectively, for the simulated and real data. Overall, the scanning angles between 50 and 65 degrees are most suitable for trunk point extraction and direct DBH measurement in this study. This is mainly because more trunk points are contained in the UAV LiDAR data for broad-leaved forests when the scanning angle is between 50 and 65 degrees. Specifically, when the scanning angle is larger than 65 degrees, most of the points are canopy points. In contrast, there are few points located in the trunk due to the sheltering of tree canopies for smaller scanning angles.
4.2.2. Scanning Mode
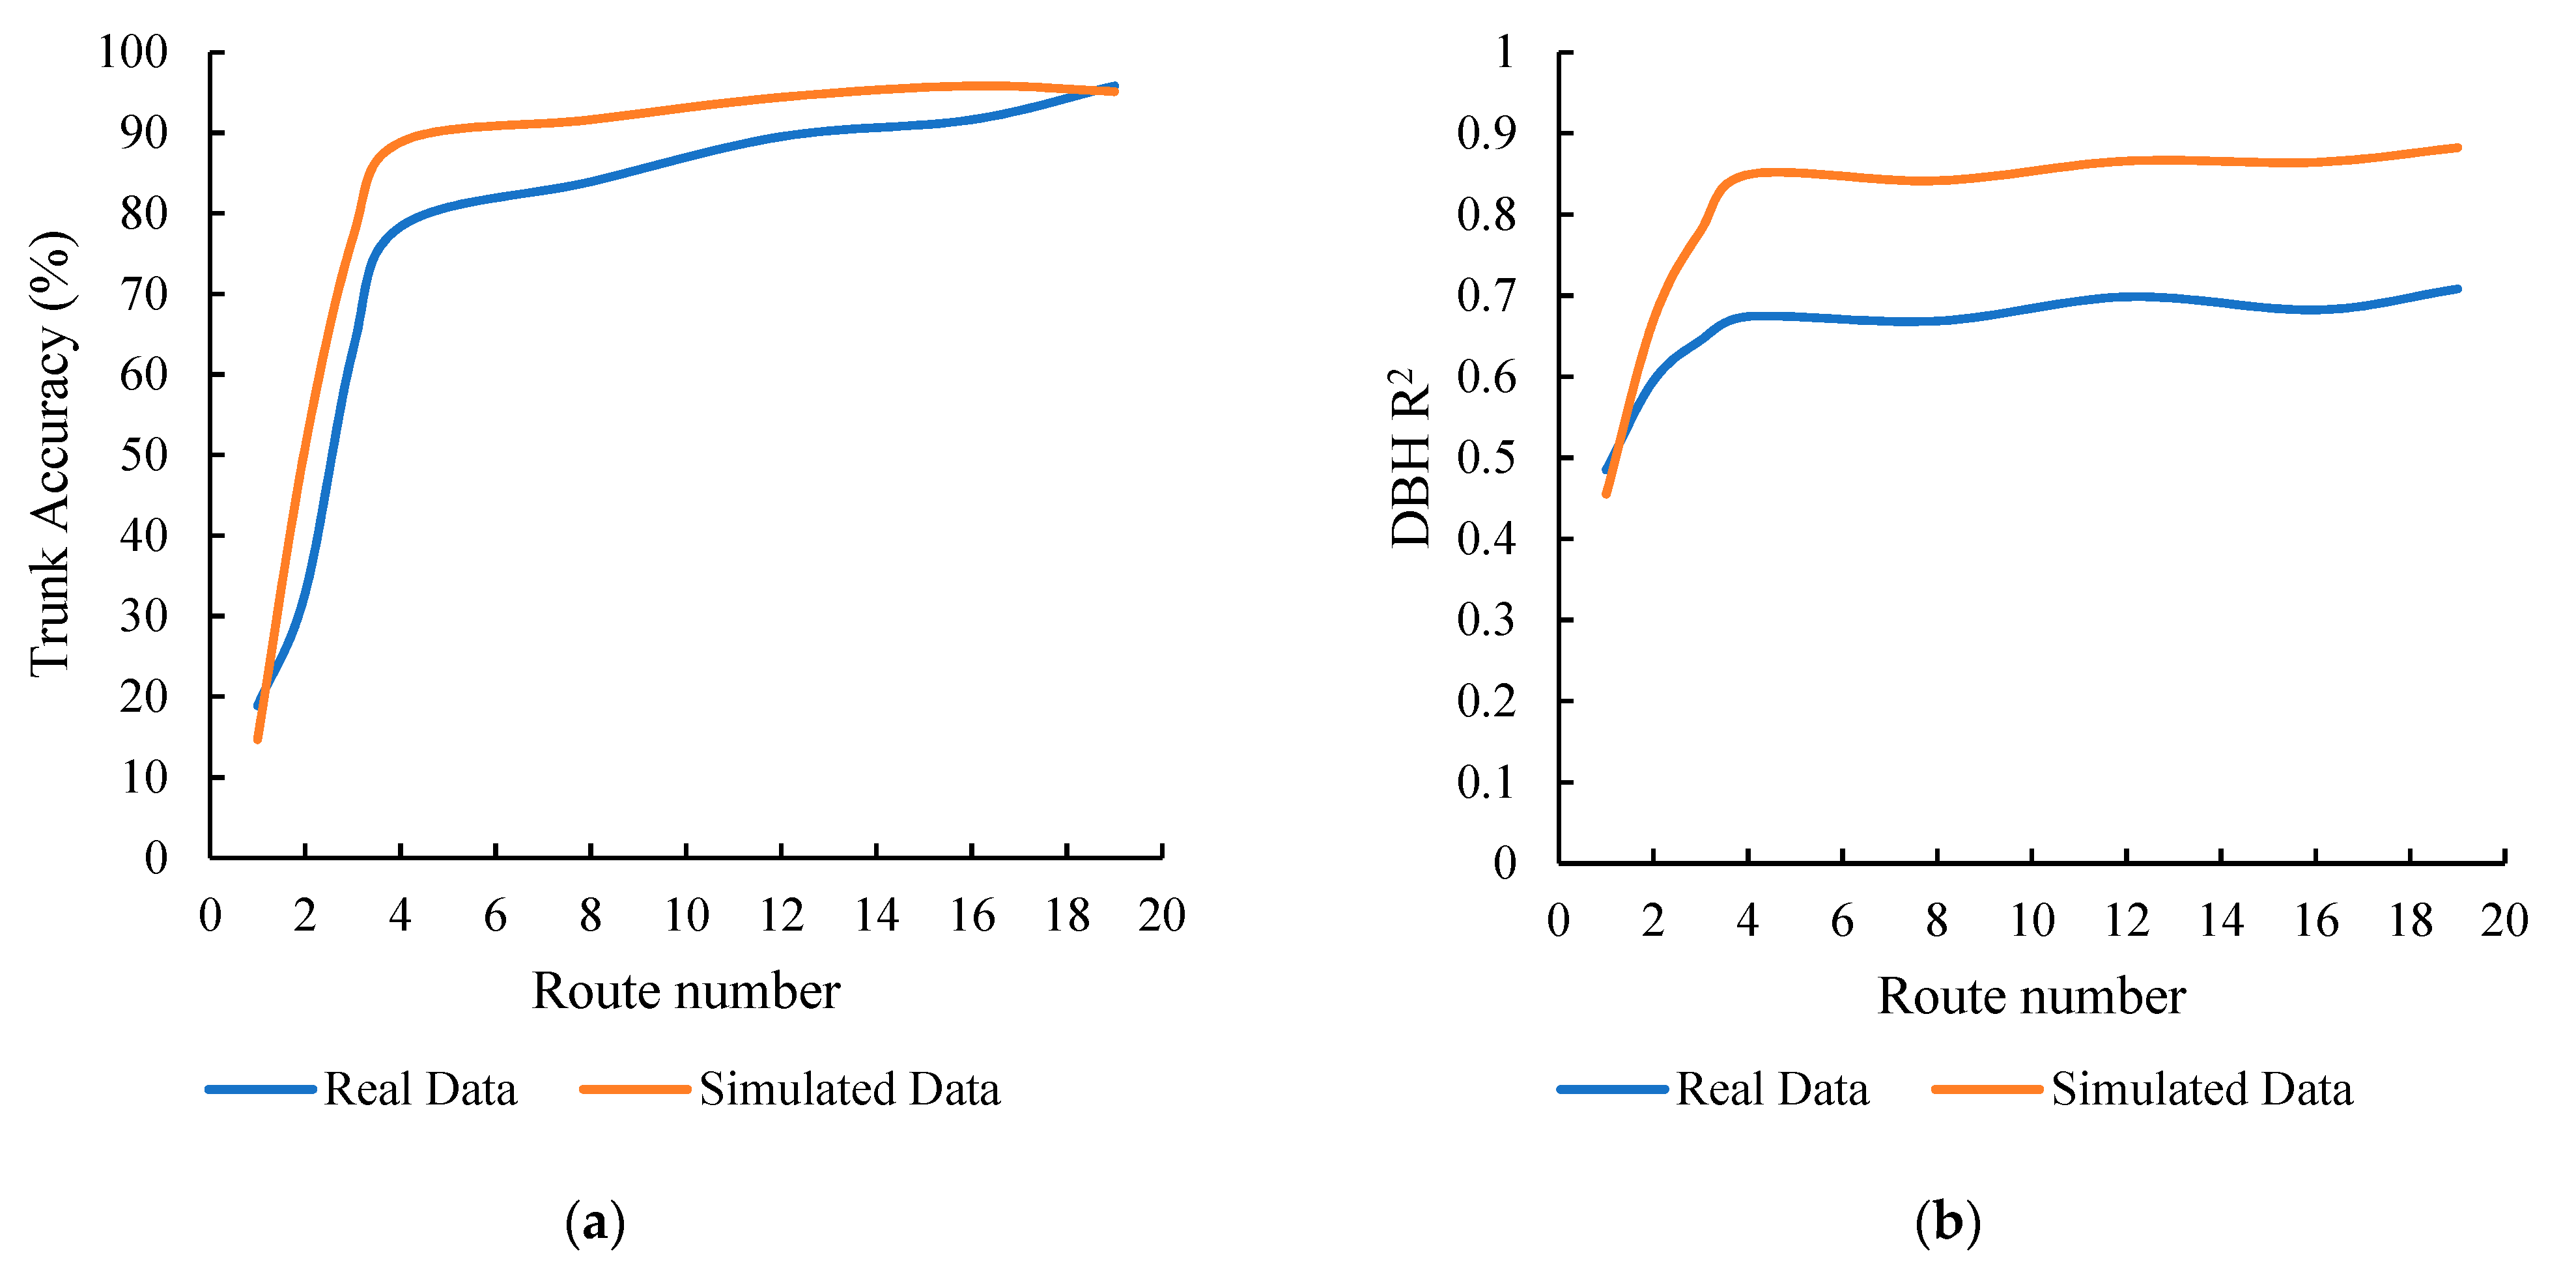
Figure 11 and Table 6 analyze the point cloud extraction accuracy and DBH measurement according to the different scanning modes. The results show that the accuracies increase as the number of scanning routes increase. However, the accuracy increase rates converge after quadruple routes for both trunk point extraction and DBH measurement. From Figure 11, we can see that when the number of routes increases from 4 to 19, only small accuracy improvements were observed for both trunk point extraction and DBH measurement.
As mentioned above, the accuracies of trunk point extraction and DBH measurement initially increase and then remain stable after four routes with the increasing routes. This is mainly because the point cloud of the trunk part can be supplemented with the addition of routes in different directions; thus, improving the trunk point extraction and the accuracy of the DBH measurement. At the same time, when the routes increase to a certain number, there will be a data saturation phenomenon. Therefore, as the number of routes increases, the change in trunk point extraction accuracy and DBH measurement accuracy becomes slower or even decreases.
4.3. Comparison with the Existing Methods
In this study, we demonstrated the capability of UAV LiDAR point clouds in trunk point extraction and direct DBH measurement. In our study, the DBH measurement accuracy of real UAV LiDAR data is relatively high as indicated by high R2 and low RMSE (R2 = 0.708, RMSE = 0.021 m), which is comparable to the existing previous studies. They used various methods such as least-squares circle fitting, arc matching algorithm, and Hough circle fitting to estimate DBH from UAV LiDAR point clouds with R2 of 0.69–0.88 and RMSE of 0.055–0.068 [26,27,28]. Additionally, we also tried to apply the previous methods to the UAV LiDAR data of our study area, but these existing methods failed to identify enough trunk points from UAV LiDAR data for the direct DBH measurement. This may be because the point cloud density of our UAV LiDAR data is lower than that of previous studies (800–3800 pts/m2), which affects the effective detection of trunk points and the direct DBH measurement.
5. Conclusions
This study explored the potential of UAV LiDAR data for trunk point extraction and direct DBH measurement and further analyzed the influence of scanning angles and modes on their accuracies. The results show that (1) the UAV LiDAR point cloud data can be used for direct DBH measurement; (2) the accuracies of trunk point extraction and DBH measurement are highly dependent on the scanning angles and modes; and (3) the highest accuracy was obtained with the scanning angles ranging from 50 to 65 degrees. This paper can provide guidance and suggestions for the design of the UAV route, LiDAR scanning angle, and mode. However, this paper also has two limitations. First, the new proposed method was only tested in one study area with a single tree species. Second, we did not consider the effect of noises that are commonly induced by low shrubs on trunk point extraction and DBH measurement. Future research will focus on noise removal to improve the accuracies of trunk point extraction and DBH measurement. Additionally, the new proposed method will also be applied to more forests with various tree species distribution and terrain conditions to test the method reliability.
Author Contributions
Methodology, data curation and analysis, writing—original draft and editing, B.F.; conceptualization, formal analysis, writing—review and editing, S.N.; methodology, formal analysis, C.W.; conceptualization, writing—review and editing, supervision, X.X. and C.W.; methodology, H.W.; writing—review and editing, J.W. and G.Z. All authors have read and agreed to the published version of the manuscript.
Funding
This research was funded by Guangxi Natural Science Fund for Innovation Research Team (2019GXNSFGA245001), National Key R&D Program of China (2021YFF0704600), National Natural Science Foundation of China (42171352), and the Youth Innovation Promotion Association CAS (2019130).
Data Availability Statement
The data presented in this study are available on request from the corresponding author. The data are not publicly available due to privacy.
Conflicts of Interest
The authors declare no conflict of interest.
References
- Mikhaylov, A.; Moiseev, N.; Aleshin, K.; Burkhardt, T. Global climate change and greenhouse effect. Entrep. Sustain. Issues 2020, 7, 2897. [Google Scholar] [CrossRef]
- Xu, R.; Yu, P.; Abramson, M.J.; Johnston, F.H.; Samet, J.M.; Bell, M.L.; Haines, A.; Ebi, K.L.; Li, S.; Guo, Y. Wildfires, global climate change, and human health. N. Engl. J. Med. 2020, 383, 2173–2181. [Google Scholar] [CrossRef] [PubMed]
- Seidl, R.; Thom, D.; Kautz, M.; Martin-Benito, D.; Peltoniemi, M.; Vacchiano, G.; Wild, J.; Ascoli, D.; Petr, M.; Honkaniemi, J. Forest disturbances under climate change. Nat. Clim. Chang. 2017, 7, 395–402. [Google Scholar] [CrossRef] [PubMed] [Green Version]
- Solntsev, A.M. Climate change: International legal dimension. Mosc. J. Int. Law 2018, 106, 60–78. [Google Scholar] [CrossRef]
- Urpelainen, J. Geoengineering and global warming: A strategic perspective. Int. Environ. Agreem. Polit. Law Econ. 2012, 12, 375–389. [Google Scholar] [CrossRef]
- Goldbergs, G.; Levick, S.R.; Lawes, M.; Edwards, A. Hierarchical integration of individual tree and area-based approaches for savanna biomass uncertainty estimation from airborne LiDAR. Remote Sens. Environ. 2018, 205, 141–150. [Google Scholar] [CrossRef]
- Neuville, R.; Bates, J.S.; Jonard, F. Estimating Forest Structure from UAV-Mounted LiDAR Point Cloud Using Machine Learning. Remote Sens. 2021, 13, 352. [Google Scholar] [CrossRef]
- Riaño, D.; Chuvieco, E.; Condés, S.; González-Matesanz, J.; Ustin, S.L. Generation of crown bulk density for Pinus sylvestris L. from lidar. Remote Sens. Environ. 2004, 92, 345–352. [Google Scholar] [CrossRef]
- Calders, K.; Adams, J.; Armston, J.; Bartholomeus, H.; Bauwens, S.; Bentley, L.P.; Chave, J.; Danson, F.M.; Demol, M.; Disney, M. Terrestrial laser scanning in forest ecology: Expanding the horizon. Remote Sens. Environ. 2020, 251, 112102. [Google Scholar] [CrossRef]
- Ye, W.; Qian, C.; Tang, J.; Liu, H.; Fan, X.; Liang, X.; Zhang, H. Improved 3D Stem Mapping Method and Elliptic Hypothesis-Based DBH Estimation from Terrestrial Laser Scanning Data. Remote Sens. 2020, 12, 352. [Google Scholar] [CrossRef] [Green Version]
- Liu, G.; Wang, J.; Dong, P.; Chen, Y.; Liu, Z. Estimating Individual Tree Height and Diameter at Breast Height (DBH) from Terrestrial Laser Scanning (TLS) Data at Plot Level. Forests 2018, 9, 398. [Google Scholar] [CrossRef] [Green Version]
- Novotny, J.; Navratilova, B.; Albert, J.; Cienciala, E.; Fajmon, L.; Brovkina, O. Comparison of spruce and beech tree attributes from field data, airborne and terrestrial laser scanning using manual and automatic methods. Remote Sens. Appl. Soc. Environ. 2021, 23, 100574. [Google Scholar] [CrossRef]
- Dalla Corte, A.P.; Rex, F.E.; Almeida, D.R.A.d.; Sanquetta, C.R.; Silva, C.A.; Moura, M.M.; Wilkinson, B.; Zambrano, A.M.A.; Cunha Neto, E.M.d.; Veras, H.F.P.; et al. Measuring Individual Tree Diameter and Height Using GatorEye High-Density UAV-Lidar in an Integrated Crop-Livestock-Forest System. Remote Sens. 2020, 12, 863. [Google Scholar] [CrossRef] [Green Version]
- Pilarska, M.; Ostrowski, W.; Bakuła, K.; Górski, K.; Kurczyński, Z. The Potential Of Light Laser Scanners Developed For Unmanned Aerial Vehicles-The Review and Accuracy. Int. Arch. Photogramm. Remote Sens. Spat. Inf. Sci. 2016, 42, 87–95. [Google Scholar] [CrossRef] [Green Version]
- Liu, K.; Shen, X.; Cao, L.; Wang, G.; Cao, F. Estimating forest structural attributes using UAV-LiDAR data in Ginkgo plantations. ISPRS J. Photogramm. Remote Sens. 2018, 146, 465–482. [Google Scholar] [CrossRef]
- Yao, W.; Krzystek, P.; Heurich, M. Tree species classification and estimation of stem volume and DBH based on single tree extraction by exploiting airborne full-waveform LiDAR data. Remote Sens. Environ. 2012, 123, 368–380. [Google Scholar] [CrossRef]
- Popescu, S.C. Estimating biomass of individual pine trees using airborne lidar. Biomass Bioenergy 2007, 31, 646–655. [Google Scholar] [CrossRef]
- Hao, Y.; Widagdo, F.R.A.; Liu, X.; Quan, Y.; Dong, L.; Li, F. Individual Tree Diameter Estimation in Small-Scale Forest Inventory Using UAV Laser Scanning. Remote Sens. 2021, 13, 24. [Google Scholar] [CrossRef]
- Bottalico, F.; Chirici, G.; Giannini, R.; Mele, S.; Mura, M.; Puxeddu, M.; McRoberts, R.; Valbuena, R.; Travaglini, D. Modeling Mediterranean forest structure using airborne laser scanning data. Int. J. Appl. Earth Obs. Geoinf. 2017, 57, 145–153. [Google Scholar] [CrossRef]
- Ou, Q.; Lei, X.; Sheng, C.; Song, G. Individual tree DBH growth prediction of larch-spruce-fir mixed forests based on random forest algorithm. J. Beijing For. Univ. 2019, 41, 9–19. [Google Scholar] [CrossRef]
- Corte, A.P.D.; Souza, D.V.; Rex, F.E.; Sanquetta, C.R.; Mohan, M.; Silva, C.A.; Zambrano, A.M.A.; Prata, G.; Alves de Almeida, D.R.; Trautenmüller, J.W.; et al. Forest inventory with high-density UAV-Lidar: Machine learning approaches for predicting individual tree attributes. Comput. Electron. Agric. 2020, 179, 105815. [Google Scholar] [CrossRef]
- Sun, Y.; Jin, X.; Pukkala, T.; Li, F. Predicting Individual Tree Diameter of Larch (Larix olgensis) from UAV-LiDAR Data Using Six Different Algorithms. Remote Sens. 2022, 14, 1125. [Google Scholar] [CrossRef]
- Vandendaele, B.; Fournier, R.A.; Vepakomma, U.; Pelletier, G.; Lejeune, P.; Martin-Ducup, O. Estimation of Northern Hardwood Forest Inventory Attributes Using UAV Laser Scanning (ULS): Transferability of Laser Scanning Methods and Comparison of Automated Approaches at the Tree- and Stand-Level. Remote Sens. 2021, 13, 2796. [Google Scholar] [CrossRef]
- Wieser, M.; Mandlburger, G.; Hollaus, M.; Otepka, J.; Glira, P.; Pfeifer, N. A Case Study of UAS Borne Laser Scanning for Measurement of Tree Stem Diameter. Remote Sens. 2017, 9, 1154. [Google Scholar] [CrossRef] [Green Version]
- Brede, B.; Lau, A.; Bartholomeus, H.M.; Kooistra, L. Comparing RIEGL RiCOPTER UAV LiDAR derived canopy height and DBH with terrestrial LiDAR. Sensors 2017, 17, 2371. [Google Scholar] [CrossRef]
- Jaakkola, A.; Hyyppä, J.; Yu, X.; Kukko, A.; Kaartinen, H.; Liang, X.; Hyyppä, H.; Wang, Y. Autonomous Collection of Forest Field Reference—The Outlook and a First Step with UAV Laser Scanning. Remote Sens. 2017, 9, 785. [Google Scholar] [CrossRef] [Green Version]
- Kuželka, K.; Slavík, M.; Surový, P. Very High Density Point Clouds from UAV Laser Scanning for Automatic Tree Stem Detection and Direct Diameter Measurement. Remote Sens. 2020, 12, 1236. [Google Scholar] [CrossRef] [Green Version]
- Hyyppä, E.; Kukko, A.; Kaartinen, H.; Yu, X.; Muhojoki, J.; Hakala, T.; Hyyppä, J. Direct and automatic measurements of stem curve and volume using a high-resolution airborne laser scanning system. Sci. Remote Sens. 2022, 5, 100050. [Google Scholar] [CrossRef]
- Xu, Y.; Yao, L. Integrating Climate Change Adaptation and Mitigation into Land Use Optimization: A Case Study in Huailai County, China. Land 2021, 10, 1297. [Google Scholar] [CrossRef]
- Hu, T.; Sun, X.; Su, Y.; Guan, H.; Sun, Q.; Kelly, M.; Guo, Q. Development and performance evaluation of a very low-cost UAV-LiDAR system for forestry applications. Remote Sens. 2021, 13, 77. [Google Scholar] [CrossRef]
- Qi, J.; Xie, D.; Guo, D.; Yan, G. A large-scale emulation system for realistic three-dimensional (3-D) forest simulation. IEEE J. Sel. Top. Appl. Earth Obs. Remote Sens. 2017, 10, 4834–4843. [Google Scholar] [CrossRef]
- Qi, J.; Xie, D.; Yin, T.; Yan, G.; Gastellu-Etchegorry, J.-P.; Li, L.; Zhang, W.; Mu, X.; Norford, L.K. LESS: LargE-Scale remote sensing data and image simulation framework over heterogeneous 3D scenes. Remote Sens. Environ. 2019, 221, 695–706. [Google Scholar] [CrossRef]
- Zhao, X.; Guo, Q.; Su, Y.; Xue, B. Improved progressive TIN densification filtering algorithm for airborne LiDAR data in forested areas. ISPRS J. Photogramm. Remote Sens. 2016, 117, 79–91. [Google Scholar] [CrossRef] [Green Version]
- Zhang, W.; Qi, J.; Wan, P.; Wang, H.; Xie, D.; Wang, X.; Yan, G. An Easy-to-Use Airborne LiDAR Data Filtering Method Based on Cloth Simulation. Remote Sens. 2016, 8, 501. [Google Scholar] [CrossRef]
- Cai, S.; Zhang, W.; Liang, X.; Wan, P.; Qi, J.; Yu, S.; Yan, G.; Shao, J. Filtering Airborne LiDAR Data Through Complementary Cloth Simulation and Progressive TIN Densification Filters. Remote Sens. 2019, 11, 1037. [Google Scholar] [CrossRef] [Green Version]
- Li, H.; Ye, C.; Guo, Z.; Wei, R.; Wang, L.; Li, J. A Fast Progressive TIN Densification Filtering Algorithm for Airborne LiDAR Data Using Adjacent Surface Information. IEEE J. Sel. Top. Appl. Earth Obs. Remote Sens. 2021, 14, 12492–12503. [Google Scholar] [CrossRef]
- Serifoglu Yilmaz, C.; Gungor, O. Comparison of the performances of ground filtering algorithms and DTM generation from a UAV-based point cloud. Geocarto Int. 2018, 33, 522–537. [Google Scholar] [CrossRef]
- Shi, X.; Ma, H.; Chen, Y.; Zhang, L.; Zhou, W. A parameter-free progressive TIN densification filtering algorithm for lidar point clouds. Int. J. Remote Sens. 2018, 39, 6969–6982. [Google Scholar] [CrossRef]
- Bruggisser, M.; Hollaus, M.; Otepka, J.; Pfeifer, N. Influence of ULS acquisition characteristics on tree stem parameter estimation. ISPRS J. Photogramm. Remote Sens. 2020, 168, 28–40. [Google Scholar] [CrossRef]
- Chen, J.; Chen, Y.; Liu, Z. Extraction of Forestry Parameters Based on Multi-Platform LiDAR. IEEE Access 2022, 10, 21077–21094. [Google Scholar] [CrossRef]
- Lee Rodgers, J.; Nicewander, W.A. Thirteen ways to look at the correlation coefficient. Am. Stat. 1988, 42, 59–66. [Google Scholar] [CrossRef]
- Nagelkerke, N.J. A note on a general definition of the coefficient of determination. Biometrika 1991, 78, 691–692. [Google Scholar] [CrossRef]
- Sedgwick, P. Pearson’s correlation coefficient. BMJ 2012, 345, e4483. [Google Scholar] [CrossRef] [Green Version]
- Zhu, X.; Nie, S.; Wang, C.; Xi, X.; Wang, J.; Li, D.; Zhou, H.J.I.G.; Letters, R.S. A noise removal algorithm based on OPTICS for photon-counting LiDAR data. IEEE Geosci. Remote Sens. Lett. 2020, 18, 1471–1475. [Google Scholar] [CrossRef]
- Chai, T.; Draxler, R.R. Root mean square error (RMSE) or mean absolute error (MAE). Geosci. Model Dev. Discuss. 2014, 7, 1525–1534. [Google Scholar] [CrossRef] [Green Version]
Figure 1.
The geography of the study area: (a) study area location, (b) study area boundary and individual tree location, and (c) UAV LiDAR point data and profiles.
Figure 1.
The geography of the study area: (a) study area location, (b) study area boundary and individual tree location, and (c) UAV LiDAR point data and profiles.

Figure 2.
Simulated UAV LiDAR data. (a) Simulated scene and (b) simulated point data and profiles.
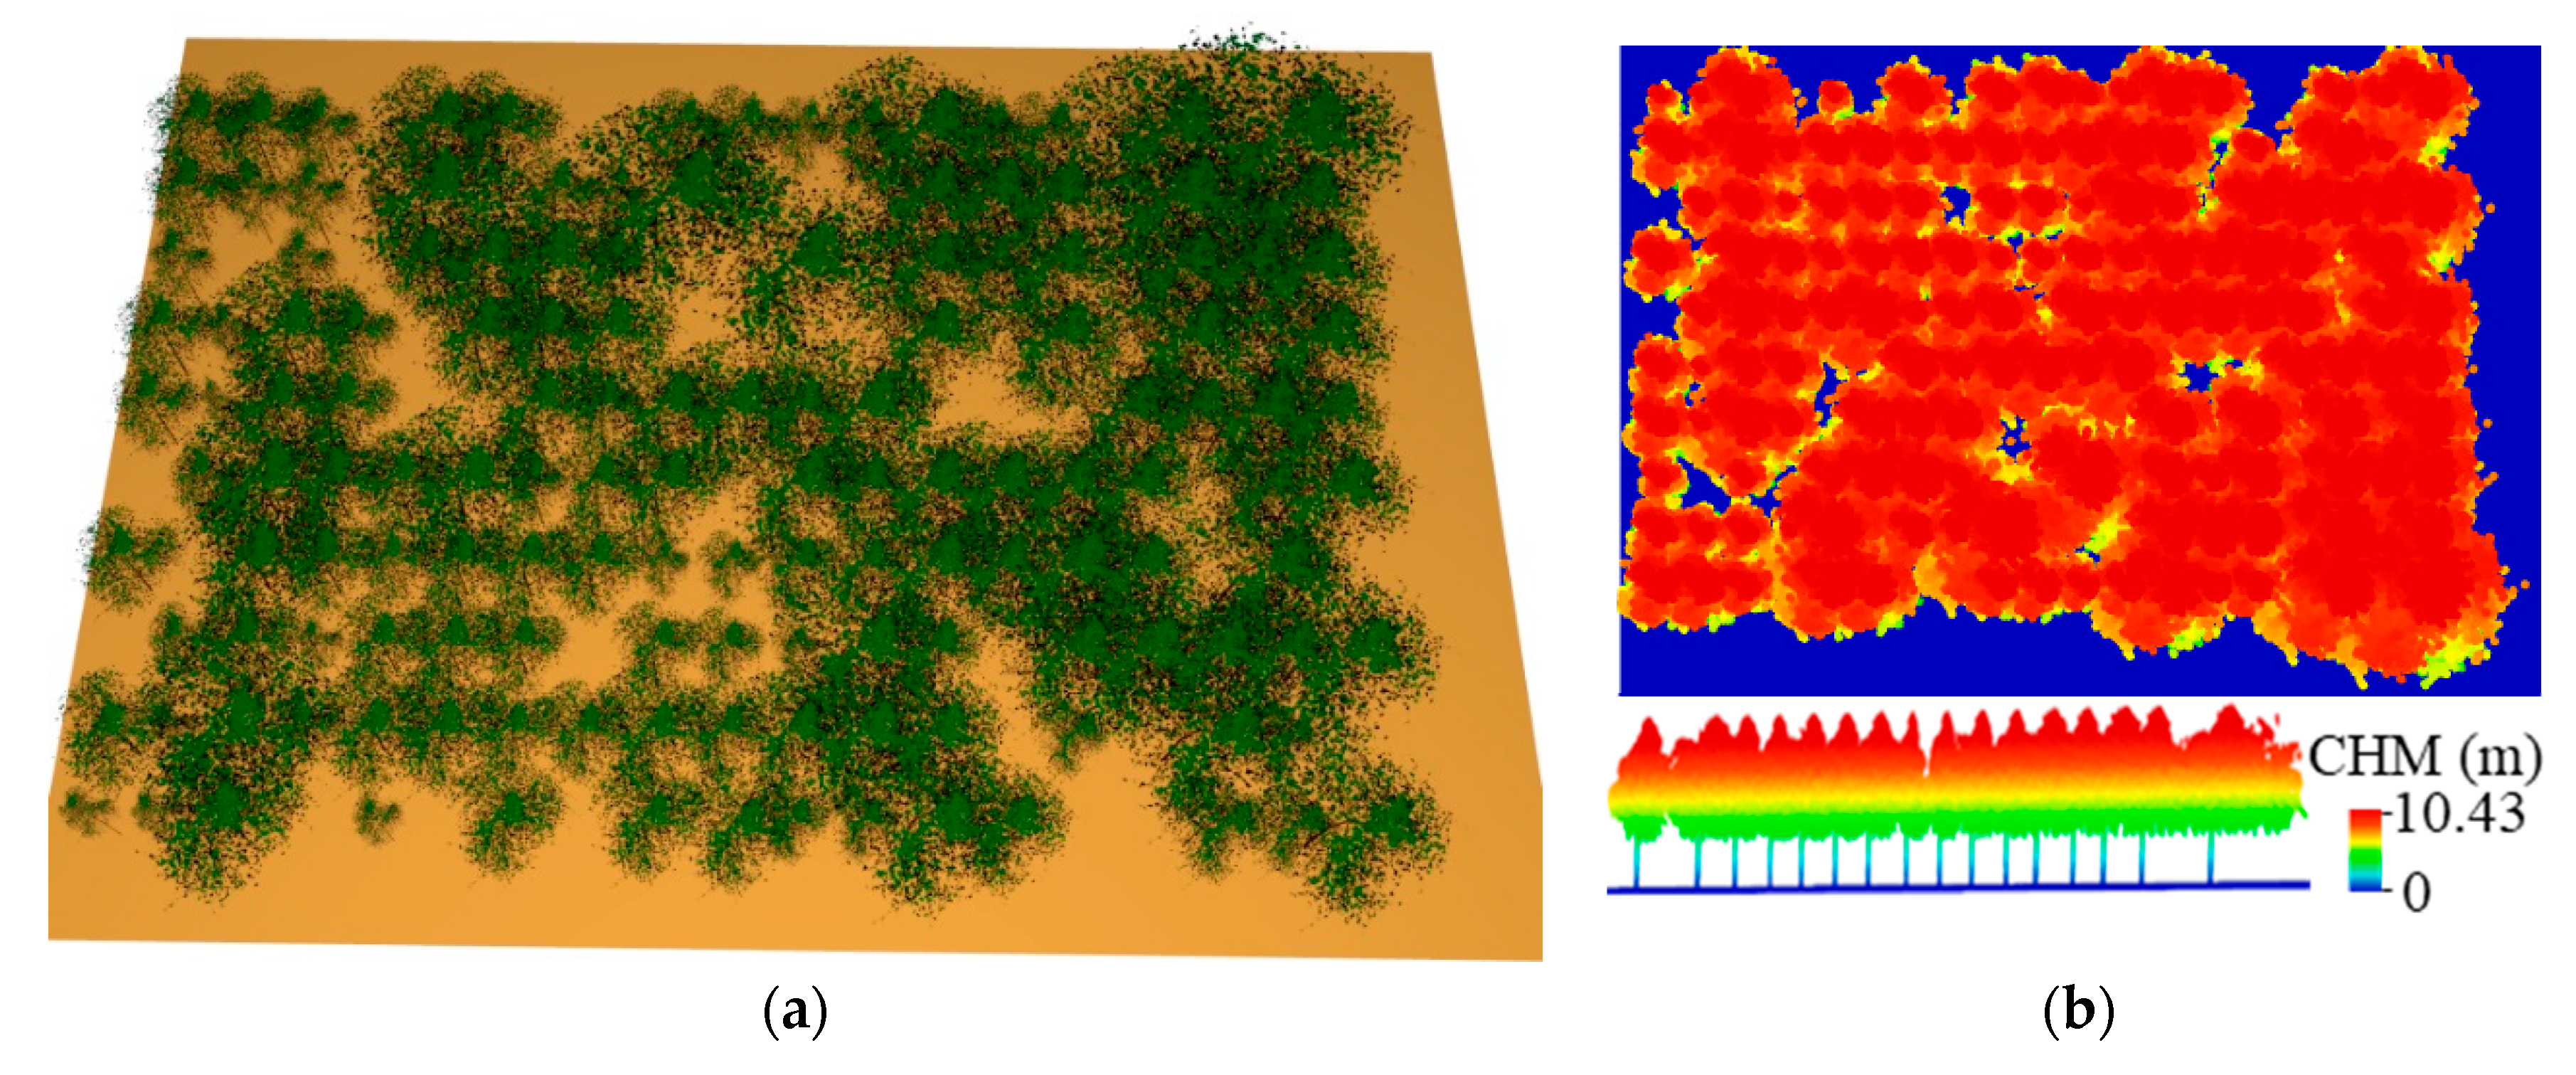
Figure 3.
The histogram of field-measured DBH values.

Figure 4.
The overall flow chart.
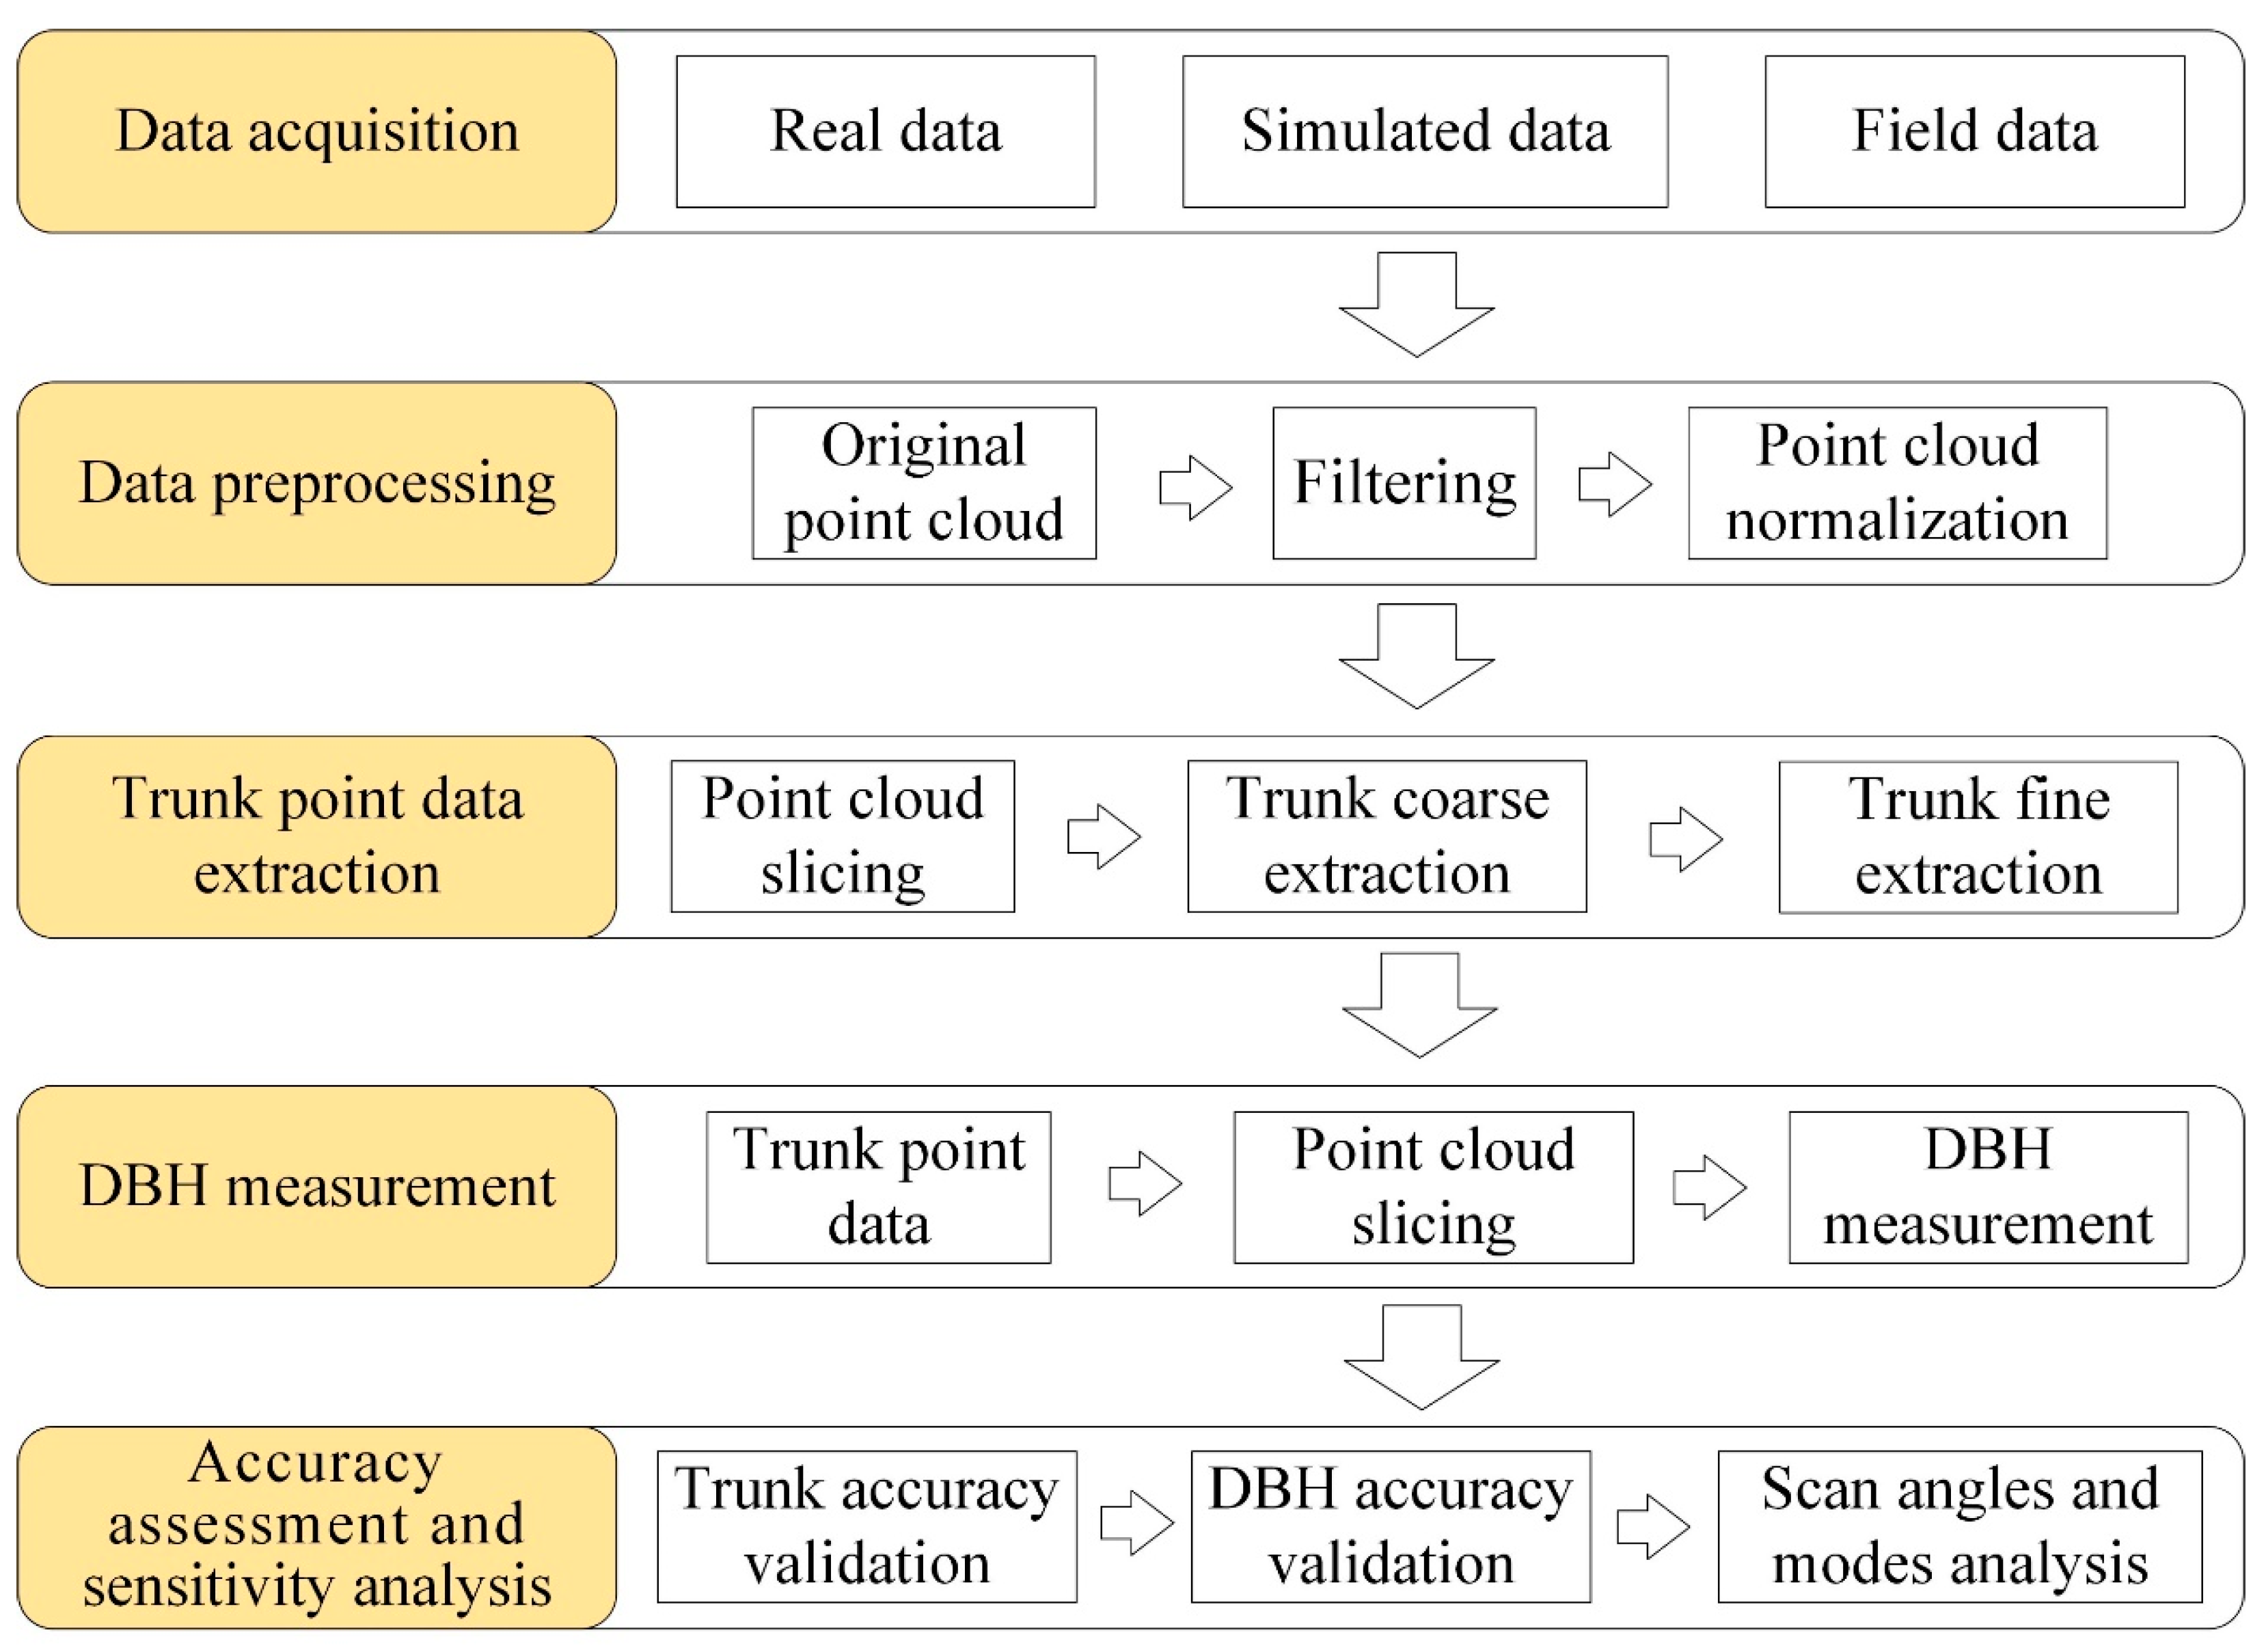
Figure 5.
Trunk point extraction. (a) The point cloud of an individual tree, (b) multiscale cylindrical construction, (c) coarse extraction of the trunk point cloud, and (d) fine extraction of the trunk point cloud.
Figure 5.
Trunk point extraction. (a) The point cloud of an individual tree, (b) multiscale cylindrical construction, (c) coarse extraction of the trunk point cloud, and (d) fine extraction of the trunk point cloud.
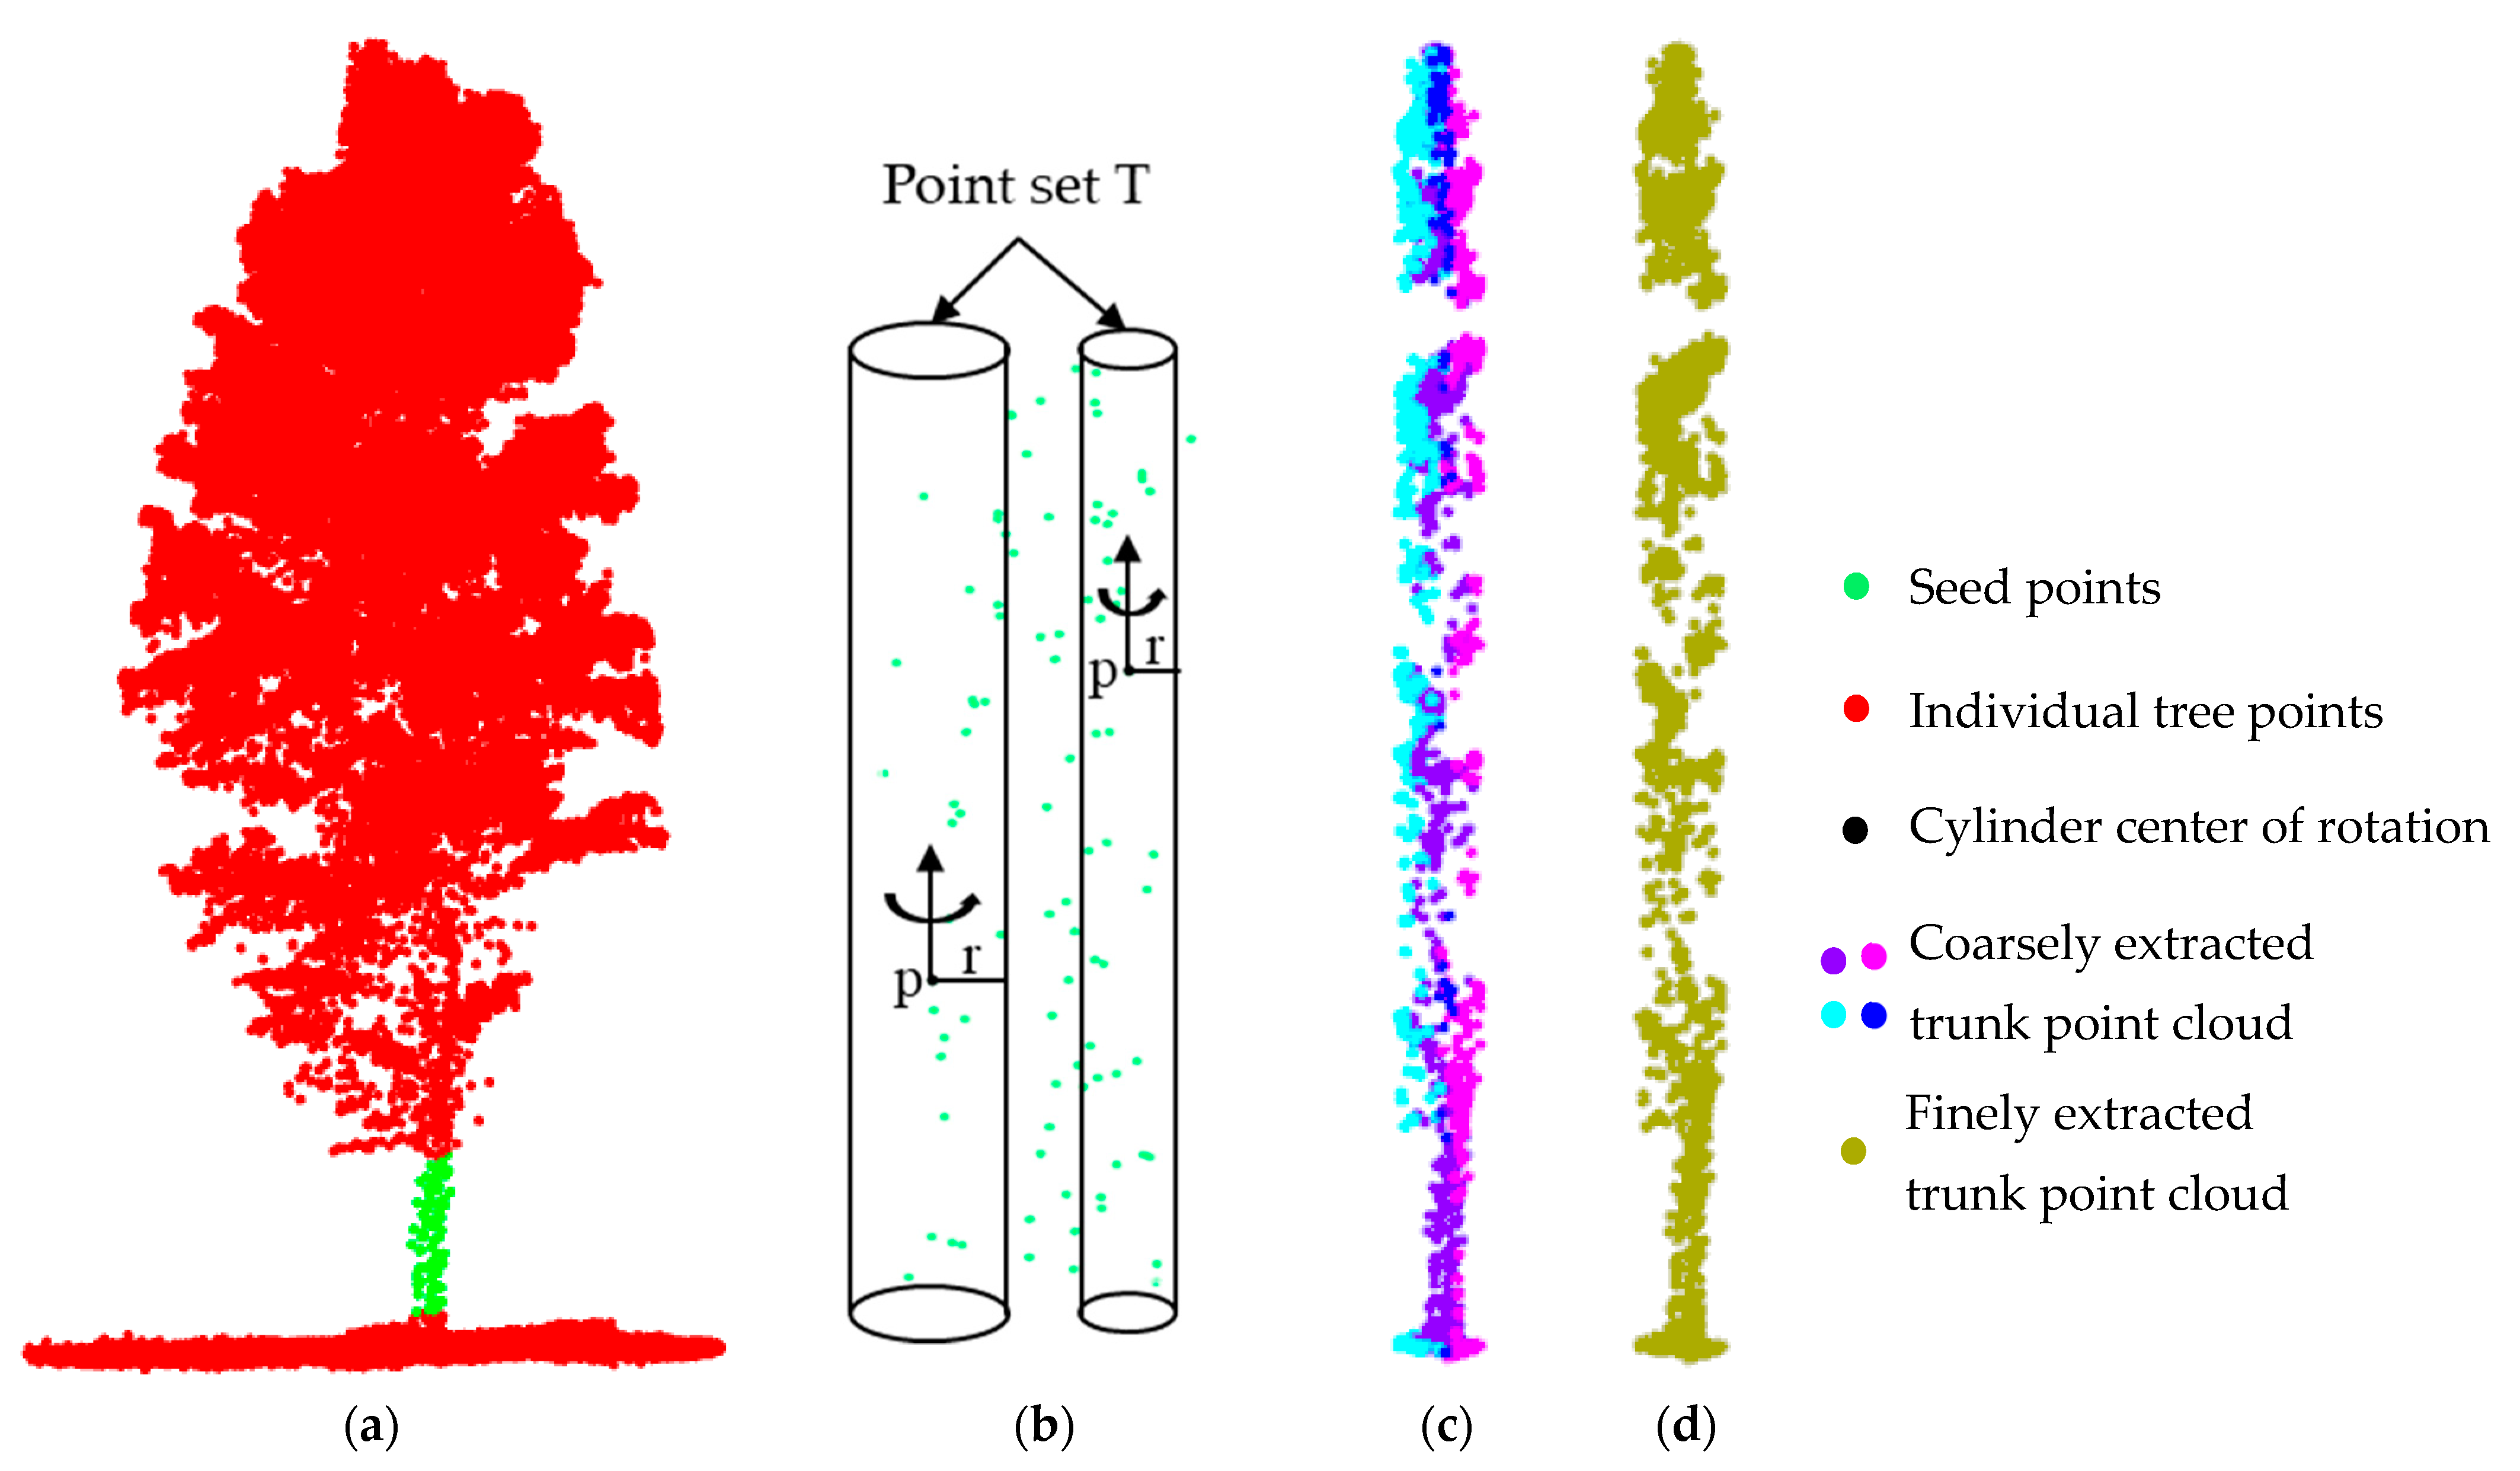
Figure 6.
The process of DBH measurement. (a) Construction of the multiscale rings and (b) determination of the best fitting ring.
Figure 6.
The process of DBH measurement. (a) Construction of the multiscale rings and (b) determination of the best fitting ring.

Figure 7.
Point cloud data obtained from different scanning angles; (a) schematic diagram of vertical and tilt scanning; (b) point cloud profile of vertical scanning; (c) point cloud profile of tilt scanning.
Figure 7.
Point cloud data obtained from different scanning angles; (a) schematic diagram of vertical and tilt scanning; (b) point cloud profile of vertical scanning; (c) point cloud profile of tilt scanning.

Figure 8.
Schematic diagram of different scanning modes: (a) single route, (b) double routes, (c) triple routes, and (d) quadruple routes.
Figure 8.
Schematic diagram of different scanning modes: (a) single route, (b) double routes, (c) triple routes, and (d) quadruple routes.

Figure 9.
Scatter plots of field-measured DBH versus estimated DBH using all routes of (a) real UAV LiDAR data and (b) simulated UAV LiDAR data.
Figure 9.
Scatter plots of field-measured DBH versus estimated DBH using all routes of (a) real UAV LiDAR data and (b) simulated UAV LiDAR data.

Figure 10.
Variation curves of trunk point and DBH extraction accuracies for different scanning angles in quadruple-routes mode. (a) Real data; (b) simulated data.
Figure 10.
Variation curves of trunk point and DBH extraction accuracies for different scanning angles in quadruple-routes mode. (a) Real data; (b) simulated data.

Figure 11.
Accuracy variation curves of (a) trunk point extraction and (b) DBH measurement with different routes.
Figure 11.
Accuracy variation curves of (a) trunk point extraction and (b) DBH measurement with different routes.

Table 1.
Parameter setting for UAV data acquisition.
| Parameter Type | Value | Parameter Type | Value |
|---|---|---|---|
| Weight | 3.85 kg | Maximum pulse frequency | 550 kHz |
| Elevation accuracy | 25 mm | Point repeatability | 25 mm |
| Minimum measurement distance | 5 m | Maximum measuring distance | 1150 m |
| Flight speed | 5–8 m/s | Endurance time | 20 min |
Table 2.
Scanning angle of each route in the real data.
| ID | Scanning Angle | ID | Scanning Angle | ID | Scanning Angle | ID | Scanning Angle |
|---|---|---|---|---|---|---|---|
| 1 | 43.73 | 6 | 57.36 | 11 | 65.71 | 16 | 79.47 |
| 2 | 45.6 | 7 | 58.64 | 12 | 69.23 | 17 | 80.25 |
| 3 | 49.69 | 8 | 59.92 | 13 | 70.88 | 18 | 86.98 |
| 4 | 52.07 | 9 | 60.12 | 14 | 76.88 | 19 | 88.64 |
| 5 | 53.12 | 10 | 65.52 | 15 | 77.99 |
Table 3.
Parameters for UAV LiDAR data simulation in the LESS model.
| Parameter Type | Value | Parameter Type | Value |
|---|---|---|---|
| Altitude | 100 m | Minimum measurement distance | 80 m |
| Swath width | 200 m | Maximum measurement distance | 150 m |
| Resolution | 0.1 m | Point density | 100 pts/m2 |
| Parameter type | Value | Parameter type | Value |
| Altitude | 100 m | Minimum measurement distance | 80 m |
Table 4.
The accuracies of trunk point extraction and DBH measurement.
| Real Data | Simulated Data | |
|---|---|---|
| Trunk accuracy (%) | 95.80 | 95.10 |
| DBH R2 | 0.708 | 0.882 |
| DBH RMSE (m) | 0.021 | 0.016 |
Table 5.
Accuracy comparison for trunk point extraction and DBH measurement with different scanning angles in the quadruple routes mode.
Table 5.
Accuracy comparison for trunk point extraction and DBH measurement with different scanning angles in the quadruple routes mode.
| Real Data | Simulated Data | ||||||
|---|---|---|---|---|---|---|---|
| Average Scanning Angle | Trunk Accuracy (%) | DBH R2 | DBH RMSE (m) | Average Scanning Angle | TrunkAccuracy (%) | DBH R2 | DBH RMSE (m) |
| 53.33 | 73.43 | 0.307 | 0.038 | 45 | 64.34 | 0.738 | 0.045 |
| 57.23 | 78.32 | 0.674 | 0.021 | 50 | 86.01 | 0.748 | 0.030 |
| 58.98 | 80.42 | 0.618 | 0.022 | 55 | 88.81 | 0.849 | 0.022 |
| 65.13 | 79.72 | 0.552 | 0.022 | 60 | 86.01 | 0.760 | 0.029 |
| 67.80 | 76.22 | 0.539 | 0.024 | 65 | 76.92 | 0.725 | 0.034 |
| 76.23 | 69.23 | 0.406 | 0.033 | 70 | 59.44 | 0.600 | 0.039 |
| 78.58 | 60.84 | 0.320 | 0.036 | 75 | 55.94 | 0.560 | 0.046 |
Table 6.
Extraction accuracies of trunk points and DBH from the real and simulated data in different modes.
Table 6.
Extraction accuracies of trunk points and DBH from the real and simulated data in different modes.
| Modes | Real Data | Simulated Data | ||||
|---|---|---|---|---|---|---|
| Trunk Accuracy (%) | DBH R2 | DBH RMSE (m) | Trunk Accuracy (%) | DBH R2 | DBH RMSE (m) | |
| Single Route | 18.88 | 0.485 | 0.050 | 14.69 | 0.455 | 0.068 |
| Double Routes | 32.87 | 0.595 | 0.088 | 51.05 | 0.670 | 0.030 |
| Triple Routes | 62.94 | 0.645 | 0.022 | 76.92 | 0.780 | 0.030 |
| Quadruple Routes | 78.32 | 0.674 | 0.021 | 88.81 | 0.849 | 0.022 |
Publisher’s Note: MDPI stays neutral with regard to jurisdictional claims in published maps and institutional affiliations. |
© 2022 by the authors. Licensee MDPI, Basel, Switzerland. This article is an open access article distributed under the terms and conditions of the Creative Commons Attribution (CC BY) license (https://creativecommons.org/licenses/by/4.0/).
Share and Cite
MDPI and ACS Style
Feng, B.; Nie, S.; Wang, C.; Xi, X.; Wang, J.; Zhou, G.; Wang, H. Exploring the Potential of UAV LiDAR Data for Trunk Point Extraction and Direct DBH Measurement. Remote Sens. 2022, 14, 2753. https://doi.org/10.3390/rs14122753
AMA Style
Feng B, Nie S, Wang C, Xi X, Wang J, Zhou G, Wang H. Exploring the Potential of UAV LiDAR Data for Trunk Point Extraction and Direct DBH Measurement. Remote Sensing. 2022; 14(12):2753. https://doi.org/10.3390/rs14122753
Chicago/Turabian StyleFeng, Baokun, Sheng Nie, Cheng Wang, Xiaohuan Xi, Jinliang Wang, Guoqing Zhou, and Haoyu Wang. 2022. "Exploring the Potential of UAV LiDAR Data for Trunk Point Extraction and Direct DBH Measurement" Remote Sensing 14, no. 12: 2753. https://doi.org/10.3390/rs14122753
Note that from the first issue of 2016, this journal uses article numbers instead of page numbers. See further details here.