


Abstract
The Tien Shan is regarded as the “Water tower of Central Asia,” being a solid reservoir of freshwater resources and also a natural and early warning indicator of climate change. Research on glaciers is important for the sustainable development and management of water resources in Central Asia. This study investigated the spatiotemporal dynamics of glaciers in the northern Tien Shan from 1990 to 2015 using multi-source remote sensing and meteorological data. The results showed that the total area and volume of glaciers in the northern Tien Shan exhibited negative trends, decreasing by 456.43 km2 (16.08%) and 26.14 km3 (16.38%), respectively. The reduction in the total glacier area exhibited an accelerating trend, decreasing by 0.60%/a before 2000, but by 0.71%/a after 2000. Glaciers in the outer northern Tien Shan region, with areas < 2 km2 showed the greatest shrinkage, especially those in the northeastern and southwestern regions. All aspects in the northern Tien Shan exhibited negative trends in the glacier area, especially in the east–west aspects (shrinkage of 24.74–38.37%). Regarding altitude, the termini of glaciers rose continuously from 1990 to 2015, particularly for glaciers below 3700 m, with a total area decrease of 30.37%, and the lower altitude of the glaciers showed a higher area decrease.
1. Introduction
Alpine glaciers are an important part of the cryosphere; they are natural indicators of climate change [1,2] and serve as reservoirs for freshwater resources [3,4]. Alpine glaciers feed many rivers in arid areas [5] and play an important role in water resource shortages and ecological environments in fragile drought climates [6,7]. The Tien Shan glacier in Central Asia is considered to be one of the largest glacierized mountain systems in the world and is characterized as the “water tower of Central Asia”. It consists of a series of mountains, basins, and valleys, and contains numerous glaciers, snow, and frozen permafrost [8]. Tien Shan feeds most rivers in Central Asia, providing freshwater resources for more than 100 million people in the region and its surrounding areas [9]. However, with global climate change, the vulnerability and uncertainty of water resources from Tien Shan are increasing, and these changes may significantly impact the utilization of water resources, economic and social development, and ecological security in Central Asia [10,11,12].
Global temperatures have increased significantly over the past half-century, triggering the shrinking and thinning of alpine glaciers worldwide [13,14]. Globally, most rivers originating in mountains have experienced increasing runoff [5,7], alpine glacier lakes rapidly appear and expand in response to a warming climate scenario and glacier wastage [15]. The currently warming climate has aggravated alpine glacier wastage, with a total glacier mass loss of 16.3 ± 3.5 GT/a occurring in High Mountain Asia (HMA) during the period 2000–2016 [16]. The total river runoff in the Hindu-Kush Himalaya region increased by 33~38% with the maximum river runoff moving forward by 8 days [17]. Owing to global warming, the total area and mass of glaciers in Tien Shan have been in a state of accelerated retreat over the past half-century. Approximately 97.52% of glaciers in Tien Shan are in a state of retreat [8], accompanied by a decrease in glacier volume of about 27 ± 15% [13], and they are in a state of continuous retreat in the near future [7,18]. Most river runoff in the Tien Shan region has increased over recent decades, e.g., the Aksu River, Kaidu River, and Yarkand River [5,19,20]. The recent total glacier lake area in the Tien Shan region showed an obvious trend of expansion, with an expansion rate of 0.69 km2/a (0.8%/a), especially in the eastern Tien Shan [21]. The warming climate and the frequency and intensity of extreme climate events in the Tien Shan region, the mountainous snow line rose significantly, caused significant shrinkage in glacier areas and regional hydrological cycles, which generally accelerated the expansion of the glacial lake, aggravated the occurrence of glacial lake outburst, and some river runoffs are in the state of high volatility [5,8,11]. Some river’ runoff has reached the turning point of glacier melting [22,23], e.g., the glaciers in the Eastern Xinjiang and Eastern Tien Shan are small and show a distinct recession. With the shrinkage of glaciers, some rivers will present a “tipping point of glacier melting”. River runoff will decrease rapidly owing to the lack of glacier meltwater supply [24]. Compared with the decrease in snow depth and snowfall rate, and the increase in snow cover [25,26], the continuous shrinkage of glaciers and snow cover is the direct reason for the decrease in water storage in the Tien Shan [3,27].
Under the present warming climate, the glaciers in the Tien Shan and its surroundings generally show significant different characteristics (glaciers retreating faster or slower, or advancing or reaching their turning point of glacier melting), the spatiotemporal changes and their driving forces underlying changes in the Tien Shan glaciers are still open for debate. The characteristics of the spatial and temporal variations in glaciers in the regions and basins across the northern Tien Shan are not yet clear, it is vital to understand the changes that are occurring in the melting process of glaciers in the Tien Shan region of Central Asia under global climate change. Therefore, this study monitored the fluctuations of glaciers in the Northern Tien Shan from 1990 to 2015 on remotely-sensed Landsat imagery and other high-resolution images, climatic and GRACE data, detected their responses to climate change in a timely and effective manner to evaluate the spatial and temporal characteristics of glaciers and estimated their influences on water resources. This investigation and subsequent comprehensive analysis will help understand the various characteristics of water resources in Central Asia and provide scientific evidence for water management and allocation.
2. Materials and Methods
2.1. Study Area
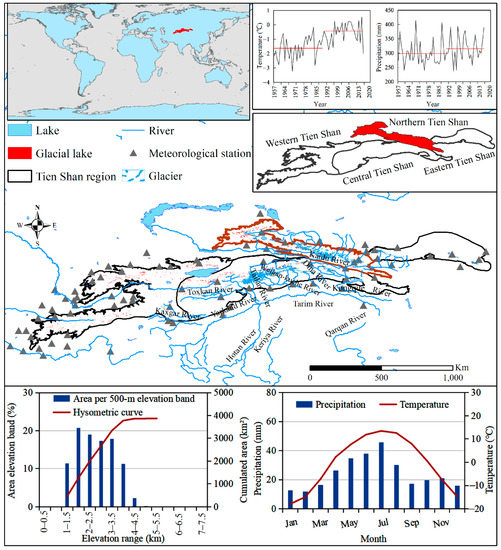
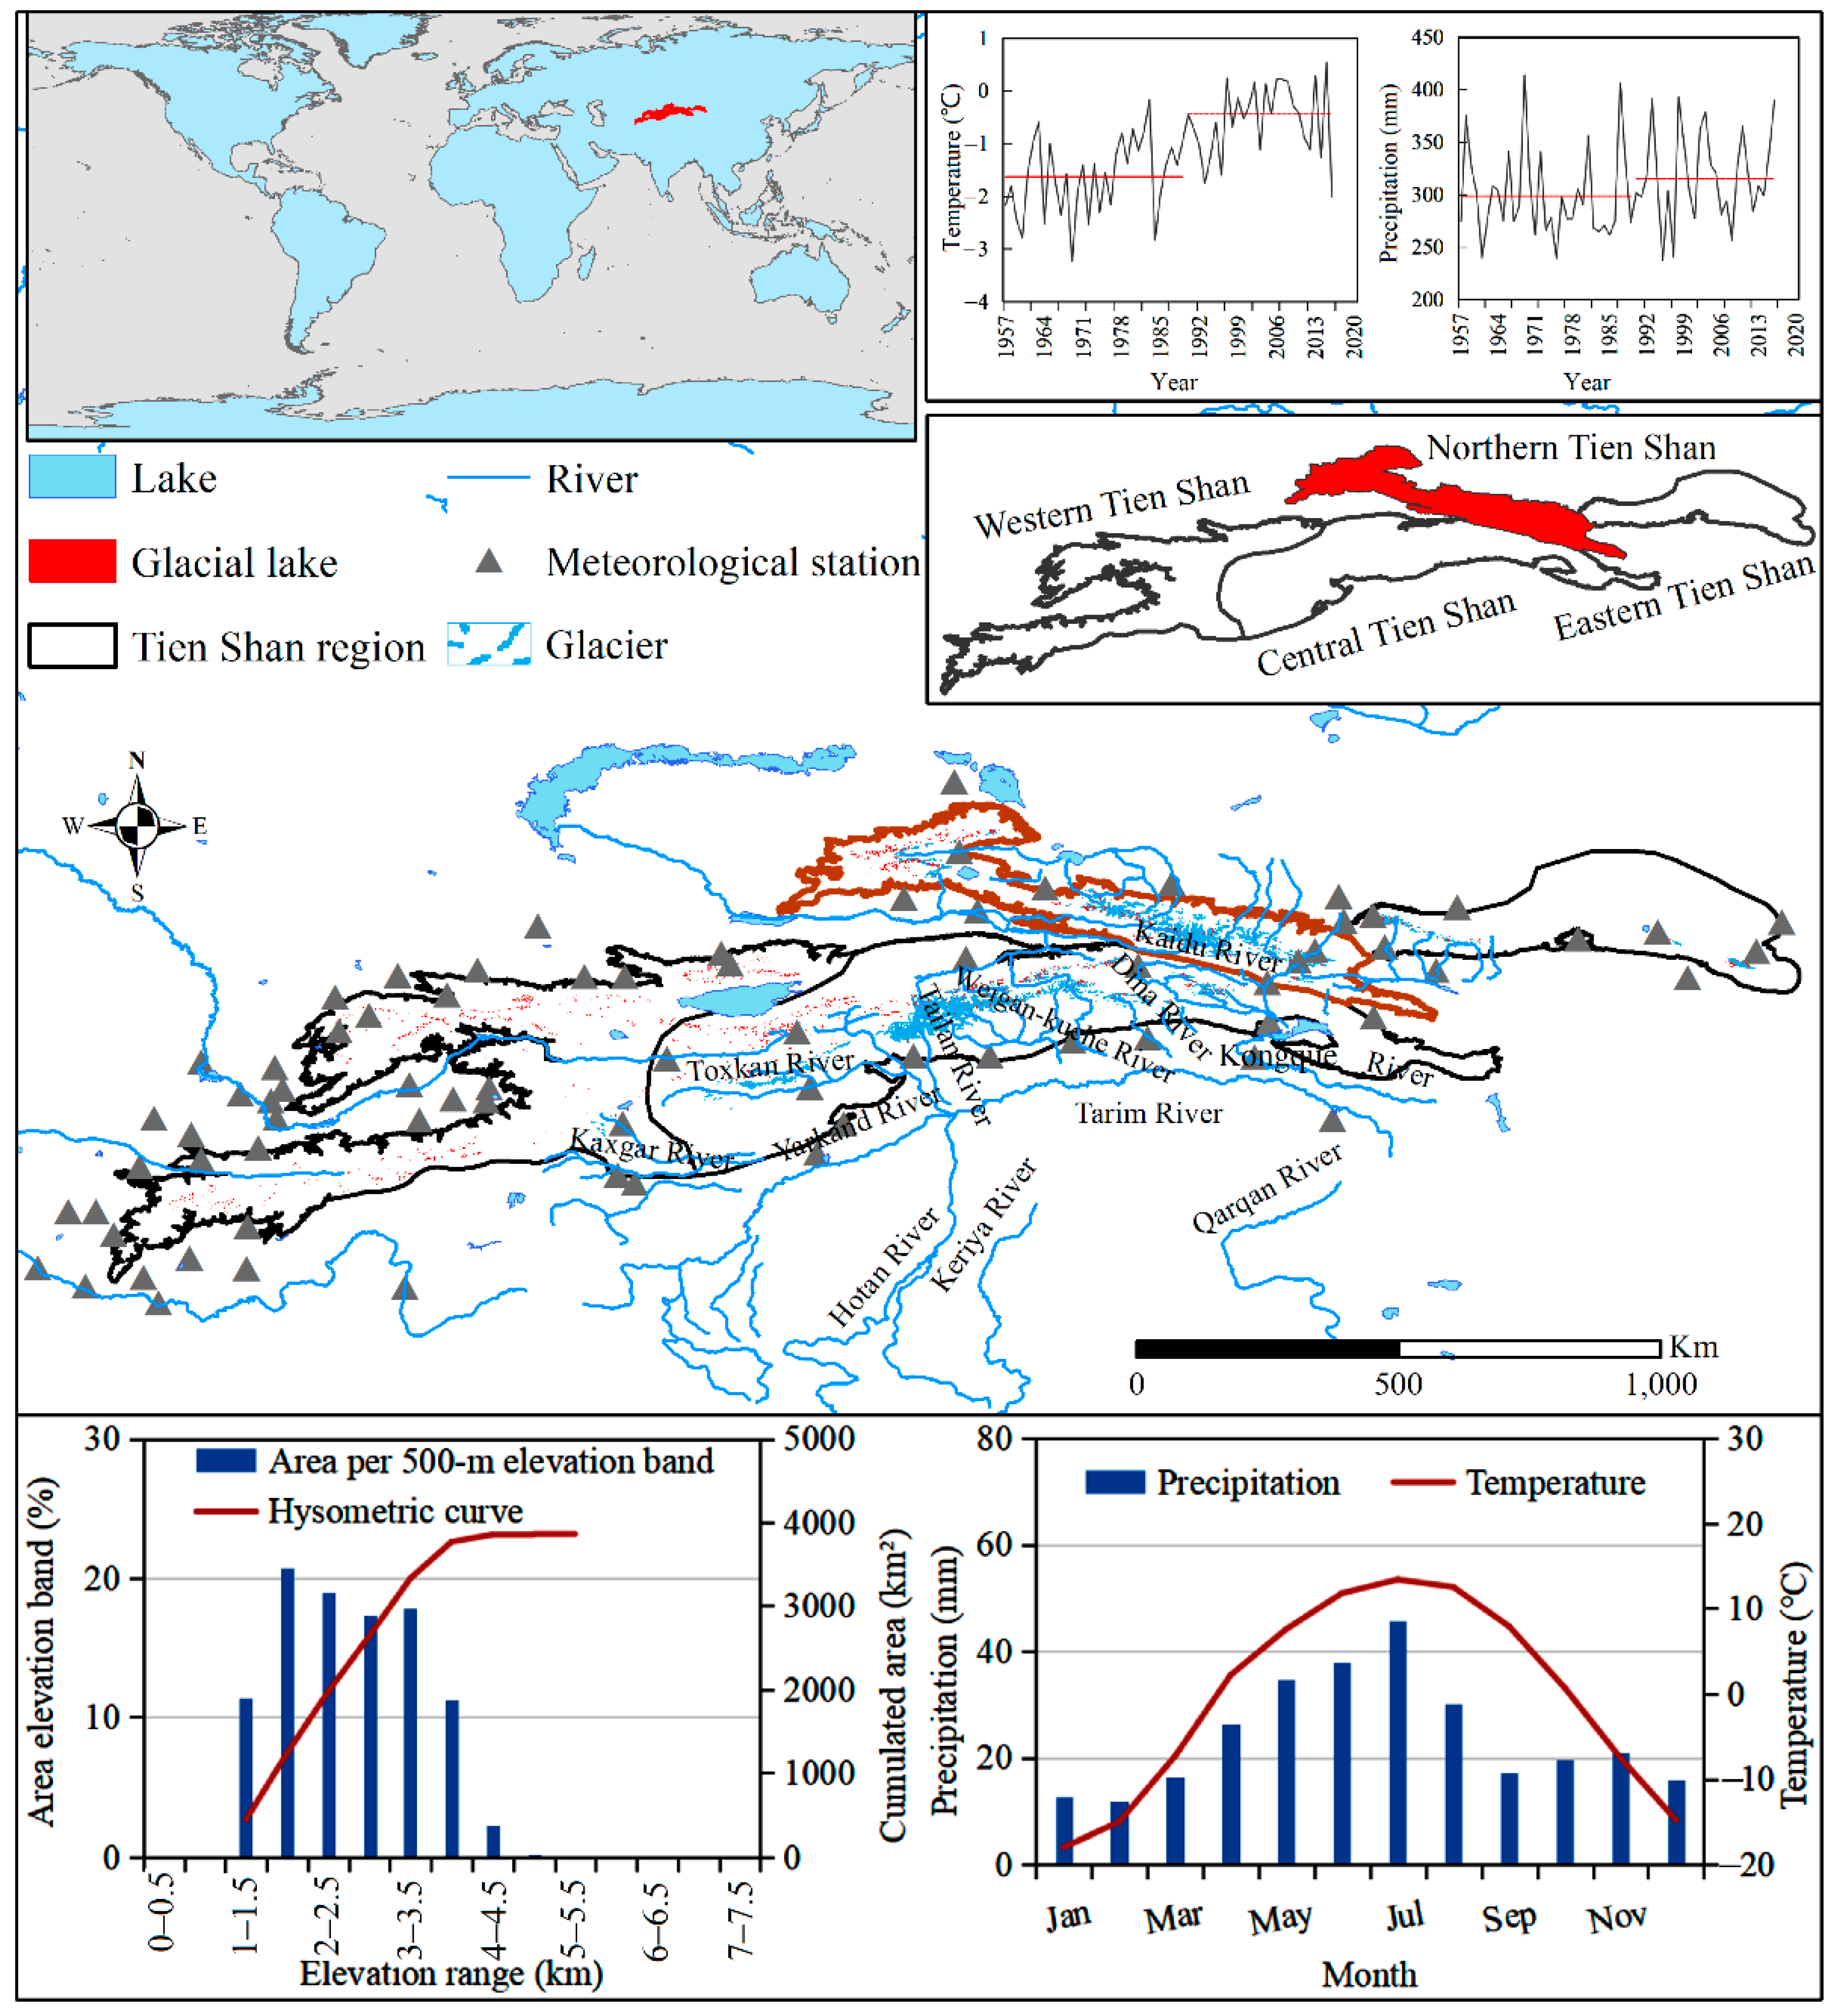
Found deep within the hinterland of Eurasia, the Tien Shan is the largest mountain system in Central Asia and the farthest mountain system from the sea in the world. It is situated between 69° to 95°E and 39° to 46°N, stretching 2500 km from east to west and 250–350 km from north to south across Xinjiang, China, Kazakhstan, Kyrgyzstan, and Uzbekistan in Central Asia. The Tien Shan region can be divided into four mountain systems according to geographical location: eastern Tien Shan, northern Tien Shan, central Tien Shan, and western Tien Shan (Figure 1). Geographically, the northern Tien Shan spans China and Kazakhstan, and extends from Xinjiang in China (the eastern region of Yuergou in Turpan) to the western part of Zhetysu Alatau in Kazakhstan, with an average altitude of 2521 m (Table 1).
Figure 1.
Study region of the northern Tien Shan, Central Asia.
Table 1.
Geographic characteristics of the northern Tien Shan, Central Asia.
Compared to other regions in the Tien Shan, the northern Tien Shan has the highest latitude, is strongly influenced by the Siberian High pressure and has the lowest temperature in the Tien Shan region. The average annual temperature in the region is −0.71 °C and the average annual precipitation is 289 mm. During the summer, 52% of the annual precipitation falls and precipitation gradually decreases from west to east. There is high snow coverage in the northern Tien Shan region and, according to the latest Randolph Glacier Inventory (RGI 6.0) glacier catalog, 4351 glaciers, covering an area of 2427.59 km2, accounting for 17.06% of the total glacier area in the entire Tien Shan region. As an important source of water resources in the arid area of Central Asia, the abundant glaciers in the northern Tien Shan determine the location of rivers and affect the number of regional water resources.
The temperature in the Tien Shan region of Central Asia has oscillated and risen significantly since 1998 at a rate of 0.36–0.42 °C/10a [28,29], which is significantly higher than the global rate (0.12 °C/10a) and the northern hemisphere rate (0.24 °C/10a) [30]. Previous studies have shown that most glaciers in Tien Shan were relatively stable before the 1970s [31], with the shrinkage rate subsequently accelerating significantly [31,32,33,34,35,36,37]. Aizen et al. [31] found that the glacier area in the northern and central Tien Shan decreased by 8.7–10.6% from 1977 to 2003, which was significantly higher than the glacier area change of 4.2–5.1% from 1943 to 1977. From 1971 to 2009, the negative glacier mass balance in Tien Shan was as high as −44.4 mm water equivalent/a (w.e./a), which was significantly higher than −24.6 mm w.e./a from 1957 to 1970 [36]. Under the warming climate scenario, glaciers in the periphery of the Tien Shan region exhibit rapid shrinkage [32,35,38,39]. For example, since the middle of the 20th century, the glacier retreat rate in the inner Tien Shan has varied from 0.05 to 0.31%/a, while that in the outer region has varied from 0.38 to 0.76%/a [35].
2.2. Materials
2.2.1. Satellite Data
In this study, three Landsat TM/ETM+/OLI images of the Tien Shan (resolution of 30 m) from 1990, 2000, and 2015 were chosen as the main remote sensing images for extracting glacier information. The images used in this study were obtained from the United States Geological Survey (USGS) website (http://www.usgs.gov accessed on 10 November 2016) and the Geospatial Data Cloud site, Computer Network Information Center, Chinese Academy of Sciences (http://www.gscloud.cn accessed on 10 November 2016). The Landsat images used in this study cover the northern Tien Shan, including 19 bands (PATH: 141–149; ROW: 28–31) and these images from July to October accounted for approximately 95% of the total number of images. Owing to limitations caused by the number of images and poor-quality imagery in some regions, glacier extraction for some of the time frames was replaced by images over a 1-to-3-year time frame.
In addition, high-resolution images from WorldView-2 (resolution ~0.5 m), Google Earth and Bing maps, which provide higher-resolution images (resolution ~1.65 to 2.62 m for GeoEye, SPOT-5, and QuickBird images) were employed as auxiliary datasets, providing higher resolution data for lake area extraction. These images were adopted to extract glacier information, identify glacier types, moraine materials, mountain terrain, lake basins, river stream lines, cloud and mountain images, hydropower stations, reservoirs, ponds, canals, and other geomorphic types, based on field investigation and the literature data. Additionally, the ASTER 1T product (resolution of 20 m) was selected to identify the glacier boundary information in the Tien Shan region. The digital elevation data used in this study were obtained from the Shuttle Radar Topography Mission Arc-Second Global radar topography data digital elevation model with a resolution of 30 m. Data were obtained from the USGS website (https://earthexplorer.usgs.gov/ accessed on 10 November 2019) (Table 2).
Table 2.
Remote sensing image data of Landsat images.
2.2.2. Climatic Data
Monthly climatic data from observation stations in northern Tien Shan from 1990 to 2015 were obtained from the China Meteorological Data Service Center (http://data.cma.cn/ accessed on 10 December 2019). Monthly and daily climatic data from the meteorological stations in the northern Tien Shan outside China were downloaded from the National Snow and Ice Data Center (http://sidads.colorado.edu/pub/DATASETS/NOAA/G02174/ accessed on 10 December 2019), the World Meteorological Organization (http://climexp.knmi.nl/getstations.cgi accessed on 10 Octomber 2020), and the National Centers for Environmental Information (https://www.ncei.noaa.gov/ accessed on 10 Octomber 2020). Furthermore, gridded climatic data from 1990 to 2015 were used. The Global Precipitation Climatology Center (GPCC) provides global precipitation analyses from 1891 to 2016 for monitoring and researching Earth’s climate. The GPCC product was quality-controlled from more than 53,000 stations in 1986/1987 and has been widely used in mountainous regions with complex topography [5,40]. It provides a resolution of 0.25° lat/lon using GPCC Visualizer (https://www.dwd.de/EN/ourservices/gpcc/gpcc.html accessed on 1 June 2020). This study also used monthly gridded land surface temperature (2 m temperature) data from 1990 to 2015 from the fifth generation of global climate datasets released by the European Center for Medium-range Weather Forecasts (https://cds.climate.copernicus.eu/cdsapp#!/home accessed on 10 Octomber 2020). The ERA-5 land dataset is a replay of the land component of the ERA-5 climate reanalysis, but with a series of improvements making it more accurate for all types of land applications. In particular, ERA5-Land runs at enhanced resolution (regular latitude/longitude of 0.1° × 0.1°). The ERA-5 land dataset was produced by replaying the land component of the ERA-5 climate reanalysis but with several improvements, making it more accurate for all types of land applications. The ERA-5 land dataset has been widely used in studies of high-altitude mountains [41] and, in this study, ERA-5 exhibits higher spatial resolution and better reflects the spatiotemporal distribution and trend of air temperature in the Tien Shan region, and showed the highest consistent trend for annual and monthly temperature in comparison to the observed climatic data.
2.2.3. GRACE and Glacier Data
Terrestrial water storage in the Tien Shan region was analyzed using NASA Gravity Recovery and Climate Experiment (GRACE) data, which are a composite of mascon surface water (including soil moisture, lakes, rivers, snow, and glaciers) and groundwater storage, and has been widely used to analyze water storage in arid regions and mountainous areas [12,27,42]. The GRACE product was provided by the Jet Propulsion Laboratory of the California Institute of Technology (https://grace.jpl.nasa.gov/data/get-data/jpl_global_mascons/ accessed on 10 December 2019). It has a spatial resolution of 0.5° and contains data from April 2002 to February 2016. Monthly missing data for this product during the study period were interpolated by adopting multiyear cumulative averages of the missing and adjacent months. Finally, GRACE data were resampled at a higher resolution of 0.25°. The glacier data used in this study also included the latest released RGI (version 6.0) glacier catalog for July 2017 (downloaded from http://www.glims.org/RGI/randolph60.html accessed 1 Auguest 2017).
2.3. Methods
2.3.1. Glacier Extraction
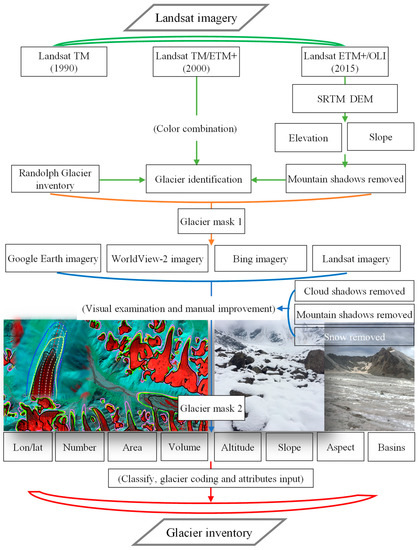
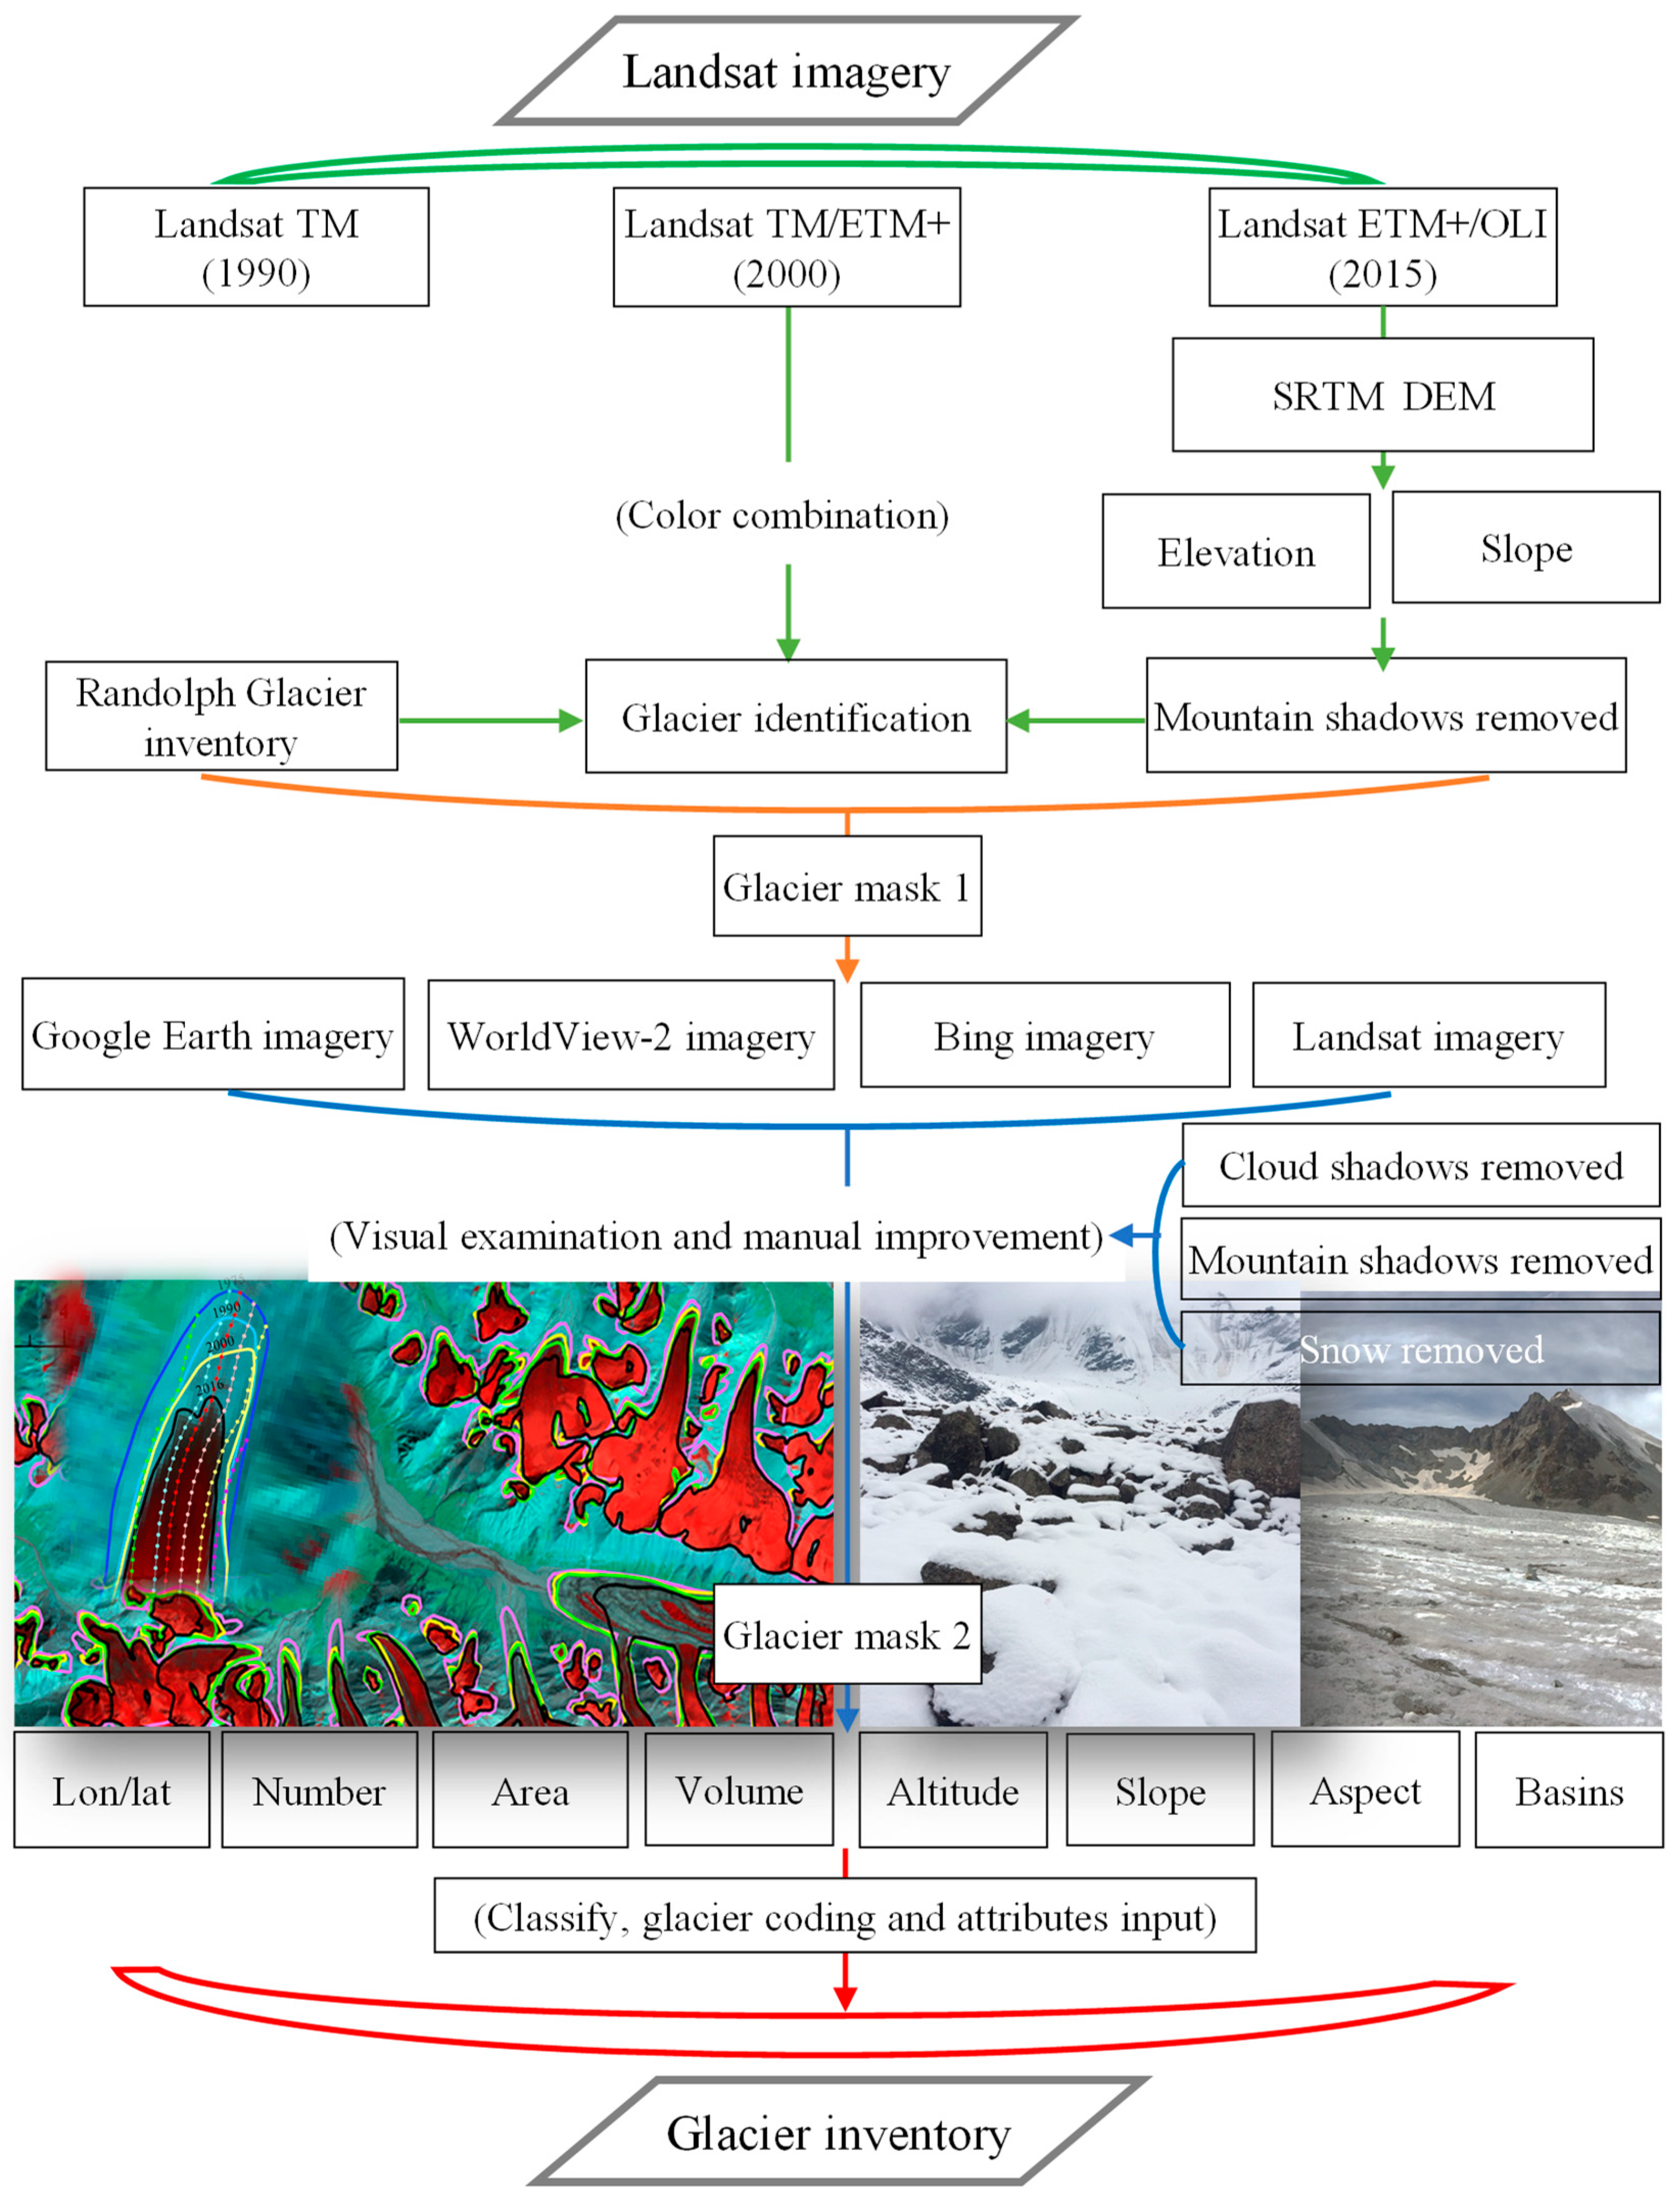
Glacier information extraction in this study, as shown in Figure 2 was based on multiple spectral bands of Landsat remote sensing images from 1990, 2000, and 2015. The glacier information was enhanced through false-color composition and the highest quality scenes from July to October were chosen, when there was minimum cloud cover and snow. The combination of multispectral bands (adjusting the fusion image contrast and brightness to highlight ground information) from the bands in 3, 5, and 7 of the Landsat TM/ETM+ images and the bands in 4, 6, and 7 of the Landsat OLI images in 2015 was adopted to highlight the terrain and ground features, and then the misjudged glacier information was judged and extracted. Moreover, the influence of snow cover and ice lakes and the mapping of moraine cover areas are two important factors that disturb the catalog work and the accuracy of remote sensing glaciers. Water and non-water bodies were distinguished by the joint use of the slopes from SRTM1 DEM. Despite there being fewer clouds across the Tien Shan region, glacier identification may be contaminated by cloud influences, particularly for higher-altitude areas; therefore, a visual inspection is needed after the automated extraction of glacier boundaries.
Figure 2.
Flow chart showing process used for extracting glacier inventory in the study.
During glacier extraction, high-resolution Google Earth images were corrected to minimize the uncertainty of glacier boundary extraction. In addition, WorldView-2 high-resolution (~0.5 m) images were directly displayed on the arc map using an online topographic map and the manually revised glacier boundary was superposed on these high-resolution remote sensing images to improve the accuracy of glacier extraction and accelerate glacier cataloging. The estimation of glacier ice reserves in this study was based on the method of glacier area and volume scaling in the second glacier catalog:
where V is glacial ice reserves (km3), S is the glacial area (km2), r is the scaling coefficient, A is 0.0365, and r is 1.375 [43] were adopted to estimate the glacier volume in this study.
V = A × Sr
2.3.2. Glacier Change
Glacier number, area, and volume changes in the northern Tien Shan were used to quantitatively analyze the glacier changes. The equation is as follows:
where R (%/a) is the glacier change rates from period (T1) to period (T2); A1 and B1 are the first and last years of glacier number, area, and volume, respectively.
R = (A1 − B1)/(A1 × (T1 − T2)) × 100
2.3.3. Error Estimation
Uncertainties in glacier surface area can be divided into technical and methodological errors [44,45]. Technical errors can be mostly ignored if the satellite image has been accurately orthorectified, which is the case for Landsat images provided by USGS [46]. As the Landsat TM/ETM+/OLI images were processed with standard topographic correction (Level 1T), in this study, the glacier analysis comparison was not conducted pixel by pixel, but for the whole region. Therefore, this paper considered that the total registration error has no important effect on the glacial area measurements [47,48]. The methodological errors in the extraction of glacier information based on different remote sensing data largely depend largely on the spatial resolution and registration error of the image [49].
The glacier area errors are inversely proportional to the length of the glacier’ margins [50], and are closely related to the sizes of the glaciers. Many researchers considered that glacier buffers are rational for estimating glacier area errors because they account for the length of the glacier perimeter. The buffer method is used to estimate glacier error during glacier extraction, which has been widely adopted to estimate the uncertainty in western Canada [50], Caucasus mountains [51], Qilian Mountains [52], AK-Shyirak massif, Central Tien Shan [37], and the Chinese Second Glacier Inventory (CGI-2) [45]. The maximum buffer size of the error was chosen to be half of the estimated shift caused by misregistration as only one side can be affected by the shift and the resulting cut-off by the TRIM outlines [33,37,46,52]. For each glacier, this error was assessed by buffering the glacier perimeter considering the area uncertainty. The buffer method has been applied in alpine lake extraction, for example, in the Tien Shan regions [47,53,54].
In this study, the uncertainty of glacier extraction was based on the simultaneous uncertainty error of its edge length.
where dSmax is the glacier area error (km2) for each lake; P is the perimeter of glacier boundary (km); A is the maximum error of the area determination of lake area is in the order of half a pixel in the remote sensing image (km). The Landsat TM is 30 m, and most bands have the same resolution as 30 m for Landsat ETM+/OLI images. WorldView-2 images provide high resolution and small-error results during glacier information extraction. Interactive post-classification comparisons were employed and edited when identification errors were found. The maximum error considered in this study was half the image of the glacier and lake extraction image, that is, the terrestrial error of Landsat TM/ETM+/OLI image was 15 m, while the spatial error of the WorldView-2 image was 0.25 m. Overall, based on the glacier boundary buffer method, the uncertainty of glacier extraction in the northern Tien Shan was 7.88% in 1990, 7.66% in 2000 and ~8.56% in 2015.
dSmax = L × A
3. Results
3.1. Dynamic Changes of Glacier
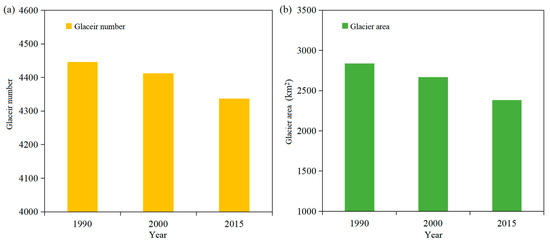
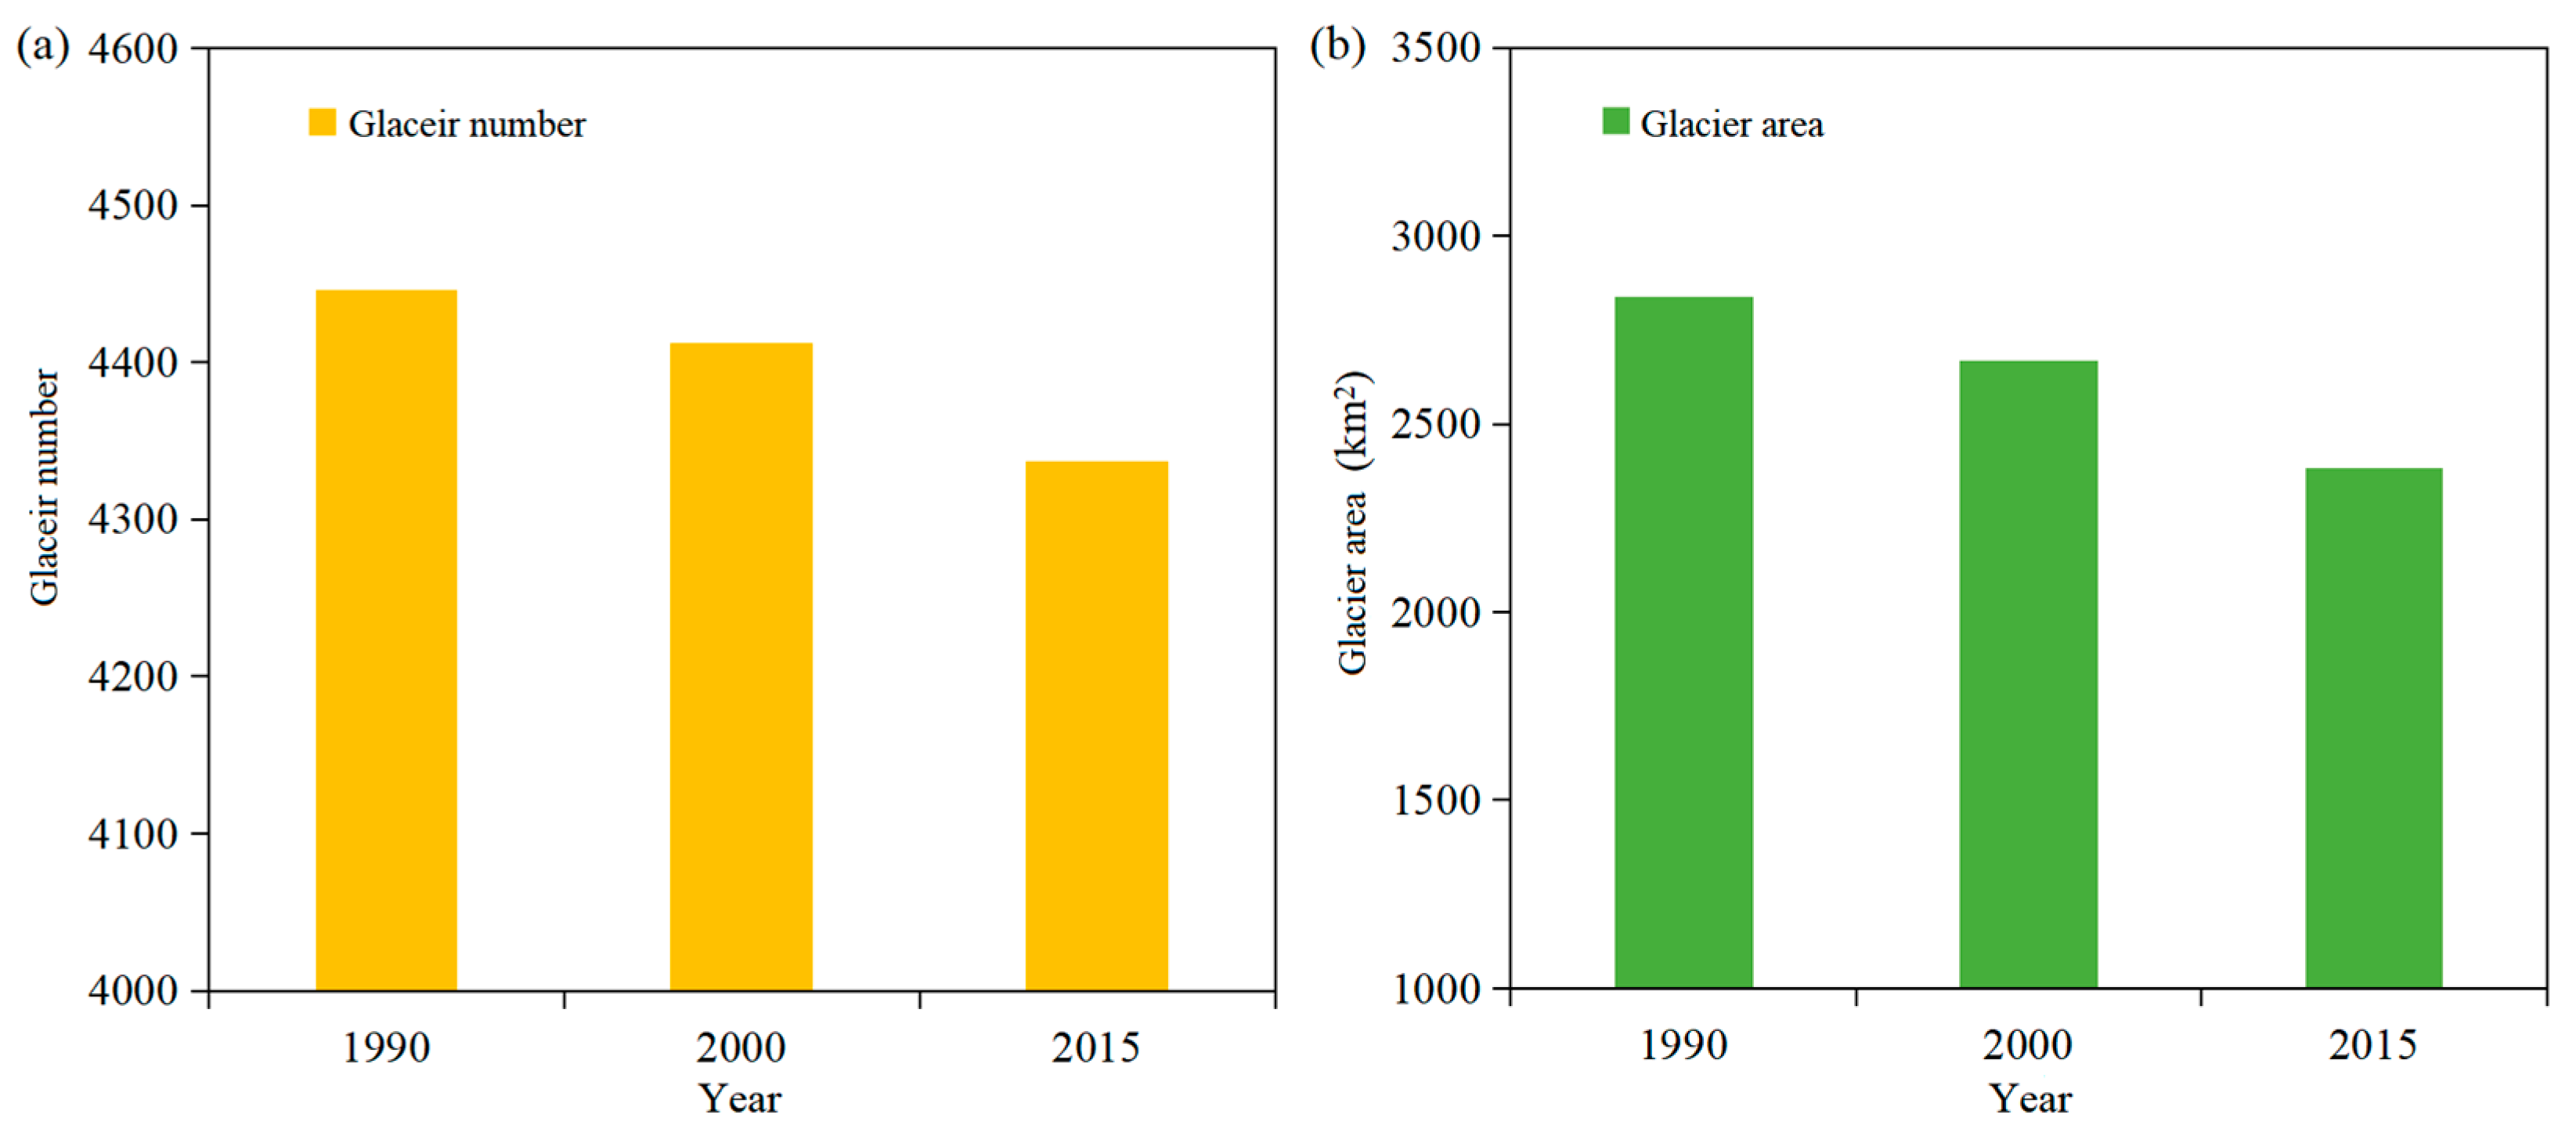
In 2015, 4336 glaciers were identified in the northern Tien Shan, covering a total area of 2382.51 km2, accounting for approximately 2.75% of the total area. These values decreased significantly between 1990 and 2015 (Figure 3). The total area decreased from 2838.94 to 2382.51 km2 from 1990 to 2015, a decrease of 456.43 km2 (16.08%). The total glacier number decreased from 4444 to 4336 and the total glacier volume by 26.14 km3. The glacier area in the northern Tien Shan decreased by 6.02% during the period 1990–2000 and by 10.70% from 2000 to 2015, confirming that the glacier recession in the northern Tien Shan has accelerated significantly in recent decades.
Figure 3.
Changes in glacier number (a) and area (b) in the northern Tien Shan during the period 1990–2015.
3.2. Spatio-Temporal Variations of Glacier
3.2.1. Spatial Variations of Glacier
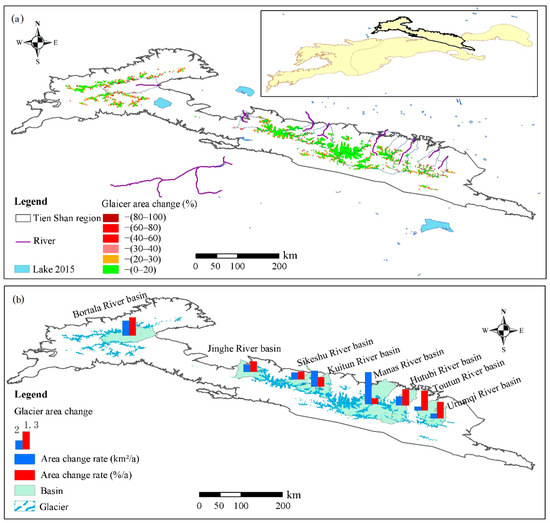
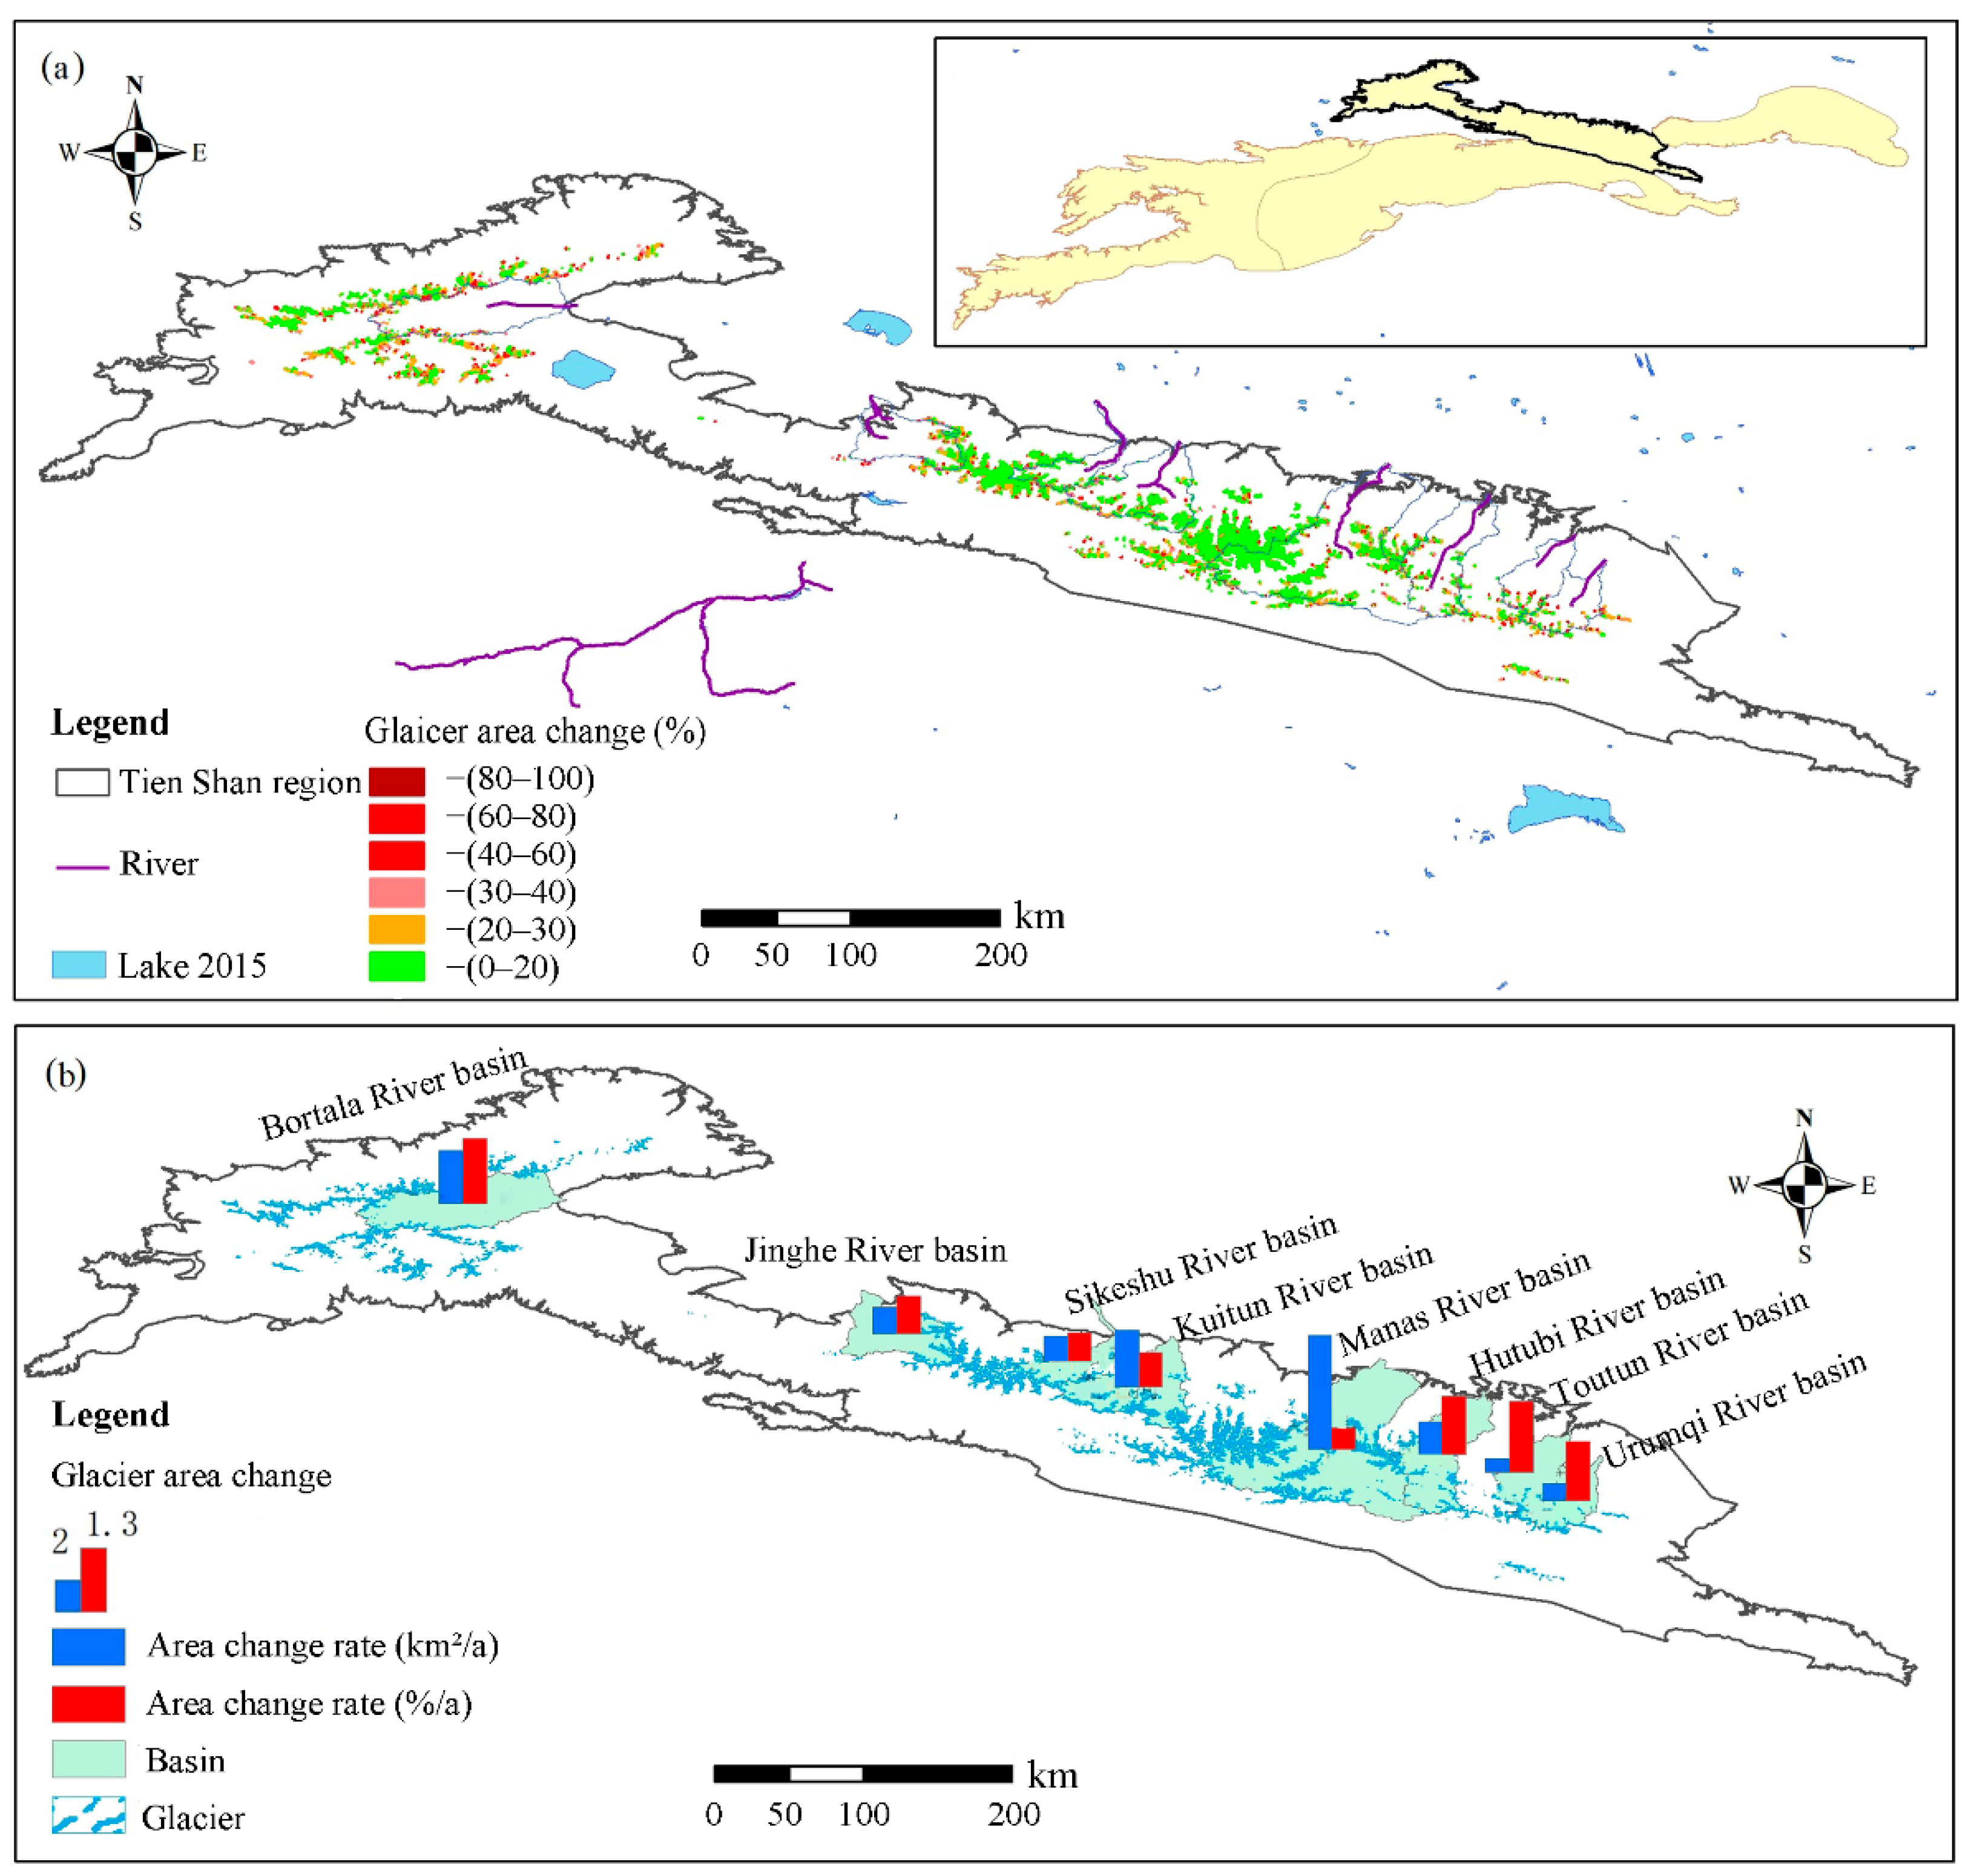
From 1990 to 2015, glaciers in the northern Tien Shan showed a negative retreat, but there were significant regional differences (Figure 4, Table 3). Spatially, the glacier area in the Manas River basin decreased the fastest, at a rate of 1.99 km2/a, followed by the Kuitun River basin (0.98 km2/a) and Bortala River basin (0.93 km2/a). The shrinkage rates of the glacier areas in the Hutubi, Jinghe, and Sikeshu River basins were 0.56, 0.46, and 0.42 km2/a, respectively. The glaciers in the Toutun and Urumqi River basins shrunk by 0.31 and 0.24 km2/a, respectively. It is worth noting that relatively small and low-altitude glaciers experienced more significant shrinkage from 1990 to 2015. For example, the glacier area in the Toutun River basin, which had the smallest glaciers (average glacier area of 0.16 km2), decreased by 1.25%/a. The glacier areas in the Urumqi and Hutubi River basins (average glacier areas 0.23 km2) decreased by 1.03%/a and 1.01%/a, respectively. The glacier area of the northwest region of the Bortala River basin (average glacier area of 0.47 km2) decreased by 1.14%/a. The glacier area in the Manas River basin (average glacier area of 0.63 km2) decreased by 0.38%/a. The glacier area in the Sikeshu River basin (average glacier area of 0.82 km2) decreased by 0.60%/a.
Figure 4.
Spatiotemporal changes in glacier areas in different zones across the northern Tien Shan from 1990 to 2015. (a) Spatial changes in glacier areas; (b) temporal changes in glacier areas.
Table 3.
Changes in glacier area in different basins in the northern Tien Shan from 1990 to 2015.
3.2.2. Variations of Glacier in Different Scales
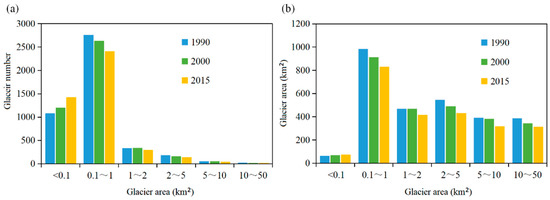
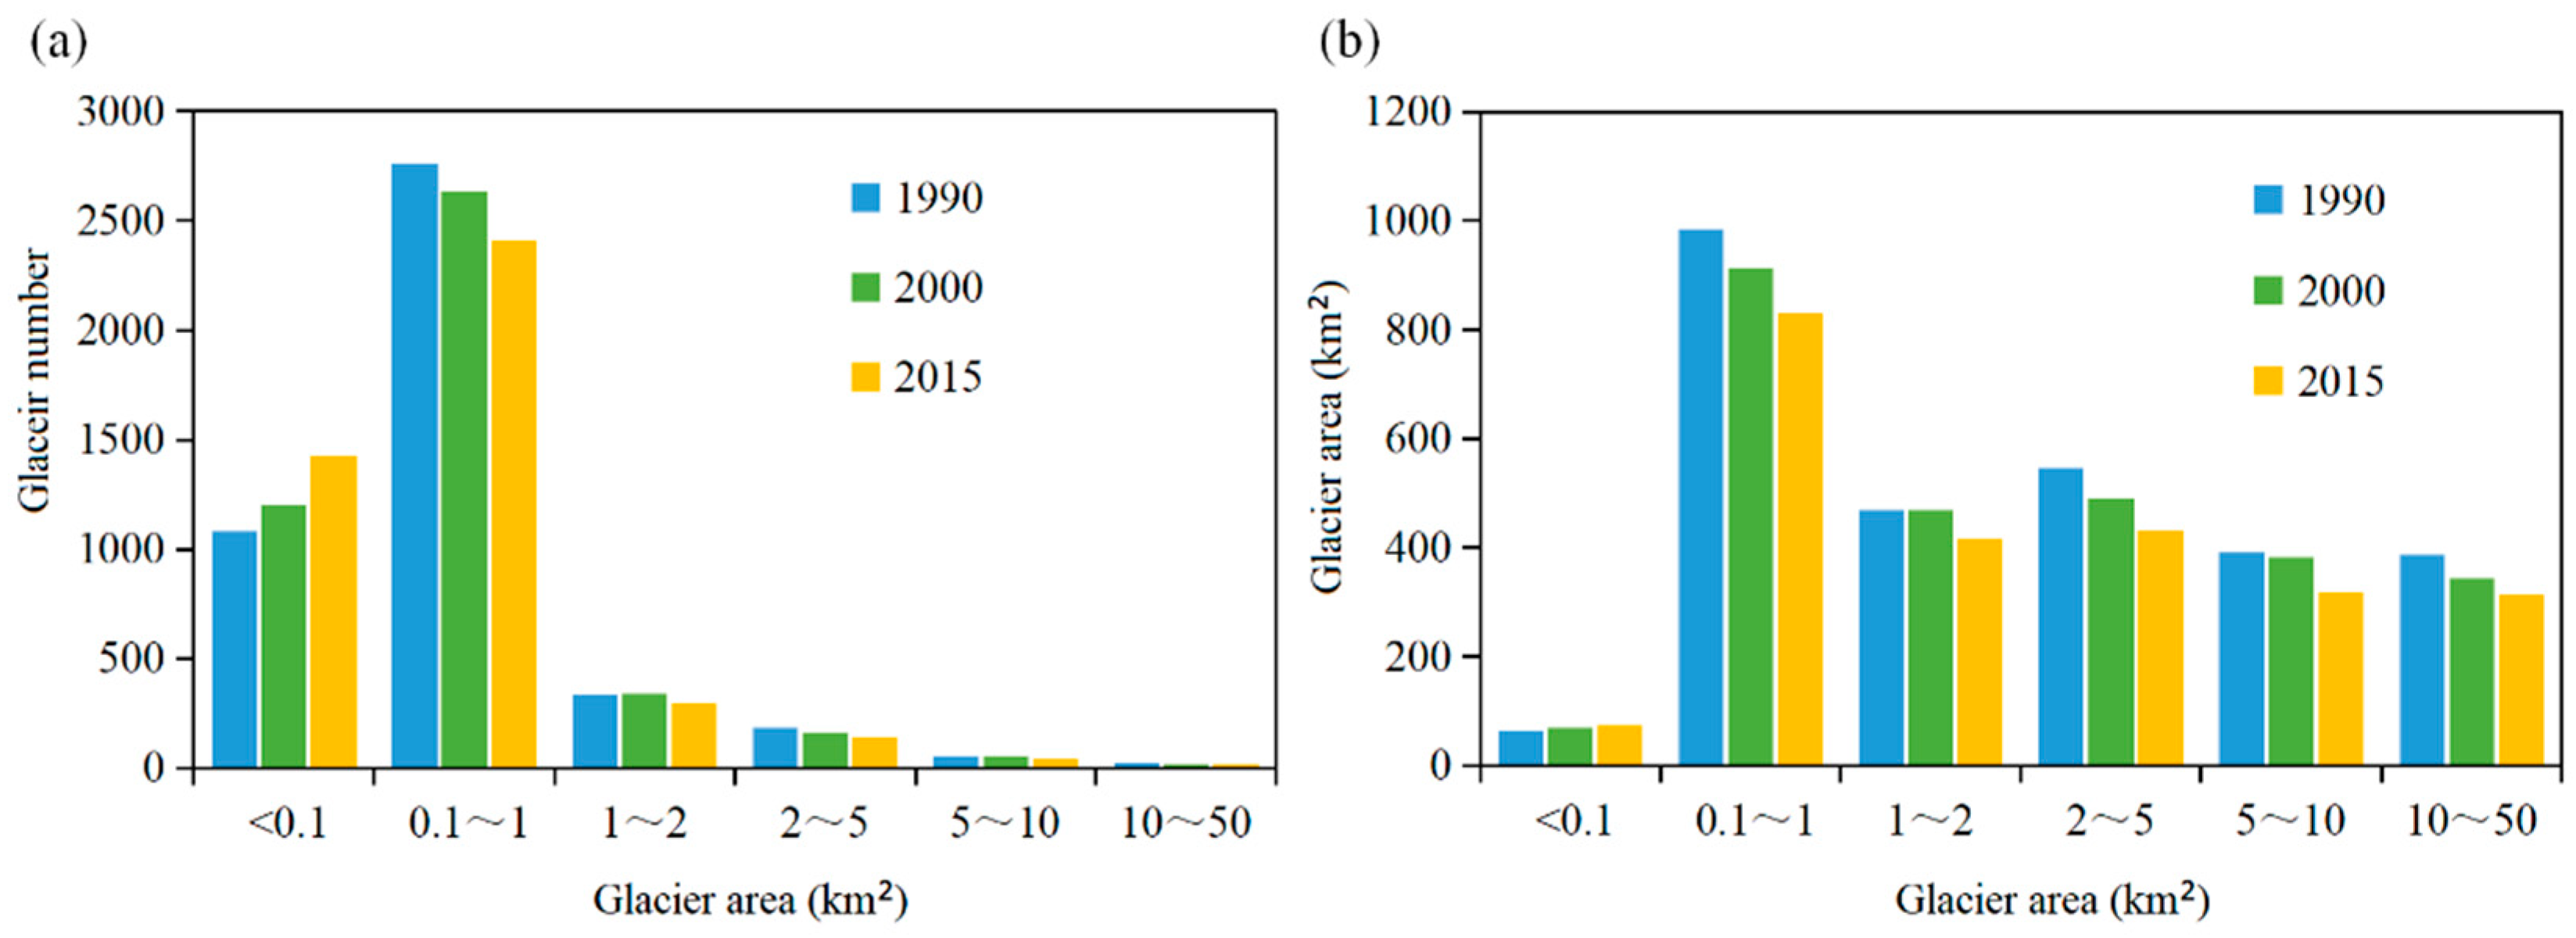
Glaciers in the northern Tien Shan are mainly small- and medium-sized (Figure 5), with an average single area of 0.55 km2. Among these, 88.40% had an area of <1 km2, accounting for only 37.94% of the total glacier area.
Figure 5.
Changes in glacier number (a) and area (b) in the northern Tien Shan from 1990 to 2015.
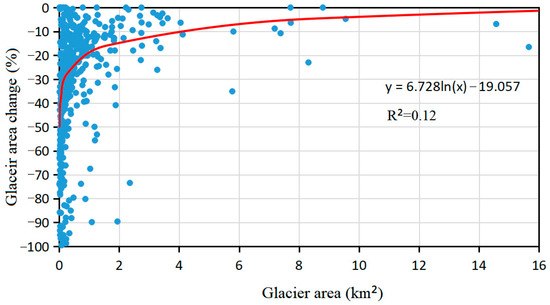
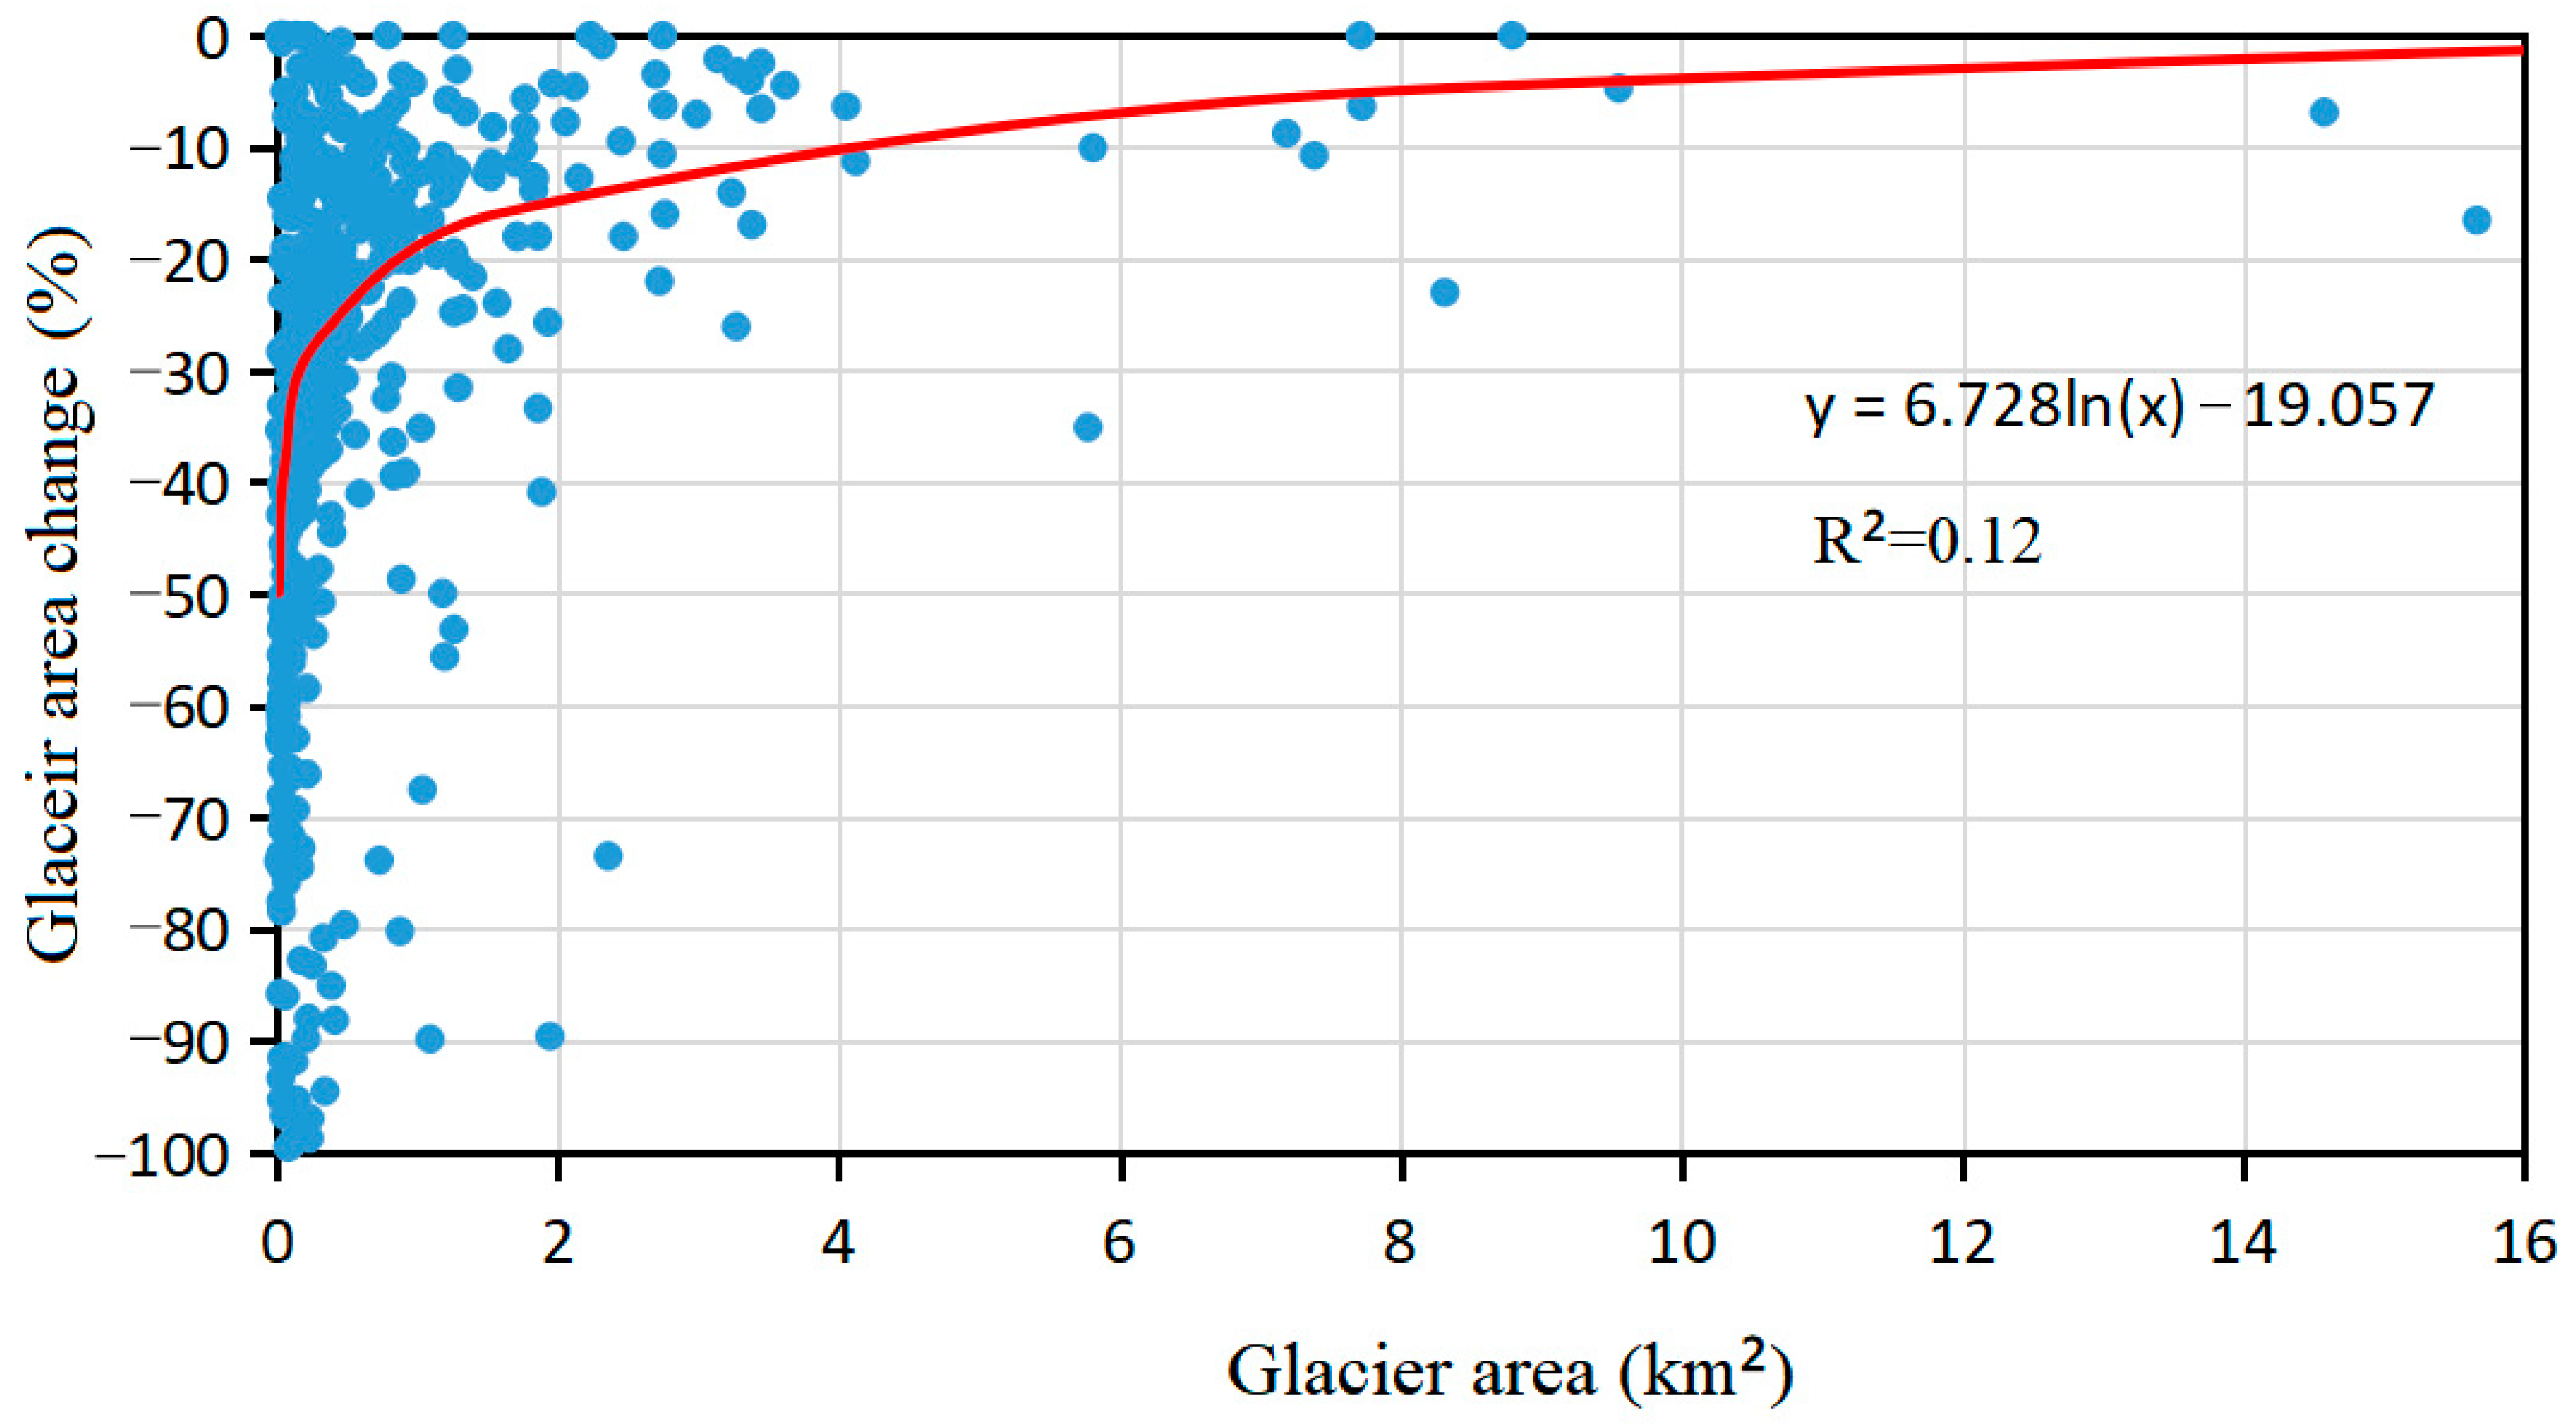
From 1990 to 2015, the total number and area of glaciers in the northern Tien Shan decreased, especially for smaller glaciers (Figure 6, Table 4). For example, the total number of glaciers with an area of 0.1–1 km2 decreased by about 12.71% from 1990 to 2015, with their area decreasing by 15.61%. During the same period, the total number and area of glaciers between 0.1–1 and 1–2 km2 decreased by 12.91% and 15.61%, respectively. In particular, the smaller glaciers showed higher shrinkage. However, the number of glaciers with an area of < 0.1 km2 increased by 32.07% from 1990 to 2015, with the total area increasing by 19.23%.
Figure 6.
Changes of glaciers with different scales in the northern Tien Shan during the period 1990–2015.
Table 4.
Changes in glacier area according to various glacier sizes of the northern Tien Shan from 1990 to 2015.
3.2.3. Glaceir Variations in Different Locations
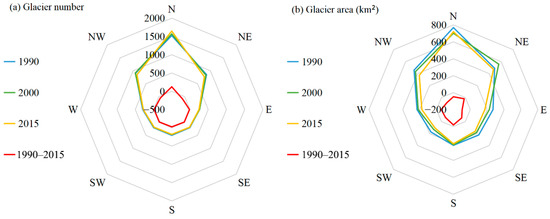
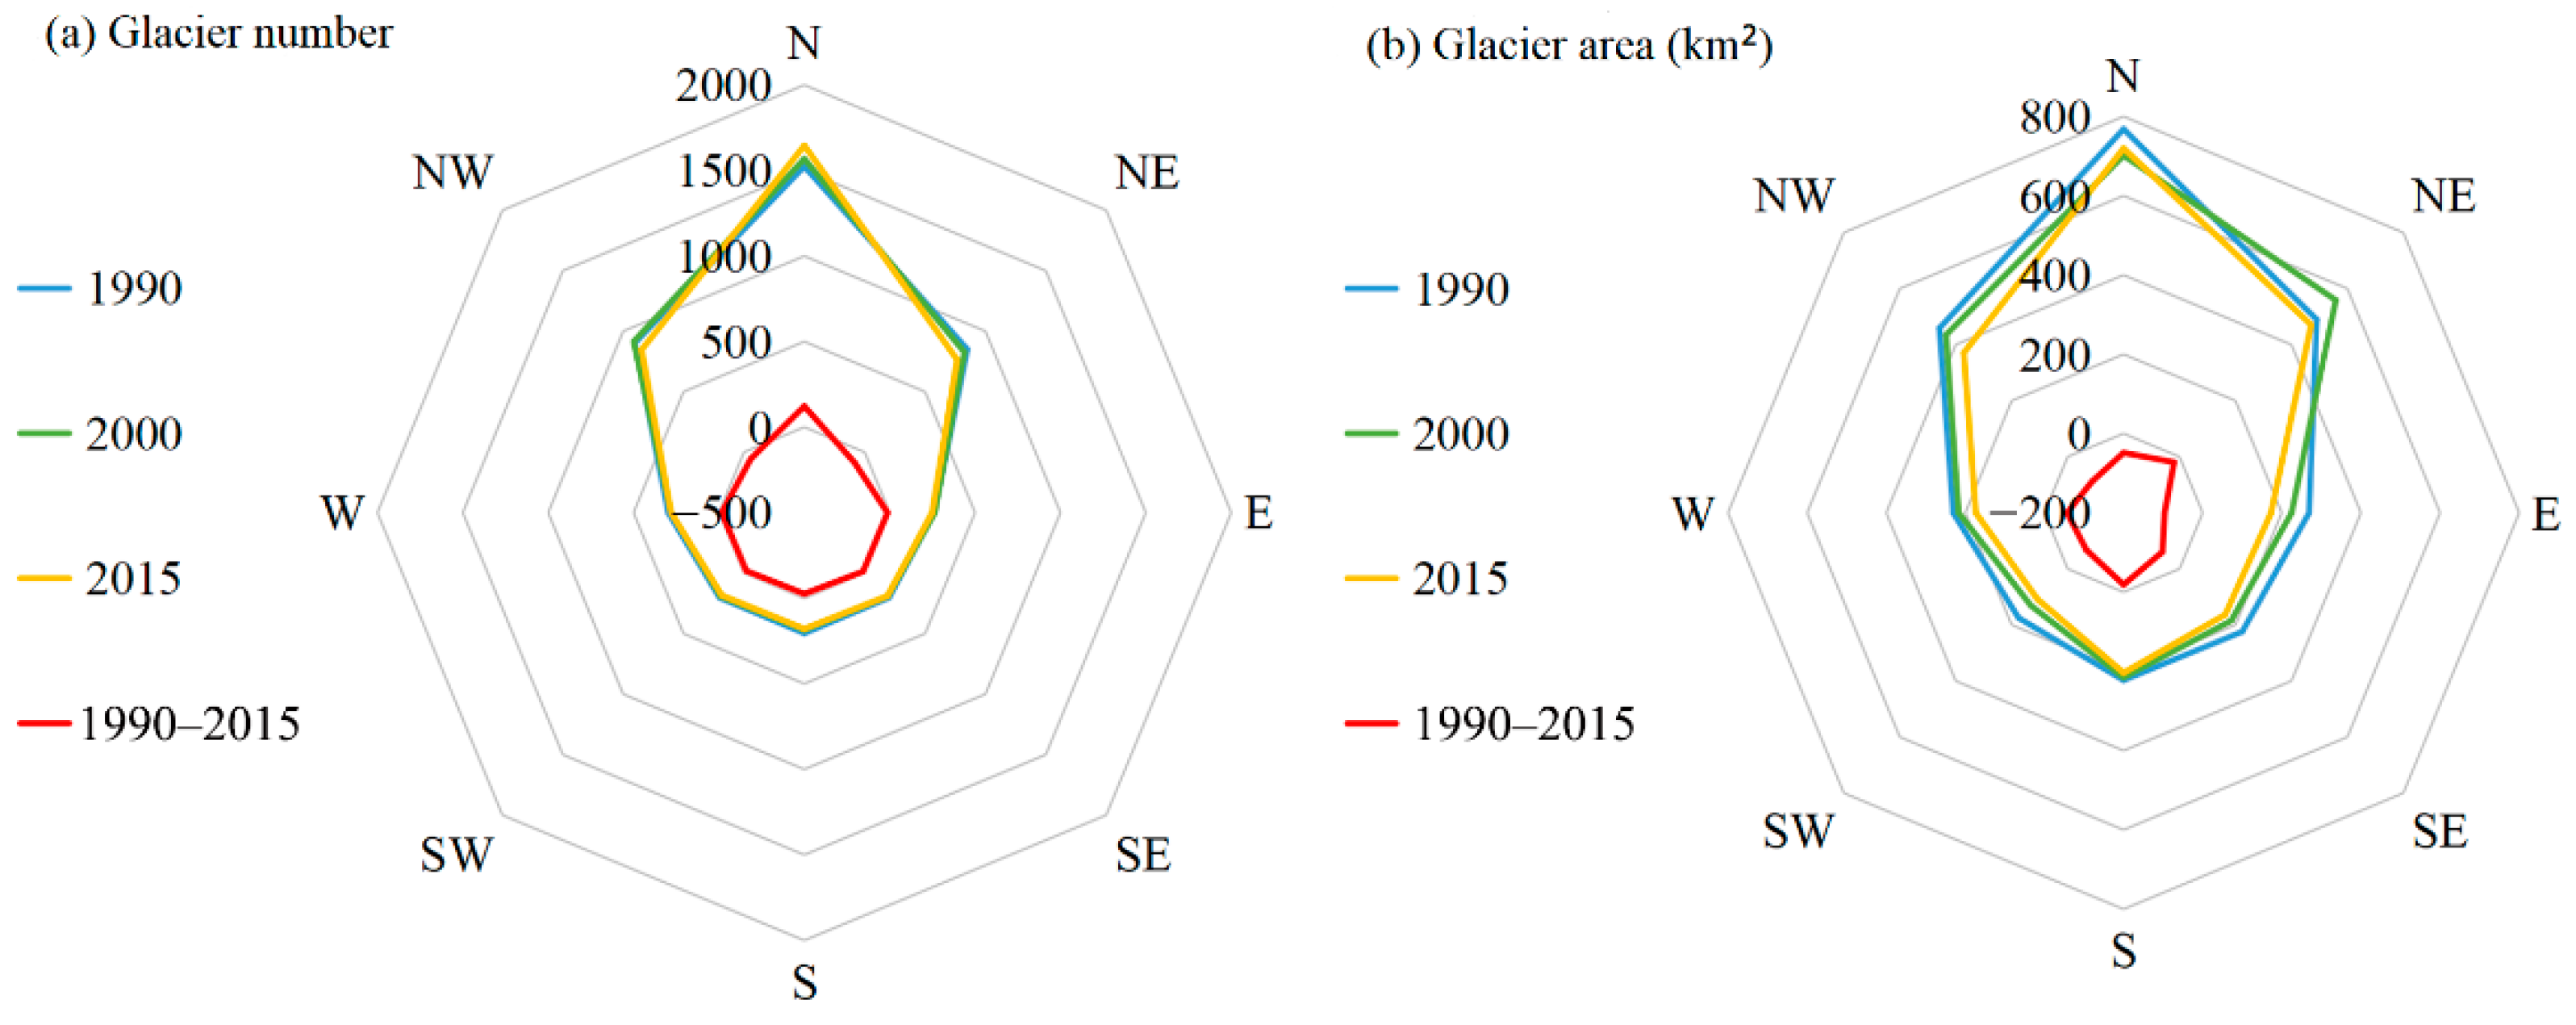
Glaciers in the northern Tien Shan are mainly found on the north, northwest and northeast locations (Figure 7), accounting for 75.1% and 64.70%, respectively, of the total number and area of glaciers in the northern Tien Shan, whereas the glaciers on the southeast and southwest aspects account for 8.56% and 11.38%, respectively. Since 1990, the glacier area in the aspects of the northern Tien Shan has decreased overall. The glacier area on the eastern location showed a notable decrease (96.24 km2), followed by the glacier areas on the northwest, southeast, and northern locations (87.61, 60.87, and 48.61 km2, respectively). Shrinkage was intense in the southwest, east, southeast, and west areas, with glacier areas decreasing by 38.37%, 35.79%, 27.16%, and 24.74%, respectively, from 1990 to 2015. However, the glaciers in the northeastern and northern locations showed the slowest recession, with the total area decreasing by only 3.99% and 6.33%, respectively, from 1990 to 2015.
Figure 7.
Distribution of glacier areas and their changes according to location in the northern Tien Shan from 1990 to 2015.
3.2.4. Variations in Glacier in Different Altitudes
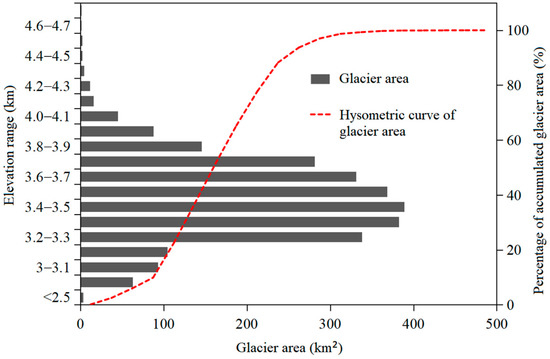
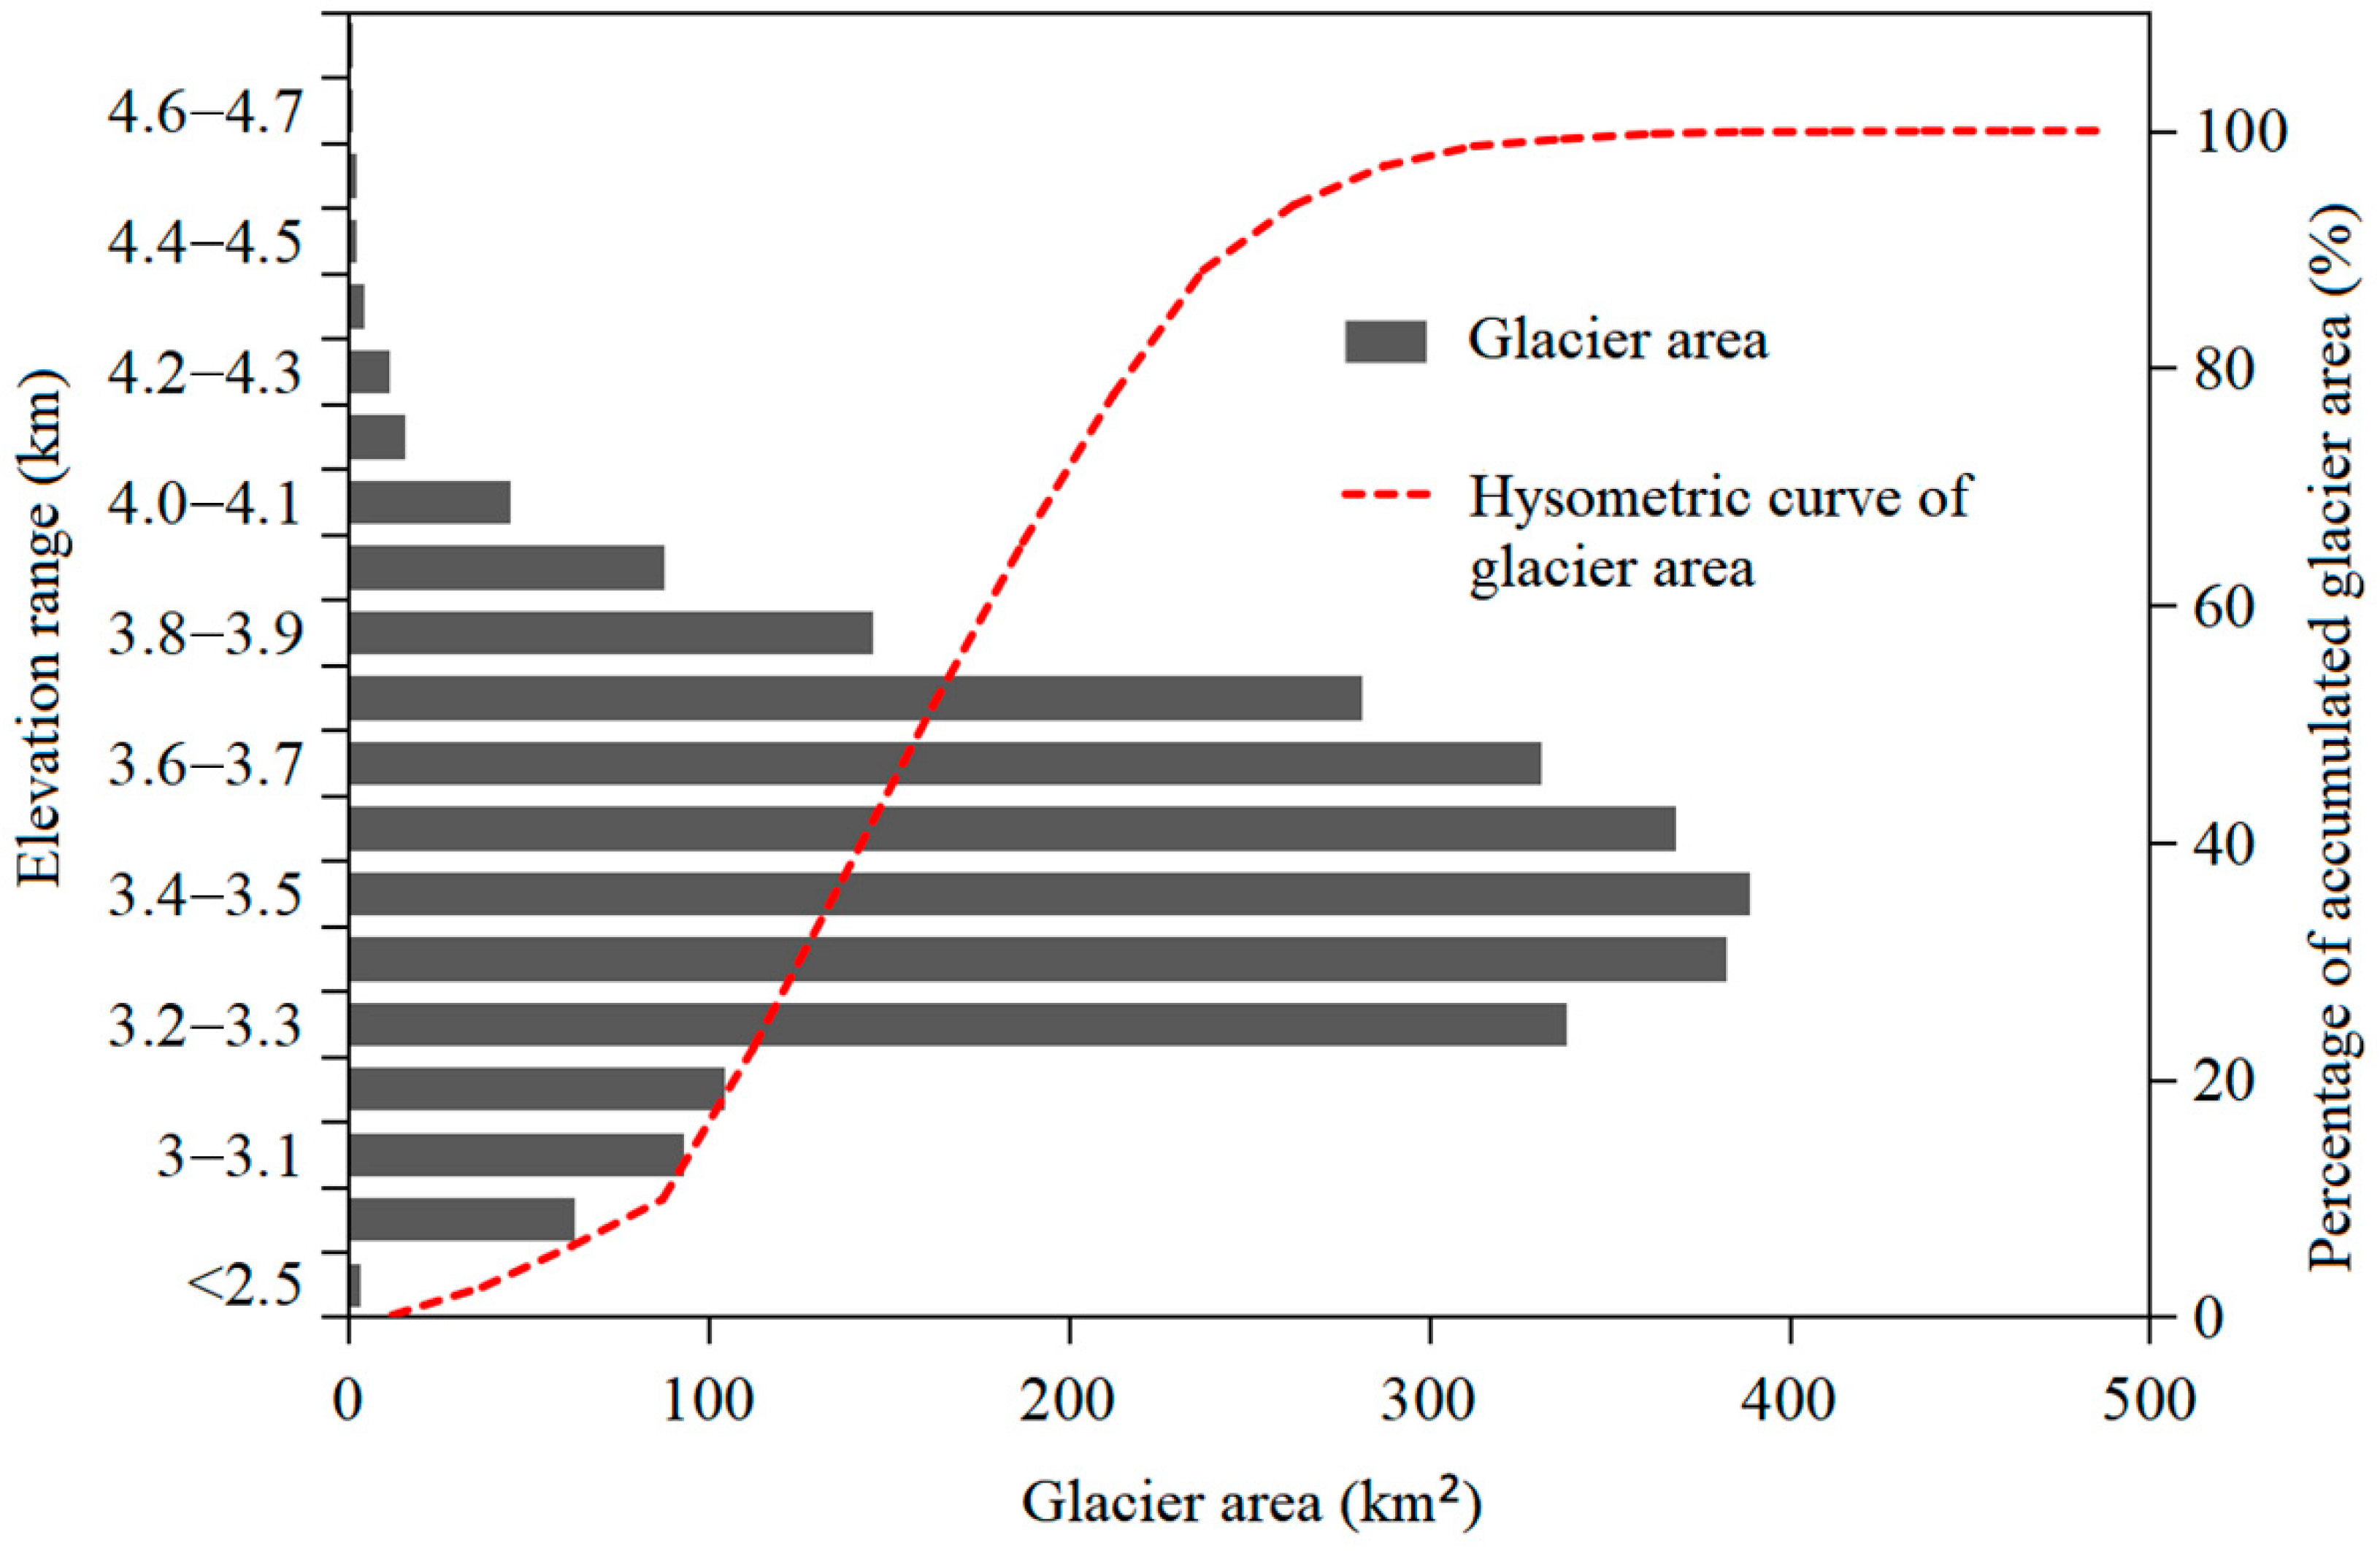
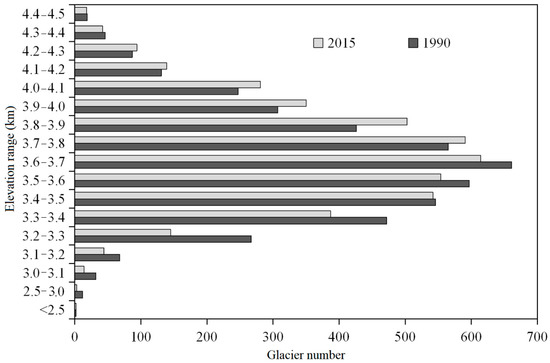
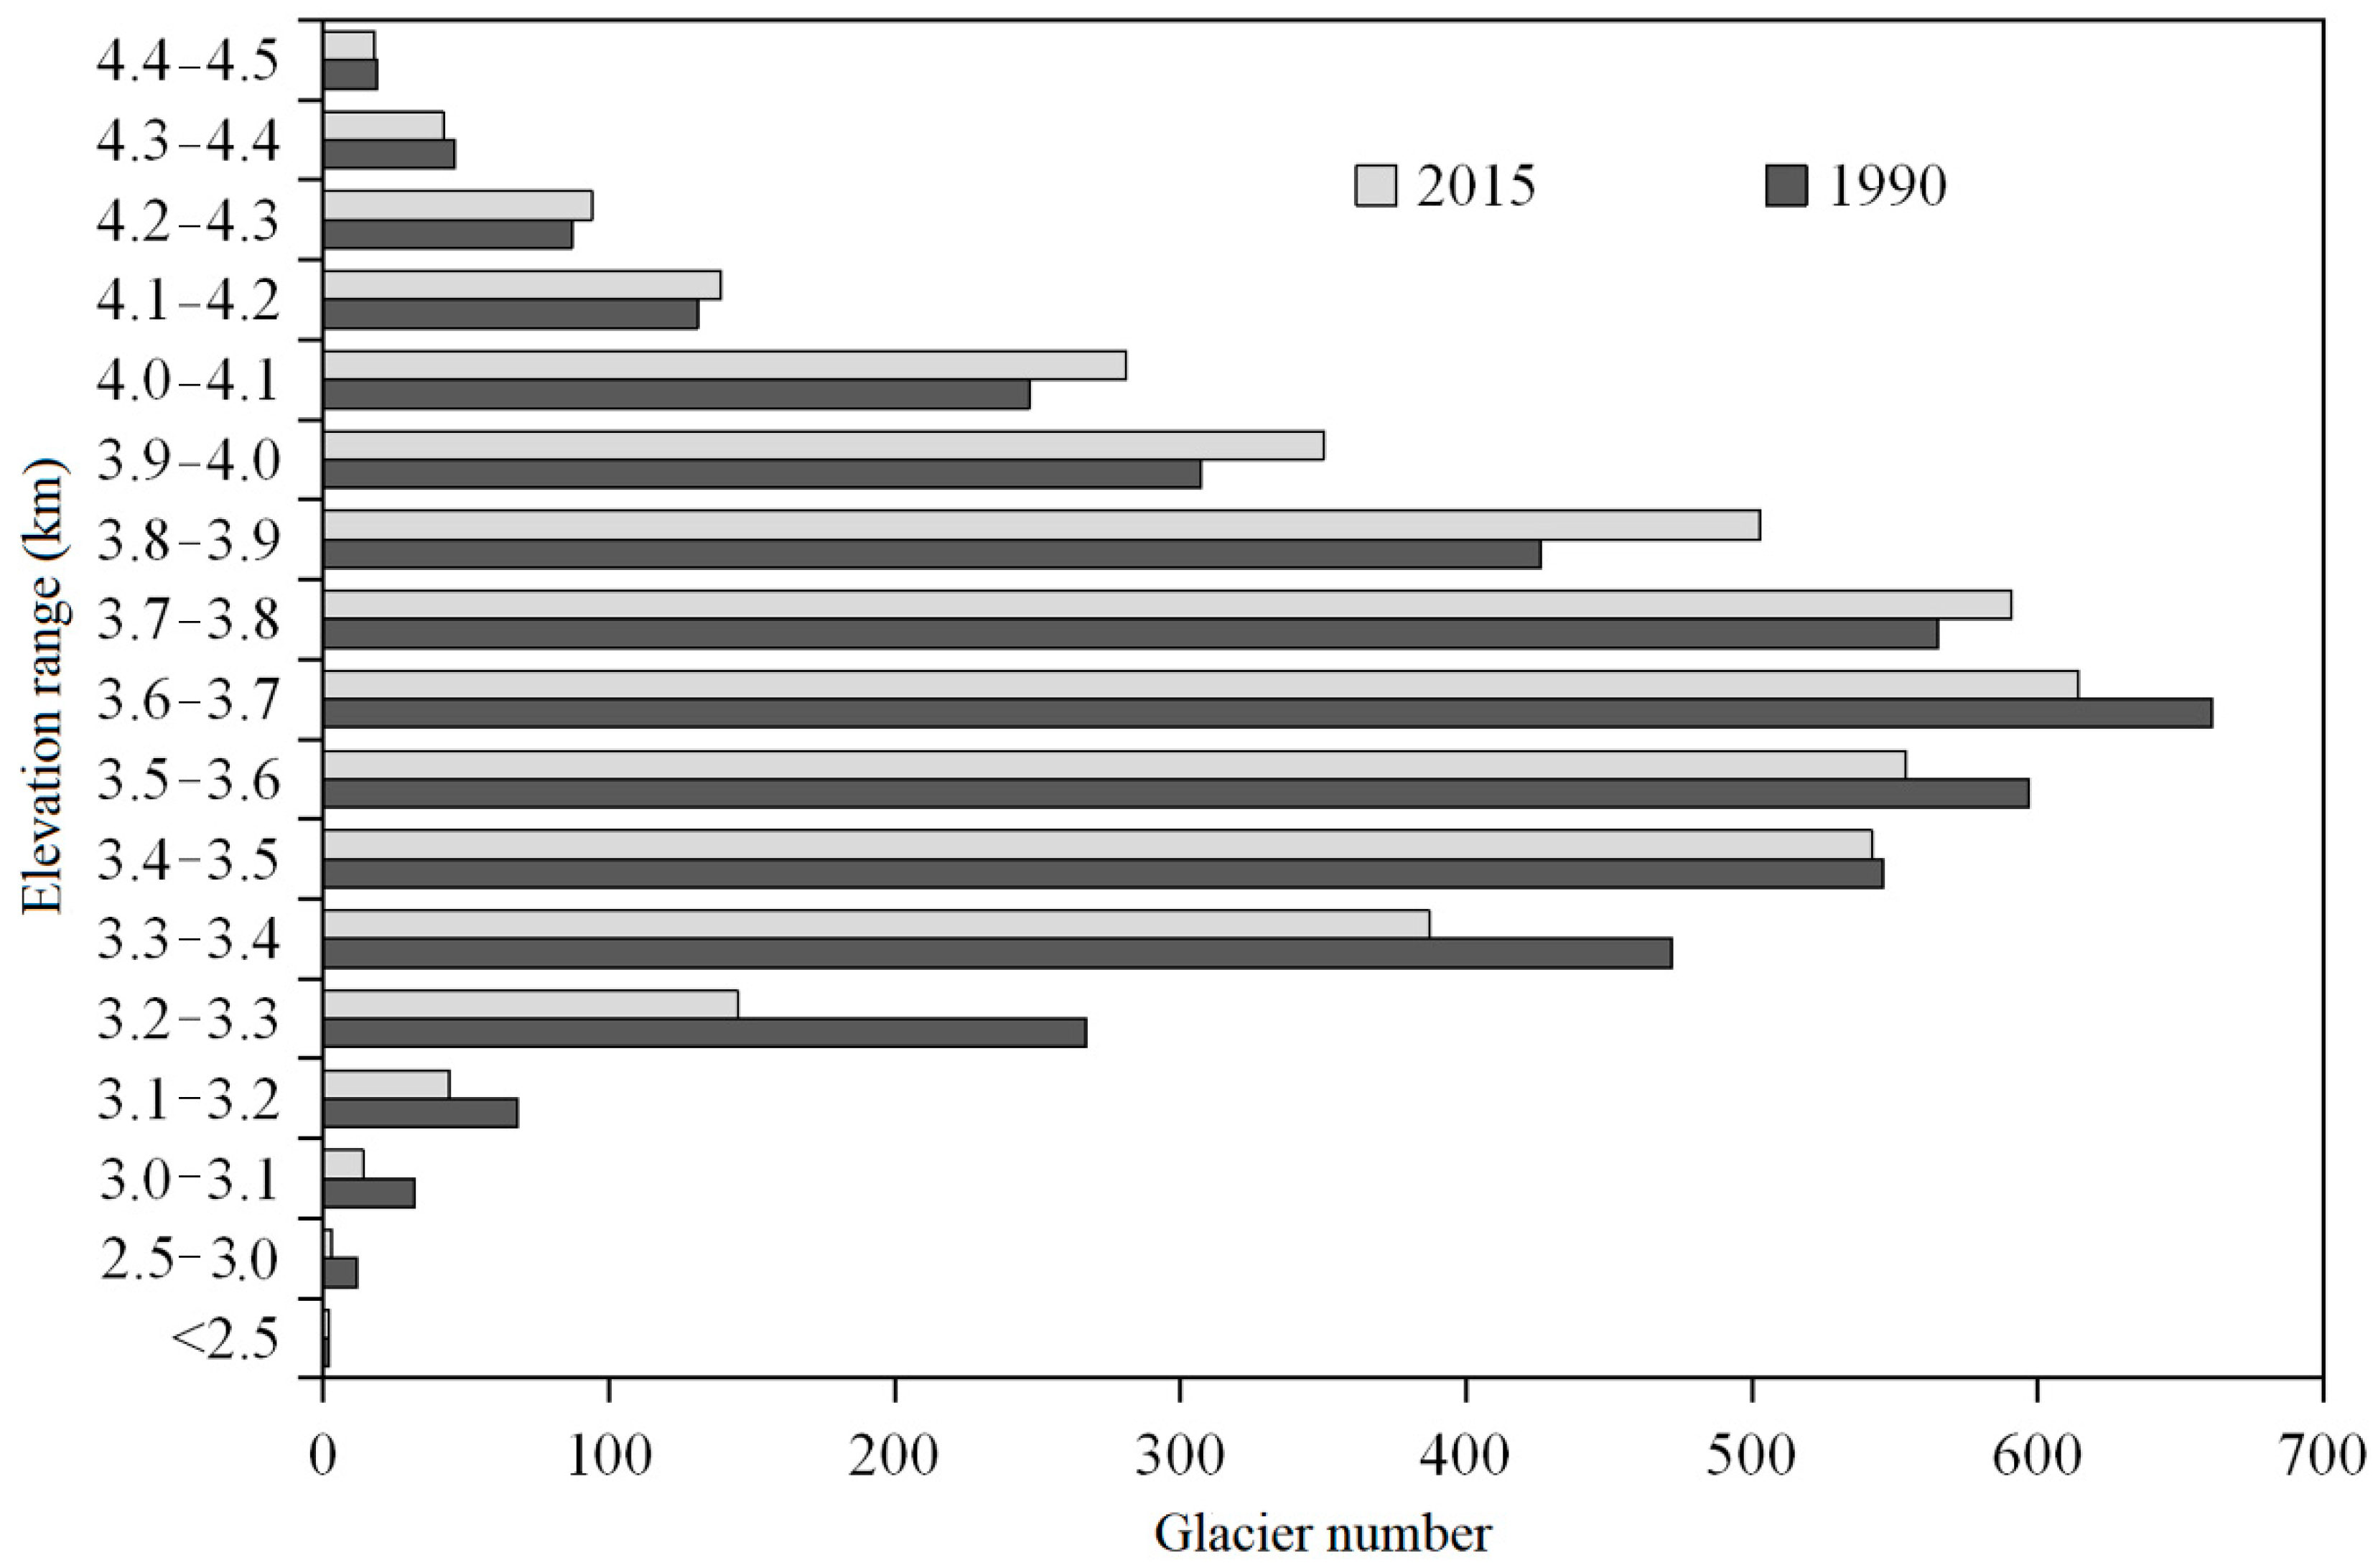
Glacier termini in the northern Tien Shan are mainly distributed between 3200 and 4100 m altitude (Figure 8): glaciers from 3200 to 3300, 3300 to 3400, 3400 to 3500, 3500 to 3600, 3600 to 3700, 3700 to 3800, 3800 to 3900, 3900 to 4000, and 4000 to 4100 m altitude account for 3.34%, 8.93%, 12.50%, 12.78%, 14.16%, 13.63%, 11.60%, 8.07%, and 6.48%, respectively, accounting for 91.49% of the total glaciers in the northern Tien Shan.
Figure 8.
Distribution of glacier area at different altitudes in the northern Tien Shan.
The total glacier number and area at different altitudes in the northern Tien Shan showed a negative trend from 1990 to 2015 (Figure 9), especially for glaciers below 3700 m. The lower the altitude, the higher the decrease in the total number and area of the glaciers. For example, the numbers of glaciers at altitudes of 2500–3000, 3100–3200, 3200–3300, 3300–3400, 3400–3500, and 3500–3600 m decreased by 75%, 56.25%, 35.29%, 45.69%, 18.01%, and 0.73%, respectively, from 1990 to 2015, with a total area decrease of 30.37%. In contrast, the number of glaciers above 3700 m increased from 1990 to 2015: the numbers at altitudes of 3700–3800, 3800–3900, 3900–3000, and 4000–4100 m increased by 4.6%, 18.08%, 14.01%, and 13.77%, respectively. As glaciers continue to retreat in response to climate change, their termini have risen, increasing the total number of glaciers with altitudes above 3700 m.
Figure 9.
Glacier numbers at different altitudes in 1990 and 2015.
With climate warming in the northern Tien Shan in recent years, the altitude of glacier terminals in the northern Tien Shan has continuously increased from 1990 to 2015. The average altitude of the glacier terminal increased from 3656 m in 1990 to 3664 m in 2000 and then to 3693 m in 2015. The average altitude of the glacier terminal increased by approximately 37 m between 1990 and 2015. Since 1990, changes in the number and area of glaciers at different elevations in the northern Tien Shan have shown that the height of the glacier mass balance line in the northern Tien Shan increases with increasing glacier termini, and glaciers at lower altitudes showed notable retreat under a warming climate.
4. Discussion
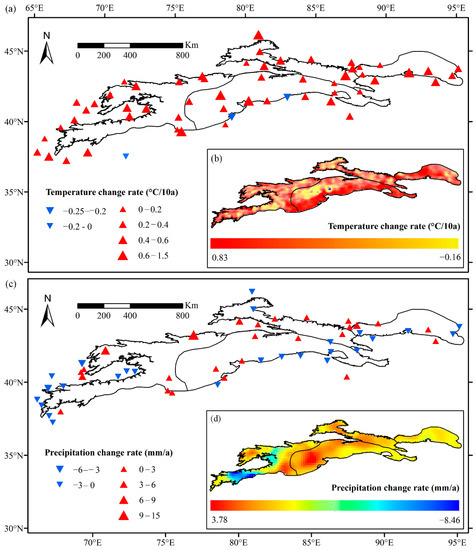
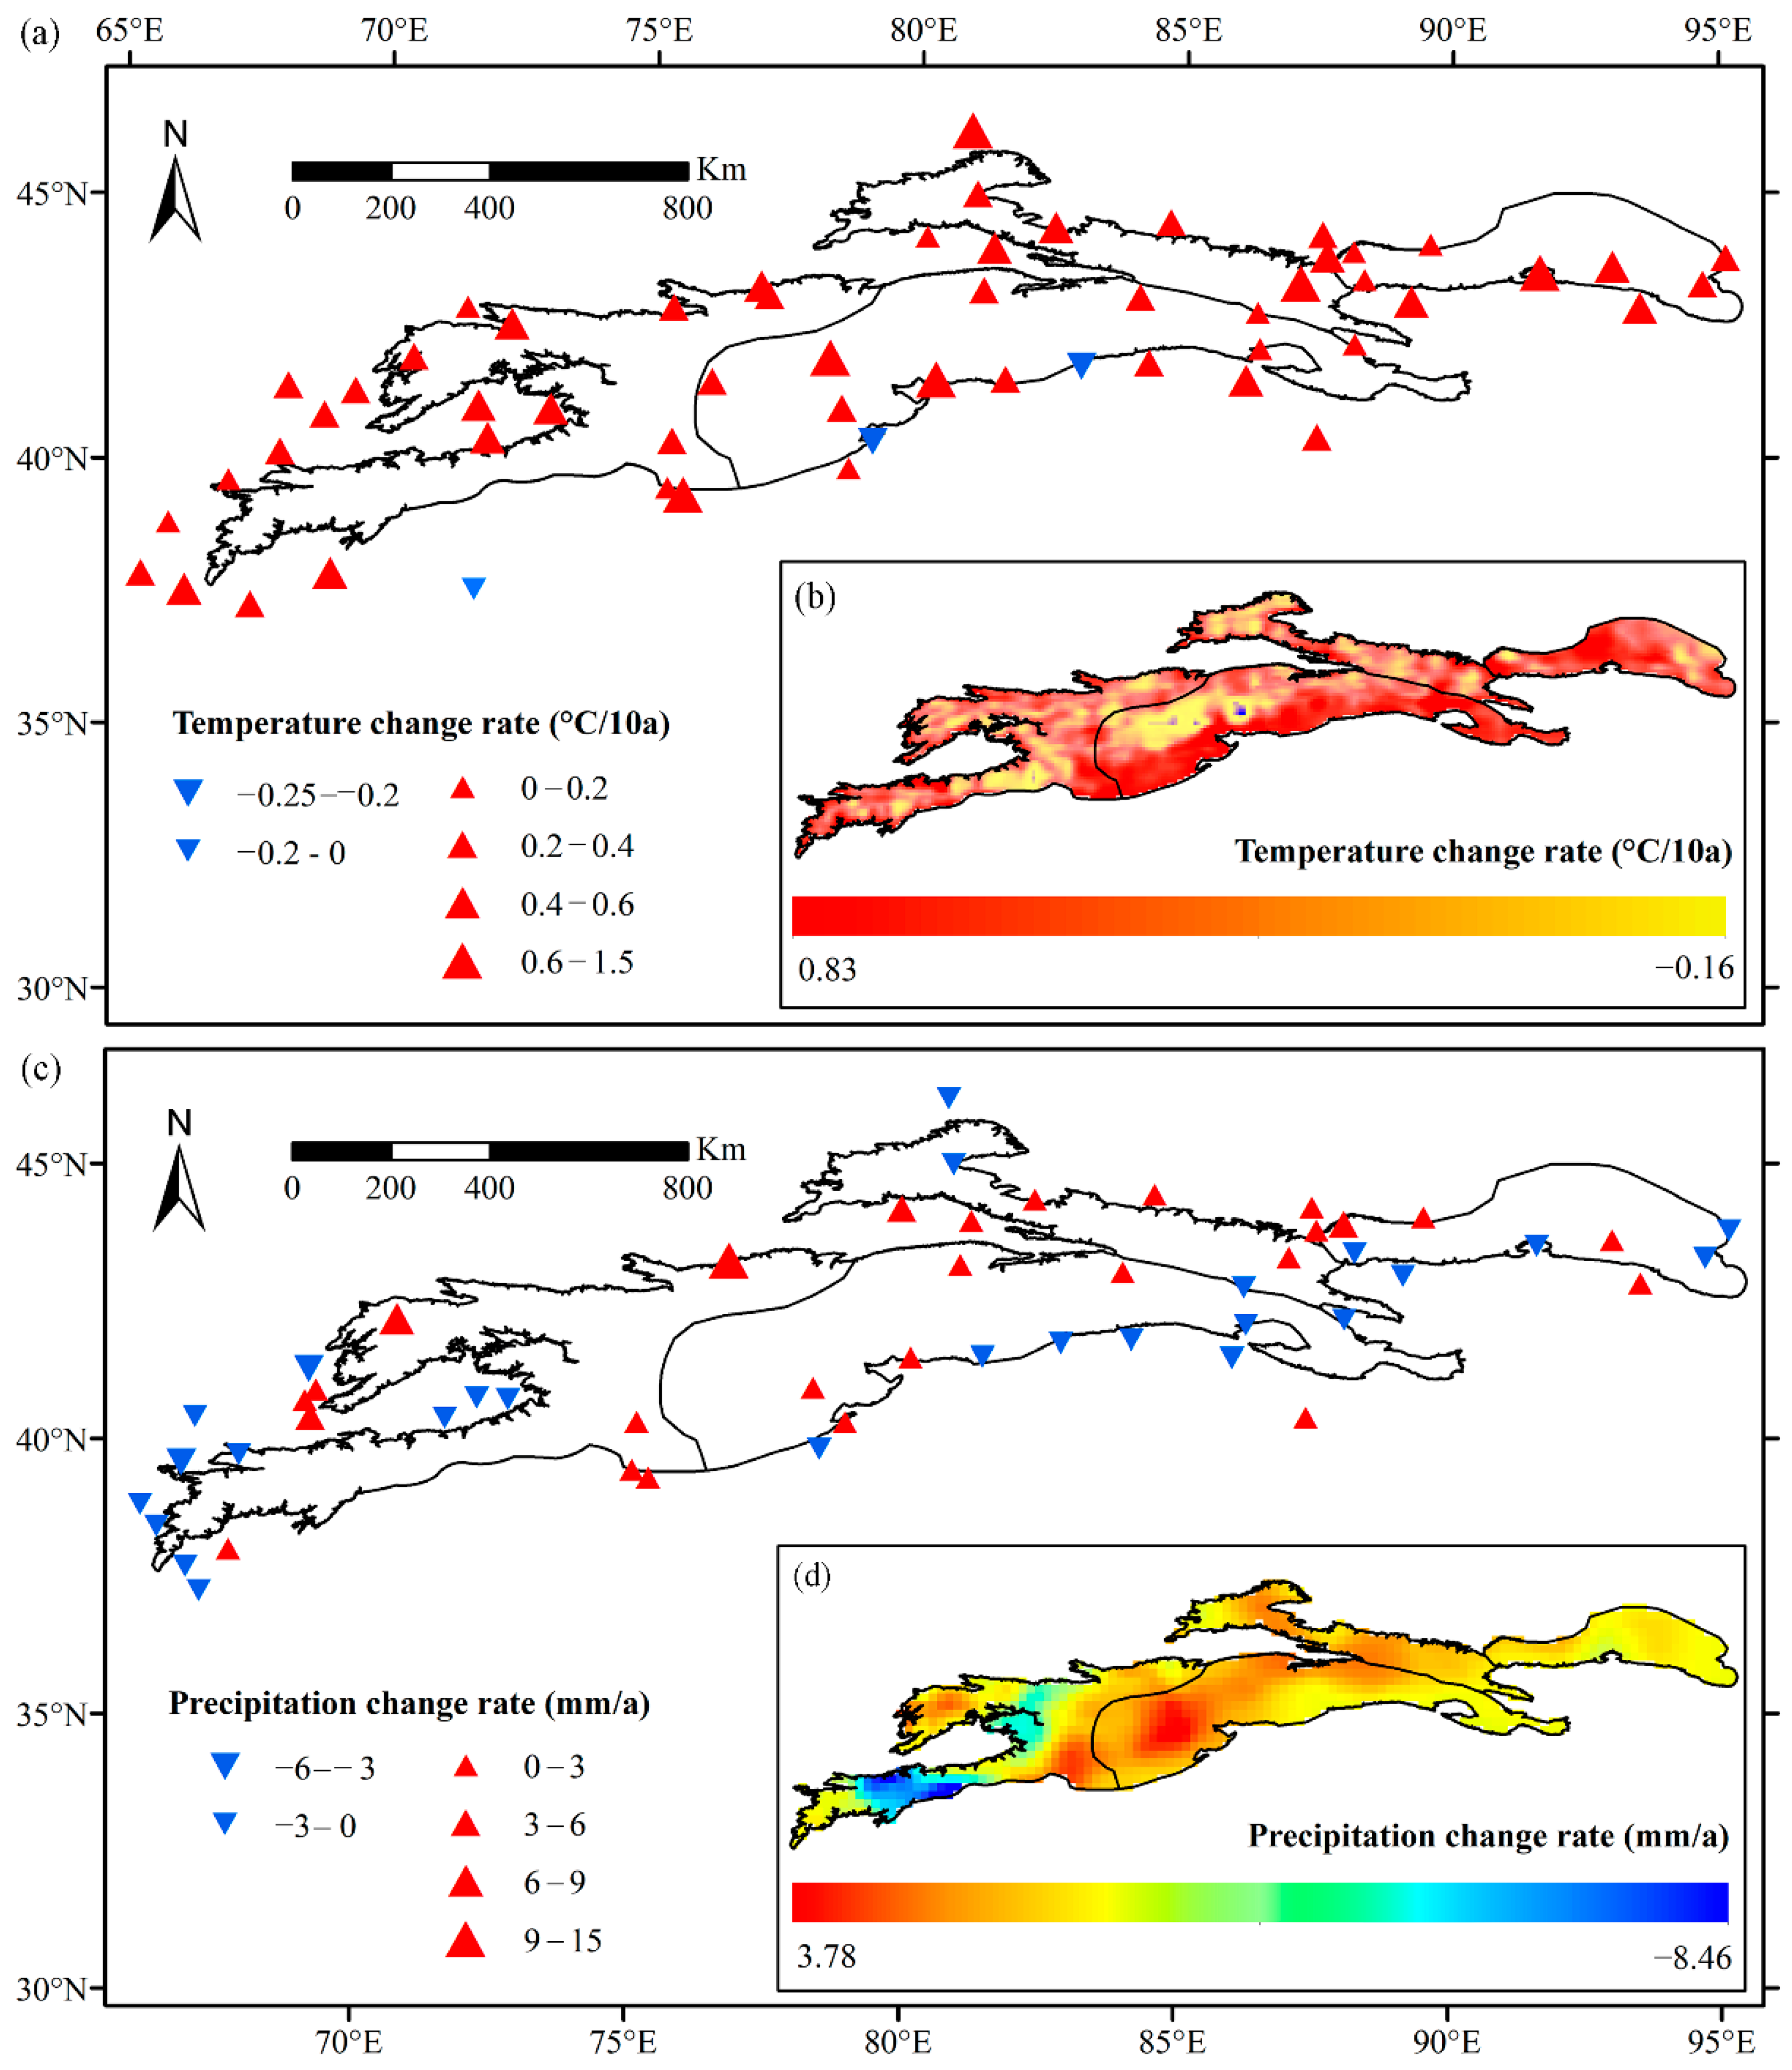
The accumulation and ablation of glaciers are controlled by climate change [5,55,56]. Projections of future trends in the cryosphere under global warming suggest that glaciers, sea ice, snow cover, and permafrost will continue to shrink worldwide in the 21st century [57,58]. The temperature in the Tien Shan has oscillated at a high level since 1998 [28], with a warming rate of 0.30 °C/10a [8], which is significantly higher than the global and northern hemisphere averages in the same period [25,58,59]. All temperatures at the meteorological stations of the northern Tien Shan showed increasing trends (Figure 10), especially in the outer lower ranges, for example, in the Urumqi River Basin. The annual temperature at the Daxigou meteorological station (3539 m) increased by 0.55 °C/10a and 0.62 °C/10 during the summer. The annual precipitation at this station increased by 1.68 mm/10a from 1990 to 2015, whereas the precipitation during summer showed a negative trend of −1.34 mm/10a. It is clear that the warming climate has contributed to the rapid shrinkage of the glacier areas in the northern Tien Shan.
Figure 10.
Variations in annual temperature and precipitation in the Tien Shan from 1990 to 2015. (a) Variations in temperature from the meteorological stations and (b) ERA5 data set; (c) variations in precipitation from the meteorological stations and (d) GPCC data set.
Over the past half-century, glaciers in the Tien Shan of Central Asia have generally retreated. The glaciers in the eastern Tien Shan decreased at a rate of 0.05–0.35%/a [35,60], and the glaciers in the western Tien Shan decreased by 0.4%/a [8]. The glacier area in the northern Tien Shan reduced by 0.73–0.76%/a from 1955 to 2000 [38,61]; glaciers in the Ebinur Lake decreased by 0.4%/a [62], and those in the Karatal River basin decreased by 0.86%/a from 1956 to 2001 [32]. The retreat rate in the central Tien Shan was 0.63%/a [63]. There are clear spatial differences in the rate of glacier recession in the Tien Shan and the recession rate of glacier volume and area in the entire Tien Shan increased from east to west [13,32,35]. Chen et al. [8] conducted a study on glacier changes in the Tien Shan from the 1960s to 2010 and found that glaciers in the middle and western Tien Shan decreased by 15–20%, which was much higher than those in the Bogda Peak range in the eastern Tien Shan (3.1%). Narama et al. [38,61] detected glacier changes in the entire Tien Shan from 1970 to 2007 using Corona, Landsat, and ALOS satellite data and found that the glaciers in the western and northern Tien Shan underwent significant retreat [63], especially in the northern Tien Shan, with the area decreasing by 0.76–0.54%/a. Glaciers in northern Zailiyskiy Alatau and the Karatal basin, the northern Tien Shan, decreased by 0.8–1%/a over the past half-century [32,38].
According to the observation data of 20 glaciers in Tien Shan, Savoskul et al. [64] found that glaciers in the outer Tien Shan region shrank by 50–90% compared with the area at end of the Little Ice Age, whereas those in the inner Tien Shan only shrank by 3–7%. Sorg et al. [35] found that glaciers in the outer Tien Shan have retreated at a rate of 0.38–0.76%/a from the middle of the 20th century, while those in the inner Tien Shan decreased by 0.15–0.40%/a during the same period. Glaciers in the inner Tien Shan are mainly continental cold glaciers, with large scales in some areas; they are less sensitive to climate change and show relatively slower glacier recession [5,35,63]. Glaciers in the low-altitude area outside Tien Shan, which has a dense population, are more sensitive to climate change and generally retreat more rapidly. Glaciers in the outer Tien Shan region at lower altitudes are also sensitive to climate change and generally show a rapid recession [32,35].
With an increasing temperature and the intensified frequency of extreme climate events in the Tien Shan region, the snow line in the mountains increased significantly, glacier retreat accelerated, ice and snow melt increased and the water cycle changed. Under a warming climate, precipitation in the Tien Shan shifted from snow to rain, with the snowfall fraction showing a negative trend of −0.5%/decade since the mid-1990s [26]. The snow end day and snow cover duration across the Tien Shan region experienced a significant decrease from 1979 to 2016 [40]. Recent river runoffs fed by glaciers and snow have generally experienced positive trends [20,65], which have expanded glacial lakes and accelerated the occurrence of outburst lakes [2,15,21,53]. For rivers dominated by snow meltwater, changes in the snowmelt period affects the distribution of annual and inter-annual water resources [5,19]. The response of hydrological processes to climate change warming shown that the spring maximum runoff time has increased [65], accompanied by a significant rise in snowmelt runoff, and the snowmelt recharge runoff decreased in summer [66]. However, these rivers, which are predominantly recharged by glacial meltwater have shown a noticeable increasing trend in summer [67,68], accompanied by the increased annual runoff and flood hazards [69,70]. Glaciers in the Hindu-Kush Karakoram Himalaya region shown a strong response to global warming in recent years, contributing 1% to sea-level rise [71]. In addition, the higher the proportion of glaciers, the greater the increase in runoff. For example, the runoff in the large Naryn basin with 12.4% glacier area from April to September increased by 23%, whereas the runoff in the small Naryn Basin with 10% glacier area only increased by 0.1% [23]. Present river runoff was in a high fluctuation state, and some river’ runoff reached its tipping point for glacier melting [22,23]. Glacial lakes are rapidly growing in response to climate change and glacier retreat, Wang et al. [21] found that the expanded glacial lakes in the northern Tien Shan and eastern Tien Shan contributed to approximately half the expansion of glacial lakes in the Tien Shan region.
The IPCC fifth report projected that the future climate will continue to increase under the global coupling model [30,58,59]. Climate change has an important impact on many natural systems, especially in arid areas that are sensitive to climate change and human activities [6,72]. The IPCC Sixth Assessment Report (AR6) indicated that human-induced climate change has already affected many weather and climate extremes worldwide. Continued global warming is projected to further intensify the global water cycle, and many changes in the ocean, ice sheets and global sea level will be irreversible for centuries to millennia [73]. In the context of global warming, the glaciers in the polar ice caps, and mountain glaciers showed great reduction, resulting in rising sea levels and increasing runoff of rivers dominated by mountain ice and snow melt water [18,67,74]. Projections of future trends in the cryosphere suggest that glaciers, sea ice, snow, and permafrost will continue to shrink worldwide until the end of the 21st century [57,58]. Glaciers in the Hindu-Kush Karakoram Himalaya region have shown a strong response to global warming in recent years, contributing 1% to sea-level rise [71]. By using NASA’s NEX-GDDP daily downscaled dataset under RCP4.5 and RCP8.5 emission scenarios, the projected snowfall amount will decrease by 18.9% and 32.8%, with snowfall days decreasing by 29.6% and 47.3%, and the precipitation falling as snow decreased by 26.7% and 42.3%, respectively [75].
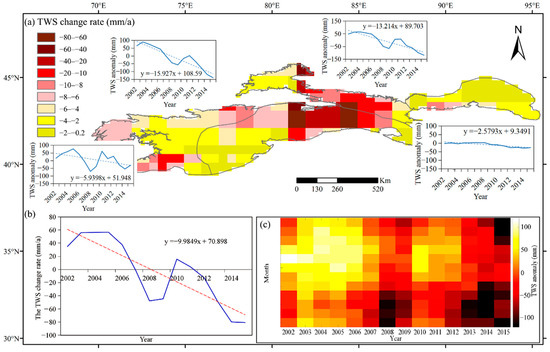
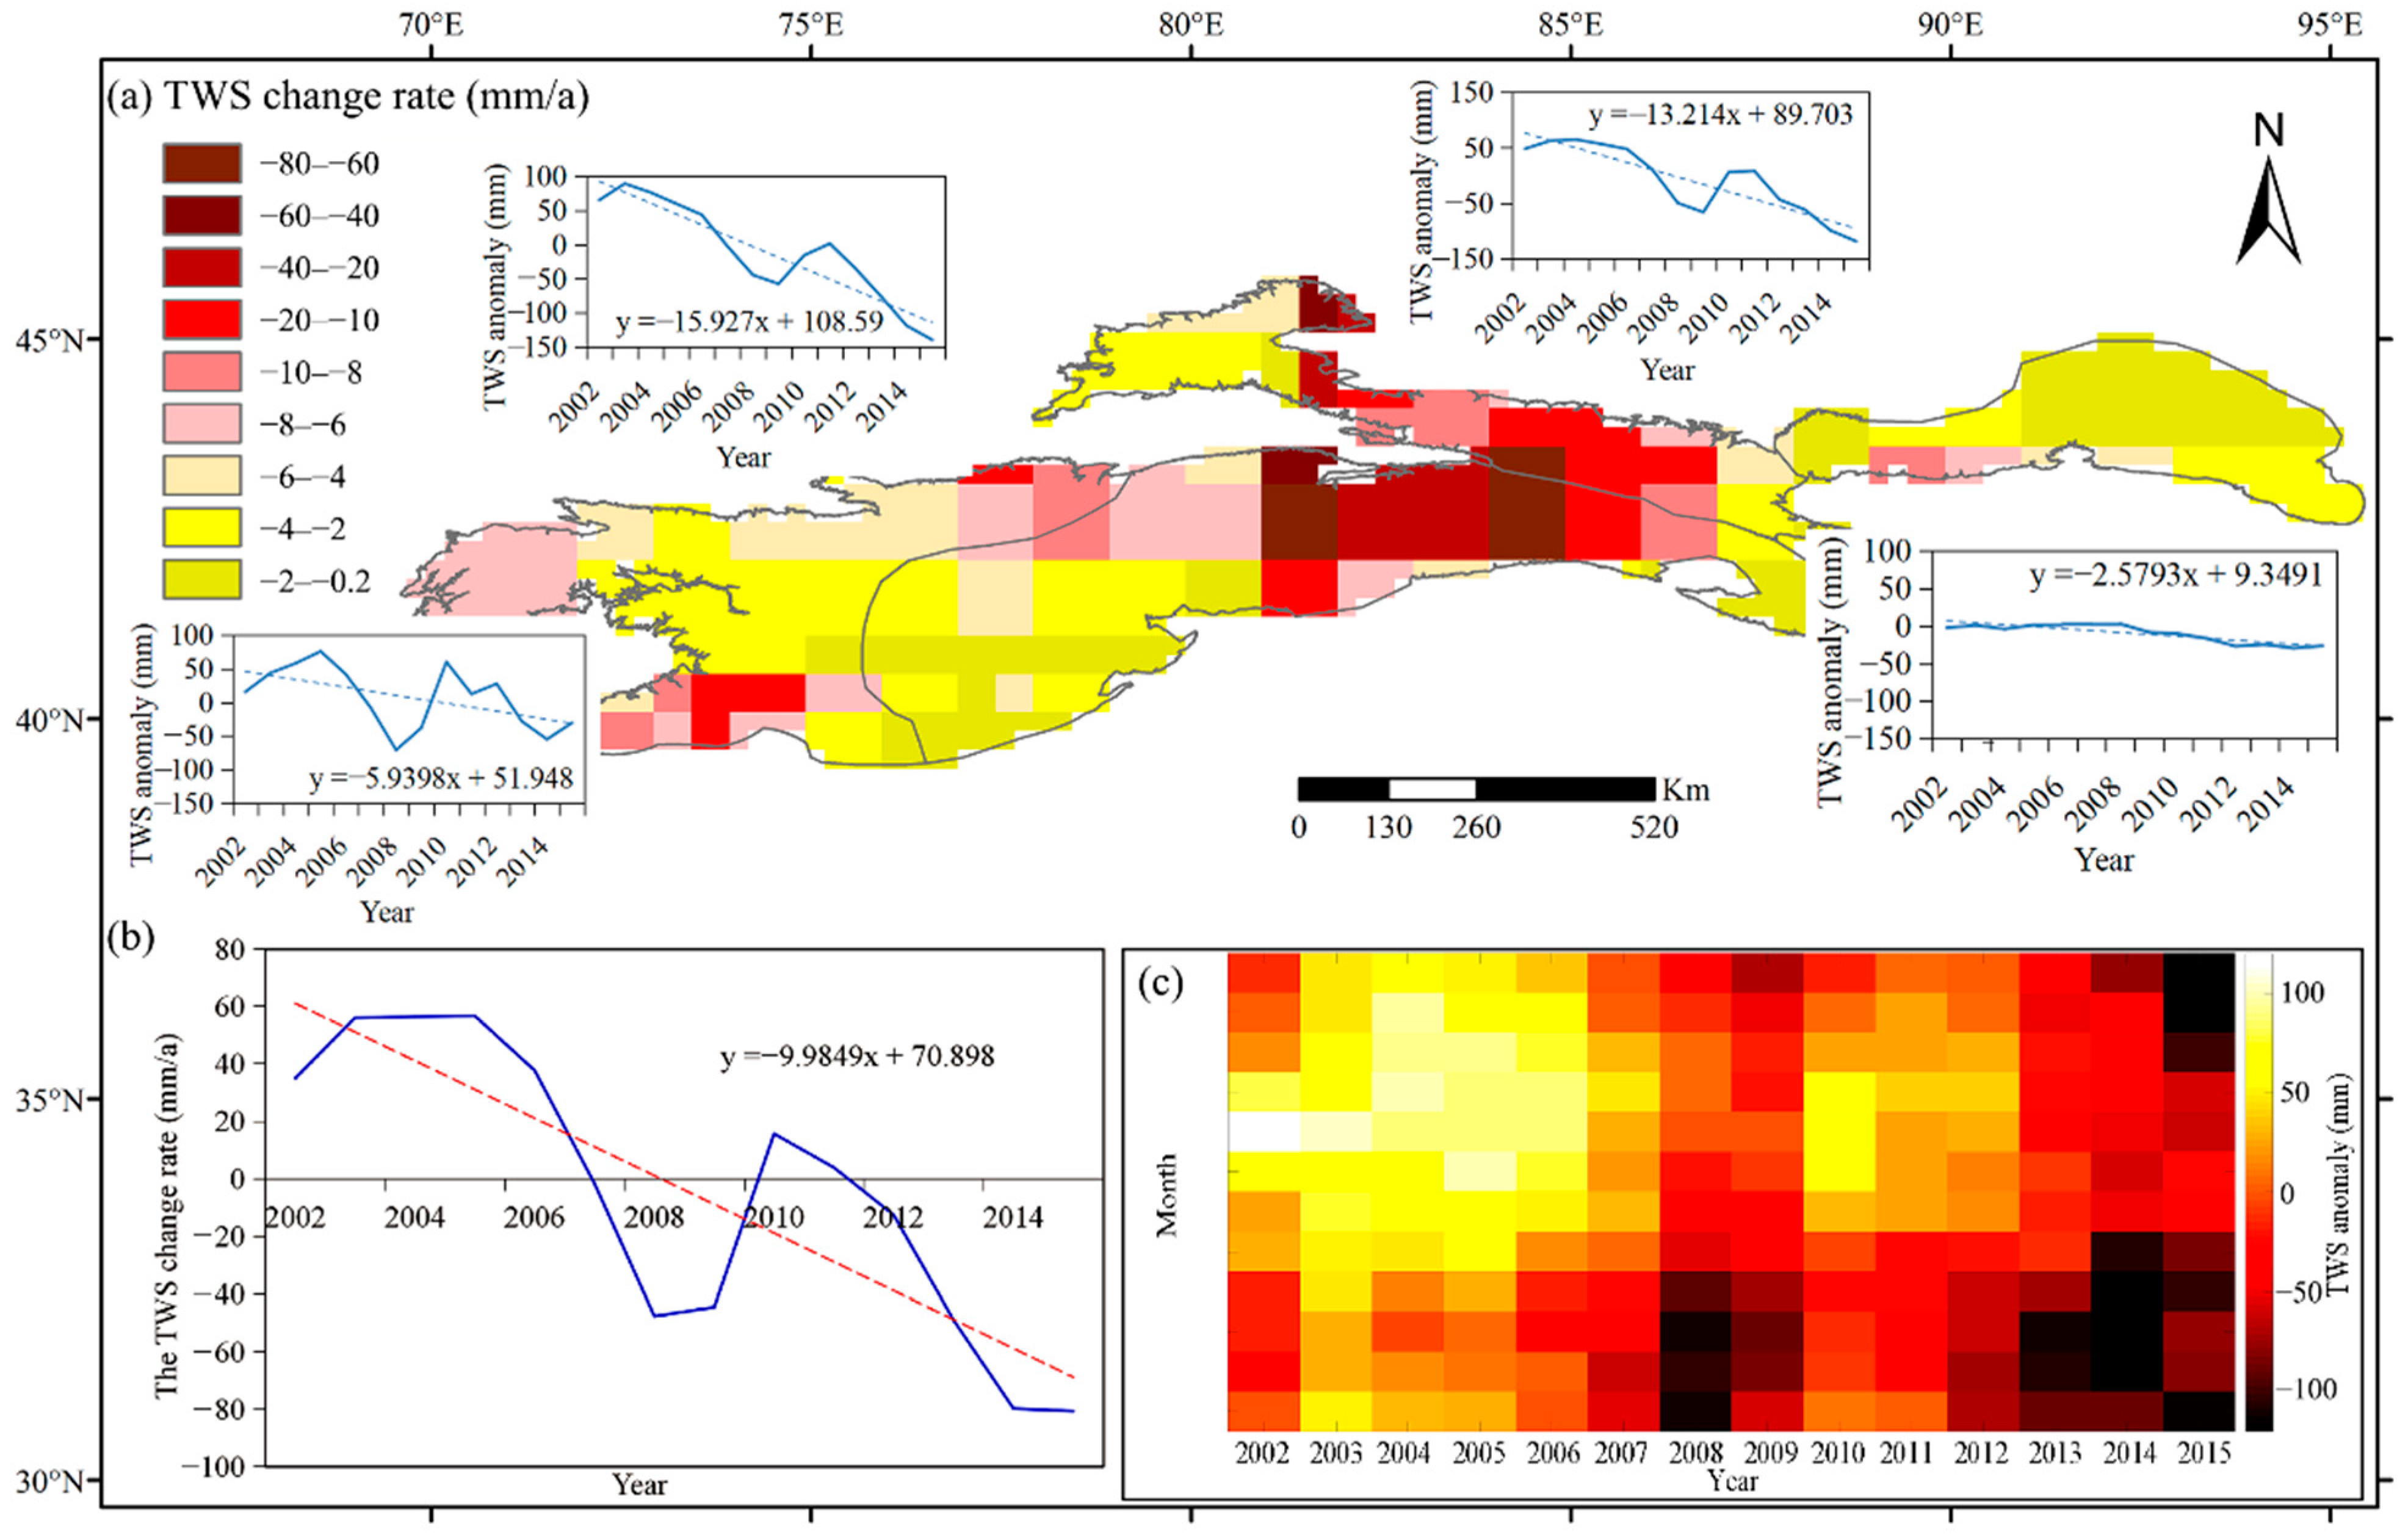
A study of glacier changes in the Tien Shan showed that with the continued shrinkage of glaciers in recent years, the water storage of the entire Tien Shan has changed drastically. Since 2002, water storage in the entire Tien Shan region has continuously decreased (Figure 11a), decreasing at a rate of 9.98 mm/a (Figure 11b). Changes in water storage in the Tien Shan showed that the stronger the glacier shrinkage, the higher the water storage loss. For example, the central Tien Shan, which contains large-scale glaciers, showed a greater decrease in glacier area and a larger loss in water storage (15.93 mm/a) despite the shrinkage rate of the glacier area being small. In the northern Tien Shan, the total glacier area decreased by 456.43 km2 from 1990 to 2015, with the water storage decreasing by 13.21 mm/a. Despite significant temperature increases and strong shrinkage of glacier areas in the eastern Tien Shan in recent years, the glaciers in small areas showed the highest shrinkage in areas but less in relative areas, resulting in a smaller shrinkage in water storage from glacier meltwater, decreasing by 2.58 mm/a. Compared to other regions in the Tien Shan, the total glacier area in the northern Tien Shan showed a higher rate of decrease and greater loss in water storage from 1990 to 2015. The loss of glacial material is the direct cause of the decrease in water storage in the northern Tien Shan.
Figure 11.
Variations in total water storage in the Tien Shan region. (a) Spatial variations in total water storage; (b) variations in annual total water storage; (c) variations in monthly total water storage.
5. Conclusions
This study interpreted glacier information from 1990 to 2015 in the northern Tien Shan and analyzed glacier spatiotemporal variation characteristics based on Landsat TM/ETM+/OLI, multi-source remote sensing data, and meteorological observation data. The main conclusions are as follows.
From 1990 to 2015, the total glacier area in the northern Tien Shan exhibited a negative trend, decreasing from 2838.94 km2 in 1990 to 2382.51 km2 in 2015, a decrease of approximately 16.08%. The total glacier number and volume decreased by 8 and 26.14 km3, respectively. From 1990 to 2015, the average altitude of glacier termini in the northern Tien Shan rose by 18 m. From 1990 to 2000, glaciers retreated by 0.60%/a on average, increasing significantly to 0.71%/a from 2000 to 2015.
From 1990 to 2015, the glacier area in the northern Tien Shan decreased, but there were obvious regional differences. Smaller glaciers in the Toutun, Urumqi, and Hutubi River basins in the periphery of the northern Tien Shan had glacier retreat rates of 1.25%/a, 1.03%/a, and 1.01%/a, respectively. In the Boertala River basin in the northwest of the northern Tien Shan, the annual glacier retreat rate was 1.14%/a. In the Manas and Sikeshu River basins, where glaciers are relatively concentrated, glacier retreat rates were 0.38%/a and 0.60%/a, respectively. Spatially, the glaciers in the southwest, east, southeast and west-facing aspects retreated at faster rates (38.37%, 35.79%, 27.16%, and 24.74%, respectively) than those in northeast-facing aspect (3.99%).
Global warming has generally accelerated hydrological exchanges between the components of the regional water cycle and has added more uncertainty to water resource management in Central Asia. Thus, our next research wll be combining long-term information from glaciers, snow, and meteorological and hydrological data using the glacial-hydrological model to predict future water resources in the Tien Shan region.
Author Contributions
Q.Z. and Y.C. conceived the original design of the paper and contributed to manuscript writing and reviewing; Y.X. contributed to data processing and formal analysis; and Z.L., Y.L. and C.S. provided comments on this paper. All authors have read and agreed to the published version of the manuscript.
Funding
This research was supported by the National Natural Science Foundation of China (grant numbers 42130512 and U1903208).
Data Availability Statement
Not applicable.
Conflicts of Interest
The authors declare no conflict of interest.
References
- Oerlemans, J. Extracting a climate signal from 169 glacier records. Science 2005, 308, 675–677. [Google Scholar] [CrossRef] [Scilit] [PubMed]
- Wang, X.; Guo, X.; Yang, C.; Liu, Q.; Wei, J.; Zhang, Y.; Liu, S.; Zhang, Y.; Jiang, Z.; Tang, Z. Glacial lake inventory of high-mountain Asia in 1990 and 2018 derived from Landsat images. Earth Syst. Sci. Data 2020, 12, 2169–2182. [Google Scholar] [CrossRef] [Scilit]
- Deng, H.; Chen, Y.; Li, Y. Glacier and snow variations and their impacts on regional water resources in mountains. J. Geogr. Sci. 2019, 29, 84–100. [Google Scholar] [CrossRef] [Scilit]
- Gao, H.; Li, H.; Duan, Z.; Ren, Z.; Meng, X.; Pan, X. Modelling glacier variation and its impact on water resource in the Urumqi Glacier No. 1 in Central Asia. Sci. Total Environ. 2018, 644, 1160–1170. [Google Scholar] [CrossRef] [Scilit]
- Zhang, Q.; Chen, Y.; Li, Z.; Fang, G.; Xiang, Y.; Li, Y.; Ji, H. Recent Changes in Water Discharge in Snow and Glacier Melt-Dominated Rivers in the Tienshan Mountains, Central Asia. Remote Sens. 2020, 12, 2704. [Google Scholar] [CrossRef] [Scilit]
- Fell, S.; Carrivick, J.; Brown, L. The Multitrophic Effects of Climate Change and Glacier Retreat in Mountain Rivers. Bioscience 2017, 67, 897–911. [Google Scholar] [CrossRef] [Scilit]
- Pritchard, H.D. Asia’s shrinking glaciers protect large populations from drought stress. Nature 2019, 569, 649–654. [Google Scholar] [CrossRef] [Scilit]
- Chen, Y.; Li, W.; Deng, H.; Fang, G.; Li, Z. Changes in Central Asia’s Water Tower: Past, Present and Future. Sci. Rep. 2016, 6, 35458. [Google Scholar] [CrossRef] [Scilit]
- Chen, Y.; Li, Z.; Fang, G.; Deng, H. Impact of climate change on water resources in the Tianshan Mountians, Central Asia. Acta Geogr. Sin. 2017, 72, 18–26. (In Chinese) [Google Scholar]
- Chen, Y.; Li, W.; Fang, G.; Li, Z. Review article: Hydrological modeling in glacierized catchments of central Asia–status and challenges. Hydrol. Earth Syst. Sci. 2017, 21, 669–684. [Google Scholar] [CrossRef] [Scilit]
- Chen, Y.; Li, Z.; Fang, G.; Li, W. Large Hydrological Processes Changes in the Transboundary Rivers of Central Asia. J. Geophys. Res. Atmos. 2018, 123, 5059–5069. [Google Scholar] [CrossRef] [Scilit]
- Deng, H.; Chen, Y. Influences of recent climate change and human activities on water storage variations in Central Asia. J. Hydrol. 2017, 544, 46–57. [Google Scholar] [CrossRef] [Scilit]
- Farinotti, D.; Longuevergne, L.; Moholdt, G.; Duethmann, D.; Mölg, T.; Bolch, T.; Vorogushyn, S.; Güntner, A. Substantial glacier mass loss in the Tien Shan over the past 50 years. Nat. Geosci. 2015, 8, 716–722. [Google Scholar] [CrossRef] [Scilit]
- Li, Y.J.; Ding, Y.J.; Shangguan, D.H.; Wang, R.J. Regional differences in global glacier retreat from 1980 to 2015. Adv. Clim. Chang. Res. 2020, 10, 203–213. [Google Scholar] [CrossRef] [Scilit]
- Shugar, D.H.; Burr, A.; Haritashya, U.K.; Kargel, J.S.; Watson, C.S.; Kennedy, M.C.; Bevington, A.R.; Betts, R.A.; Harrison, S.; Strattman, K. Rapid worldwide growth of glacial lakes since 1990. Nat. Clim. Chang. 2020, 10, 939–945. [Google Scholar] [CrossRef] [Scilit]
- Brun, F.; Berthier, E.; Wagnon, P.; Kääb, A.; Treichler, D. A spatially resolved estimate of High Mountain Asia glacier mass balances from 2000 to 2016. Nat. Geosci. 2017, 10, 668–673. [Google Scholar] [CrossRef] [Scilit]
- Singh, P.; Bengtsson, L. Impact of warmer climate on melt and evaporation for the rainfed, snowfed and glacierfed basins in the Himalayan region. J. Hydrol. 2005, 300, 140–154. [Google Scholar] [CrossRef] [Scilit]
- Sorg, A.; Huss, M.; Rohrer, M.; Stoffel, M. The days of plenty might soon be over in glacierized Central Asian catchments. Environ. Res. Lett. 2014, 9, 104018. [Google Scholar] [CrossRef] [Scilit]
- Shen, Y.J.; Shen, Y.; Fink, M.; Kralisch, S.; Chen, Y.; Brenning, A. Trends and variability in streamflow and snowmelt runoff timing in the southern Tianshan Mountains. J. Hydrol. 2018, 557, 173–181. [Google Scholar] [CrossRef] [Scilit]
- Chen, H.; Chen, Y.; Li, W.; Li, Z. Quantifying the contributions of snow/glacier meltwater to river runoff in the Tianshan Mountains, Central Asia. Glob. Planet. Chang. 2019, 174, 47–57. [Google Scholar] [CrossRef] [Scilit]
- Wang, X.; Ding, Y.; Liu, S.; Jiang, L.; Wu, K.; Jiang, Z.; Guo, W. Changes of glacial lakes and implications in Tian Shan, central Asia, based on remote sensing data from 1990 to 2010. Environ. Res. Lett. 2013, 8, 44052. [Google Scholar] [CrossRef] [Scilit]
- Kaldybayev, A.; Chen, Y.; Issanova, G.; Wang, H.; Mahmudova, L. Runoff response to the glacier shrinkage in the Karatal river basin, Kazakhstan. Arab. J. Geosci. 2016, 9, 1–8. [Google Scholar] [CrossRef] [Scilit]
- Kriegel, D.; Mayer, C.; Hagg, W.; Vorogushyn, S.; Duethmann, D.; Gafurov, A.; Farinotti, D. Changes in glacierisation, climate and runoff in the second half of the 20th century in the Naryn basin, Central Asia. Glob. Planet. Chang. 2013, 110, 51–61. [Google Scholar] [CrossRef] [Scilit]
- Chen, Y.; Zhang, X.; Fang, G.; Li, Z.; Wang, F.; Qin, J.; Sun, F. Potential risks and challenges of climate change in the arid region of northwestern China. Reg. Sustain. 2020, 1, 20–30. [Google Scholar] [CrossRef] [Scilit]
- Li, Y.; Chen, Y.; Li, Z. Climate and topographic controls on snow phenology dynamics in the Tienshan Mountains, Central Asia. Atmos. Res. 2020, 236, 104813. [Google Scholar] [CrossRef] [Scilit]
- Li, Z.; Chen, Y.; Li, Y.; Wang, Y. Declining snowfall fraction in the alpine regions, Central Asia. Sci. Rep. 2020, 10, 3476. [Google Scholar] [CrossRef] [Scilit]
- Deng, H.; Chen, Y.; Li, Q.; Lin, G. Loss of terrestrial water storage in the Tianshan mountains from 2003 to 2015. Int. J. Remote Sens. 2019, 40, 8342–8358. [Google Scholar] [CrossRef] [Scilit]
- Chen, F.; Chen, Y.; Bakhtiyorov, Z.; Zhang, H.; Man, W.; Chen, F. Central Asian river streamflows have not continued to increase during the recent warming hiatus. Atmos. Res. 2020, 246, 105124. [Google Scholar] [CrossRef] [Scilit]
- Unger-Shayesteh, K.; Vorogushyn, S.; Farinotti, D.; Gafurov, A.; Duethmann, D.; Mandychev, A.; Merz, B. What do we know about past changes in the water cycle of Central Asian headwaters? A review. Glob. Planet. Chang. 2013, 110, 4–25. [Google Scholar] [CrossRef] [Scilit]
- IPCC. Working Group I Contribution to the IPCC Fifth Assessment Report. In Climate Change 2013: The Physical Science Basis: Summary for Policymakers; Cambridge University Press: Cambridge, UK, 2013. [Google Scholar]
- Aizen, V.B.; Kuzmichenok, V.A.; Surazakov, A.B.; Aizen, E.M. Glacier changes in the central and northern Tien Shan during the last 140 years based on surface and remote-sensing data. Ann. Glaciol. 2006, 43, 202–213. [Google Scholar] [CrossRef] [Scilit]
- Kaldybayev, A.; Chen, Y.N.; Vilesov, E. Glacier change in the Karatal river basin, Zhetysu (Dzhungar) Alatau, Kazakhstan. Ann. Glaciol. 2016, 57, 11–19. [Google Scholar] [CrossRef] [Scilit]
- Pieczonka, T.; Bolch, T. Region-wide glacier mass budgets and area changes for the Central Tien Shan between ~1975 and 1999 using Hexagon KH-9 imagery. Glob. Planet. Chang. 2015, 128, 1–13. [Google Scholar] [CrossRef] [Scilit]
- Shangguan, D.; Liu, S.; Ding, Y.; Ding, L.; Xu, J.; Jing, L. Glacier changes during the last forty years in the Tarim Interior River basin, northwest China. Prog. Nat. Sci. 2009, 19, 727–732. [Google Scholar] [CrossRef] [Scilit]
- Sorg, A.; Bolch, T.; Stoffel, M.; Solomina, O.; Beniston, M. Climate change impacts on glaciers and runoff in Tien Shan (Central Asia). Nat. Clim. Chang. 2012, 2, 725–731. [Google Scholar] [CrossRef] [Scilit]
- Liu, Q.; Liu, S.Y. Response of glacier mass balance to climate change in the Tianshan Mountains during the second half of the twentieth century. Clim. Dyn. 2016, 46, 303–316. [Google Scholar] [CrossRef] [Scilit]
- Petrakov, D.; Shpuntova, A.; Aleinikov, A.; Kääb, A.; Kutuzov, S.; Lavrentiev, I.; Stoffel, M.; Tutubalina, O.; Usubaliev, R. Accelerated glacier shrinkage in the Ak-Shyirak massif, Inner Tien Shan, during 2003–2013. Sci. Total Environ. 2016, 562, 364–378. [Google Scholar] [CrossRef] [Scilit]
- Bolch, T. Climate change and glacier retreat in northern Tien Shan (Kazakhstan/Kyrgyzstan) using remote sensing data. Glob. Planet. Chang. 2007, 56, 1–12. [Google Scholar] [CrossRef] [Scilit]
- Aizen, V.B.; Kuzmichenok, V.A.; Surazakov, A.B.; Aizen, E.M. Glacier changes in the Tien Shan as determined from topographic and remotely sensed data. Glob. Planet. Chang. 2007, 56, 328–340. [Google Scholar] [CrossRef] [Scilit]
- Yang, T.; Li, Q.; Ahmad, S.; Zhou, H.; Li, L. Changes in Snow Phenology from 1979 to 2016 over the Tianshan Mountains, Central Asia. Remote Sens 2019, 11, 499. [Google Scholar] [CrossRef] [Scilit]
- Hu, Z.; Dietz, A.; Zhao, A.; Uereyen, S.; Zhang, H.; Wang, M.; Mederer, P.; Kuenzer, C. Snow Moving to Higher Elevations: Analyzing Three Decades of Snowline Dynamics in the Alps. Geophys. Res. Lett. 2020, 47, e2019GL085742. [Google Scholar] [CrossRef] [Scilit]
- Deng, H.; Pepin, N.C.; Liu, Q.; Chen, Y. Understanding the spatial differences in terrestrial water storage variations in the Tibetan Plateau from 2002 to 2016. Clim. Chang. 2018, 151, 379–393. [Google Scholar] [CrossRef] [Scilit]
- Radić, V.; Hock, R. Regional and global volumes of glaciers derived from statistical upscaling of glacier inventory data. J. Geophys. Res. 2010, 115. [Google Scholar] [CrossRef] [Scilit]
- Paul, F.; Barry, R.G.; Cogley, J.G.; Frey, H.; Haeberli, W.; Ohmura, A.; Ommanney, C.S.L.; Raup, B.; Rivera, A.; Zemp, M. Recommendations for the compilation of glacier inventory data from digital sources. Ann. Glaciol. 2009, 50, 119–126. [Google Scholar] [CrossRef] [Scilit]
- Guo, W.; Liu, S.; Xu, J.; Wu, L.; Shangguan, D.; Yao, X.; Wei, J.; Bao, W.; Yu, P.; Liu, Q.; et al. The second Chinese glacier inventory: Data, methods and results. J. Glaciol. 2015, 61, 357–372. [Google Scholar] [CrossRef] [Scilit]
- Bolch, T.; Menounos, B.; Wheate, R. Landsat-based inventory of glaciers in western Canada, 1985–2005. Remote Sens. Environ. 2010, 114, 127–137. [Google Scholar] [CrossRef] [Scilit]
- Engel, Z.; Šobr, M.; Yerokhin, S. Changes of Petrov glacier and its proglacial lake in the Akshiirak massif, central Tien Shan, since 1977. J. Glaciol. 2012, 58, 388–398. [Google Scholar] [CrossRef] [Scilit]
- Gardelle, J.; Arnaud, Y.; Berthier, E. Contrasted evolution of glacial lakes along the Hindu Kush Himalaya mountain range between 1990 and 2009. Glob. Planet. Chang. 2011, 75, 47–55. [Google Scholar] [CrossRef] [Scilit]
- Hall, D.K.; Bayr, K.J.; Schöner, W.; Bindschadler, R.A.; Chien, J.Y. Consideration of the errors inherent in mapping historical glacier positions in Austria from the ground and space (1893–2001). Remote Sens. Environ. 2003, 86, 566–577. [Google Scholar] [CrossRef] [Scilit]
- Pfeffer, W.T.; Arendt, A.A.; Bliss, A.; Bolch, T.; Cogley, J.G.; Gardner, A.S.; Hagen, J.O.; Hock, R.; Kaser, G.; Kienholz, C.; et al. The Randolph Glacier Inventory: A globally complete inventory of glaciers. J. Glaciol. 2014, 60, 537–552. [Google Scholar] [CrossRef] [Scilit]
- Tielidze, L.; Wheate, R. The Greater Caucasus Glacier Inventory (Russia, Georgia and Azerbaijan). Cryosphere 2018, 12, 81–94. [Google Scholar] [CrossRef] [Scilit]
- Sun, M.; Liu, S.; Yao, X.; Guo, W.; Xu, J. Glacier changes in the Qilian Mountains in the past half-century: Based on the revised First and Second Chinese Glacier Inventory. J. Geogr. Sci. 2018, 28, 206–220. [Google Scholar] [CrossRef] [Scilit]
- Zheng, G.; Bao, A.; Li, J.; Zhang, G.; Xie, H.; Guo, H.; Jiang, L.; Chen, T.; Chang, C.; Chen, W. Sustained growth of high mountain lakes in the headwaters of the Syr Darya River, Central Asia. Glob. Planet. Chang. 2019, 176, 84–99. [Google Scholar] [CrossRef] [Scilit]
- Kapitsa, V.; Shahgedanova, M.; Machguth, H.; Severskiy, I.; Medeu, A. Assessment of evolution and risks of glacier lake outbursts in the Djungarskiy Alatau, Central Asia, using Landsat imagery and glacier bed topography modelling. Nat. Hazard. Earth Syst. 2017, 17, 1837–1856. [Google Scholar] [CrossRef] [Scilit]
- Treichler, D.; Kääb, A.; Salzmann, N.; Xu, C.Y. Recent glacier and lake changes in High Mountain Asia and their relation to precipitation changes. Cryosphere 2019, 13, 2977–3005. [Google Scholar] [CrossRef] [Scilit]
- Schauwecker, S.; Rohrer, M.; Acuña, D.; Cochachin, A.; Dávila, L.; Frey, H.; Giráldez, C.; Gómez, J.; Huggel, C.; Jacques-Coper, M.; et al. Climate trends and glacier retreat in the Cordillera Blanca, Peru, revisited. Glob. Planet. Chang. 2014, 119, 85–97. [Google Scholar] [CrossRef] [Scilit]
- Yang, X.; Pavelsky, T.M.; Allen, G.H. The past and future of global river ice. Nature 2020, 577, 69–73. [Google Scholar] [CrossRef] [Scilit]
- Zemp, M.; Frey, H.; Gärtner-Roer, I.; Nussbaumer, S.U.; Hoelzle, M.; Paul, F.; Haeberli, W.; Denzinger, F.; Ahlstrøm, A.P.; Anderson, B.; et al. Historically unprecedented global glacier decline in the early 21st century. J. Glaciol. 2015, 61, 745–762. [Google Scholar] [CrossRef] [Scilit]
- Gardner, A.S.; Moholdt, G.; Cogley, J.G.; Wouters, B.; Arendt, A.A.; Wahr, J.; Berthier, E.; Hock, R.; Pfeffer, W.T.; Kaser, G.; et al. A reconciled estimate of glacier contributions to sea level rise: 2003 to 2009. Science 2013, 340, 852–857. [Google Scholar] [CrossRef] [Scilit]
- Li, B.; Zhu, A.X.; Zhang, Y.; Pei, T.; Qin, C.; Zhou, C. Glacier change over the past four decades in the middle Chinese Tien Shan. J. Glaciol. 2006, 52, 425–432. [Google Scholar] [CrossRef] [Scilit]
- Niederer, P.; Bilenko, V.; Ershova, N.; Hurni, H.; Yerokhin, S.; Maselli, D. Tracing glacier wastage in the northern Tien Shan (Kyrgyzstan/Central Asia) over the last 40 years. Clim. Chang. 2008, 86, 227–234. [Google Scholar] [CrossRef] [Scilit]
- Wang, L.; Li, Z.; Wang, F.; Edwards, R. Glacier shrinkage in the Ebinur lake basin, Tien Shan, China, during the past 40 years. J. Glaciol. 2014, 60, 245–254. [Google Scholar] [CrossRef] [Scilit]
- Narama, C.; Kääb, A.; Duishonakunov, M.; Abdrakhmatov, K. Spatial variability of recent glacier area changes in the Tien Shan Mountains, Central Asia, using Corona (~1970), Landsat (~2000), and ALOS (~2007) satellite data. Glob. Planet. Chang. 2010, 71, 42–54. [Google Scholar] [CrossRef] [Scilit]
- Savoskul, O.S. Modern and Little Ice Age glaciers in “humid” and “arid” areas of the Tien Shan, Central Asia: Two different patterns of fluctuation. Ann. Glaciol. 1997, 24, 142–147. [Google Scholar] [CrossRef] [Scilit]
- Gan, R.; Luo, Y.; Zuo, Q.; Sun, L. Effects of projected climate change on the glacier and runoff generation in the Naryn River Basin, Central Asia. J. Hydrol. 2015, 523, 240–251. [Google Scholar] [CrossRef] [Scilit]
- Li, B.; Chen, Y.; Chen, Z.; Li, W.; Zhang, B. Variations of temperature and precipitation of snowmelt period and its effect on runoff in the mountainous areas of Northwest China. J. Geogr. Sci. 2013, 23, 17–30. [Google Scholar] [CrossRef] [Scilit]
- Duethmann, D.; Bolch, T.; Farinotti, D.; Kriegel, D.; Vorogushyn, S.; Merz, B.; Pieczonka, T.; Jiang, T.; Su, B.; Güntner, A. Attribution of streamflow trends in snow and glacier melt-dominated catchments of the Tarim River, Central Asia. Water Resour. Res. 2015, 51, 4727–4750. [Google Scholar] [CrossRef] [Scilit]
- Yao, J.; Chen, Y.; Guan, X.; Zhao, Y.; Chen, J.; Mao, W. Recent climate and hydrological changes in a mountain–basin system in Xinjiang, China. Earth-Sci. Rev. 2022, 226, 103957. [Google Scholar] [CrossRef] [Scilit]
- Kundzewicz, Z.W.; Merz, B.; Vorogushyn, S.; Hartmann, H.; Duethmann, D.; Wortmann, M.; Huang, S.; Su, B.; Jiang, T.; Krysanova, V. Analysis of changes in climate and river discharge with focus on seasonal runoff predictability in the Aksu River Basin. Environ. Earth Sci. 2015, 73, 501–516. [Google Scholar] [CrossRef] [Scilit]
- Zhao, Q.; Zhang, S.; Ding, Y.J.; Wang, J.; Han, H.; Xu, J.; Zhao, C.; Guo, W.; Shangguan, D. Modeling Hydrologic Response to Climate Change and Shrinking Glaciers in the Highly Glacierized Kunma Like River Catchment, Central Tian Shan. J. Hydrometeorol. 2015, 16, 2383–2402. [Google Scholar] [CrossRef] [Scilit]
- Kääb, A.; Berthier, E.; Nuth, C.; Gardelle, J.; Arnaud, Y. Contrasting patterns of early twenty-first-century glacier mass change in the Himalayas. Nature 2012, 488, 495–498. [Google Scholar] [CrossRef] [Scilit]
- Zhang, Q.; Sun, C.; Chen, Y.; Chen, W.; Xiang, Y.; Li, J.; Liu, Y. Recent Oasis Dynamics and Ecological Security in the Tarim River Basin, Central Asia. Sustainability 2022, 14, 3372. [Google Scholar] [CrossRef] [Scilit]
- IPCC. Climate Change 2021: The Physical Science Basis: Summary for Policymakers; IPCC: Geneva, Switzerland, 2021. [Google Scholar]
- Azmat, M.; Qamar, M.U.; Huggel, C.; Hussain, E. Future climate and cryosphere impacts on the hydrology of a scarcely gauged catchment on the Jhelum river basin, Northern Pakistan. Sci. Total Environ. 2018, 639, 961–976. [Google Scholar] [CrossRef] [Scilit] [PubMed]
- Li, Y.; Chen, Y.; Wang, F.; He, Y.; Li, Z. Evaluation and projection of snowfall changes in High Mountain Asia based on NASA’s NEX-GDDP high-resolution daily downscaled dataset. Environ. Res. Lett. 2020, 15, 104040. [Google Scholar] [CrossRef] [Scilit]

Publisher’s Note: MDPI stays neutral with regard to jurisdictional claims in published maps and institutional affiliations. |
© 2022 by the authors. Licensee MDPI, Basel, Switzerland. This article is an open access article distributed under the terms and conditions of the Creative Commons Attribution (CC BY) license (https://creativecommons.org/licenses/by/4.0/).