
Impact of Snow Cover Phenology on the Vegetation Green-Up Date on the Tibetan Plateau
by
 ,
,
Jingyi Xu
1,2,3, 
Yao Tang
1,2,3,
Jiahui Xu
1,2,3,
Song Shu
4,
Bailang Yu
1,2,3,
Jianping Wu
1,2,3 and
Yan Huang
1,2,3,* 1
Key Laboratory of Geographic Information Science, Ministry of Education, East China Normal University, Shanghai 200241, China
2
School of Geographic Sciences, East China Normal University, Shanghai 200241, China
3
Key Laboratory of Spatial-Temporal Big Data Analysis and Application of Natural Resources in Megacities, Ministry of Natural Resources, Shanghai 200241, China
4
Department of Geography and Planning, Appalachian State University, Boone, NC 28608, USA
*
Author to whom correspondence should be addressed.
Remote Sens. 2022, 14(16), 3909; https://doi.org/10.3390/rs14163909
Submission received: 25 June 2022
/
Revised: 7 August 2022
/
Accepted: 10 August 2022
/
Published: 12 August 2022
(This article belongs to the Special Issue Remote Sensing for Mountain Vegetation and Snow Cover)
Abstract
:Variations in snow cover resulting from global warming inevitably affect alpine vegetation growth on the Tibetan Plateau (TP), but our knowledge of such influences is still limited. Here, we investigated the relationship between snow cover and alpine vegetation during 2003–2020 on the TP using the satellite-derived vegetation green-up date (GUD) and metrics of snow cover phenology, namely the snow cover onset date (SCOD), snow cover end date (SCED), snow cover duration (SCD), and snowmelt onset date (SMOD). In this study, we first analyzed the spatiotemporal changes in the GUD and the snow cover phenology metrics on the TP. Pearson’s correlation, gray relation analysis, and linear regression were then employed to determine the impact of snow cover phenology on the GUD. Overall, with the SCOD, SCED, and SMOD delayed by one day, the GUD was advanced by 0.07 and 0.03 days and was postponed by 0.32 days, respectively, and a one-day extension of the SCD resulted in a 0.04-day advance in the GUD. In addition, the roles of vegetation type, topography, and climate factors (temperature and precipitation) in modulating the relationships between snow cover phenology and the GUD were evaluated. The GUD of alpine steppes was negatively correlated with the SCOD and SCED, contrary to that of the other vegetation types. The GUD of alpine steppes was also more sensitive to snow cover phenology than that of other vegetation types. The increase in elevation generally enhanced the sensitivity of the GUD to snow cover phenology. The GUD showed a stronger negative sensitivity to the SCD in warmer areas and a stronger positive sensitivity to the SMOD in wetter areas. Our findings revealed the essential impact of variation in snow cover phenology on the GUD and indicated the complex interference of environmental factors in the relationship between snow cover and vegetation growth.
1. Introduction
The Tibetan Plateau (TP) is the highest and largest plateau in the world, featuring both typical alpine ecosystems and rich snow resources [1]. It is one of the regions that are the most sensitive to climate change due to its fragile natural environment and unstable alpine ecosystem [2]. A significant warming trend, with an escalation rate of approximately 0.37 °C per decade, has been observed in the TP over the last 50 years [3]. The increases in air temperature resulted in a series of changes in snow cover. Previous studies [4,5] have reported decreasing trends in the winter snow cover areas and days on the TP, which may further influence surface runoff [6], atmospheric circulation [7], and energy balance [8]. These changes also exert an inevitable impact on the stability of ecosystems in the TP. Vegetation phenology is referenced as an essential indicator of terrestrial ecosystem dynamics [9], as well as a key factor in the sourcing and sinking of carbon [10]. In particular, the green-up date (GUD)—the onset time of vegetation photosynthesis and germination in spring [11]—has been regarded as one of the most sensitive parameters to monitor climate change [12,13]. Previous studies have demonstrated that global warming has led to the widespread trends of earlier GUDs in the middle and high latitudes of the Northern Hemisphere, e.g., [14,15]. Such shifts in GUD are also drivers of climate change as they exert an important influence on water, carbon, and energy exchanges between the biosphere and atmosphere [16]. In addition, the GUD advancement has also affected biogeochemical cycles on large scales, such as the increase in gross primary productivity [17]. Consequently, the investigation of GUD dynamics is crucial for better understanding the response and feedback mechanism of terrestrial ecosystems to climate change.
Previous studies have suggested that the influence of snow cover on GUDs cannot be ignored [18]. Snowmelt water is the primary source of freshwater in alpine regions and provides vital water and nutrients for plant growth [19]. The interaction between soil and vegetation can be directly affected by changes in snow cover. Snow cover with an ideal depth and duration in the winter can help maintain soil moisture and mitigate heat loss, thereby protecting vegetation from low temperatures and cold wind damage [20]. Adequate snow cover may also enhance soil microbial activity, which influences the decomposition of soil organic matter and the transport of nutrients during winter [21]. These factors can provide favorable conditions for early green-up. On the other hand, if snow cover is too deep, it may impede the soil respiration in the winter and in the following spring insulate the underlying plant from heat in the air, which is essential for plant germination [22], thus delaying vegetation growth and the GUD. A coordinated experiment with snow removal treatment at 13 globally distributed sites revealed that the decrease in minimum soil temperature caused by snow cover reduction was negatively correlated with plant biomass [23]. Another comparison experiment with different winter scenarios also suggested that changes in snow cover patterns might affect plant growth and productivity, emphasizing the importance of insulation and protection provided by snow cover for vegetation growth [24]. Therefore, snow cover plays a major role in regulating vegetation growth, thus influencing the GUD. It is of great significance to investigate the response of the GUD to snow cover variation on the TP to understand global climate change and the stability of alpine ecosystems.
The essential metrics of snow cover phenology, including the snow cover onset date (SCOD), snow cover end date (SCED), snow cover duration (SCD), and snowmelt onset date (SMOD), can be used as either direct or indirect indicators of ecological, hydrological, and climatic conditions [25]. The impact of these metrics on the GUD has been investigated in previous studies. Paudel and Andersen [26] analyzed the influence of snow cover dynamics on pasture vegetation in the Nepal Trans-Himalaya using 500 m snow cover data, 250 m Moderate Resolution Imaging Spectroradiometer (MODIS) normalized difference vegetation index (NDVI) data, and the 50% relative threshold (G50) GUD extraction method. The study suggested that snow cover phenology exerts a large impact on GUD in dry regions. Xie et al. [27] studied the response of alpine land surface phenology to snow cover in the European Alps using 250 m snow cover data, 250 m MODIS NDVI data, and the G50 method and concluded that alpine phenology was more greatly affected by snow cover at higher altitudes than at lower altitudes. Wang et al. [1] explored the effect of snow cover phenology on alpine vegetation growth on the TP using snow cover products created by MODIS and ice mapping system data, 500 m MODIS NDVI datasets, and the first local maximum value of the curvature change rate (CCRmax) method. They found that a longer SCD and earlier SCED would lead to an earlier GUD. Sa et al. [28] analyzed the effect of snow cover on grassland phenology on the Mongolian Plateau using 500 m daily snow cover, MODIS NDVI data, and the CCRmax method, indicating that the GUD was significantly positively correlated with the SCD and SCED but negatively correlated with the SCOD. Qi et al. [29] analyzed the relationship between snow cover and vegetation phenology in the Qilian Mountains using 1 km daily snow cover data, the 500 m MODIS NDVI product, and the G30 method, and found that the influence of snow cover on the GUD was subject to terrain zones and underlying surface conditions.
Although these studies have convincingly demonstrated a close connection between snow cover and the GUD, there are still some remaining questions that entail further studies. First, the acquisition of the GUD in most previous studies was based on a vegetation index (e.g., the NDVI) that can be influenced by snow. Some studies [30,31] have reported that the NDVI can be affected by the snowmelt process in early spring, thus resulting in bias in GUD estimation. Although snow calibration was also performed on snow-influenced VIs, e.g., [32,33], there is a possibility that a certain level of errors still resides in the GUDs extracted by using these snow-influenced VIs [34]. To eliminate the snowmelt effect, several snow-free VIs have been proposed, such as the normalized difference infrared index (NDII) [35], phenology index (PI) [36], normalized difference phenology index (NDPI) [37], and normalized difference greenness index (NDGI) [38]. Among them, the NDGI is not only insensitive to snow but can also effectively distinguish vegetation from background components (snow, soil, and dry grass) in tundra and grassland ecosystems [38]. The combination of the NDGI and the CCRmax method [11] has been proven to capture GUDs on the TP with higher accuracy in our previous study [34]. This combination allows us to more accurately explore the response of GUDs to snow cover phenology. Second, snow melt in the spring provides initial water for soil moisture in alpine regions [39,40] and is crucial for vegetation growth and germination. The SMOD, as a timely reflection of changes in temperature and precipitation, may play an important role in vegetation growth and regulate the GUD. However, most existing studies have considered the effects of the SCOD, SCED, and SCD on the GUD. The influence of the SMOD is rarely investigated. Third, the influence of topographic conditions, vegetation types, and climate factors (temperature and precipitation) on the relationship between the GUD and snow cover phenology on the TP needs to be thoroughly analyzed.
In this study, we firstly calculated the GUD with the CCRmax extraction method based on the NDGI derived from MODIS surface reflectance data collected during 2003–2020. Four snow cover phenology metrics (the SCOD, SCED, SCD, and SMOD) were derived from the daily snow cover product and the snowmelt onset time dataset. We then investigated the spatiotemporal variation in the GUD and snow cover phenology metrics during the study period. We also explored the relationship between the GUD and the four metrics over the TP using Pearson’s correlation, gray relation analysis (GRA), and linear regression. Finally, we investigated the sensitivity of the GUD to snow cover phenology in different vegetation types, elevational gradients, and climate zones.
2. Study Area and Data Sources
2.1. Study Area
The TP, located in the center of Asia and southwestern China (26°00′12″N–39°46′50″N, 73°18′52″E–104°46′59″E), has an area of approximately 2.5 × 10⁶ km2 (Figure 1). The TP is subject to complex topography, with an average elevation of more than 4000 m above sea level (asl), and its elevation generally increases from east to west. This area is dominated by an alpine climate with intense solar radiation, low air temperatures, and low annual precipitation. It forms a gradient of climate from dry and cold in the northwest to wet and warm in the southeast [41].
The unique natural environment on the TP fosters its typical vegetation ecosystems. The vast central area of the plateau is covered by alpine steppes and meadows, whereas the southeastern valley and lowlands are covered by shrubs and forests (Figure 1). The vegetation growing season on the TP is primarily from May to September.
There are abundant snow resources on the TP, which generally last longer in the regions with higher elevation [42]. The snow cover on the TP usually begins in September and then increases rapidly, peaks between December and February, and ends in May [43]. Furthermore, the TP is the source of many rivers, which are primarily fed and adjusted by the meltwater from glaciers and snow [44]. The abundant freshwater resources on the TP are of great significance for hydrological processes and ecological activities in the local and vast downstream areas.
2.2. Data Sources
2.2.1. Land Surface Reflectance Products
The MODIS Terra surface reflectance MOD09A1 Version 6 data product was obtained from the USGS EarthExplorer (https://espa.cr.usgs.gov/, accessed on 13 December 2020). The data have a spatial resolution of 500 m and a repeat cycle of 8 days. We downloaded the data collected over the TP during the period of 2003–2020. The atmospheric and aerosol effects are corrected for this data product to provide surface reflectance at seven spectral bands spanning from blue to short-wave infrared [45]. In this study, we used the green (band 4), red (band 1), and near-infrared (band 2) reflectance to calculate the NDGI.
The maximum value composite method [46] was first applied to the NDGI time series to generate 16-day composite data. This composite processing can help filter the noise induced by cloud contamination and poor atmospheric conditions. Subsequently, linear interpolation was utilized to fill the remaining gaps in the time series. Finally, the Savitzky–Golay filter [47,48] was implemented to further denoise and smooth the NDGI time series.
Seasonal vegetation dynamics were the focus of this study. Pixels with the annual maximum NDGI from July to September were reserved by referring to the selection rules based on the NDVI [49].
2.2.2. Snow Cover Product
A gap-free daily snow cover product with a 500 m spatial resolution on the TP from 1 October 2002 to 30 September 2020 was used in our study (https://doi.org/10.11888/Cryos.tpdc.272204, accessed on 20 April 2022). This product was created using the HMRF modeling technique [50], which optimally combines spectral, spatiotemporal, and environmental information to fill gaps in the snow cover product. In addition, this product has an overall accuracy of 91.36% according to the snow information identified from Landsat-8 and 98.29% according to site-based snow depth data [51].
The National Tibetan Plateau Data Center provided the high mountain Asia snowmelt onset time (http://dx.doi.org/10.11888/Snow.tpdc.270307, accessed on 1 April 2021) [52]. This dataset provides the initial snow melting time retrieved from QuickSCAT satellite microwave scatterometer observations of the TP between 2003 and 2009 with a spatial resolution of 0.05° [52].
2.2.3. Elevation Data
The 30 m SRTM digital elevation model (DEM) data were downloaded from USGS EarthExplorer (https://earthexplorer.usgs.gov, accessed on 14 January 2021) and resampled to a spatial resolution of 500 m using bilinear interpolation to keep the consistency with the phenological data.
2.2.4. Land Cover Data
Land cover data over the TP with a 500 m spatial resolution were obtained from the Science Data Bank (http://www.scidb.cn/doi/10.11922/sciencedb.398, accessed on 15 July 2021). The data provide the spatial distribution of the main vegetation types on the TP. We extracted four types of land cover for our subsequent analysis, including alpine steppes, alpine meadows, shrubs, and forests. These are the major vegetation types for the vegetated areas on the TP.
2.2.5. Meteorological Forcing Data
The annual mean air temperature (K) and precipitation rate (mm hr−1) data from 2002 to 2018 were obtained from the China Meteorological Forcing dataset provided by the National Tibetan Plateau Data Center (http://dx.doi.org/10.11888/AtmosphericPhysics.tpe.249369.file, accessed on 9 September 2021). The data were in NetCDF format with a horizontal spatial resolution of 0.1°. We calculated the annual total precipitation and converted the temperature from K to °C. Next, we projected the temperature and precipitation data as WGS 84/UTM Zone 45N and resampled the data to a resolution of 500 m. Due to the evident negative relationship between air temperature and altitude, interpolation was performed according to the elevation gradient of temperature at 0.65 °C/100 m.
3. Methods
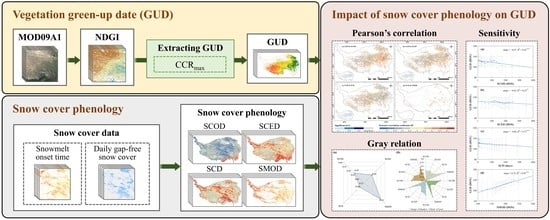
The technical workflow of this study is illustrated in Figure 2. The NDGI was first calculated using MOD09A1. After pre-processing, the GUDs were extracted using the CCRmax method. Four snow cover phenology metrics were obtained, among which, the SCOD, SCED, and SCD were extracted from the daily snow cover data, and the SMOD was derived from snowmelt onset time data. We analyzed the temporal variation trends of the GUD and snow cover phenology metrics. We then analyzed the impact of the snow cover phenology on the GUD using Pearson’s correlation, GRA, and linear regression. We further discuss the influence of vegetation type, topographical conditions, and climate factors on the relationship between the GUD and snow cover phenology.
3.1. Calculation of NDGI
The NDGI was proposed to improve phenology detection in grassland and tundra ecosystems [38]. In previous studies, the most commonly used VIs for GUD extraction were the NDVI and enhanced vegetation index (EVI). However, in addition to vegetation growth, the snowmelt process in spring can also contribute to the increase in the NDVI and EVI. The estimation of the GUD in spring may be affected by snow melt [31]. Therefore, the NDVI and EVI need to be processed to mitigate snow influences, such as by replacing the snow-contaminated pixel values with uncontaminated pixel values [32]. This approach, however, requires ancillary datasets regarding the spatiotemporal distribution of snow cover and is limited in general applicability. The rationale of the NDGI is that the difference between the red band and the straight line linking the green and NIR bands is approximately 0 for snow, soil, and dry grass, whereas it is positive for vegetation [38]. As compared to other VIs, the NDGI is a direct representation of vegetation greenness by minimizing the interference of snow, soil, and hay grass, therefore providing higher contrast between vegetation and background signals. The NDGI is also better at capturing sparse vegetation. The GUD estimated from the NDGI was also proved to have higher accuracy than that from the NDVI and EVI after snow calibration [34]. The NDGI is a linear spectral mixture model that combines the green, red, and NIR bands, and it is expressed as:
where α is the weight coefficient that varies according to satellite sensor configuration. For MODIS data, 0.65 was adopted in this study, following [38].
3.2. Determination of Vegetation GUD
The GUD was extracted from the time series (2003–2020) of the NDGI. Two types of methods are the most commonly used, including the change-detection- and the threshold-based methods [53]. The change detection methods include βmax [54], CCRmax [11], RCmax [55], etc. Threshold-based methods include the relative threshold method and absolute threshold method. Different GUD extraction methods may also cause uncertainty in the GUD. For example, threshold-based methods have no universal applicability, since they are not adaptive to different vegetation types and environmental conditions [56], and βmax seriously overestimates the GUD [34]. In comparison, CCRmax can adaptively detect the NDGI mutation point in the early stage of vegetation growth, which is closer to the real GUD and has biophysical significance. The GUD extracted from the NDGI with the CCRmax method was proved to have higher consistency with the ground-observed GUD than those extracted using other extraction methods (βmax, G20, and RCmax) [34]. The GUD accuracy on the TP was also significantly superior to those in previous studies, e.g., [57,58]. Thus, the CCRmax method was adopted in this study to determine the GUD from the time series of the NDGI (Figure S1). First, the NDGI time series from the beginning of the year to the annual maximum NDGI was fitted with a four-parameter logistic function as follows [11]:
where t is the time in days of year (DOY), is the NDGI value at time t, a and b are fitting parameters, d is the initial background NDGI value, and is the annual maximum NDGI value [11].
3.3. Calculation of Snow Cover Phenology
Four metrics, the SCOD, SCED, SCD, and SMOD, were derived to describe snow cover phenology in each snow cover season. The snow cover season was defined as the period from October 1 of one year to September 30 of the following year. The SCOD, SCED, and SCD were generated from daily snow cover data. Since frequent snow variations such as snowmelt and accumulation processes may occur in a snow cover season on the TP, we used a snow cover duration threshold of 5 days to determine the SCOD, SCED, and SCD [59,60]. The SCOD is the first day when the pixel is marked as snow for at least five consecutive days during the snow cover season. Conversely, the SCED represents the last day when the pixel is flagged as snow for five consecutive days. The SCD is the period between the SCOD and SCED. The SMOD represents the date when the dry snow begins to melt and transforms into a small amount of liquid water, and it represents the shifts in temperature and precipitation. The SMOD was obtained from the snowmelt onset date data.
In situ snow depth data (available from the National Meteorological Centre of China) were used to evaluate the accuracy of the three snow cover phenology metrics (the SCOD, SCED, and SCD) during the 2003–2020 snow cover seasons (Figure S2). The results showed the observed SCOD, SCED, and SCD were consistent with the retrieved results, with R values of 0.95, 0.97, and 0.77 (p < 0.01). The bias in the retrieved and the observed SCOD, SCED, and SCD were −2.39, 3.43, and −1.75 days, which means that the satellite-derived SCOD and SCD tend to underestimate the actual SCOD and SCD, while the satellite-derived SCED tend to overestimated the actual SCED across the TP during 2003–2020 snow cover seasons. Even so, the biases (−2.39, 3.43, and −1.75 days) are still acceptable in snow phenology studies compared with other long-term multiday snow cover products [61]. However, the RMSE between satellite-derived snow cover phenology metrics and ground observations seems larger with values more than 10 days. There are two possible reasons for this. First, most of the in situ stations are located in alpine meadows, shrubs, and forests at lower elevations on the Tibetan Plateau. The canopy closure might cause a severe underestimation of snow cover in areas with forests and shrubs [62], thus leading to the bias of satellite-derived snow cover phenology. Besides, ephemeral and patchy snow events often occur in early fall prior to persistent snow events or in late spring after persistent snow events. However, it is difficult to detect snow from satellite images if the snow depth is too thin during ephemeral and patchy snow events. In this study, we adopted a snow cover duration threshold of 5 days to define snow cover phenology, which reflected the influence of persistent snow events on vegetation growth. Thus, this may also have resulted in the discrepancies in snow cover phenology derived from satellite images and station data. Compared with the daily maximum temperature and in situ snow depth, it was proved that the SMOD can be successfully detected from microwave remote sensing signals [40]. Therefore, this study used these snow cover phenology metrics for the subsequent analysis.
3.4. Analysis
3.4.1. Trend Analysis
The Theil–Sen non-parametric regression [63,64] was applied to analyze the interannual variation trends of the GUD and snow cover phenology at the pixel level. In this method, the median slope of all data pairs represents the general phenological trend. This method is robust against outliers and does not require data normality and independence as compared to other methods. The magnitude of the trend was measured using β as follows:
where β is the trend slope; n is the length of the time series; and and are the ith and jth data values in the time series, respectively. The Mann–Kendall test [65] was used to determine the significance of the trends. Since snow cover did not necessarily exist every year, only pixels where the time series of the GUD or snow cover phenology metrics had at least 6 years of observations were retained for temporal trend analysis to avoid abnormal results due to too-small amounts of data.
3.4.2. Analysis of the Impact of Snow Cover Phenology on GUD
Pearson’s correlation and GRA [66] were combined to investigate the relationship between the GUD and snow cover phenology at the pixel level. Note that only pixels with a minimum of 6 years’ GUD and snow cover phenology metric observations were retained for correlation analysis. The correlation coefficient (r) measures the strength and direction of a correlation, and the p-value represents the statistical significance of a correlation. The gray relation grade (GRG) was calculated to reflect the order of the influence of snow cover phenology on the GUD. The equations are as follows:
where is the gray relation coefficient of the influencing factor i (i.e., the four snow phenology metrics); is the absolute difference between the reference sequence (e.g., GUD) and the comparison sequence (e.g., SCD); m is the number of influencing factors; n is the length of the data sequence; and are the minimum and maximum values of , respectively. α is the resolution coefficient with a recommended range of 0.1 to 0.5, where the smaller the value, the better the resolution. In this study, the value was set to 0.1 following [66].
GRG is the mean value of the gray correlation coefficient. A large GRG signifies a strong impact of a snow cover phenology metric on the GUD. We selected pixels with a significant correlation (p < 0.01) between snow cover phenology and the GUD to further calculate the average GRG.
Subsequently, the sensitivity of the GUD to snow cover phenology was described as the GUD time shift in response to a per unit increase in a snow cover phenology metric. The GUD and each metric of snow cover phenology were fitted using a simple linear regression model. The corresponding regression coefficients were defined as sensitivity coefficients (SSCOD, SSCED, SSCD, and SSMOD).
A sensitivity analysis was also performed among the different vegetation types for pixels with a significant correlation (p < 0.01). Four dominant vegetation types—alpine steppe, alpine meadow, shrub, and forest (including coniferous and broad-leaved forests)—were the focus of this study.
Considering that topography and climate may affect spatiotemporal variation in both snow cover and the GUD, we also assessed the impact of elevation, temperature, and precipitation on the sensitivity of the GUD to snow cover phenology in our study. We divided the TP into 56 elevation zones at 50 m intervals ranging from 3000 to 5800 m (the main altitude range where snow cover affects the GUD). We also divided the TP into 25 × 22 climate interactive zones based on the annual mean total precipitation at intervals of 50 mm and the annual mean temperature at intervals of 1 °C. Pixels with a significant correlation (p < 0.01) were extracted to further analyze the sensitivity of the GUD to snow cover phenology for each elevation or climate zone.
4. Results
4.1. Spatiotemporal Variation of GUD
Figure 3 shows the spatial and temporal variations of the GUD on the TP from 2003 to 2020 which were derived from the NDGI by using the CCRmax method. The cumulative percentage of GUD pixels for each vegetation type is displayed as a line chart in the lower left of Figure 3a, and the map in the lower left of Figure 3b shows the significant level of the GUD trend at each pixel.
Generally, for 81.26% of the study area, the GUD occurred from DOY 110 to 150 (20 April to 30 May). It showed an overall advance gradient from the west to east over the TP (Figure 3a). The regions with the earliest GUD (before DOY 110) were mostly on the eastern border of the TP. The regions with the latest GUD, occurring after DOY 150, were primarily located on the southwestern border of the TP. However, small areas on the northwest-central region and southern part of the plateau showed an earlier GUD before DOY 120 (30 April). For all vegetation types, the forests greened the earliest with a GUD around DOY 90 to 120 (April), followed by shrubs with a GUD around DOY 100 to 120 (10 April to 30 April), meadows with a GUD around DOY 110 to 130 (20 April to 10 May), and steppes with a GUD around DOY 120 to 140 (30 April to 20 May).
Overall, the GUD showed a delay trend in the western and an advancement trend in the eastern part of the TP during the study period. The most significant trend was primarily distributed in the northeastern part of the plateau with an average trend of −0.79 days/year (p < 0.01) (Figure 3b). Approximately 54.14% of the vegetated areas experienced an advancement trend. Among them, approximately 20.14% were statistically significant. Additionally, 35.14% of the vegetated areas showed a delayed GUD, with only 8.21% of them displaying significant trends. Among the vegetation types, meadows showed the steepest advancement trend, whereas steppes had the mildest delay.
4.2. Spatiotemporal Variation of Snow Cover Phenology
The spatial and temporal interannual variations in the four snow cover phenology metrics are depicted in Figure 4 and Figure S3, respectively. Generally, the earlier SCOD was observed in the middle and northeast of the TP, whereas the later SCOD was in the vast western and eastern low-elevation areas of the TP (Figure 4a). The SCOD was delayed by 1.53 days/year (p < 0.01) on average from 2003 to 2020 on the TP (Figure S3a). The areas where the SCOD showed a delayed trend accounted for 50.53% of the total area, whereas the areas with early trends accounted for 43.06%. The areas with significant delays and advances accounted for only 4.51% and 2.01% of the total area, respectively (Figure S3a). The areas with significant SCOD advancements were primarily concentrated in the northwestern and eastern arid regions of the TP, whereas the SCOD in the central area was significantly postponed at a rate of 3 days/year.
The variation in the SCED was closely related to the elevation of the TP. Except for on the eastern edge of the TP, the SCED advanced with the increase in surface elevation (Figure 4b). The area with an SCED between DOY 15 and 180 accounted for 83.26% of the total area, implying that at the end of June, the snow cover on the TP mostly disappeared. Consistent with the SCOD, the SCED was also delayed by 1.88 days/year (p < 0.01) on average (Figure S3b). One difference was that the SCED was delayed faster over a wide area in the central plateau. The areas with significant delay and advance trends accounted for only 4.03% and 3.04% of the total area, respectively (Figure S3b).
The SCD on the TP was closely related with surface elevation. In general, a longer SCD was observed for areas with higher elevations (Figure 4c). The area with an SCD of less than 140 days accounted for 79.88% of the total area, while the area with more than 170 days or year-round snow cover accounted for only 14.63% of the total area. The SCD showed an average decreasing trend at a rate of −1.22 days/year (p < 0.01) (Figure S3c). The area in which the SCD decreased accounted for 41.76% of the total area, whereas there was an area with an increase of 48.50% of the total area. The areas with significant decrease and increase trends accounted for only 5.68% and 3.41% of the total area, respectively. The SCD decreased in the areas of the northeastern, northwestern, and southwestern margins and the west-central part of the TP at a ratio of less than −4 days/year, whereas it increased primarily in the middle plateau.
The SMOD on the TP is earlier in the east than in the west, as shown in Figure 4d. The snow cover started to melt in as early as DOY 50. The SMOD advanced at an average ratio of −5.71 days/year (p < 0.01) (Figure S3d). The areas where the SMOD showed a delay trend accounted for 35.02% of the total area, of which only 1.37% was significantly delayed.
4.3. Impact of Snow Cover Phenology on GUD
Pearson’s correlation between the GUD and each of the four snow cover phenology metrics was first analyzed at the pixel level (Figure S4). The figures on the lower-left of Figure S4a–d show the significance of the correlation. The correlation coefficient illustrates the strength and direction of the linear relationship between the GUD and snow cover phenology. In general, the GUD was positively correlated with the SCOD, SCED, and SMOD over the TP. The correlation between the GUD and the SCOD was more significant than the other two metrics, primarily in the eastern plateau. This indicates that the GUD was delayed along with the delay of the SCOD, SCED, and SMOD. However, later SCODs and SCEDs may also lead to earlier GUDs, which can be observed in some areas in the eastern and central areas of the TP. The GUD was in general negatively correlated with the SCD on the TP, but there were also some areas with positive correlation on the western plateau. The significant correlation between the SCD and GUD was primarily in the eastern plateau, implying that with the extension of the SCD, the GUD advanced in the eastern plateau and was postponed in the western plateau. These results showed a spatial complexity of the influence of snow cover phenology on the GUD.
Pixels with a significant correlation (p < 0.01) between the GUD and the four snow cover phenology metrics were selected for further GRA over the entire study area and for the four vegetation types (Figure 5). The GRG reflects the intensity of different snow cover phenology metrics’ influences on the GUD. The results show that the GUD had the largest GRG with the SMOD (0.55), followed by the SCOD (0.47), SCED (0.44), and SCD (0.40) (Figure 5a). This implies that the GUD was the most affected by the SMOD and SCOD and less affected by the SCED and SCD on the TP. The mean GRGs between the SMOD and GUD were the largest, and the mean GRGs between the SCD and GUD were the smallest for all vegetation types (Figure 5b). However, the SCOD and SCED exerted different effects on the GUD for different vegetation types. The SCED influenced the GUD of steppes to a greater extent than the SCOD, while it exerted less influence on the GUD of meadows, shrubs, and forests than the SCOD (Figure 5b).
Pixels with a significant correlation (p < 0.01) between the GUD and snow cover phenology metrics were also used for the sensitivity analysis over the entire study area (Figure 6) and for the four vegetation types (Figure 7). The sensitivity of the GUD to snow cover phenology reflects the flexibility and direction of change in the GUD in response to snow cover variations.
The results show that the GUD had the strongest positive correlation with the SMOD and was the most sensitive to the SMOD at a rate of −0.32 days/day (Figure 6d). In contrast, the GUD was negatively correlated with the SCOD, SCED, and SCD at rates of −0.07 days/day, −0.03 days/day, and −0.04 days/day, respectively (Figure 6a−c). This implies that the GUD was advanced by 0.07 days with a one-day delay in the SCOD, advanced by 0.03 days with a one-day delay in the SCED, advanced by 0.04 days with a one-day extension in the SCD, and postponed by 0.32 days with a one-day delay in the SMOD. This result indicates that the GUD had the strongest sensitivity to the SMOD, followed by the SCOD. The GUD had relatively weak sensitivity to the SCD and SCED.
For steppes, the GUD was significantly negatively correlated (p < 0.01) with the SCOD and SCED, with a SSCOD of −0.16 days/day and a SSCED of −0.09 days/day (Figure 7). For the other three vegetation types, the GUD was more positively sensitive to the SCED than to SCOD. We also found significant negative correlation (p < 0.01) between the GUD and SCD in the steppes (SSCD = −0.09 days/day), but the GUD in meadows, shrubs, and forests was weakly sensitive to the SCD. In addition, for all four vegetation types, a significant positive correlation (p < 0.01) was observed between the GUD and SMOD. The GUD was much more sensitive to SMOD than the other snow cover phenology metrics in the steppes, meadows, and shrubs, with a SSMOD of 0.35 days/day, 0.14 days/day, and 0.25 days/day, respectively. However, for forests, the sensitivity of the GUD to the SMOD (0.08 days/day) was less than that to the SCED (0.10 days/day).
5. Discussion
5.1. Impact of Snow Cover Phenology on GUD
Our study illuminated the close association between the GUD and snow cover phenology on the TP. The response of the GUD to snow cover phenology was inconsistent in space, demonstrating the complex response behaviors of alpine vegetation communities to snow cover change on the TP [67].
In most areas of the TP, the GUD showed a positive response to the SCOD and SCED (Figure S4), implying that the GUD was delayed with a later SCOD and SCED. This result is consistent with previous studies, which can be interpreted as that snow cover inhibits vegetation growth by blocking the entry of photosynthetically active radiation [26,68]. However, we also found a significant negative correlation between the GUD and SCED in some areas of the eastern and central TP (Figure S4), especially for the steppes (Figure 7), indicating that an earlier SCOD and SCED may also postpone the GUD. This result is consistent with the study by Qiao and Wang [69] on the steppe of Inner Mongolia. This is probably because an early SCOD and SCED exposed vegetation to freezing conditions prematurely and reduced soil moisture. Vegetation is not only damaged by the freezing environment but is also unable to absorb snowmelt water in time; therefore, it greens up late. In addition, a stronger relationship was observed between the GUD and SCOD than between the GUD and SCED (Figure 5 and Figure 6). A similar result was also found by Wang et al. [67] in the study of steppes’ and shrubs’ GUD on the TP. Qiao and Wang [69] also concluded there was a stronger correlation between the GUD and SCOD than SCED for a desert steppe in Inner Mongolia. This was probably because the SCOD determines whether the whole snow cover period is early or late, which depends on the climate condition of the year. In addition, the SCOD may affect the physiological indices of grassland vegetation (e.g., leaf area size and root development degree) [18], thus influencing the GUD more.
The SCD on the TP primarily showed a significant negative correlation with the GUD, indicating an earlier GUD with SCD extension (Figure S4). Wang et al. [1] also reported this result in most areas of the TP. The SCD is related to snow amount in the winter. A previous study investigated how changes in snow depth influenced the GUD across temperate China and drew the conclusion that thicker snow cover generally resulted in an earlier GUD [70]. Xie et al. [71] found that the SCD showed a significant positive correlation with snow water equivalent, indicating that a longer SCD stores more water resources in snow. The study of Yu et al. [72] concluded that the GUD was advanced with higher snow water equivalents in February and March in the China–Mongolia–Russia International Economic Corridor. Therefore, there are three possible reasons for the negative correlation between the SCD and GUD. First, a longer SCD, usually accompanied by a thicker snow depth, may provide richer accumulated potential snowmelt water and soil moisture in subsequent growing seasons [73]. Second, thick snow cover, acting as a protective barrier to the soil, can maintain moisture and mitigate the loss of heat [74] and simultaneously prevent vegetation from dehydration, frost, and cold wind damage in winter [20,75]. Third, the soil under deeper snow cover has a higher temperature than that in other areas [76], which can enhance microbial activity and litter decomposition by increasing nutrient availability and soil respiration rates [77]. These three advantages due to a longer SCD encourage vegetation to green-up earlier.
Furthermore, the GUD showed a significant positive response to the SMOD and was more sensitive to changes in the SMOD than the other three snow cover metrics over the TP, indicating that the GUD would be significantly delayed by a later SMOD (Figure S4). The start of snowmelt is associated with warming conditions that facilitate photosynthesis and contribute to the initial increase in soil moisture in alpine regions [39,40]. These conditions provide favorable conditions for vegetation growth. Therefore, early snowmelt during the post-winter or early pre-monsoon period generally leads to an earlier GUD [26,78].
Among different vegetation types, the GUD of the steppes was generally the most sensitive to snow cover phenology (Figure 7). There are two possible reasons for this. First, steppes are usually shorter than other plants. They are more likely to be completely covered by snow, and therefore, tend to be better protected by snow cover in winter [1]. Second, steppes are primarily distributed in arid and semi-arid regions. Their growth depends more on the soil moisture from snowmelt than the other vegetation types [1]. In contrast, shrubs and forests distribute in regions with higher humidity. In these regions, vegetation growth is more dominated by rainfall than by snowmelt [26]. The GUD of these vegetation types had weaker sensitivity to snow cover phenology. Even though meadows are also distributed in dry and wet transition zones, the GUD showed weaker sensitivity to snow cover phenology than steppes and shrubs (Figure 7). This is possibly due to the low temperature induced by snowmelt that inhibits vegetation growth. Meadows prefer thermophilic environments. During the snowmelt period, much of the soil heat is carried away by cold and wet air, leading to very low temperatures, thus adversely affecting vegetation growth [79].
5.2. Roles of Topography and Climate Factors in the Sensitivity of GUD to Snow Cover Phenology
To investigate the influences of topography and climate on the response of the GUD to snow cover phenology, we explored the sensitivity of the GUD to snow cover phenology along elevational gradients and in different climate zones using the pixels at which the correlation between the GUD and snow cover phenology is significant (p < 0.01).
During the period of 2003–2020, the sensitivity of the GUD to snow cover phenology was dependent on elevation in the TP (3000–5800 m asl) (Figure 8). Generally, the GUD showed significant linear correlations with the four snow cover phenology metrics along elevation gradients. The sensitivity of the GUD to the SCOD, SCED, and SCD was relatively weak in the elevation gradients, with absolute values of less than 0.2 days/day. In contrast, the sensitivity of the GUD to the SMOD was relatively strong, especially at high elevations (above 4000 m asl), with an SSMOD of more than 0.2 days/day that increased with elevation.
More precisely, in regions below 4500 m asl, the GUD was positively correlated with the SCOD (Figure 8a), indicating that it advanced with an earlier SCOD. However, the SSCOD of the GUD decreased as elevation increased, and a negative correlation appeared in the regions with elevation between 4000 and 4200 m asl. When surface elevation exceeded 4500 m asl, the GUD showed a negative response to the SCOD (Figure 8a). The SSCOD increased with elevation in this range overall, reaching a significant peak of approximately −0.15 days/day at approximately 5000–5400 m asl, then hitting a low point at approximately 5600 m asl. The SCED barely affected the GUD in most of the regions with elevation below 3800 m, even though positive correlation was observed in some low-elevation zones. Between 3800 and 4600 m asl, the GUD was delayed by approximately 0.03–0.05 days when the SCED was delayed by one day (Figure 8b). Above 4800 m, the GUD and SCED had a negative correlation between each other, and the SSCED increased with increasing elevation. The GUD had a negative correlation with the SCD in almost all elevation subregions, with the SSCD primarily varying within −0.1 days/day (Figure 8c). The GUD was in general more sensitive to changes in the SCD at higher elevation than that at lower elevation. The SSCD reached a relative low value of −0.02 days/day at approximately 4400 m asl. The GUD was primarily positively correlated with the SMOD. The correlation was more significant above 3900 m asl (Figure 8d). With the increase in elevation, the SSMOD gradually increased from approximately 0.2 days/day at 3900 m to approximately 0.6 day/day at 5800 m. This means that with the SMOD advancing by one day, the advance in the GUD increased from 0.2 days at 3900 m asl to 0.6 day at 5800 m asl.
In summary, it was found in this study that the GUD was more sensitive to all four snow cover phenology metrics at higher elevations between 4600 and 5800 m. Similar results were also found by Wang et al. [67] in the TP. In contrast, plants at low elevations are less limited by the growing period, and their growth does not necessarily benefit from early snowmelt [80]. At higher elevations, the decrease in temperature is accompanied by a decrease in precipitation, and vegetation growth is more dependent on snowmelt in arid grassland vegetation.
In general, the complex interaction of climatic conditions leads to dynamic variations in snow cover. Therefore, the response of the GUD to snow cover phenology may also be profoundly influenced by climate [43]. Figure 9 shows the sensitivity of the GUD to snow cover phenology (a–d represent the SCOD, SCED, SCD, and SMOD, respectively) for each of the four vegetation types (1–4 represent steppe, meadow, shrub, and forest, respectively) under different temperature–precipitation gradients.
Overall, the GUDs of all the four vegetation types were weakly sensitive to the SCOD and SCED, with sensitivities ranging −0.6 to 0.6 days/day approximately, varying slightly with the temperature and precipitation gradient (Figure 9a,b). In drier areas, the responses of the GUD to the SCOD and SCED for all vegetation types were the opposite under high-temperature (above 0 °C) to low-temperature (below 0 °C) environments. High temperature and low precipitation can slightly strengthen the positive sensitivity of the GUD to the SCOD and SCED, whereas low temperatures and low rainfall can slightly strengthen the negative sensitivity of the GUD to the SCOD and SCED. Under cold and dry conditions, snow cover starts and ends earlier, leaving the vegetation to be attacked by cold temperatures and winds, thus making it difficult for the vegetation to grow. Conversely, even if precipitation conditions are unfavorable, warmer temperatures can help vegetation take advantage of snowmelt water, thus promoting earlier green-up. In addition, the positive SSCED of the GUD increased slightly under wetter conditions.
The sensitivity of the GUD to the SCD (SSCD) gradually grew negatively with increasing temperature, and a strong positive SSCD also appeared in some high temperature regions (Figure 9c). This means that under the higher temperature, the longer SCD led to greater GUD advancement. A longer SCD, usually accompanied by a thicker snow depth, may potentially provide richer accumulated snowmelt water in the subsequent growing seasons [73]. Warmth promotes the full utilization of snowmelt water and nutrients by vegetation, thus promoting GUD advancement. However, the GUD may also occur earlier, as the SCD is shortened at high temperatures. Exorbitant air temperatures are likely to be accompanied by a reduction in snowfall and the premature melting of snow in spring [81]; thus, a shorter SCD might accelerate the green-up of plants, ultimately leading to a strong positive SSCD to the SCD.
With the increase in precipitation, the sensitivity of the GUD to the SMOD (SSMOD) was strengthened positively for steppes (Figure 9d1) and changed from negative to highly positive for meadows, shrubs, and forests (Figure 9d2–d4). There was also a strong negative sensitivity of the GUD to the SMOD at high temperatures, which was more evident in shrubs and forests than in other vegetations. This suggests that an increase in precipitation contributes to the advancement of the GUD with an earlier SMOD. For alpine steppes occurring in arid and semi-arid regions, the moisture needed for vegetation growth primarily originates from snow cover. More precipitation not only causes earlier snow melting, but also provides more soil moisture, thus enhancing the positive sensitivity of the GUD to the SMOD. Alpine meadows, shrubs, and forests in wetter environments, where vegetation growth depends more on rainfall, rather than snowmelt, are more likely to green up with abundant rainfall. However, if rainfall is insufficient or high temperatures increase water evapotranspiration, even earlier snowmelt may not satisfy the requirement for vegetation to green up. Under these circumstances, the adverse impact of the lack of a direct water source was greater than the beneficial effect of early snowmelt on vegetation growth, resulting in a negative response of the GUD to the SMOD.
6. Conclusions
Under the context of global warming, variations in snow cover inevitably affect the alpine vegetation growth on the TP. Based on the GUD extracted from the NDGI using the CCRmax method and the four satellite-derived snow cover phenology metrics (SCOD, SCED, SCD, and SMOD), we analyzed the spatiotemporal variation of the GUD and snow cover phenology during the period from 2003 to 2020. We also investigated the response of the GUD to snow cover phenology and its interaction with environmental factors across the TP.
The results showed that the GUD was late in the west and early in the east of the TP and that the GUD was advanced in the eastern and delayed in the western part of the TP with the average trend of −0.84 days/year (p < 0.01). The change in the four snow cover phenology metrics on the TP were highly related to elevation. The SCOD and SCED were delayed by 1.53 and 1.88 days/year (p < 0.01), respectively. The SCD was shortened at a rate of −1.22 days/year (p < 0.01), and the SMOD showed an advance trend of −5.71 days/year (p < 0.01) over the TP.
In addition, we found that the GUD had different directions and magnitudes of response to the snow cover phenology over the TP. We also found that the GUD was most affected by the SMOD, followed by the SCOD. In contrast, the SCED and SCD exerted weaker impacts on the GUD. The response of the GUD to snow cover phenology demonstrated that a one-day delay in the SCOD would advance the GUD by 0.07 days, a one-day delay in the SCED would advance the GUD by 0.03 days, a one-day extension in the SCD would advance the GUD by 0.04 days, and a one-day delay in the SMOD would delay the GUD by 0.32 days.
Furthermore, our results indicated that the sensitivity of the GUD to snow cover phenology varied significantly with different vegetation types, topographical gradients, and climate zones. The GUD of alpine steppes had a stronger sensitivity to snow cover phenology metrics, and its responses to the SCOD and SCED were opposite to the GUD of other vegetation types. On the elevation gradient, the GUD was relatively weakly sensitive to the SCOD, SCED and SCD, with the absolute values of sensitivity being approximately less than 0.2 days/day. The sensitivity of the GUD to the SMOD was relatively strong at primarily more than 0.2 days/day. As surface elevation increased, the response of the GUD to the SCOD and SCED changed from positive to negative. The sensitivity of the GUD to the four snow cover phenology metrics was stronger at elevations above 4600 m asl. Furthermore, in dry areas, the response of the GUD in all vegetation types to the SCOD and SCED was the opposite under high-temperature (above 0 °C) to low-temperature (below 0 °C) environments. The sensitivity of the GUD to the SCD was strengthened negatively with the increase in temperature, and the GUD became more positively sensitive to the SMOD with an increase in precipitation.
Our research provides insights into the essential impact of snow cover on spring vegetation growth in the TP and deepens our understanding of terrestrial ecosystem variations under climate change.
Supplementary Materials
The following supporting information can be downloaded at: https://www.mdpi.com/article/10.3390/rs14163909/s1, Figure S1: The schematic diagram of the CCRmax method detecting GUD with smoothed NDGI time series; Figure S2: Comparison between ground-observed and satellite-observed snow cover phenology metrics (SCOD, SCED, and SCD); Figure S3: The interannual trend of the snow cover phenology (SCOD, SCED, SCD, and SMOD) during 2003–2020; Figure S4: Spatial distribution of Pearson’s correlation coefficient between the GUD and four snow cover phenology metrics.
Author Contributions
Conceptualization, Y.H.; methodology, J.X. (Jingyi Xu) and Y.T.; validation, J.X. (Jingyi Xu), Y.T. and J.X. (Jiahui Xu); formal analysis, J.X. (Jingyi Xu), B.Y., Y.H. and J.W.; writing—original draft preparation, J.X. (Jingyi Xu); writing—review and editing, Y.H. and S.S.; visualization, J.X. (Jingyi Xu) and Y.T.; supervision, Y.H.; funding acquisition, Y.H. All authors have read and agreed to the published version of the manuscript.
Funding
This work was supported by the National Natural Science Foundation of China (Grant No. 42071306).
Data Availability Statement
The data that support the findings of this study are available from the website given in the manuscript.
Conflicts of Interest
The authors declare no conflict of interest.
References
- Wang, X.; Wu, C.; Peng, D.; Gonsamo, A.; Liu, Z. Snow cover phenology affects alpine vegetation growth dynamics on the Tibetan Plateau: Satellite observed evidence, impacts of different biomes, and climate drivers. Agric. For. Meteorol. 2018, 256, 61–74. [Google Scholar] [CrossRef]
- Qiu, J. The third pole. Nature 2008, 454, 393–396. [Google Scholar] [CrossRef] [PubMed]
- Chen, D.; Xu, B.; Yao, T.; Guo, Z.; Cui, P.; Chen, F.; Zhang, R.; Zhang, X.; Zhang, Y.; Fan, J.; et al. Assessment of past, present and future environmental changes on the Tibetan Plateau. Chin. Sci. Bull. 2015, 60, 3025–3035. [Google Scholar] [CrossRef]
- Jiang, Y.; Li, D.; Zheng, R. Variation characteristics of snow cover and frozen soil and their relationships with vegetation in the Tibetan Plateau from 1971 to 2016. Trans. Atmos. Sci. 2020, 43, 481–494. [Google Scholar] [CrossRef]
- Wang, Y.; He, Y.; Hou, S. Analysis of the temporal and spatial variations of snow cover over the Tibetan Plateau based on MODIS. J. Glaciol. Geocryol. 2007, 29, 855–861. [Google Scholar] [CrossRef]
- Liu, X.; Chen, R.; Liu, J.; Wang, X.; Zhang, B.; Liu, G. Variation of snow cover and its influence on spring runoff in the source region of Yellow River. Plateau Meteorol. 2020, 39, 226–233. [Google Scholar] [CrossRef]
- Wang, Z.; Wu, R.; Chen, S.; Huang, G.; Liu, G.; Zhu, L. Influence of western Tibetan Plateau summer snow cover on East Asian summer rainfall. J. Geophys. Res. Atmos. 2018, 123, 2371–2386. [Google Scholar] [CrossRef]
- Boike, J.; Roth, K.; Ippisch, O. Seasonal snow cover on frozen ground: Energy balance calculations of a permafrost site near Ny-Alesund, Spitsbergen. J. Geophys. Res. Atmos. 2003, 108, ALT 4-1–ALT 4-11. [Google Scholar] [CrossRef]
- Hou, X.-h.; Niu, Z.; Gao, S. Phenology of forest vegetation in northeast of China in ten years using remote sensing. Spectrosc. Spectr. Anal. 2014, 34, 515–519. [Google Scholar] [CrossRef]
- Gobiet, A.; Kotlarski, S.; Beniston, M.; Heinrich, G.; Rajczak, J.; Stoffel, M. 21st century climate change in the European Alps-A review. Sci. Total Environ. 2014, 493, 1138–1151. [Google Scholar] [CrossRef] [PubMed]
- Zhang, X.; Friedl, M.A.; Schaaf, C.B.; Strahler, A.H.; Hodges, J.C.F.; Gao, F.; Reed, B.C.; Huete, A. Monitoring vegetation phenology using MODIS. Remote Sens. Environ. 2003, 84, 471–475. [Google Scholar] [CrossRef]
- Pettorelli, N.; Vik, J.O.; Mysterud, A.; Gaillard, J.-M.; Tucker, C.J.; Stenseth, N.C. Using the satellite-derived NDVI to assess ecological responses to environmental change. Trends Ecol. Evol. 2005, 20, 503–510. [Google Scholar] [CrossRef]
- Wolkovich, E.M.; Cook, B.I.; Allen, J.M.; Crimmins, T.M.; Betancourt, J.L.; Travers, S.E.; Pau, S.; Regetz, J.; Davies, T.J.; Kraft, N.J.; et al. Warming experiments underpredict plant phenological responses to climate change. Nature 2012, 485, 494–497. [Google Scholar] [CrossRef]
- Cong, N.; Wang, T.; Nan, H.; Ma, Y.; Wang, X.; Myneni, R.B.; Piao, S. Changes in satellite-derived spring vegetation green-up date and its linkage to climate in China from 1982 to 2010: A multimethod analysis. Glob. Change Biol. 2013, 19, 881–891. [Google Scholar] [CrossRef]
- Chen, X.N.; Yang, Y.P. Observed earlier start of the growing season from middle to high latitudes across the Northern Hemisphere snow-covered landmass for the period 2001–2014. Environ. Res. Lett. 2020, 15, 10. [Google Scholar] [CrossRef]
- Chu, L.; Huang, C.; Liu, Q.S.; Liu, G.H. Estimation of winter wheat phenology under the influence of cumulative temperature and soil salinity in the Yellow River Delta, China, using MODIS time-series data. Int. J. Remote Sens. 2016, 37, 2211–2232. [Google Scholar] [CrossRef]
- Richardson, A.D.; Hollinger, D.Y.; Dail, D.B.; Lee, J.T.; Munger, J.W.; O’Keefe, J. Influence of spring phenology on seasonal and annual carbon balance in two contrasting New England forests. Tree Physiol. 2009, 29, 321–331. [Google Scholar] [CrossRef]
- Wang, X.; Wang, T.; Guo, H.; Liu, D.; Zhao, Y.; Zhang, T.; Liu, Q.; Piao, S. Disentangling the mechanisms behind winter snow impact on vegetation activity in northern ecosystems. Glob. Change Biol. 2018, 24, 1651–1662. [Google Scholar] [CrossRef]
- Beniston, M.; Diaz, H.F.; Bradley, R.S. Climatic change at high elevation sites: An overview. Clim. Chang. 1997, 36, 233–251. [Google Scholar] [CrossRef]
- Nobrega, S.; Grogan, P. Deeper snow enhances winter respiration from both plant-associated and bulk soil carbon pools in birch hummock tundra. Ecosystems 2007, 10, 419–431. [Google Scholar] [CrossRef]
- Ibanez, S.; Brun, C.; Millery, A.; Piton, G.; Bernard, L.; Avrillier, J.N.; Gallet, C.; Foulquier, A.; Clement, J.C. Litter and soil characteristics mediate the buffering effect of snow cover on litter decomposition. Plant Soil 2021, 460, 511–525. [Google Scholar] [CrossRef]
- Tomaszewska, M.A.; Nguyen, L.H.; Henebry, G.M. Land surface phenology in the highland pastures of montane Central Asia: Interactions with snow cover seasonality and terrain characteristics. Remote Sens. Environ. 2020, 240, 111675. [Google Scholar] [CrossRef]
- Henry, H.A.L.; Abedi, M.; Alados, C.L.; Beard, K.H.; Fraser, L.H.; Jentsch, A.; Kreyling, J.; Kulmatiski, A.; Lamb, E.G.; Sun, W.; et al. Increased soil frost versus summer drought as drivers of plant biomass responses to reduced precipitation: Results from a globally coordinated field experiment. Ecosystems 2018, 21, 1432–1444. [Google Scholar] [CrossRef]
- Domisch, T.; Martz, F.; Repo, T.; Rautio, P. Let it snow! Winter conditions affect growth of birch seedlings during the following growing season. Tree Physiol. 2019, 39, 544–555. [Google Scholar] [CrossRef]
- Thackeray, C.W.; Fletcher, C.G.; Mudryk, L.R.; Derksen, C. Quantifying the uncertainty in historical and future simulations of Northern Hemisphere spring snow cover. J. Clim. 2016, 29, 8647–8663. [Google Scholar] [CrossRef]
- Paudel, K.P.; Andersen, P. Response of rangeland vegetation to snow cover dynamics in Nepal Trans Himalaya. Clim. Change 2013, 117, 149–162. [Google Scholar] [CrossRef]
- Xie, J.; Kneubuhler, M.; Garonna, I.; Notarnicola, C.; De Gregorio, L.; De Jong, R.; Chimani, B.; Schaepman, M.E. Altitude-dependent influence of snow cover on alpine land surface phenology. J. Geophys. Res. Biogeosci. 2017, 122, 1107–1122. [Google Scholar] [CrossRef]
- Sa, C.L.; Meng, F.H.; Luo, M.; Li, C.H.; Wang, M.L.; Adiya, S.; Bao, Y.H. Spatiotemporal variation in snow cover and its effects on grassland phenology on the Mongolian Plateau. J. Arid Land 2021, 13, 332–349. [Google Scholar] [CrossRef]
- Qi, Y.; Wang, H.W.; Ma, X.F.; Zhang, J.L.; Yang, R. Relationship between vegetation phenology and snow cover changes during 2001-2018 in the Qilian Mountains. Ecol. Indic. 2021, 133, 10. [Google Scholar] [CrossRef]
- Shabanov, N.V.; Liming, Z.; Knyazikhin, Y.; Myneni, R.B.; Tucker, C.J. Analysis of interannual changes in northern vegetation activity observed in AVHRR data from 1981 to 1994. IEEE Trans. Geosci. Remote Sens. 2002, 40, 115–130. [Google Scholar] [CrossRef]
- Shen, M.; Sun, Z.; Wang, S.; Zhang, G.; Kong, W.; Chen, A.; Piao, S. No evidence of continuously advanced green-up dates in the Tibetan Plateau over the last decade. Proc. Natl. Acad. Sci. USA 2013, 110, E2329. [Google Scholar] [CrossRef] [PubMed]
- Beck, P.S.A.; Atzberger, C.; Høgda, K.A.; Johansen, B.; Skidmore, A.K. Improved monitoring of vegetation dynamics at very high latitudes: A new method using MODIS NDVI. Remote Sens. Environ. 2006, 100, 321–334. [Google Scholar] [CrossRef]
- Cao, R.; Chen, J.; Shen, M.; Tang, Y. An improved logistic method for detecting spring vegetation phenology in grasslands from MODIS EVI time-series data. Agric. For. Meteorol. 2015, 200, 9–20. [Google Scholar] [CrossRef]
- Xu, J.; Tang, Y.; Xu, J.; Chen, J.; Bai, K.; Yu, B.; Wu, J.; Huang, Y. Evaluation of vegetation indexes and green-up date extraction methods on the Tibetan Plateau. Remote Sens. 2022, 14, 3160. [Google Scholar] [CrossRef]
- Delbart, N.; Kergoat, L.; Le Toan, T.; Lhermitte, J.; Picard, G. Determination of phenological dates in boreal regions using normalized difference water index. Remote Sens. Environ. 2005, 97, 26–38. [Google Scholar] [CrossRef]
- Gonsamo, A.; Chen, J.M.; Price, D.T.; Kurz, W.A.; Wu, C. Land surface phenology from optical satellite measurement and CO2 eddy covariance technique. J. Geophys. Res. Biogeosci. 2012, 117, 18. [Google Scholar] [CrossRef]
- Wang, C.; Chen, J.; Wu, J.; Tang, Y.; Shi, P.; Black, T.A.; Zhu, K. A snow-free vegetation index for improved monitoring of vegetation spring green-up date in deciduous ecosystems. Remote Sens. Environ. 2017, 196, 1–12. [Google Scholar] [CrossRef]
- Yang, W.; Kobayashi, H.; Wang, C.; Shen, M.; Chen, J.; Matsushita, B.; Tang, Y.; Kim, Y.; Bret-Harte, M.S.; Zona, D.; et al. A semi-analytical snow-free vegetation index for improving estimation of plant phenology in tundra and grassland ecosystems. Remote Sens. Environ. 2019, 228, 31–44. [Google Scholar] [CrossRef]
- Semmens, K.A.; Ramage, J.M. Recent changes in spring snowmelt timing in the Yukon River Basin detected by passive microwave satellite data. Cryosphere 2013, 7, 905–916. [Google Scholar] [CrossRef]
- Xiong, C.; Shi, J.C.; Cui, Y.R.; Peng, B. Snowmelt pattern over high-mountain Asia detected from active and passive microwave remote sensing. IEEE Geosci. Remote Sens. Lett. 2017, 14, 1096–1100. [Google Scholar] [CrossRef]
- Peng, J.; Liu, Z.; Liu, Y.; Wu, J.; Han, Y. Trend analysis of vegetation dynamics in Qinghai–Tibet Plateau using Hurst Exponent. Ecol. Indic. 2012, 14, 28–39. [Google Scholar] [CrossRef]
- Pu, Z.; Xu, L.; Salomonson, V.V. MODIS/Terra observed seasonal variations of snow cover over the Tibetan Plateau. Geophys. Res. Lett. 2007, 34, 6. [Google Scholar] [CrossRef]
- Qin, D.; Liu, S.; Li, P. Snow cover distribution, variability, and response to climate change in western China. J. Clim. 2006, 19, 1820–1833. [Google Scholar] [CrossRef]
- Zhu, J.; Shi, J.; Wang, Y. Subpixel snow mapping of the Qinghai–Tibet Plateau using MODIS data. Int. J. Appl. Earth Obs. Geoinf. 2012, 18, 251–262. [Google Scholar] [CrossRef]
- Vermote, E.F.; Roger, J.C.; Ray, J.P. MODIS Surface Reflectance Collection 6 User’s Guide. Available online: https://modis-land.gsfc.nasa.gov/pdf/MOD09_UserGuide_v1.4.pdf (accessed on 8 December 2020).
- Holben, B.N. Characteristics of maximum-value composite images from temporal AVHRR data. Int. J. Remote Sens. 1986, 7, 1417–1434. [Google Scholar] [CrossRef]
- Chen, J.; Jönsson, P.; Tamura, M.; Gu, Z.; Matsushita, B.; Eklundh, L. A simple method for reconstructing a high-quality NDVI time-series data set based on the Savitzky–Golay filter. Remote Sens. Environ. 2004, 91, 332–344. [Google Scholar] [CrossRef]
- Savitzky, A.; Golay, M.J.E. Smoothing and differentiation of data by simplified least squares procedures. Anal. Chem. 1964, 36, 1627–1639. [Google Scholar] [CrossRef]
- Shen, M.G.; Zhang, G.X.; Cong, N.; Wang, S.P.; Kong, W.D.; Piao, S.L. Increasing altitudinal gradient of spring vegetation phenology during the last decade on the Qinghai-Tibetan Plateau. Agric. For. Meteorol. 2014, 189, 71–80. [Google Scholar] [CrossRef]
- Huang, Y.; Liu, H.X.; Yu, B.L.; Wu, J.P.; Kang, E.L.; Xu, M.; Wang, S.J.; Klein, A.; Chen, Y.N. Improving MODIS snow products with a HMRF-based spatio-temporal modeling technique in the Upper Rio Grande Basin. Remote Sens. Environ. 2018, 204, 568–582. [Google Scholar] [CrossRef]
- Huang, Y.; Xu, J.; Xu, J.; Zhao, Y.; Yu, B.; Liu, H.; Wang, S.; Xu, W.; Wu, J.; Zheng, Z. HMRFS-TP: Long-term daily gap-free snow cover products over the Tibetan Plateau from 2002 to 2021 based on Hidden Markov Random Field model. Earth Syst. Sci. Data Discuss. 2022, 2022, 1–27. [Google Scholar] [CrossRef]
- Xiong, C.; Shi, J.; Yao, R.; Lei, Y.; Pan, J. Snowmelt Onset Time of High Mountain Asia (1979–2018); National Tibetan Plateau Data Center: Beijing, China, 2020. [Google Scholar] [CrossRef]
- Zeng, L.L.; Wardlow, B.D.; Xiang, D.X.; Hu, S.; Li, D.R. A review of vegetation phenological metrics extraction using time-series, multispectral satellite data. Remote Sens. Environ. 2020, 237, 20. [Google Scholar] [CrossRef]
- Lu, L.L.; Wang, C.Z.; Guo, H.D.; Li, Q.T. Detecting winter wheat phenology with SPOT-VEGETATION data in the North China Plain. Geocarto Int. 2014, 29, 244–255. [Google Scholar] [CrossRef]
- Piao, S.L.; Fang, J.Y.; Zhou, L.M.; Ciais, P.; Zhu, B. Variations in satellite-derived phenology in China’s temperate vegetation. Glob. Change Biol. 2006, 12, 672–685. [Google Scholar] [CrossRef]
- Tan, B.; Morisette, J.T.; Wolfe, R.E.; Gao, F.; Ederer, G.A.; Nightingale, J.; Pedelty, J.A. An enhanced TIMESAT algorithm for estimating vegetation phenology metrics from MODIS data. IEEE J. Sel. Top. Appl. Earth Obs. Remote Sens. 2011, 4, 361–371. [Google Scholar] [CrossRef]
- Huang, K.; Zhang, Y.; Tagesson, T.; Brandt, M.; Wang, L.; Chen, N.; Zu, J.; Jin, H.; Cai, Z.; Tong, X.; et al. The confounding effect of snow cover on assessing spring phenology from space: A new look at trends on the Tibetan Plateau. Sci. Total Environ. 2021, 756, 144011. [Google Scholar] [CrossRef]
- Li, N.; Zhan, P.; Pan, Y.Z.; Zhu, X.F.; Li, M.Y.; Zhang, D.J. Comparison of remote sensing time-series smoothing methods for grassland spring phenology extraction on the Qinghai-Tibetan Plateau. Remote Sens. 2020, 12, 3383. [Google Scholar] [CrossRef]
- Chen, X.; Long, D.; Hong, Y.; Hao, X.; Hou, A. Climatology of snow phenology over the Tibetan plateau for the period 2001-2014 using multisource data. Int. J. Climatol. 2018, 38, 2718–2729. [Google Scholar] [CrossRef]
- Guo, H.; Wang, X.Y.; Guo, Z.C.; Chen, S.Y. Assessing snow phenology and its environmental driving factors in Northeast China. Remote Sens. 2022, 14, 262. [Google Scholar] [CrossRef]
- Chen, X.N.; Long, D.; Liang, S.L.; He, L.; Zeng, C.; Hao, X.H.; Hong, Y. Developing a composite daily snow cover extent record over the Tibetan Plateau from 1981 to 2016 using multisource data. Remote Sens. Environ. 2018, 215, 284–299. [Google Scholar] [CrossRef]
- Luo, J.F.; Dong, C.Y.; Lin, K.R.; Chen, X.H.; Zhao, L.Q.; Menzel, L. Mapping snow cover in forests using optical remote sensing, machine learning and time-lapse photography. Remote Sens. Environ. 2022, 275, 14. [Google Scholar] [CrossRef]
- Sen, P.K. Estimates of the regression coefficient based on Kendall’s tau. J. Am. Stat. Assoc. 1968, 63, 1379–1389. [Google Scholar] [CrossRef]
- Theil, H. A Rank-Invariant Method of Linear and Polynomial Regression Analysis. In Henri Theil’s Contributions to Economics and Econometrics: Econometric Theory and Methodology; Raj, B., Koerts, J., Eds.; Springer: Dordrecht, The Netherlands, 1992; pp. 345–381. [Google Scholar] [CrossRef]
- Kendall, M.G. A new measure of rank correlation. Biometrika 1938, 30, 81–93. [Google Scholar] [CrossRef]
- Li, H.D.; Li, Y.K.; Gao, Y.Y.; Zou, C.X.; Yan, S.G.; Gao, J.X. Human impact on vegetation dynamics around Lhasa, Southern Tibetan Plateau, China. Sustainability 2016, 8, 1146. [Google Scholar] [CrossRef]
- Wang, S.; Wang, X.; Chen, G.; Yang, Q.; Wang, B.; Ma, Y.; Shen, M. Complex responses of spring alpine vegetation phenology to snow cover dynamics over the Tibetan Plateau, China. Sci. Total Environ. 2017, 593–594, 449–461. [Google Scholar] [CrossRef] [PubMed]
- Delbart, N.; Le Toan, T.; Kergoat, L.; Fedotova, V. Remote sensing of spring phenology in boreal regions: A free of snow-effect method using NOAA-AVHRR and SPOT-VGT data (1982–2004). Remote Sens. Environ. 2006, 101, 52–62. [Google Scholar] [CrossRef]
- Qiao, D.; Wang, N. Relationship between winter snow cover dynamics, climate and spring grassland vegetation phenology in Inner Mongolia, China. ISPRS Int. J. Geo-Inf. 2019, 8, 42. [Google Scholar] [CrossRef]
- Chen, S.L.; Huang, Y.F.; Wang, G.Q. Response of vegetation carbon uptake to snow-induced phenological and physiological changes across temperate China. Sci. Total Environ. 2019, 692, 188–200. [Google Scholar] [CrossRef] [PubMed]
- Xie, J.; Kneubuhler, M.; Garonna, I.; de Jong, R.; Notarnicola, C.; De Gregorio, L.; Schaepman, M.E. Relative influence of timing and accumulation of snow on alpine land surface phenology. J. Geophys. Res.-Biogeosci. 2018, 123, 561–576. [Google Scholar] [CrossRef]
- Yu, L.X.; Yan, Z.R.; Zhang, S.W. Forest phenology shifts in response to climate change over China-Mongolia-Russia International Economic Corridor. Forests 2020, 11, 757. [Google Scholar] [CrossRef]
- Peng, S.; Piao, S.; Ciais, P.; Fang, J.; Wang, X. Change in winter snow depth and its impacts on vegetation in China. Glob. Change Biol. 2010, 16, 3004–3013. [Google Scholar] [CrossRef]
- Freppaz, M.; Celi, L.; Marchelli, M.; Zanini, E. Snow removal and its influence on temperature and N dynamics in alpine soils (Vallee d’Aoste, northwest Italy). J. Plant Nutr. Soil Sci. 2008, 171, 672–680. [Google Scholar] [CrossRef]
- Yu, Z.; Liu, S.; Wang, J.; Sun, P.; Liu, W.; Hartley, D.S. Effects of seasonal snow on the growing season of temperate vegetation in China. Glob. Change Biol. 2013, 19, 2182–2195. [Google Scholar] [CrossRef]
- Groffman, P.M.; Driscoll, C.T.; Fahey, T.J.; Hardy, J.P.; Fitzhugh, R.D.; Tierney, G.L. Colder soils in a warmer world: A snow manipulation study in a northern hardwood forest ecosystem. Biogeochemistry 2001, 56, 135–150. [Google Scholar] [CrossRef]
- Monson, R.K.; Lipson, D.L.; Burns, S.P.; Turnipseed, A.A.; Delany, A.C.; Williams, M.W.; Schmidt, S.K. Winter forest soil respiration controlled by climate and microbial community composition. Nature 2006, 439, 711–714. [Google Scholar] [CrossRef] [PubMed]
- Reed, B.; Budde, M.; Spencer, P.; Miller, A.E. Integration of MODIS-derived metrics to assess interannual variability in snowpack, lake ice, and NDVI in southwest Alaska. Remote Sens. Environ. 2009, 113, 1443–1452. [Google Scholar] [CrossRef]
- Grippa, M.; Kergoat, L.; Le Toan, T.; Mognard, N.M.; Delbart, N.; L’Hermitte, J.; Vicente-Serrano, S.M. The impact of snow depth and snowmelt on the vegetation variability over central Siberia. Geophys. Res. Lett. 2005, 32, 21. [Google Scholar] [CrossRef]
- Xie, J.; Jonas, T.; Rixen, C.; de Jong, R.; Garonna, I.; Notarnicola, C.; Asam, S.; Schaepman, M.E.; Kneubühler, M. Land surface phenology and greenness in Alpine grasslands driven by seasonal snow and meteorological factors. Sci. Total Environ. 2020, 725, 138380. [Google Scholar] [CrossRef] [PubMed]
- Barnett, T.P.; Adam, J.C.; Lettenmaier, D.P. Potential impacts of a warming climate on water availability in snow-dominated regions. Nature 2005, 438, 303–309. [Google Scholar] [CrossRef]
Figure 1.
Spatial distributions of the land cover types on the Tibetan Plateau.

Figure 2.
Flowchart for analyzing the impact of the snow cover phenology on the vegetation GUD.

Figure 3.
The spatiotemporal variation in GUD during 2003–2020. (a) Spatial distribution of annual mean GUD. The line chart in the lower left displays the cumulative percentage of GUD pixels for the four vegetation types. (b) Interannual variation trend of GUD. The map in the lower left shows the significant level of the trend. DOY, day of year.

Figure 4.
The spatial variation in the annual mean snow cover phenology metrics, i.e., (a) SCOD, (b) SCED, (c) SCD, and (d) SMOD, during 2003–2020. Note that DOS represents the day of snow cover season. Thus, DOS 1 is equivalent to DOY 274 (October 1) of last year.
Figure 4.
The spatial variation in the annual mean snow cover phenology metrics, i.e., (a) SCOD, (b) SCED, (c) SCD, and (d) SMOD, during 2003–2020. Note that DOS represents the day of snow cover season. Thus, DOS 1 is equivalent to DOY 274 (October 1) of last year.

Figure 5.
Mean GRG between GUD and snow cover phenology metrics for the pixels with a significant correlation (p < 0.01) (a) over the whole study area and (b) among the four vegetation types.
Figure 5.
Mean GRG between GUD and snow cover phenology metrics for the pixels with a significant correlation (p < 0.01) (a) over the whole study area and (b) among the four vegetation types.

Figure 6.
Sensitivity of GUD to snow cover phenology metrics, i.e., (a) SCOD, (b) SCED, (c) SCD, and (d) SMOD, for the pixels with a significant correlation (p < 0.01). Points are the average GUD and a certain metric of snow cover phenology based on quantile discontinuities of snow cover phenology for the pixel-years. The horizontal and vertical error bars represent the standard deviations of snow cover phenology and the GUD, respectively. The lines are linear regression models of those points, and the slopes of the lines represent the sensitivity. The symbols ** and *** are significant at the levels of 0.05 and 0.01, respectively.

Figure 7.
Sensitivity of GUD to snow cover phenology for the pixels with a significant correlation (p < 0.01) among different vegetation types. The symbols ** and *** are significant at the levels of 0.05 and 0.01, respectively.
Figure 7.
Sensitivity of GUD to snow cover phenology for the pixels with a significant correlation (p < 0.01) among different vegetation types. The symbols ** and *** are significant at the levels of 0.05 and 0.01, respectively.

Figure 8.
Elevational variation of the sensitivity of GUD to (a) SCOD, (b) SCED, (c) SCD, and (d) SMOD for the pixels with a significant correlation (p < 0.01).
Figure 8.
Elevational variation of the sensitivity of GUD to (a) SCOD, (b) SCED, (c) SCD, and (d) SMOD for the pixels with a significant correlation (p < 0.01).

Figure 9.
Variations in GUD sensitivity to the snow cover phenology for the pixels with a significant correlation (p < 0.01) in the four vegetation types along temperature and precipitation gradients. The letters (a–d) represent the sensitivities of GUD to SCOD, SCED, SCD, and SMOD, respectively. The numbers 1–4 represent steppe, meadow, shrub, and forest, respectively.

Publisher’s Note: MDPI stays neutral with regard to jurisdictional claims in published maps and institutional affiliations. |
© 2022 by the authors. Licensee MDPI, Basel, Switzerland. This article is an open access article distributed under the terms and conditions of the Creative Commons Attribution (CC BY) license (https://creativecommons.org/licenses/by/4.0/).
Share and Cite
MDPI and ACS Style
Xu, J.; Tang, Y.; Xu, J.; Shu, S.; Yu, B.; Wu, J.; Huang, Y. Impact of Snow Cover Phenology on the Vegetation Green-Up Date on the Tibetan Plateau. Remote Sens. 2022, 14, 3909. https://doi.org/10.3390/rs14163909
AMA Style
Xu J, Tang Y, Xu J, Shu S, Yu B, Wu J, Huang Y. Impact of Snow Cover Phenology on the Vegetation Green-Up Date on the Tibetan Plateau. Remote Sensing. 2022; 14(16):3909. https://doi.org/10.3390/rs14163909
Chicago/Turabian StyleXu, Jingyi, Yao Tang, Jiahui Xu, Song Shu, Bailang Yu, Jianping Wu, and Yan Huang. 2022. "Impact of Snow Cover Phenology on the Vegetation Green-Up Date on the Tibetan Plateau" Remote Sensing 14, no. 16: 3909. https://doi.org/10.3390/rs14163909
Note that from the first issue of 2016, this journal uses article numbers instead of page numbers. See further details here.