Article

Cooling Effects of Urban Vegetation: The Role of Golf Courses

1
Faculty of Forest Resources and Environmental Management, Vietnam National University of Forestry (VNUF), Xuan Mai, Chuong My, Ha Noi 10018, Vietnam
2
Centre for Terrestrial Ecosystem Science & Sustainability, Harry Butler Institute, Murdoch University, Murdoch, WA 6150, Australia
3
ArborCarbon Pty Ltd., Murdoch University, Murdoch, WA 6150, Australia
4
Agricultural and Forestry Sciences, Murdoch University, Murdoch, WA 6150, Australia
*
Author to whom correspondence should be addressed.
Remote Sens. 2022, 14(17), 4351; https://doi.org/10.3390/rs14174351
Submission received: 12 July 2022 / Revised: 25 August 2022 / Accepted: 27 August 2022 / Published: 1 September 2022

Abstract

:
Increased heat in urban environments, from the combined effects of climate change and land use/land cover change, is one of the most severe problems confronting cities and urban residents worldwide, and requires urgent resolution. While large urban green spaces such as parks and nature reserves are widely recognized for their benefits in mitigating urban heat islands (UHIs), the benefit of urban golf courses is less established. This is the first study to combine remote sensing of golf courses with Morphological Spatial Pattern Analysis (MSPA) of vegetation cover. Using ArborCamTM multispectral, high-resolution airborne imagery (0.3 × 0.3 m), this study develops an approach that assesses the role of golf courses in reducing urban land surface temperature (LST) relative to other urban land-uses in Perth, Australia, and identifies factors that influence cooling. The study revealed that urban golf courses had the second lowest LST (around 31 °C) after conservation land (30 °C), compared to industrial, residential, and main road land uses, which ranged from 35 to 37 °C. They thus have a strong capacity for summer urban heat mitigation. Within the golf courses, distance to water bodies and vegetation structure are important factors contributing to cooling effects. Green spaces comprising tall trees (>10 m) and large vegetation patches have strong effects in reducing LST. This suggests that increasing the proportion of large trees, and increasing vegetation connectivity within golf courses and with other local green spaces, can decrease urban LST, thus providing benefits for urban residents. Moreover, as golf courses are useful for biodiversity conservation, planning for new golf course development should embrace the retention of native vegetation and linkages to conservation corridors.

1. Introduction

Urban development has transformed the land cover of cities causing profound changes in the biological and physical characteristics of the transformed surfaces [1,2]. These changes often result in environmental degradation leading to negative impacts on the quality of life for city dwellers [3]. One of the consequences of urbanization is the relatively higher temperature in urban compared to surrounding peri-urban/rural areas, producing “urban heat islands” (UHIs) [4]. This is due to differences in land use/land cover resulting from human activities. The combined effect of global warming and UHIs is called urban heat [5]. Over recent decades, extreme summer heat has become more frequent across many cities in the world, making urban heat an increasingly important topic in environmental research [6,7]. It is projected that this problem will increase in many regions of the world under the influence of climate change [8] and increased urbanization.
Extreme temperatures have serious impacts on human health, such as heat rash, sunburn, fainting, and heat exhaustion [9,10], which lower the life quality of city dwellers [11]. A large number of deaths related to heat occurred during heat waves in Chicago in 1995, and in 16 European countries in 2003 [9]. Moreover, rising temperatures in urban areas create an uncomfortable environment for residents that results in increasing demand for energy for cooling systems in homes during extreme heat events [12]. Therefore, understanding the spatial distribution of temperature and underlying drivers associated with cooling effects in urban landscapes is a key concern for urban planners.
In order to deal with urban heat issues, studies have been undertaken to identify the dynamics of warming in urban areas [13,14]. In general, an increase in urban green space results in a cooling effect, while impervious land cover leads to a warming effect [15,16]. Impervious surfaces absorb and retain solar energy, with heat slowly released heat back into the atmosphere [17]. In contrast, grass, trees, and other vegetation have a natural heating and cooling cycle that is disrupted by urban structures. Vegetation cools the surrounding area by providing shade and through evapotranspiration [17,18,19]. Shaded surfaces may be 10–25 °C cooler than unshaded surfaces [20]. Evapotranspiration can help reduce peak summer temperatures by 1–5 °C [21]. Therefore, the amount and quality of vegetation in a city can influence the rate of atmospheric CO2 sequestration and the amount of heat that a city retains [22,23,24,25]. Whether urban vegetation occurs as large nature reserves or as more fragmented and less functionally healthy green spaces for purposes other than conservation (such as public parks, golf courses, cemeteries, military bases, hospitals, university campuses, or streetscapes), they are critically important in cooling cities and making them more livable [26]. Therefore, livable city planning should require a flexible approach that takes advantage of all opportunities to retain green spaces, combining efforts both in formal parks and other recreational spaces.
Golf courses are a type of recreational green space established for commercial and public purposes. They are often a controversial land-use due to their heavy use of water, chemical herbicides, and exotic ornamental vegetation, and this has led to criticism from ecologists [27]. However, other studies have emphasized the ecological values of golf courses for biodiversity conservation [28,29] and for enhancing the connectivity of vegetation networks in urban landscapes [30]. Although the rough (out of play) vegetated areas and irrigated lawns in golf courses are expected to play a role in cooling cities, the ecological value of golf courses in reducing urban heat has been largely ignored by ecologists [31].
Remote sensing-based studies have allowed researchers to assess the spatial distribution of Land Surface Temperature (LST) in urban areas and to establish correlations between vegetation and urban LST models [32,33,34,35]. However, most studies have used low and moderate-resolution satellite imageries, such as MODIS or Landsat, to calculate LST as a proxy of urban heat [36,37]. These approaches do not provide information about how vegetation characteristics such as fragmentation, vertical structure, and crown health impact on the local cooling effect. The moderate resolution (30 m) satellite imagery (the Landsat Thematic Mapper (TM)) sensor limits the capacity to detect vegetation of different height classes and their associated LST variability. In contrast, airborne high spatial resolution imagery (0.3 m) has a much greater capacity to detect more detailed vegetation characteristics such as vegetation height classes [38]. Furthermore, studies that have investigated variation in LST among urban formal parks, open spaces, and residential gardens [39,40,41] have not included golf courses as a separate urban land use. Not surprisingly then, urban planners often lack information for planning urban development that can help to reduce heat exposure.
Native vegetation is undervalued and is often lost during urban development unless it is protected in biodiversity reserves. Remnant vegetation in golf courses is often under pressure from players who want trees removed that are close to fairways. There is a need to quantify some of the benefits of this vegetation to the broader community in golf course management plans in the future. Hence, we explore the value of golf courses and their vegetation in reducing LST. This study examines the hypotheses that golf courses in urban landscapes play a role in reducing urban heat, and that vegetation structure (height class and spatial configuration) influences variations in LST in urban landscapes. Using high-resolution airborne ArborCam imagery, we compared the land surface temperature within golf courses with those of other urban land-use categories, and determined the influence of vegetation traits and geographic location on the function of golf courses for urban heat reduction. The study was conducted in the suburbs of Perth, Australia, where many golf courses retain some native vegetation and provide green connectivity in the urban landscape [30]. The research examines the potential of using golf courses as a green space out-side of protected area networks, and will thus inform the planning of vegetation configuration and vegetation management to optimize cooling at the local and city scales.

2. Materials and Methods

2.1. Study Area

2.1.1. General Description

Perth city is located at latitude −31.953512 and longitude 115.857048 (Figure 1). The Perth Metropolitan area covers 6418 km2, with a population density of 317.7 people per square kilometer. The area is in Australia’s southwest corner, a global biodiversity “hotspot” with outstanding natural environments having the highest concentration of rare and endangered species on the entire continent [42,43].
Perth has a Mediterranean-type climate with hot dry summers, lasting from December to late March, and cool wet winters [22]. Extreme heat events (substantial rises in temperature, duration, and frequency of very hot days) have increased in Perth over the past two decades, and are projected to increase in coming years [44]. These events pose health risks for urban citizens especially the elderly, young, sick, and people from lower socio-economic areas [45].
Perth has experienced extensive urban expansion since the 1960s and this has caused sustainability concerns due to the large-scale conversion of natural land to impervious surfaces [46], which can contribute to an increasingly warming urban environment. It is projected that by 2030 the annually averaged warming of this region will be about 0.5 to 1.2 °C above 1986–2005 levels [47]. Therefore, the Western Australian government issued a long-term strategic guide for the development of Perth by 2050, which identified reducing urban heat as one of sixteen aspirations under the strategy for the Planning Commission, and State and Local Government by expanding the tree canopy in high urban heat risk areas [45,48].

2.1.2. Spatial Subdivision

This study focuses on the western suburbs (WESROC suburbs in the south) and the Joondalup suburbs (in the north), covering 16,205 ha (Figure 1). The WESROC suburbs are a group of old suburbs established prior to the first urban development planning of Perth (i.e., pre-1950s), and are located west of the city’s central business district and north of the Swan River. These suburbs are characterized by low to moderate-density residential areas, recreation areas, nature reserves, and wetlands. Joondalup is a younger urban area that was developed as a result of northerly urban expansion following extensive urban development in the 1990s, and is characterized by dense commercial and residential areas. The suburbs of the two subdivisions, established through different times in the history of Perth’s planning with different urban designing styles, are representative of residential suburbs across Perth’s sprawling urban landscape. There are six golf courses in the WESROC suburbs and one in the Joondalup region (Figure 1). The golf courses vary in ownership (public, private, and semi-private), size (small < 40 ha, moderate 40–70 ha, and large > 70 ha), number of holes, and the linkage of golf courses to other vegetation (Table 1). The Lake Claremont Golf Course was converted to parkland in recent years. Images of vegetation and environment are readily available online for the respective golf courses used in this study. Figure 2 shows a typical scene. In general, the tees, fairways, and greens are reticulated and irrigated during the dry season (November to April) from underground aquifers. With declining groundwater supplies and a warming climate, the Golf Course Superintendents Association of Western Australia is collaborating with the Department of Water to assist golf courses to become more water efficient.

2.2. Data Sources and Geospatial Analysis

To provide accurate information about the daytime LST in relation to urban land use, land cover, and vegetation characteristics, the study used multispectral, high-resolution airborne imagery, acquired at ~11:00 to 13:00 h on two typical hot late summer days (10 and 11 March 2020) with a daily maximum temperature at Perth Metro station (number: 009225) of 35.1 °C for both days [49] and calm conditions.
High-resolution RGB, seven-band multispectral, and long wave thermal radiation were acquired concurrently using the custom ArborCamTM vegetation monitoring system (ArborCarbon Pty Ltd., Perth, Australia). Imagery was acquired on dedicated flights using a customized Piper PA-28 aircraft with specifications as described in Table 2.
The ArborCam sensor captures seven distinct narrow multispectral bands strategically located between 450 and 780 nm of the electromagnetic spectrum [50]. Long-wave thermal Infra-red radiation (Thermal IR 7500–14,000 nm) was converted to LST in degrees Celsius by applying a standard emissivity correction across the scene of 0.95 to produce a single-band 32-bit raster, with each pixel representing land surface temperature.
All imagery was orthorectified and radiometrically corrected using a series of propriety image processing workflows. A Digital Surface Model (DSM) was generated using a Structure from Motion processing technique during orthorectification. This DSM was further classified to identify ground surface pixels, which were then interpolated to produce a Digital Terrain Model (DTM). The difference between the DSM and DTM was calculated to determine the Feature Height Model. Final imagery was converted to units of surface reflectance using radiometric targets placed throughout the scene. Finally, vegetation within the scene was classified using a segmentation and supervised classification approach. The ArborCam thermal imaging sensor uses a microbolometer with a spectral range of 7.5–14 µm, and a resolution of 640 × 480 with a 15° × 11° field of view. Thermal radiance is corrected and converted to LST on board the camera using a standard emissivity correction of 0.95, and relative humidity of 50% at 20 °C. Linear temperature data are recorded in 16 bits, with a sensitivity of 0.05 K and a stated accuracy of ±2 °C or ±2%. This is a standard approach for studies of urban land surface temperature. More precise methods of emissivity correction for individual surface materials require the classification of surface materials, which is beyond the scope of the current study. The current study is concerned primarily with the relative differences in LST; therefore, the validation of the reading vs. actual LST is of lesser value.

2.2.1. NDVI Calculation

Normalized Difference Vegetation Index (NDVI) maps were developed by calculating the ratio between the red (R) and near-infrared (NIR) using Equation (1) [51]:
NDVI = (NIR − red)/(NIR + red)

2.2.2. Morphological Spatial Pattern Analysis (MSPA)

Morphological Spatial Pattern Analysis (MSPA) was employed in this research for analysis of spatial configuration of vegetation cover (turf and all other vegetation types) as described previously [52,53,54]. In order to undertake the MSPA analysis, the input data (foreground class) were defined. The binary maps (vegetation and non-vegetation) obtained from the classification of PlanetScope 3B images were used as input data with the vegetation being defined as the foreground pixels (green landscape) in the MSPA approach using the MSPA-Toolbox for ArcGIS. The output of the MSPA analysis includes the seven structural categories belonging to two groups: (1) urban vegetation patches (Cores, Edge, Perforation, and Islets) and (2) urban vegetation paths (Bridges, Branches, and Loops) [52,53,54]. Each of these categories was described at the pixel level [52,53,54] and described in ecological meaning terms based on the concept of “habitat availability” and “graphic theory” [52,53,54], and this can be briefly described as:
  • Core—The availability of interior forest habitat;
  • Islet—The isolated non-Core habitat, or potential stepping stone;
  • Edge—The Edge habitat and Edge effects on interior forest habitat;
  • Perforation—Edge on forest interior;
  • Bridge—The structural connectivity among Core areas;
  • Loop—The structural connectivity within a Core area;
  • Branch—The structural connectivity that departs from a Core area and arrives at a connector, to an Edge, or a Perforation.

2.2.3. Land-Use Data

We selected eight land-use categories representing the main components in the urban landscape, as follows: conservation land (1); golf course (2); green space (3); commercial (4); industrial (5); residential (6); main road (7); and other land-use (8). This selection of land-use categories is comparable to those used in ecological research in other urban landscapes [55,56] and is described in Table 3.

2.3. Statistical Analysis

To address the first objective (variation in LST among land-use categories and among golf courses), LST mean values were derived for each of the eight land-use categories using vector data analysis (zonal statistics) in ArcGIS 10.3 and descriptive statistics in R 3.6.1. The land-use layer (Figure 1) was used to define zonal boundaries.
To address the second objective (factors influencing the cooling effects of golf courses), the variation and correlation of LST with each driving factor were derived. We randomly generated more than 500 random points within the seven golf courses and the study area. Values for each independent variable were assigned to each point using Extract Multi Values to Points tool in ArcGIS 10.3. All geographical analyses were conducted using ArcGis version 10.3 and statistical analyses were performed in R 3.6.1 [58]. Based on the initial description of the relationship between LST and the variables, a multiple linear regression model was built with the F-statistic in R 3.6.1 to describe the effects of vegetation characteristics and geographic location that drive LST.
The explanatory variables examined are listed in Table 4. These variables were subdivided into four groups: vegetation height class, MSPA class, NDVI, and distance to water resources (Table 4). Previous studies have explored the distance to the coast as a factor impacting urban temperature [59]. However, the study area has a network of water bodies, the ocean, the estuary of the Swan River, and groundwater-derived lakes. These water bodies are likely to influence the LST, and thus the distance to the water resources (ocean, lakes, and river) was measured using the near tool in ArcGIS 10.3. The values were added to random points as an independent variable in the regression analysis. The multiple linear regression model was performed in R 3.6.1 [58] to determine the relationship between the dependent variable (LST) and its driving factors (Table 4).
In terms of vegetation variables, previous studies have focused on vegetation cover [59] and vegetation type (grass, shrubs, and trees) [22]. In this study, more details of vertical vegetation structure were explored where vegetation was classified into height classes (Table 4), and spatial vegetation configuration where vegetation was classified into habitat type (MSPA classes) based on the patch size and their connectivity to other vegetation areas and they were added to random points for the regression analysis.

3. Results

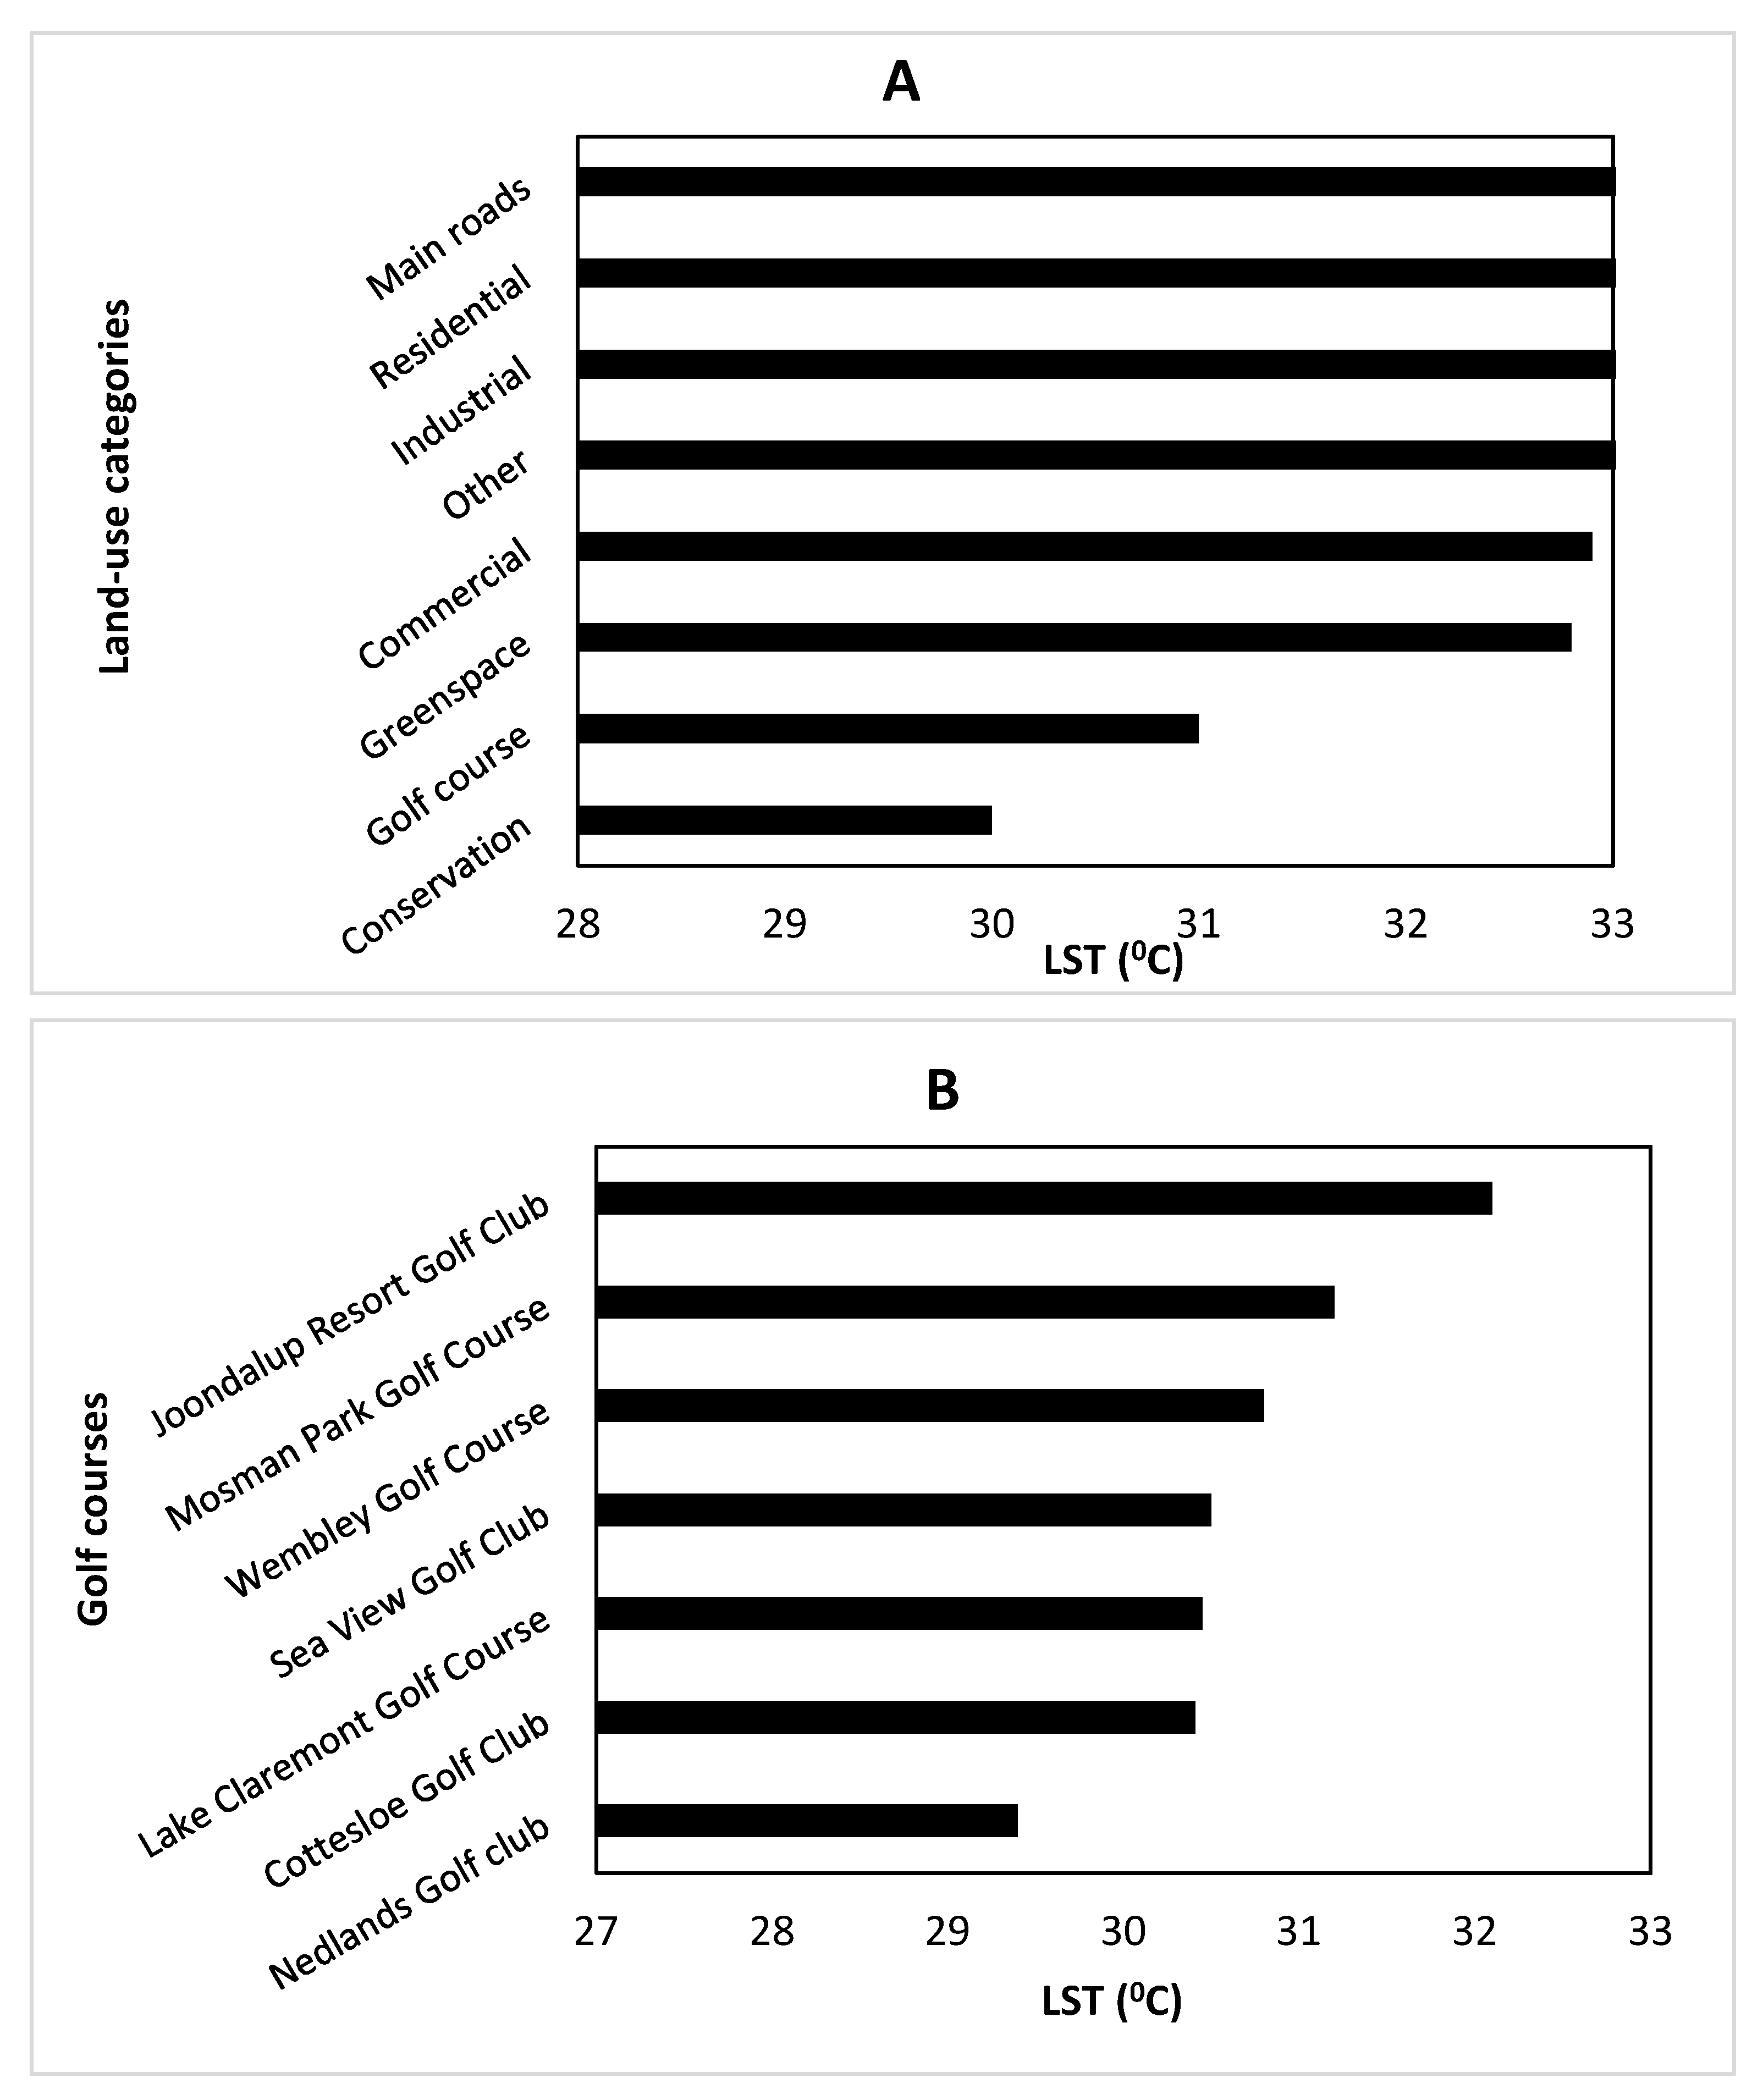
3.1. Variation in LST among Land-Use Categories and among Golf Courses

Overall, the conservation land was the coolest land-use category (mean LST of approximately 30 °C). Golf courses had the second lowest mean LST (around 31 °C) in the study area (Figure 3A), and thus golf courses in high-density urban areas play a role as cool islands (Figure 3B). Joondalup Resort Golf Club is shown as an example (Figure 4). The average LST for industrial, residential, and main road land uses were high, ranging from approximately 35 to 37 °C. The land use types in the order of highest to lowest temperatures were main roads, residential, industrial, other, commercial, green space, golf course, and conservation (Figure 3A).
Notably, the LST differed markedly between golf courses. The highest mean LST occurred within Joondalup Resort Golf Club at about 32 °C (Figure 3B). Nedlands Golf Club had the lowest mean LST among studied golf courses (around 29 °C). Golf courses located nearby the coast (Cottesloe Golf Club, Sea View Golf Club, Lake Claremont Golf Course, and Wembley Golf Course) had similar mean LSTs at about 30 °C. Mosman Park Golf Course had the second highest mean LST (around 31°C) (Figure 3B). These results indicate that the golf courses have different capacities to cool their local environments, and that there may be underlying drivers leading to this variation.

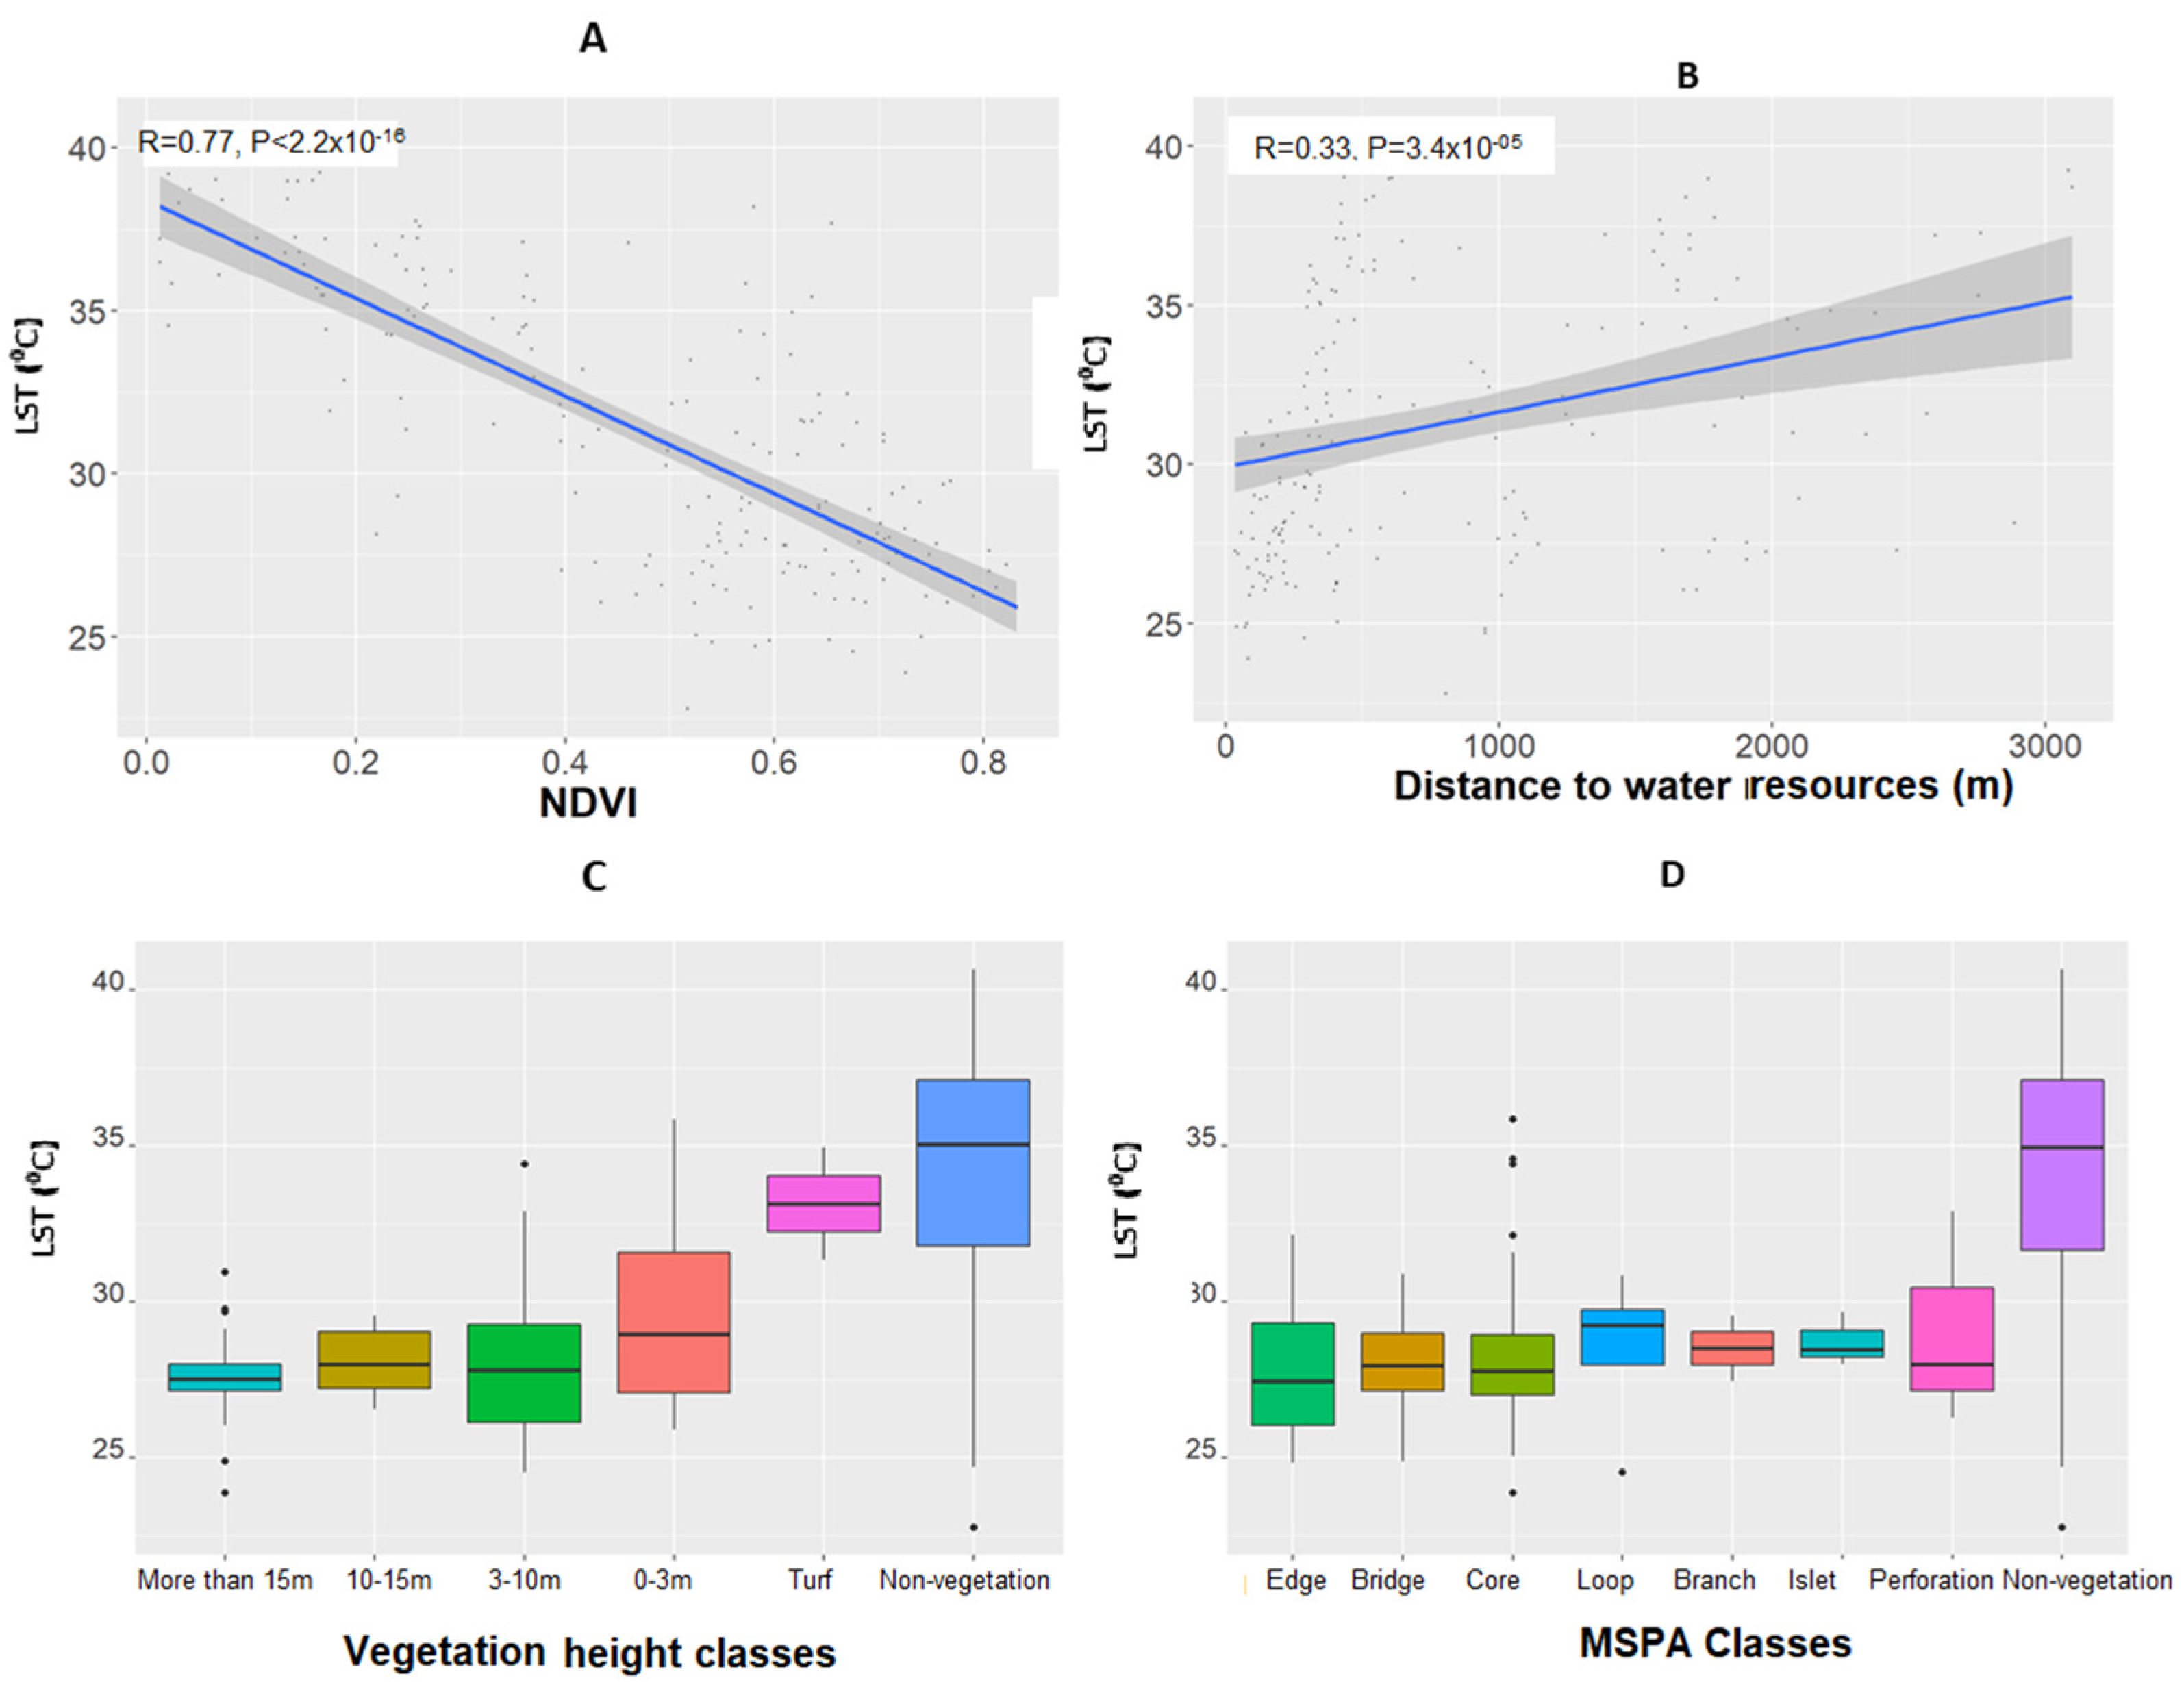
3.2. Factors Influencing Cooling Effects of Golf Courses

There was a positive relationship between LST and distance to water resources (Figure 5B), which indicates the availability of water bodies can be beneficial on hot summer days. Moreover, vegetation characteristics can impact cooling. Figure 5C shows the LST in non-vegetated areas was much higher than any type of vegetation (LST median around 35 °C) indicating the role of vegetation cover in providing a cooling effect. Within areas of vegetation cover, NDVI values reflect vegetation health, and these showed a strong negative relationship with LST (R = 0.77). This means that green, healthy vegetation has a good capacity to cool urban areas (Figure 5A) with the example of Joondalup Resort Golf Club and surrounds illustrated (Figure 4D,F).
However, not all types of vegetation have the same cooling effect. The vertical structure and horizontal configuration of vegetation further determine the capacity of vegetation for cooling. In general, the taller the vegetation the cooler the LST (Figure 5C and Table 5). Vegetation of >10 m height had a median LST of around 27 °C, 0–3 m high vegetation had a mean LST of around 29 °C, and for turf, the LST was around 33 °C (Figure 5C).
The size of vegetation patches and the linkages among them also influence LST (Figure 5D). A large vegetation patch, comprised of the outer Edge and Core categories, had a low LST of 27–28 °C. Moreover, the Bridge class that connects two Cores also had a similar low LST (Figure 5D). The Islet representing small, isolated patches, and the Perforation representing the inner Edge had the highest LST (Figure 5D).
The multiple linear regression model for predicting LST (Thermal = Vegetation Strata + MSPA classes + Distance to water resource + NDVI) had an R-squared value of 0.72 and an adjusted R-squared value of 0.7 with p < 0.0001 indicating that LST was closely related to the vegetation variables and distance to water resources. However, in the subset of vegetation height class variables, only the coefficient of vegetation 10–15 m and >15 m had p-values < 0.05 (Table 5).
Similarly, among MSPA variables, only the classes representing large patches (Core, Edge) had p-values of <0.05 (Table 4). This means that taller vegetation (10–15 m and >15 m) and large patches of vegetation that combine the outer Edge and Core areas had significant effects on LST. Moreover, the multi-regression model further determined that the important factors influencing LST were the health of vegetation indicated by the NDVI value and the distance to water (coefficient p-values < 0.01) (Table 5). This suggests that these six independent variables are statistically significant predictors of the LST.

4. Discussion

4.1. Golf Courses as Cooling Islands in Urban Environments

The study revealed that urban golf courses had lower day-time land surface temperatures than other urban land-use categories, except for conservation land. This means that in a warming climate, golf courses, with most of their surface area covered with a combination of vegetation (shrubs and trees), water bodies, and turf, will be cool-islands and natural havens in cities where most of the surface is dominated by building structures and heat-absorbing hard surfaces. Green spaces in golf courses include irrigated fairways and out-of-play areas, but the cooling effects of golf courses are strongest for woodlands with complex multiple-tiered biomass structures. A similar finding was made for urban green space in Hong Kong [31,60].
In industrial and commercial land uses, the buildings often have flat concrete or metallic roofs, as seen in the aerial imagery. Concrete surfaces have low albedo from 0.1 to 0.35 [61]. In contrast, the vegetation acts as a buffer between the ground and solar radiation, and this helps to reduce the LST [62]. The similarity in LST of golf courses and conservation land can be explained by similar surface characteristics related to their vegetation cover.
Previous studies from Sydney (Australia) and Toronto (Canada) showed that mean temperatures are significantly lower for parks and recreational land uses than for highly intensive urban land-use such as industrial and commercial areas [41,63]. Thus, future changes in land-use from forest and grasslands to new urban developments (industrial, commercial, and residential) are projected to further enhance temperature increases caused by climate change [63]. The UHI problem is serious in Australia’s hotter cities such as Perth, Adelaide, and Alice Springs [64]. This is due to the large proportion of impervious surfaces as a result of urbanization. Other Mediterranean-climate cities are predicted to have increases in average minimum temperatures compared to other rural areas [65]. Therefore, in hot dry climates, urban planning should pay more attention to designing cool islands to mitigate the UHI effect and its impact on city residents. With the cooling effects of golf courses identified in our study, we propose that urban golf courses should be considered as a type of cooling island in urban planning within urban heat mitigation strategies.

4.2. Vegetation Characteristics Influence Cooling Effects of Urban Green Spaces

Previous studies have confirmed the role of vegetation cover in mitigating urban heat [22,47,59], which can help to explain why urban areas without vegetation heat up easily and retain heat [59,66]. The cooling effects of vegetation within urban golf courses have not been well investigated. For example, the study of microclimate at a sub-tropical golf course in Hong Kong only investigated the differential cooling abilities of woodland, a rough grass area, and a bare-concrete rooftop control site within the golf course [31,60]. However, the role of vertical vegetation structure (vegetation height classes) and the spatial arrangement of vegetation patches in cooling urban environments is largely unexplored [67].
By using the high-resolution (0.3 × 0.3 m) airborne imagery, our study provides new insights into the cooling capacities of vegetation of different high classes within golf courses and other green spaces. This study suggests that tall urban forests (>10 m tall) will have the strongest effects in reducing urban heat islands, while shorter vegetation, including turf grass, will be less effective. This provides a new understanding of the relationship between vegetation and urban heat and indicates that urban heat mitigation strategies using green spaces should not solely focus on the extent of vegetation coverage but should also consider the height and vertical structure of the vegetation. Due to the limited space for vegetation in urban areas, it is necessary to maximize the effects of green space by maintaining and increasing the number of big trees to regulate temperature and improve the urban microclimate.
Moreover, our study also explored how vegetation complexity in terms of spatial configuration and arrangement might facilitate the management of urban heat. The results showed stronger cooling effects of large vegetation patches (Core area and their outer Edge) as well as the vegetation paths that link Cores (Bridge) as being more effective vegetation structures than small, isolated patches (Islet). This finding supports previous studies [68,69,70,71] where large patch sizes reduced LST due to greater shading of the periphery. Furthermore, larger vegetation patches have more interior areas, which are less affected by the ambient environment, whereas smaller, isolated patches (Islets) tend to have a greater proportion of edge areas, and thus are vulnerable to disturbance from the peripheral region [67].
In addition, our study revealed that vegetation connectivity and patch size are important when designing urban green space. The connectivity of vegetation cover can contribute to decreasing surface temperature in urban areas [72]. Therefore, increasing urban vegetation, maintaining large patches of vegetation, and reducing insolation can help to decrease urban LST. Hence, urban planning should consider the size and configuration of green spaces to operate as cooling islands without becoming masked by surrounding buildings.
Vegetation health is an important factor influencing its effectiveness in cooling urban areas. Healthy vegetation patches with NDVI values from 0.6 to 0.8 had the strongest cooling effect (Figure 5A). Therefore, together with maintaining water bodies in combination with protecting and restoring big trees in large patches, caring for vegetation health is vital to ensure the cooling effects of green spaces are optimized. Several abiotic and biotic disorders pose a threat to urban tree health with some of these, such as Phytophthora, thriving in irrigated urban parklands [73].
The correlation of LST with impact factors may explain why LST varied among land-use categories. For example, the proportion of vegetation (without turf) was highest on conservation land, and most of the vegetation existing as Core or Bridge areas in this land-use category may explain why the LST was lowest. High vegetation connectivity appears to be an important factor for conservation land having the strongest capacity to reduce urban LST. Vegetation within golf courses that is healthy with a high proportion of tall trees also contributes to the low values of LST in this land-use category. Furthermore, the golf courses were close to or contained water bodies and this helped to mitigate LST in summer in our study.

4.3. Implication for Vegetation Management and Urban Planning

This study suggests that urban vegetation management approaches are required to mitigate urban heat. Golf courses can contribute significantly to the mitigation of LST in urban landscapes. As large trees play an important role in reducing LST, golf course managers and designers should pay attention to the conservation of these trees. It is recommended that golf course managers should not only increase the natural tree canopy by planting more trees, but also actively protect tall trees and large vegetation patches to improve the cooling capacity of golf courses. It is important though to always consider the conflict between turf health and trees when designing or re-designing golf courses. Large trees provide large amounts of shade with potential negative impacts on turf health when insufficient light is received.
Urban expansion on undeveloped land containing large patches of native vegetation that involves tree clearing should embrace tree planting for future cooling effects. This study suggests that increasing the urban tree canopy should benefit heat mitigation. However, it will be difficult to reach targets without promoting planting on private land. Nowhere is this more pressing than in urban environments where there is a scarcity of available land with native vegetation. The regression equation in this study also provides an indication of how temperature can be reduced in other urban land-use categories (e.g., residential, commercial areas) by tree planting and vegetation patch maintenance. Because increasing vegetation coverage is difficult in some dense urban landscapes, measures to improve the quality of existing vegetation patches, such as tall tree conservation and irrigation, are important for mitigating temperature for improving the well-being of city dwellers.
Novel approaches for heat reduction and livable neighborhood policies should embrace the importance of developing incentives that promote multipurpose use of land and that stimulate cooperation among people and different societal sectors to support urban green space maintenance. Golf courses are an example of commercial land that can contribute to urban heat reduction that should be integrated into livable neighborhood policies to improve the life quality of urban citizens.

5. Conclusions

This study develops and demonstrates a robust and objective approach to quantify and compare variation in LST among urban land-use categories. The research used high-resolution multispectral airborne imagery to classify vegetation height classes and this helped to fill gaps in the current literature that compares the LST of different vegetation types. From our study, it is clear that vertical vegetation structure and horizontal vegetation configuration and arrangement are important in urban heat reduction. It is also evident that the vegetation of golf courses can play a beneficial role in helping to reduce urban heating during hot summer days. Effective management of vegetation for urban heat reduction and livable neighborhoods should consider the maintenance of big trees and large patches of vegetation across the urban landscape. Our study is significant because it provides insight into the ecological benefits of recreational green spaces such as golf courses in urban landscapes where such ecological roles are often valued in conservation land. The findings from this study suggest that planning for further urbanization of peri-urban land should consider opportunities for the co-planning of golf course development in conjunction with the retention of functional vegetation corridors.

Author Contributions

T.T.N.: Conceptualization, Methodology, Formal analysis, Investigation, Writing—Original draft, Writing—Review and editing. H.E.: Methodology, Resources, Review and editing. P.B.: Supervision, Conceptualization, Methodology, Resources, Review and editing, Funding acquisition. R.H.: Supervision, Conceptualization, Review and editing. B.D.: Supervision, Conceptualization, Methodology, Review and editing, Funding acquisition. All authors have read and agreed to the published version of the manuscript.

Funding

This work was part of a PhD study by Thi Thu Nguyen made possible by a joint PhD scholarship between Vietnam International Education Development (VIED) and Murdoch University. The costs of the ArborCam Imagery were borne by ArborCarbon Pty Ltd., Perth, Australia.

Data Availability Statement

Not applicable.

Acknowledgments

Naviin Hardy from ArborCarbon Pty Ltd. provided technical support with the high-quality datasets of the airborne imagery. Thanh Trang Pham from the Vietnam National University of Forestry gave advice on data analysis.

Conflicts of Interest

The authors declare no conflict of interest.

References

  1. Al-Manni, A.A.A.; Abdu, A.S.A.; Mohammed, N.A.; Al-Sheeb, A.E. Urban growth and land use change detection using remote sensing and geographic information system techniques in Doha City, State of Qatar. Arab Gulf J. Sci. Res. 2007, 25, 190–198. [Google Scholar]
  2. Anderson, E.C.; Avolio, M.L.; Sonti, N.F.; LaDeau, S.L. More than green: Tree structure and biodiversity patterns differ across canopy change regimes in Baltimore’s urban forest. Urban For. Urban Green. 2021, 65, 127365. [Google Scholar] [CrossRef]
  3. Lin, S.; Sun, J.; Marinova, D.; Zhao, D. Effects of population and land urbanization on China’s environmental impact: Empirical analysis based on the extended STIRPAT model. Sustainability 2017, 9, 825. [Google Scholar] [CrossRef]
  4. O’Malley, C.; Piroozfarb, P.A.E.; Farr, E.R.P.; Gates, J. An Investigation into minimizing urban heat island (UHI) effects: A UK perspective. Energy Procedia 2014, 62, 72–80. [Google Scholar] [CrossRef]
  5. He, B.J.; Wang, J.; Zhu, J.; Qi, J. Beating the urban heat: Situation, background, impacts and the way forward in China. Renew. Sustain. Energy Rev. 2022, 161, 112350. [Google Scholar] [CrossRef]
  6. Ramamurthy, P.; Bou-Zeid, E. Heatwaves and urban heat islands: A comparative analysis of multiple cities. J. Geophys. Res. Atmos. 2016, 122, 2. [Google Scholar] [CrossRef]
  7. Tan, J.; Zheng, Y.; Tang, X.; Guo, C.; Li, L.; Song, G.; Zhen, X.; Yuan, D.; Kalkstein, A.J.; Li, F. The urban heat island and its impact on heat waves and human health in Shanghai. Int. J. Biometeorol. 2010, 54, 75–84. [Google Scholar] [CrossRef]
  8. IPCC. Climate Change 2021: The Physical Science Basis. Contribution of Working Group I to the Sixth Assessment Report of the Intergovernmental Panel on Climate Change; Cambridge University Press: Cambridge, UK, 2021. [Google Scholar]
  9. Baccini, M.; Biggeri, A.; Accetta, G.; Kosatsky, T.; Katsouyanni, K.; Analitis, A.; Anderson, H.R.; Bisanti, L.; D’Ippoliti, D.; Danova, J. Heat effects on mortality in 15 European cities. Epidemiology 2008, 19, 711–719. [Google Scholar] [CrossRef]
  10. Gasparrini, A.; Guo, Y.; Hashizume, M.; Lavigne, E.; Zanobetti, A.; Schwartz, J.; Tobias, A.; Tong, S.; Rocklöv, J.; Forsberg, B. Mortality risk attributable to high and low ambient temperature: A multicountry observational study. Lancet 2015, 386, 369–375. [Google Scholar] [CrossRef]
  11. Heaviside, C.; Macintyre, H.; Vardoulakis, S. The urban heat island: Implications for health in a changing environment. Curr. Environ. Health Rep. 2017, 4, 296–305. [Google Scholar] [CrossRef]
  12. Lundgren-Kownacki, K.; Hornyanszky, E.D.; Chu, T.A.; Olsson, J.A.; Becker, P. Challenges of using air conditioning in an increasingly hot climate. Int. J. Biometeorol. 2018, 62, 401–412. [Google Scholar] [CrossRef] [PubMed] [Green Version]
  13. Jain, S.; Sannigrahi, S.; Sen, S.; Bhatt, S.; Chakraborti, S.; Rahmat, S. Urban heat island intensity and its mitigation strategies in the fast-growing urban area. J. Urban Manag. 2020, 9, 54–66. [Google Scholar] [CrossRef]
  14. He, B.J.; Wang, J.; Liu, H.; Ulpiani, G. Localized synergies between heat waves and urban heat islands: Implications on human thermal comfort and urban heat management. Environ. Res. 2021, 193, 110584. [Google Scholar] [CrossRef] [PubMed]
  15. Aram, F.; García, E.H.; Solgi, E.; Mansournia, S. Urban green space cooling effect in cities. Heliyon 2019, 5, e01339. [Google Scholar] [CrossRef]
  16. Giridharan, R.; Emmanuel, R. The impact of urban compactness, comfort strategies and energy consumption on tropical urban heat island intensity: A review. Sustain. Cities Soc. 2018, 40, 677–687. [Google Scholar] [CrossRef]
  17. Oke, T.R. The energetic basis of the urban heat island. Q. J. R. Meteorol. Soc. 1982, 108, 1–24. [Google Scholar] [CrossRef]
  18. Gunawardena, K.R.; Wells, M.J.; Kershaw, T. Utilising green and bluespace to mitigate urban heat island intensity. Sci. Total Environ. 2017, 584–585, 1040–1055. [Google Scholar] [CrossRef]
  19. Wang, R.; Min, J.; Li, Y.; Hu, Y.; Yang, S. Analysis on seasonal variation and influencing mechanism of land surface thermal environment: A case study of Chongqing. Remote Sens. 2022, 14, 2022. [Google Scholar] [CrossRef]
  20. Akbari, H.; Pomerantz, M.; Taha, H. Cool surfaces and shade trees to reduce energy use and improve air quality in urban areas. Sol. Energy 2001, 70, 295–310. [Google Scholar] [CrossRef]
  21. Akbari, H.; Rosenfeld, A.H.; Taha, H. Summer heat islands, urban trees, and white surfaces. In Proceedings of the 1990 ASHRAE Winter Conference, Atlanta, GA, USA, 10–14 February 2022. [Google Scholar]
  22. Duncan, J.M.A.; Boruff, B.; Saunders, A.; Sun, Q.; Hurley, J.; Amati, M. Turning down the heat: An enhanced understanding of the relationship between urban vegetation and surface temperature at the city scale. Sci. Total Environ. 2019, 656, 118–128. [Google Scholar] [CrossRef] [PubMed]
  23. Wong, N.H.; Yu, C. Study of green areas and urban heat island in a tropical city. Habitat Int. 2005, 29, 547–558. [Google Scholar] [CrossRef]
  24. Zhou, H.X.; Tao, G.X.; Yan, X.Y.; Sun, J.; Wu, Y. A review of research on the urban thermal environment effects of green quantity. J. Appl. Ecol. 2020, 31, 2804–2816. [Google Scholar] [CrossRef]
  25. Baqa, M.F.; Lu, L.; Chen, F.; Nawaz-ul-Huda, S.; Pan, L.; Tariq, A.; Qureshi, S.; Li, B.; Li, Q. Characterizing spatiotemporal variations in the urban thermal environment related to land cover changes in Karachi, Pakistan, from 2000 to 2020. Remote Sens. 2022, 14, 2164. [Google Scholar] [CrossRef]
  26. Alavipanah, S.; Wegmann, M.; Qureshi, S.; Weng, Q.; Koellner, T. The role of vegetation in mitigating urban land surface temperatures: A case study of Munich, Germany during the warm season. Sustainability 2015, 7, 4689–4706. [Google Scholar] [CrossRef]
  27. Guzmán, C.A.P.; Fernández, D.J.M. Environmental impacts by golf courses and strategies to minimize them: State of the art. Int. J. Arts Sci. 2014, 7, 403. [Google Scholar]
  28. Colding, J.; Folke, C. The role of golf courses in biodiversity conservation and ecosystem management. Ecosystems 2009, 12, 191–206. [Google Scholar] [CrossRef]
  29. Terman, M.R. Natural links: Naturalistic golf courses as wildlife habitat. Landsc. Urban Plan. 1997, 38, 183–197. [Google Scholar] [CrossRef]
  30. Nguyen, T.T.; Barber, P.; Harper, R.; Linh, T.V.K.; Dell, B. Vegetation trends associated with urban development: The role of golf courses. PLoS ONE 2020, 15, e0228090. [Google Scholar] [CrossRef]
  31. Fung, C.K.W.; Jim, C.Y. Assessing the cooling effects of different vegetation settings in a Hong Kong golf course. Procedia Environ. Sci. 2017, 37, 626–636. [Google Scholar] [CrossRef]
  32. Deilami, K.; Kamruzzaman, M.; Hayes, J.F. Correlation or causality between land cover patterns and the urban heat island effect? Evidence from Brisbane, Australia. Remote Sens. 2016, 8, 716. [Google Scholar] [CrossRef]
  33. Shandas, V.; Voelkel, J.; Williams, J.; Hoffman, J. Integrating satellite and ground measurements for predicting locations of extreme urban heat. Climate 2019, 7, 5. [Google Scholar] [CrossRef]
  34. Weng, Q. Thermal infrared remote sensing for urban climate and environmental studies: Methods, applications, and trends. ISPRS J. Photogramm. Remote Sens. 2009, 64, 335–344. [Google Scholar] [CrossRef]
  35. Mushore, T.D.; Mutanga, O.; Odindi, J. Determining the influence of long term urban growth on surface urban heat islands using local climate zones and intensity analysis techniques. Remote Sens. 2022, 14, 2060. [Google Scholar] [CrossRef]
  36. Wang, R.; Gao, W.; Peng, W. Downscale MODIS land surface temperature based on three different models to analyze surface urban heat island: A case study of Hangzhou. Remote Sens. 2020, 12, 2134. [Google Scholar] [CrossRef]
  37. Zhang, X.; Friedl, M.A.; Schaaf, C.B.; Strahler, A.H. Climate controls on vegetation phenological patterns in northern mid-and high latitudes inferred from MODIS data. Glob. Change Biol. 2004, 10, 1133–1145. [Google Scholar] [CrossRef]
  38. Evans, B.; Lyons, T.J.; Barber, P.A.; Stone, C.; Hardy, G. Dieback classification modelling using high-resolution digital multispectral imagery and in situ assessments of crown condition. Remote Sens. Lett. 2012, 3, 541–550. [Google Scholar] [CrossRef]
  39. Bokaie, M.; Zarkesh, M.K.; Arasteh, P.D.; Hosseini, A. Assessment of urban heat island based on the relationship between land surface temperature and land use/land cover in Tehran. Sustain. Cities Soc. 2016, 23, 94–104. [Google Scholar] [CrossRef]
  40. Fu, P.; Weng, Q. A time series analysis of urbanization induced land use and land cover change and its impact on land surface temperature with Landsat imagery. Remote Sens. Environ. 2016, 175, 205–214. [Google Scholar] [CrossRef]
  41. Rinner, C.; Hussain, M. Toronto’s urban heat island—Exploring the relationship between land use and surface temperature. Remote Sens. 2011, 3, 1251–1265. [Google Scholar] [CrossRef]
  42. Mittermeier, R.; Gil, P.; Hoffmann, M.; Pilgrim, J.; Brooks, T.; Mittermeier, C.; Lamoreux, J.; Fonseca, G. Hotspots Revisited: Earth’s Biologically Richest and Most Endangered Terrestrial Ecoregions. 2004, Volume 392. Available online: https://www.academia.edu/1438756/Hotspots_revisited_Earths_biologically_richest_and_most_endangered_terrestrial_ecoregions (accessed on 5 June 2021).
  43. Myers, N.; Mittermeier, R.A.; Mittermeier, C.G.; da Fonseca, G.A.B.; Kent, J. Biodiversity hotspots for conservation priorities. Nature 2000, 403, 853–858. [Google Scholar] [CrossRef]
  44. Lawrence, J.; Mackey, B.; Chiew, F.; Costello, M.J.; Hennessy, K.; Lansbury, N.; Nidumolu, U.B.; Pecl, G.; Rickards, L.; Tapper, N.; et al. Australasia. In Climate Change 2022: Impacts, Adaptation, and Vulnerability; Cambridge University Press: Cambridge, UK, 2022. [Google Scholar]
  45. Environmental Protection Authority. Perth and Peel@ 3.5 Million Environmental Impacts, Risks and Remedies; Interim Strategic Advice of the Environmental Protection Authority to the Minister for Environment under Section 16e of the Environmental Protection Act; Environmental Protection Authority: Perth, Australia, 2015. [Google Scholar]
  46. Subas, P.D. Glimpses of sustainability in Perth, Western Australia: Capturing and communicating the adaptive capacity of an activist group. Cons. J. Sustain. Dev. 2014, 11, 167–182. [Google Scholar]
  47. Whetton, P.H.; Grose, M.R.; Hennessy, K.J. A short history of the future: Australian climate projections 1987–2015. Clim. Serv. 2016, 2, 1–14. [Google Scholar] [CrossRef]
  48. The WA Local Government Association (WALGA). 2021/22 Local Government Urban Canopy Grant Program; The WA Local Government Association: Perth, Australia, 2021. [Google Scholar]
  49. Bureau of Meteorology. Daily Maximum Temperature: Perth Metro Station. Available online: http://www.bom.gov.au/jsp/ncc/cdio/weatherData/av?p_nccObsCode=122&p_display_type=dailyDataFile&p_startYear=2019&p_c=-17117203&p_stn_num=009225 (accessed on 20 January 2022).
  50. Warwick-Champion, E.; Davies, K.P.; Paul, B.; Hardy, N.; Bruce, E. Characterising the Aboveground Carbon Content of Saltmarsh in Jervis Bay, NSW, Using ArborCam and PlanetScope. Remote Sens. 2022, 14, 1782. [Google Scholar] [CrossRef]
  51. Tucker, C.J. Red and photographic infrared linear combinations for monitoring vegetation. Remote Sens. Environ. 1979, 8, 127–150. [Google Scholar] [CrossRef]
  52. Pascual-Hortal, L.; Saura, S. Comparison and development of new graph-based landscape connectivity indices: Towards the priorization of habitat patches and corridors for conservation. Landsc. Ecol. 2006, 21, 959–967. [Google Scholar] [CrossRef]
  53. Velázquez, J.; Gutiérrez, J.; García-Abril, A.; Hernando, A.; Aparicio, M.; Sánchez, B. Structural connectivity as an indicator of species richness and landscape diversity in Castilla y León (Spain). For. Ecol. Manag. 2019, 432, 286–297. [Google Scholar] [CrossRef]
  54. Saura, S.; Vogt, P.; Velázquez, J.; Hernando, A.; Tejera, R. Key structural forest connectors can be identified by combining landscape spatial pattern and network analyses. For. Ecol. Manag. 2011, 262, 150–160. [Google Scholar] [CrossRef]
  55. Blair, R.B. Land Use and Avian Species Diversity along an Urban Gradient. Ecol. Appl. 1996, 6, 506–519. [Google Scholar] [CrossRef]
  56. Threlfall, C.G.; Ossola, A.; Hahs, A.K.; Williams, N.S.G.; Wilson, L.; Livesley, S.J. Variation in vegetation structure and composition across urban green space types. Front. Ecol. Evol. 2016, 4, 66. [Google Scholar] [CrossRef]
  57. Department of Planning, Lands and Heritage. State Planning Policy 2.8 Bushland Policy for the Perth Metropolitan Region; Department of Planning, Lands and Heritage: Perth, WA, USA, 2010.
  58. R Core Team. R: A Language and Environment for Statistical Computing Computer Program, Version 3.6.1; R Core Team: Vienna, Austria, 2019; Available online: http://www.R-project.org/ (accessed on 1 May 2021).
  59. Ossola, A.; Jenerette, G.D.; McGrath, A.; Chow, W.; Hughes, L.; Leishman, M.R. Small vegetated patches greatly reduce urban surface temperature during a summer heatwave in Adelaide, Australia. Landsc. Urban Plan. 2021, 209, 104046. [Google Scholar] [CrossRef]
  60. Fung, C.K.W.; Jim, C.Y. Microclimatic resilience of subtropical woodlands and urban-forest benefits. Urban For. Urban Green. 2019, 42, 100–112. [Google Scholar] [CrossRef]
  61. Taha, H. Urban climates and heat islands: Albedo, evapotranspiration, and anthropogenic heat. Energy Build. 1997, 25, 99–103. [Google Scholar] [CrossRef]
  62. Akbari, H.; Bell, R.; Brazel, T.; Cole, D.; Estes, M.; Heisler, G.; Hitchcock, D.; Johnson, B.; Lewis, M.; McPherson, G. Reducing Urban Heat Islands: Compendium of Strategies—Urban Heat Island Basics; Environmental Protection Agency: Washington, DC, USA, 2008; pp. 1–22.
  63. Matthew, A.; Hiep, D.; Toan, T. Impacts of Land-Use Change on Sydney’s Future Temperatures; State of NSW and Office of Environment and Heritage: Sydney, NSW, Australia, 2015.
  64. Yenneti, K.; Ding, L.; Prasad, D.; Ulpiani, G.; Paolini, R.; Haddad, S.; Santamouris, M. Urban overheating and cooling potential in Australia: An evidence-based review. Climate 2020, 8, 126. [Google Scholar] [CrossRef]
  65. Polydoros, A.; Mavrakou, T.; Cartalis, C. Quantifying the trends in land surface temperature and surface urban heat island intensity in Mediterranean cities in view of smart urbanization. Urban Sci. 2018, 2, 16. [Google Scholar] [CrossRef]
  66. Oliveira, S.; Andrade, H.; Vaz, T. The cooling effect of green spaces as a contribution to the mitigation of urban heat: A case study in Lisbon. Build. Environ. 2011, 46, 2186–2194. [Google Scholar] [CrossRef]
  67. Jiao, M.; Zhou, W.; Zheng, Z.; Wang, J.; Qian, Y. Patch size of trees affects its cooling effectiveness: A perspective from shading and transpiration processes. Agric. For. Meteorol. 2017, 247, 293–299. [Google Scholar] [CrossRef]
  68. Bao, T.; Li, X.; Zhang, J.; Zhang, Y.; Tian, S. Assessing the distribution of urban green spaces and its anisotropic cooling distance on urban heat island pattern in Baotou, China. ISPRS Int. J. Geo-Inf. 2016, 5, 12. [Google Scholar] [CrossRef]
  69. Kong, F.; Yin, H.; James, P.; Hutyra, L.R.; He, H.S. Effects of spatial pattern of greenspace on urban cooling in a large metropolitan area of eastern China. Landsc. Urban Plan. 2014, 128, 35–47. [Google Scholar] [CrossRef]
  70. Kowe, P.; Mutanga, O.; Odindi, J.; Dube, T. Effect of landscape pattern and spatial configuration of vegetation patches on urban warming and cooling in Harare metropolitan city, Zimbabwe. GIScience Remote Sens. 2021, 58, 1–20. [Google Scholar] [CrossRef]
  71. Zhang, X.; Zhong, T.; Feng, X.; Wang, K. Estimation of the relationship between vegetation patches and urban land surface temperature with remote sensing. Int. J. Remote Sens. 2009, 30, 2105–2118. [Google Scholar] [CrossRef]
  72. Xie, M.; Gao, Y.; Cao, Y.; Breuste, J.; Fu, M.; Tong, D. Dynamics and temperature regulation function of urban green connectivity. J. Urban Plan. Dev. 2015, 141, A5014008. [Google Scholar] [CrossRef]
  73. Barber, P.A.; Paap, T.; Burgess, T.I.; Dunstan, W.; Hardy, G.E.S.J. A diverse range of Phytophthora species are associated with dying urban trees. Urban For. Urban Green. 2013, 12, 569–575. [Google Scholar] [CrossRef]
Figure 1. Map showing land use categories and the location of golf courses in the two study regions of the Perth Metropolitan Region.
Remotesensing 14 04351 g001
Figure 2. Typical scene in a golf course in the study region in summer. The irrigated fairway is bordered by corridors of vegetation containing tall trees (Eucalyptus), mid-story trees (Acacia, Agonis), small shrubs, and grasstrees (Xanthorrhoea) (photo by Paul Barber).
Remotesensing 14 04351 g002
Figure 3. Variation in the mean values of LST among (A) land-use categories and (B) the seven golf courses.
Remotesensing 14 04351 g003
Figure 4. Joondalup Resort Golf Club and surrounds: (A) True color orthomosaic; (B) Land-use categories; (C) Vegetation height-strata; (D) Day time LST; (E) MSPA classes; (F) NDVI map. Data were collected in late summer (maximum temperature 35.1 °C) on 10 and 11 March 2020.
Remotesensing 14 04351 g004
Figure 5. Factors affecting Land Surface Temperature: (A) Relationship between LST and NDVI; (B) Relationship between LST and distance to the water resources; (C) Variation in LST among vegetation height classes; (D) Variation in LST among MSPA classes.
Remotesensing 14 04351 g005
Table 1. Key characteristics of the seven golf courses.
No.Name of Golf CourseSize (ha)Linkage to Other VegetationGolf Course TypeNumber of Holes
1Joondalup Resort Golf Club108.93NoSemi-private36
2Wembley Golf Course128.96YesPublic36
3Cottesloe Golf Club61.26YesPrivate18
4Lake Claremont Golf Course4.13YesPublic9
5Sea View Golf Club18.1NoPrivate9
6Nedlands Golf Club18NoPrivate9
7Mosman Park Golf Course24.8YesSemi-private9
Table 2. Acquisition parameters and resulting image Ground Sample Distance (GSD) for each of the imaging sensors for the two study areas.
WESROCJoondalup
Acquisition date10 March 202010 and 11 March 2020
Acquisition height2440 m3048 m
High-resolution RGB:GSD0.08 m0.1 m
Multispectral: GSD0.24 m0.3 m
Thermal: GSD1.0 m1.25 m
Table 3. Description of land-use categories.
No.Land-Use CategoryDescription
1ConservationLand of Bush Forever areas (described by Department of Planning [57]); areas of biodiversity conservation significance within National Parks and State and other, conservation reserves, and all classified environmental conditions, special control areas, which are of conservation concerns as dedicated in the Regional Scheme map, Regional Special Area map, and Local Scheme map as well as small-parks from the OSM platform.
2Golf courseGolf courses are a special type of urban green space used for recreational and commercial purposes. In this study golf courses are separated for comparison with all other urban green spaces. There are 7 golf courses distributed in the study area, which are described in Figure 1 and Table 1.
3Green spaceThe urban parks and other land used as set aside areas for public open space, provide for a range of active and passive recreation uses.
4CommercialThe land is used to provide for a range of shops, offices, restaurants, and other commercial outlets in defined townsites or activity centers, a wide variety of active uses on a street level; a mix of varied but compatible land uses such as offices, showrooms, amusement centers, eating establishments, and appropriate industrial activities.
5IndustrialLand of industrial activities to provide a broad range of industrial uses, service and storage activities.
6ResidentialLand-use areas provide for a range of housing and a choice of residential densities to meet the needs of the community by facilitating and encouraging high-quality design, built form, and streetscapes throughout residential areas.
7Main roadThe planned road network of the Western Australian Road (under the Main Roads Act 1930), and the planning responsibilities are shared by the Western Australian Planning Commission and local governments.
8Other land-useThe land-use categories that are not classified as those above. They include designated land for future industrial development, urban development, transitional zone following the lifting of an urban deferred zoning, land of educational institutions, a broad range of essential public facilities such as halls, theatres, art galleries, educational, health and social care facilities, accommodation for the aged, other services, and other mixed land-use.
Table 4. Independent variables considered in the multivariate model of LST within golf courses and other land use categories. The MSPA descriptors are the same as published by the original workers [52,53,54].
VariableDescription
Vegetation height class
   TurfThe top layer of a grassy area
   0–3 mVegetation of 0–3 m height
   3–10 mVegetation of 3–10 m height
   10–15 mVegetation of 10–15 m height
   >15 mVegetation of >15 m height
MSPA Class
   BridgeThe ecological vegetation that connects two Cores, which is equivalent to the connecting corridor
   CoreLarge-scale natural patches with high connectivity
   EdgeThe transition zone between vegetation and non-vegetation areas
   IsletSmall natural patches that are isolated and do not connect to each other
   LoopConnecting corridor inside a large natural patch
   PerforationUnnatural patch inside the Core area
Distance to water resourceThe shortest distance from the sample point to the water resources (lake, river, and coast)
NDVINormalized Difference Vegetation Index: NDVI = (NIR − RED)/NIR + RED)
NIR—reflectance in the near-infrared spectrum
RED—reflectance in the red range of the spectrum
Table 5. Estimates for each independent variable from the multivariate model for predicting the LST.
VariableCoefficientStd. Errorz ValuePr (>|Z|)
Intercept3.830 × 1012.006 × 10019.094<2 × 10⁻¹⁶ ***
Vegetation strata
  Non-vegetation1.640 × 10−21.177 × 1000.0140.98889
  Turf1.501 × 1002.033 × 1000.7380.46142
  3–10 m−1.353 × 1007.696 × 10−1−1.7580.08057
  10–15 m−2.068 × 1008.442 × 10−1−2.4500.01531 *
  >15 m−1.953 × 1008.410 × 10−1−2.3220.02140 *
MSPA Class
  Bridge−1.408 × 1001.815 × 100−0.7760.43904
  Core−2.774 × 1001.741 × 100−1.5930.011305 *
  Edge−4.151 × 1001.862 × 100−2.2300.02709 *
  Islet2.656 × 10−12.166 × 1000.1230.90253
  Loop−8.312 × 10−12.106 × 1000.3950.69363
  Perforation2.535 × 1002.206 × 1001.1490.25228
NDVI−1.109 × 1011.011 × 100−10.968<2 × 10⁻¹⁶ ***
Distance to water resource8.072 × 10−42.525 × 10−43.1960.00166 **
*** p < 0.001; ** p < 0.01; * p < 0.05.
Publisher’s Note: MDPI stays neutral with regard to jurisdictional claims in published maps and institutional affiliations.

