
Water Surface Mapping from Sentinel-1 Imagery Based on Attention-UNet3+: A Case Study of Poyang Lake Region


1
Key Laboratory of Digital Earth Science, Aerospace Information Research Institute, Chinese Academy of Sciences, Beijing 100094, China
2
International Research Center of Big Data for Sustainable Development Goals, Beijing 100094, China
3
College of Resources and Environment, University of Chinese Academy of Sciences, Beijing 100049, China
*
Author to whom correspondence should be addressed.
Remote Sens. 2022, 14(19), 4708; https://doi.org/10.3390/rs14194708
Submission received: 22 August 2022
/
Revised: 15 September 2022
/
Accepted: 16 September 2022
/
Published: 21 September 2022
(This article belongs to the Special Issue SAR in Big Data Era II)
Abstract
:The mapping of water surfaces is important for water resource and flood monitoring. Synthetic Aperture Radar (SAR) images can be used to monitor water bodies and detect floods over large areas. To address the problem of low identification accuracy in different time phases and different scales of water area, a water surface mapping method based on Attention-UNet3+ with SAR images is proposed in this paper. In the model, full-scale skip connections are introduced for combining feature maps from different scales and improving the accuracy of narrow water identification; the spatial attention module is used to obtain the importance of each connected feature, which can reduce the number of false alarms caused by speckle noise and water shadows in SAR data; the deep supervision module is used to learn hierarchical representative features from comprehensive aggregated feature maps to provide the periodic output capability of the model and meet the needs of rapid and large-scale water identification. The effectiveness of Attention-UNet3+ is verified by experiments in the Poyang Lake region with Sentinel-1 SAR images. The results show that the proposed Attention-UNet3+ outperforms the conventional threshold segmentation and deep learning models such as UNet, Deepvlabv3+, and SegNet, with an average IOU/Kappa value of 0.9502/0.9698. Multitemporal Sentinel-1 images in 2021 covering Poyang Lake are used for time series water surface mapping with the proposed method, and it is found that the detected water area of Poyang Lake has a good correlation with the corresponding water level values at observation stations. The Pearson coefficients are about 0.96. The above results indicate that the proposed method achieves good water surface mapping performance.
1. Introduction
Lakes are an important component of terrestrial ecosystems and participate in the water cycle of the ecosystem. They are also water resources and flood control reservoirs, and so play a role in maintaining the ecological balance of river basins and providing water for residents’ domestic use. Lake area is one of the most important parameters of lake morphology, and its changes reflect the local climate and environment, affecting human production and life. Synthetic Aperture Radar (SAR) can work all day and under all weather conditions, and so can provide data for near-real-time monitoring of terrestrial water bodies. Therefore, the use of SAR for surface water monitoring is of great use in the management of water resources and the prevention of flood disasters.
Water identification methods based on SAR can generally be divided into two broad categories—unsupervised classification [1,2,3,4,5,6] and supervised classification [7,8,9,10,11] (including semisupervised classification [12]). Unsupervised methods with adaptive threshold segmentation can achieve fast identification of water bodies, but usually supervised learning methods give better results [13]. Traditional supervised learning extracts multiple features through algorithms such as Gray Level Co-Occurrence Matrix [8,14] and inputs them into classical machine learning algorithms such as random forest. Such methods require the manual selection of features and tuning of parameters, resulting in huge computational and memory costs.
As a branch of machine learning, deep learning algorithms have been widely studied and applied in remote sensing in recent years due to their efficient image feature identification capabilities [15,16,17,18]. Since image-level segmentation models such as FCN [19] and UNet [20] were first proposed, more and more researchers have applied convolutional neural networks to SAR image water identification and monitoring [21,22,23,24].
In order to obtain a higher-accuracy water system map, many researchers have improved the SAR water body identification method. Xu [25] added an attention mechanism to UNet skip connections, and Li [26] built PA-UNet by adding the Spatial Pyramid Pooling (SPP) module on this basis. Ren [27] introduced ResNet-34 and the dual attention mechanism into the encoding process of U-Net. From the experimental results, the use of attention mechanisms and SPP can better perceive global information and reduce large-area wrong segmentation, but the identification ability for narrow waters is weak. Dang [28] incorporated Multiscale Dilated Convolution (MSDC) and Multikernel Max Pooling (MKMP) modules into ResNet, focusing on multiscale and multishape features. Chen et al. [29] proposed a multiscale deep convolutional network, which extracted and generated high-level features through the Multiscale Spatial Feature (MSF) module and the Multilevel and Selective Attention Network (MLSAN), improving the output results based on weighting measures. In these studies, multiscale convolution was used to extract deep-level information of feature maps, but the depth of networks increased, and there were still many false alarms. In addition, some scholars obtained more refined output results at the expense of high computational consumption by paralleling or connecting multiple neural networks in series. Nemni et al. [30] used an XNet that integrates two UNet-like encoding–decoding processes to avoid the loss of water features caused by multiple downsampling encoding. Kim et al. [31] used a parallel-structured HRNet network to simultaneously extract features of different resolutions using the parallel structure. Bai [32] designed BASNet to identify water. The network consists of a Wide-UNet-like network and a Residual Refinement Module (RRM). The first encoding–decoding process obtains the probability map of water body segmentation, and the second learns how the segmentation output differs from the ground truth.
The above studies have made some improvements to deep learning technology to SAR data for water identification, but there are still some deficiencies: (1) the identification accuracy of narrow waters is not high; (2) the false alarm problem caused by radar noise and mountain shadows is not well handled; (3) high-accuracy networks are too complicated and consume lots of computational resources, making it difficult to achieve efficient segmentation.
To address these issues, a water body identification method based on Attention-UNet3+ is proposed in this paper. The Attention-UNet3+ is improved from U-Net. It combines full-scale skip connections, an attention mechanism, and deep supervision. Full-scale skip connections were proposed in 2020 [33]. It is used for image segmentation [34,35] and object detection [36,37]. On this basis, the channel attention mechanism was used to organize the connected multichannel information to obtain better prediction results [38,39]. However, due to the existence of multiple skip connections, the computer memory usage of the model during training is relatively high. Adding an attention module that requires lots of resources may reduce the transfer effect of full-scale skip connections. To tackle this problem, this paper combines a low-resource-demanding spatial attention model with full-scale skip connections.
The main contributions of the research are as follows:
- (1)
- For the problem of low identification accuracy in narrow waters, full-scale skip connections are introduced. This connection transfers and utilizes different scale features in the decoding process, integrating low-level details and high-level semantics in the feature map, which helps the network to extract features in narrow waters
- (2)
- The spatial attention mechanism is used to suppress false alarms in water identification. The mechanism generates a spatial attention coefficient matrix, determines the focus information of the feature map, performs feature sorting and fusion, and suppresses the background irrelevant to water body identification.
- (3)
- Considering the high computational cost and low efficiency of the current high-precision deep learning models, a deep supervision module is added to the model. The staged output of the decoder is used to improve the model efficiency, which enables the model to have fast segmentation capabilities.
The rest of this article is organized as follows. Section 2 introduces our proposed method, including a detailed introduction of Attention-UNet3+. Section 3 presents the study area and data used. Section 4 gives the experimental results of the model and the multitemporal water analysis of the study area. Section 5 and Section 6 contain a discussion of the experimental results and a summary of the article, respectively.
2. Methods
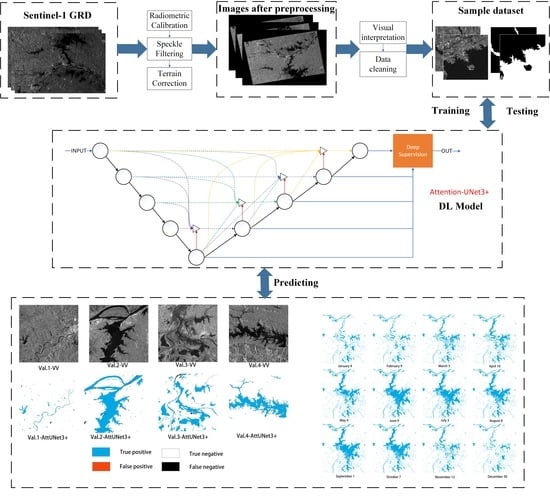
The overall framework of the method in this paper is shown in Figure 1. It includes three main steps: (1) SAR data preprocessing; (2) construction of the deep learning model for water identification, and model training with the sample dataset; and (3) an analysis and evaluation of water identification results. Details will be given later.
2.1. Preprocessing
The data used in this paper are Sentinel-1 GRD. Preprocessing shown in Figure 2 includes radiometric calibration, speckle filtering, and terrain correction. The role of radiometric calibration was to convert the received backscatter signal (DN) into the normalized radar backscatter coefficient (); speckle filtering was performed to reduce the noise inherent in SAR images; terrain radiation correction was completed at the same time as geocoding.
2.2. Model Construction
In this paper, a deep learning model based on semantic segmentation is proposed to identify water surfaces. UNet is a classic semantic segmentation model. In UNet, the encoded features of a single scale are directly received by the decoder, and the skip connection between the encoder and the decoder makes the model perform well in image segmentation. However, for identifying water with variable morphological features, UNet has certain limitations: the scale of skip connections is limited to the same layer information; the shallow layer information is not adjusted; and the decoding and encoding information are directly fused. These problems may cause UNet to be unable to distinguish between water and shoals with similar characteristics, or to exclude interference from radar noise and mountain shadows. In response to these problems, the Attention-UNet3+ model was proposed, which adds the full-scale skip connections that integrate features and an attention gate mechanism that organizes full-scale features based on skip connections.
Figure 3 shows the overall structure of Attention-UNet3+ proposed in this paper. The model is an encoding–decoding structure. The encoder is used to extract the semantic information of the water, and the decoder is used to locate the target and identify the boundary. In the experiments, first, the Attention-UNet3+ model was trained by the sample dataset made of SAR images. Then, the preprocessed SAR images were input into the trained model for segmentation, and binarized water identification results were obtained.
Equations (1) and (2) are expressions of the i-th () feature tensor of in Attention-UNet3+, where C is the convolution operation with ReLu activation function; Dc is double Conv operations; UP is the bilinear upsampling layer; Pool is the maximum pooling layer; {} is the connection layer; and Ag is the attention gate mechanism.
For any , generating needs to integrate all the information into the same scale as , and then use the attention mechanism and skip connections to generate . Taking the generation of as an example (as shown in Figure 4), it is necessary to pool with 4 × 4 and 2 × 2 filters, respectively, and linearly upsample with 2 × 2 and 4 × 4 filters, respectively. Then the gating signal and the skip connection information generate an attention weight matrix, which is multiplied by the skip connection information. Finally, with all the information aggregated, a feature map of size 128 × 128 × 320 is generated as through the convolution with 320 filters of size 3 × 3.
2.2.1. Full-Scale Skip Connections
Full-scale skip connections [33] are improvements proposed based on UNet ordinary connections. UNet is an encoder–decoder structure whose main structure consists of nine convolutional blocks and skip connections. Each convolution block consists of two convolution layers with 64 × n filters of size 3 × 3 (n is the multiple of the feature map resolution relative to the input feature). As shown in Figure 5, the full-scale skip connections connect the encoder and decoder of different scales through resampling and multiple ordinary connections. By capturing fine-grained details and coarse-grained semantics, this module makes up for the low accuracy of convolutional networks in the identification of small water bodies.
In the encoder, Attention-UNet3+ is consistent with UNet. In the decoder, each convolutional layer in this model not only directly receives a feature map of the encoder layer of the same scale but also receives the small-scale decoding layer features by bilinear upsampling and large-scale encoding layer features by max pooling, which means, in the decoder, each convolutional layer receives five feature maps of the same resolution. Due to the use of full-scale connections, each convolutional layer in the decoder is different from the UNet structure. To reduce information redundancy, each convolutional layer in the Attention-UNet3+ decoder consists of 320 filters of size 3 × 3.
2.2.2. Attention Module
Based on full-scale skip connections, an attention gate mechanism [40] with a lower computational burden is used to organize the features and suppress the background irrelevant to water body identification. It is shown in Figure 6. The core of the mechanism is to obtain the spatial attention coefficient matrix of the feature map: the feature map x in the jump connection and the gating signal g are subjected to 1 × 1 two-dimensional convolution (Conv2D) and added. In addition, the spatial attention coefficient matrix () is obtained by the ReLu activation function, 1 × 1 Conv2D, and Sigmoid activation mapping. After that, the feature map is multiplied by the attention matrix, and a coefficient is assigned to each pixel through the attention matrix, so as to determine the focus information of the full-scale feature map, concentrate on the main features of water, and improve the accuracy and stability of water identification.
2.2.3. Deep Supervision
To improve the segmentation efficiency of Attention-UNet3+, deep supervision is adopted in the network, which adds intermediate loss functions to the decoder layers. As shown in Figure 7, the last layer of each decoder stage is fed into a 3 × 3 convolution layer with a sigmoid activation function and bilinear upsampling to output a phased water identification probability map. The extent of model pruning is chosen by balancing accuracy and efficiency in segmentation. Removing irrelevant decoder paths gives the model faster segmentation capability.
To get better results, different outputs are given different weights. The deeper the decoder stage, the higher the weight. By setting the weights, a loss function that mixes the outputs of each decoder stage can be obtained for the backward propagation of the network. The total loss function is as follows:
where is the output of the nth decoder stage, is the loss function of , and is the weight corresponding to . – are the output results of ×4, ×5, ×6, ×7, and ×8, respectively.
2.3. Accuracy Evaluation
The quantitative precision indicators are IOU, Kappa coefficient, F1-score, Precision, and Recall. The above indicators can be calculated based on the confusion matrix. The meaning of each parameter of the confusion matrix is shown in Table 1. The calculation equation of IOU is as follows:
IOU is the ratio of the intersection and union of the prediction and the ground truth.

Table 1.
Confusion matrix diagram.
| Prediction | ||||
|---|---|---|---|---|
| Water | Non-water | Sum | ||
| Ground truth | Water | TP | FN | TP + FN |
| Non-water | FP | TN | FP + TN | |
| Sum | TP + FP | FN + TN | TP + TN + FP + FN | |
The Kappa coefficient is used to measure the spatial consistency of the classification results; its calculation equation is as follows:
where is the overall accuracy, and is the hypothetical probability of chance agreement.
The F1-score is the harmonic mean of precision and recall, with 1 being the best and 0 being the worst:
where precision = is the correct proportion of pixels being divided into water and recall = is the proportion of water pixels being correctly classified.
3. Study Area and Data
3.1. Study Area
Poyang Lake is located in central China at the middle and lower reaches of the Yangtze River. As shown in Figure 8, Poyang Lake is located at 115.78–116.75°E, 28.36–29.75°N. Poyang Lake is the largest freshwater lake in China, with a drainage area of 16,225 km2. Seasonal precipitation in this region varies greatly, resulting in large fluctuations in the overall area of Poyang Lake. During the flood season, from June to July every year, the area of the lake area may expand to more than 3000 km2, and shrink to 1000 km2 in the dry seasons of winter and spring. In terms of water system connection, the five major rivers, the Xiushui River, Ganjiang River, Fuhe River, Xinjiang River, and Raohe River, flow into the lake from south to north, and then flow into the Yangtze River through the mouth of the lake. Therefore, Poyang Lake is a typical seasonal lake and a waterway hub in the middle and lower reaches of the Yangtze River, and plays the role of regulating the water level, conserving water sources, and maintaining regional ecological balance. Poyang Lake is the research area of this paper to test and verify the water identification model. Multitemporal SAR images are used to monitor and analyze the water changes in Poyang Lake.
3.2. Data
3.2.1. SAR Data
In this paper, 24 GRD images of Sentinel-1A IW mode in 12 phases covering Poyang Lake for the whole year of 2021 were used. The polarization mode of the IW mode was VH + VV, the width was 250 km, and the azimuth and range resolutions were 20 m × 22 m. The acquired images were all in ascending orbit mode. The details of the data are given in Table 2.
Compared with VH polarization, in VV polarization, the range of backscattering intensities in vegetation-covered areas is narrower, and the difference in backscattering intensities between non-water and water is greater. Studies have shown that there is not much difference in the classification accuracy of VV and VH polarization. However, the use of VV polarization always leads to higher water identification accuracy [41,42,43] and can identify the submerged features of some water bodies [44]. Therefore, we used the data of VV polarization to make samples and monitor multitemporal water.
3.2.2. Sample Dataset
The sample dataset was used to train and test the proposed model. It is known that a good training dataset is very important for deep learning algorithms to obtain good results. Since the field investigation is time-consuming and labor-intensive for such a large area, Sentinel-1 SAR images and Sentinel-2 optical images with a similar imaging time were collected for building the training dataset by manual interpretation to ensure the high quality of the labeled training dataset.
The sample production steps are shown in Figure 9. First, images of the dry and wet seasons (March, July, and November) in 2020 were collected, and preliminary binary maps of water and non-water were obtained by bimodal threshold segmentation. The binary maps were corrected to obtain the label map based on the Sentinel-1/2 images with visual interpretation. Then the Sentinel-1 images and the label maps were sliced with a window of 256 × 256 pixels in size with an overlap of 30 pixels. Finally, all patches were manually verified to remove those with errors or poorly representative samples.
In the process, Sentinel-2 Modified Normalized Difference Water Index (MNDWI) images were used to facilitate manual interpretation. Compared with other indices such as NDWI, MNDWI uses the shortwave infrared band instead of the near-infrared band used in NDWI [45]. By doing this, the MNDWI captures more subtle water characteristics more stably and reliably, enhancing its ability to suppress the buildup of noise [46].
The total number of training and testing datasets was 5899. The ratio of the training set to the testing set was 8:2. In making samples, the diversity of sample types needs to be a focus. To address the problems of the texture and intensity variations of water in different phases, the samples were selected from the wet and the dry seasons, the proportion of non-water samples was increased, and the proportion of small-scale water samples was increased to improve the overall tributary monitoring. Figure 10 shows the sample patches.
4. Results and Analysis
Using Intel(R) Core(TM) i7-11800H CPU 2.30 GHz, 16 G RAM, RTX 3070, and TensorFlow GPU 2.5.0 framework with Python3.8 as the experimental environment, the rationality and validity of Attention-UNet3+ were verified. Three experiments were designed: (1) Attention-UNet3+ was compared with the commonly used water identification models, to confirm its superiority; (2) The ability of the stage output results of deep supervision was tested to improve the water identification efficiency while ensuring the overall classification effect; (3) Multitemporal SAR data were used to periodically monitor the water in the Poyang Lake area, and to examine the ability to identify large-scale multitemporal waters.
The testing and validation of the models were carried out in four validation areas with different river morphology and different surface environments in the Poyang Lake area in 2021. The expert visual interpretation results were used as the ground truth. The SAR images and the corresponding labels are shown in Figure 11. Val. 1 is the small mountain river. Val. 2 is the plain lake surface in the wet season. Val. 3 is the plain lake surface in the dry season. Val. 4 is the mountain branch lake.
4.1. Comparison of Different Models
Water bodies usually have obvious scattering characteristics in SAR images, but high-accuracy water identification also encounters some difficulties. The main reasons are incomplete identification of small-scale rivers caused by diverse shapes of water bodies and false detection caused by objects with low backscattering coefficients such as mountain shadows and tidal flats. To address these difficulties, full-scale skip connections and the attention mechanism are used to improve the performance of water detection. To quantitatively and qualitatively evaluate the impact of the proposed strategy on model performance, six sets of experiments were designed, as shown below. In the table and figure, TS is the threshold segmentation. Att refers to the network model with the attention mechanism; 3+ represents the full-scale skip connections. The training strategies and samples of other networks such as SegNet [47] and Deeplabv3+ [48] are the same as those of Att-UNet3+.
From the quantitative analysis of the results in Table 3, Table 4 and Table 5, it can be seen that the results of Att-UNet3+ are better than those of other methods, and the results are also the best in the UNet framework. Taking IOU as an example, the attention mechanism improved the accuracy of Att-UNet by 4.76% compared with UNet, and the full-scale connections allowed Att-UNet3+ to improve the accuracy of Att-UNet by 2.78%. Adding the attention mechanism and full-scale connections to the UNet framework to form a full-scale attention gate mechanism effectively improved the water identification accuracy.
Figure 12 shows the results of water identification from different methods in different validation samples. It can be seen from the figure that the results of Val. 2 were relatively good, while the results of 1, 3, and 4 were relatively poor. Because the water in Val. 2 was in a flat area, the features were more obvious, and the shadow of the hill was less obvious. Therefore, it was easy to distinguish water from other ground objects. For Val. 1, the water was all small water bodies, and the river curvature was high, resulting in the omission of water and low accuracy. For Val. 3, this area was the center of Poyang Lake during the dry season. The backscattering coefficient of the exposed tidal flats was relatively low and close to water, which led to the misclassification of water. For Val. 4, there were mountains and many tributaries of the lake, which made it prone to misclassification and loss of the edge. Moreover, because the mountain shadow presented a low-scattering area similar to the water, it was prone to misdetection, resulting in poor identification accuracy.
From the analysis of Figure 12 and Table 3, Table 4 and Table 5, it can be seen by comparing Val. 1, 3, and 4 that Att-UNet3+ was superior to the other water identification models. Att-UNet3+ alleviated the misclassification of water, incomplete identification of narrow rivers, and false alarms of water body shadows. In summary, the attention mechanism and full-scale skip connections improved the network performance to varying degrees, which enabled Attention-UNet3+ to achieve high-accuracy water identification.
4.2. Stage Output Results of Deep Supervision
In practice, it is usually necessary to monitor water bodies over a large area and make large-scale water body thematic maps. Such applications do not pay too much attention to the accuracy of small river identification in the effort to obtain monitoring results quickly. In this regard, the model of this paper introduces a deep supervision module, which enables the model decoder to have the ability to output in stages. By pruning the model and removing irrelevant decoder paths, the efficiency of the model and the computational requirements can be improved, which enables the model to segment quickly.
The parameter quantity, accuracy, and prediction time of processing a 2320 × 2320 pixel image of each stage output of the network module are shown in Table 6, and Figure 13 to demonstrate the effects of stage outputs. It can be seen that, compared with Out5, Out4 led to a 52.02% reduction in prediction time, a 10.07% reduction in parameters, and a 3.48% reduction in IOU.
In terms of other models, SegNet and Deeplabv3+ were selected for comparison. Table 6 lists the results, and Figure 13 demonstrates the prediction time and IOU of deep supervision and the results of SegNet and Deeplabv3+. It can be seen that the Out4 has about 25% higher prediction efficiency with relatively better accuracy. The reason that stage output can significantly improve efficiency is that the number of channels of the feature tensors does not change with the decoding process, but the size of the feature tensors increases. When the amount of feature information reaches a certain level, it may lead to much computational consumption. Therefore, if we choose one of the stage outputs as the model result, it can reach a tradeoff between speed and acceptable accuracy.
As can be seen from Figure 14, using a certain stage output can significantly reduce the segmentation time of the model and the number of computing resources occupied, but also reduces the segmentation accuracy. The decrease in accuracy, in this case, is mainly manifested in the identification of small-scale water and the accurate restoration of water boundaries. It has little effect on the identification of macro-scale water bodies. Therefore, in the case of allowing a certain classification error, the stage output with low model complexity can be selected as the output classification result, so as to achieve the purpose of improving the water identification efficiency.
4.3. Multitemporal Analysis of Poyang Lake
The method proposed based on the Sentinel-1 SAR data was used to monitor the changes in the water body area of Poyang Lake in 2021. As Figure 15 shows, the area of Poyang Lake in 2021 varied greatly. It expanded from 1988.35 km2 in February to 4408.31 km2 in June. After its peak from June to September, the lake shrunk to 1846.79 km2 in December. The water body changes in the local area of Poyang Lake also have certain characteristics: The region of Poyang Lake with the largest area change was the central part, while the north and south contained mostly unchanged water bodies. During the dry season in spring and winter, Poyang Lake shrank significantly, leaving only a few main streams in the lake center and many discontinuities in the basin. During the wet season in summer, the center of the lake expanded to the southeast–northwest direction, with the width of the rivers increasing. The tributaries became more complete, with fewer interruptions.
As shown in Figure 16, the blue histogram is the water area of Poyang Lake identified by the model proposed, and the broken line is the water level monitored by the hydrological station. It can be seen that the water area of Poyang Lake varied greatly, and the area in the wet season was about 2.39 times that in the dry season. There was a good correlation between the water level data of hydrological stations and the area of Poyang Lake. Its Pearson coefficients were 0.9674, 0.9498, and 0.9811, which are almost the same rise and fall, and indicate the same trend of change. This shows that the method in this paper has a proven multiphase water identification ability, and so can realize high-accuracy monitoring of the dry–wet season cycle of Poyang Lake.
5. Discussion
The experimental results in this paper show that Attention-UNet3+ has good application potential in Sentinel-1 image water mapping, with results better than those of UNet, Deeplabv3+, and other deep semantic segmentation networks. The validation results show that Attention-UNet3+ was about 7.54% and 4.87% better than UNet in terms of IOU and Kappa. The improvements used in this paper mainly included the attention mechanism and full-scale skip connections. The attention mechanism was applied to the network for information enhancement. It fully captured feature information without wasting resources and improved the effectiveness of full-scale skip connections to transfer features.
The model in this paper fixed the number of convolution kernels in the decoding process to 320, which reduced information redundancy. However, the full-scale skip connections and the operation of normalizing all features to one scale before connection require a lot of computation. In this regard, deep supervision is proposed in this paper—that is, without going through all the decoding layers, convolution and upsampling were used to complete the output of the segmentation results in the middle of decoding, to improve the segmentation efficiency.
Secondly, comparative experiments showed that deep neural networks for SAR image segmentation had a better effect than traditional threshold segmentation. They were more universal and stable and had a better identification effect on multiple time phases. However, deep learning is prone to overfitting in the middle of training, resulting in a significant drop in accuracy. In this regard, we used the early stopping method for training. During training, the model parameters output by each epoch were used to verify the accuracy of the test samples. If the model test accuracy was not improved after multiple epochs, training was stopped. The model that performed best in the test dataset was used as the result of training.
Figure 17 shows the identification results of various models for mountain and narrow rivers. It can be seen from the results that Attention-UNet3+ effectively alleviated the false alarm problem of mountain shadows and the incomplete river identification of UNet, Deeplabv3+, and other networks in SAR image water identification. Some studies used object-oriented methods to improve this problem, but they relied on selected features and subjective empirical knowledge to establish segmentation parameters. Using the semantic segmentation network can preserve the detailed information of the edge and complete the identification of water at different scales. Moreover, recent deep learning research has shown that trained models can be extended to other regions and other data sources for water identification through transfer learning. Therefore, Attention-UNet3+ is more suitable for water identification.
The method used in this paper performed well for water monitoring, but there are still some limitations: (1) Metal objects such as buildings and ships may cause obvious angular reflections. These lead to some bright spots appearing in SAR images, which affect the identification of water body boundaries. In this regard, multisource SAR data can be integrated, such as the combination of Sentinel-1 and GF-3, to improve the mapping of water; (2) Since the resolution of the GRD product in Sentinel-1 IW mode is 20 × 22 m, many small-scale rivers with a width of less than or close to 20 m present too few pixels in the image. Their mixed pixel characteristics are between water and soil, causing some interference with the classification.
6. Conclusions
The Attention-UNet3+ model proposed in this paper can extract and utilize the full-scale features of the input images through the encoding–decoding structure. It performs well in the water monitoring of Sentinel-1 SAR images. The proposed method has the following characteristics for water body identification from SAR images: (1) The full-scale skip connections added in the decoding process can combine the features mapped by different scale features to complete water body monitoring at different scales; (2) The spatial attention gate mechanism can strengthen the identification of target features, suppress the interference of background information, and improve the accuracy and robustness of the segmentation algorithm. It combines well with the full-scale skip connections; (3) The deep supervision module is used to improve the segmentation efficiency at a small performance cost.
Taking the Poyang Lake area as the experimental research area, the results of comparative experiments show that Attention-UNet3+ can better obtain the characteristics of water bodies with different shapes. Its average IOU/Kappa values are 0.9502 and 0.9698. Multitemporal experiments demonstrate the water monitoring capability of this method on a macro scale. The Pearson coefficients of the identified Poyang Lake area and the water level are above 0.9, which indicates a high correlation.
There are still potential improvements to the experiment that needs to be carried out in future research: (1) Multisource and multifeature remote sensing data fusion can further improve the accuracy of water monitoring; (2) The model proposed in this paper has a certain generalization ability. Therefore, the ability of this method to be used to monitor water in other regions through transfer learning can be tested and analyzed.
Author Contributions
Conceptualization, H.Z. and C.W.; methodology, C.J. and H.Z.; software, C.J. and J.G.; validation, C.J. and J.G.; formal analysis, C.J., H.Z. and F.W.; investigation, C.J.; writing—original draft preparation, C.J. and H.Z.; writing-review and editing, C.J., H.Z., F.W. and C.W.; funding acquisition, C.W. All of the authors contributed to editing and reviewing the manuscript. All authors have read and agreed to the published version of the manuscript.
Funding
The paper was funded by the National Natural Science Foundation of China, Grant No. 41930110, and the Strategic Priority Research Program of the Chinese Academy of Sciences, Grant No. XDA19090134.
Data Availability Statement
Sentinel-1 data are provided by the European Space Agency (ESA) and available from Copernicus Open Access Hub (https://scihub.copernicus.eu/dhus/#/home, accessed on 8 August 2022) and the Alaska Satellite Facility (ASF) (http://vertex.daac.asf.alaska.edu, accessed on 8 August 2022).
Acknowledgments
The authors would like to thank ESA, ASF and EU Copernicus Program for providing the Sentinel-1 A SAR data.
Conflicts of Interest
The authors declare no conflict of interest.
References
- Schumann, G.; Di Baldassarre, G.; Alsdorf, D.; Bates, P. Near real-time flood wave approximation on large rivers from space: Application to the River Po, Italy. Water Resour. Res. 2010, 46, 1–8. [Google Scholar] [CrossRef]
- Niharika, E.; Adeeba, H.; Krishna, A.S.R.; Yugander, P. K-means based Noisy SAR Image Segmentation using Median Filtering and Otsu Method. In Proceedings of the 2017 IEEE International Conference on Iot and Its Applications (IEEE ICIOT), Nagapattinam, India, 19–20 May 2017. [Google Scholar]
- Bioresita, F.; Puissant, A.; Stumpf, A.; Malet, J.-P. A Method for Automatic and Rapid Mapping of Water Surfaces from Sentinel-1 Imagery. Remote Sens. 2018, 10, 217. [Google Scholar] [CrossRef]
- Liang, J.; Liu, D. A local thresholding approach to flood water delineation using Sentinel-1 SAR imagery. Isprs J. Photogramm. Remote Sens. 2020, 159, 53–62. [Google Scholar] [CrossRef]
- Cao, H.; Zhang, H.; Wang, C.; Zhang, B. Operational Flood Detection Using Sentinel-1 SAR Data over Large Areas. Water 2019, 11, 786. [Google Scholar] [CrossRef]
- Martinis, S.; Kersten, J.; Twele, A. A fully automated TerraSAR-X based flood service. Isprs J. Photogramm. Remote Sens. 2015, 104, 203–212. [Google Scholar] [CrossRef]
- Xie, L.; Zhang, H.; Wang, C.; Chen, F. Water-Body types identification in urban areas from radarsat-2 fully polarimetric SAR data. Int. J. Appl. Earth Obs. Geoinf. 2016, 50, 10–25. [Google Scholar] [CrossRef]
- Zhou, X.; Zhang, Z.; Chen, Q.; Liu, X. A Practical Plateau Lake Extraction Algorithm Combining Novel Statistical Features and Kullback–Leibler Distance Using Synthetic Aperture Radar Imagery. IEEE J. Sel. Top. Appl. Earth Obs. Remote Sens. 2020, 13, 4702–4713. [Google Scholar] [CrossRef]
- Shen, G.; Fu, W. Water Body Extraction Using Gf-3 Polsar Data—A Case Study in Poyang Lake. In Proceedings of the IGARSS 2020—2020 IEEE International Geoscience and Remote Sensing Symposium 2020, Waikoloa, HI, USA, 26 September–2 October 2020. [Google Scholar]
- Klemenjak, S.; Waske, B.; Valero, S.; Chanussot, J. Automatic Detection of Rivers in High-Resolution SAR Data. IEEE J. Sel. Top. Appl. Earth Obs. Remote Sens. 2012, 5, 1364–1372. [Google Scholar] [CrossRef]
- Kreiser, Z.; Killough, B.; Rizvi, S.R. Water Across Synthetic Aperture Radar Data (WASARD): SAR Water Body Classification for the Open Data Cube. In Proceedings of the IGARSS 2018—2018 IEEE International Geoscience and Remote Sensing Symposium 2018, Valencia, Spain, 22–27 July 2018. [Google Scholar]
- Hu, J.; Hong, D.; Wang, Y.; Zhu, X.X. A Comparative Review of Manifold Learning Techniques for Hyperspectral and Polarimetric SAR Image Fusion. Remote Sens. 2019, 11, 681. [Google Scholar] [CrossRef]
- Bangira, T.; Alfieri, S.M.; Menenti, M.; van Niekerk, A. Comparing Thresholding with Machine Learning Classifiers for Mapping Complex Water. Remote Sens. 2019, 11, 1351. [Google Scholar] [CrossRef] [Green Version]
- Lv, W.; Yu, Q.; Yu, W. Water Extraction in SAR Images Using GLCM and Support Vector Machine. In Proceedings of the 2010 IEEE 10th International Conference on Signal Processing Proceedings (ICSP 2010), Beijing, China, 24–28 October 2010; Volume I–Iii. [Google Scholar]
- Zhang, L.; Zhang, L.; Du, B. Deep Learning for Remote Sensing Data A technical tutorial on the state of the art. IEEE Geosci. Remote Sens. Mag. 2016, 4, 22–40. [Google Scholar] [CrossRef]
- Li, Y.; Zhang, H.; Xue, X.; Jiang, Y.; Shen, Q. Deep learning for remote sensing image classification: A survey. Wiley Interdiscip. Rev.-Data Min. Knowl. Discov. 2018, 8, e1264. [Google Scholar] [CrossRef]
- Da’U, A.; Salim, N. Recommendation system based on deep learning methods: A systematic review and new directions. Artif. Intell. Rev. 2020, 53, 2709–2748. [Google Scholar] [CrossRef]
- Hong, D.; Gao, L.; Yokoya, N.; Yao, J.; Chanussot, J.; Du, Q.; Zhang, B. More Diverse Means Better: Multimodal Deep Learning Meets Remote-Sensing Imagery Classification. IEEE Trans. Geosci. Remote Sens. 2021, 59, 4340–4354. [Google Scholar] [CrossRef]
- Shelhamer, E.; Long, J.; Darrell, T. Fully Convolutional Networks for Semantic Segmentation. IEEE Trans. Pattern Anal. Mach. Intell. 2017, 39, 640–651. [Google Scholar] [CrossRef] [PubMed]
- Ronneberger, O.; Fischer, P.; Brox, T. U-Net: Convolutional Networks for Biomedical Image Segmentation. In Medical Image Computing and Computer-Assisted Intervention; Springer: Cham, Switzerland, 2015; pp. 234–241. [Google Scholar]
- Jiang, X.; Liang, S.; He, X.; Ziegler, A.D.; Lin, P.; Pan, M.; Wang, D.; Zou, J.; Hao, D.; Mao, G.; et al. Rapid and large-scale mapping of flood inundation via integrating spaceborne synthetic aperture radar imagery with unsupervised deep learning. Isprs J. Photogramm. Remote Sens. 2021, 178, 36–50. [Google Scholar] [CrossRef]
- Pai, M.M.M.; Mehrotra, V.; Aiyar, S.; Verma, U.; Pai, R.M. Automatic Segmentation of River and Land in SAR Images: A Deep Learning Approach. In Proceedings of the 2019 IEEE Second International Conference on Artificial Intelligence and Knowledge Engineering (AIKE), Sardinia, Italy, 3–5 June 2019. [Google Scholar]
- Katiyar, V.; Tamkuan, N.; Nagai, M. Near-Real-Time Flood Mapping Using Off-the-Shelf Models with SAR Imagery and Deep Learning. Remote Sens. 2021, 13, 2334. [Google Scholar] [CrossRef]
- Verma, U.; Chauhan, A.; Pai, M.M.M.; Pai, R. DeepRivWidth: Deep learning based semantic segmentation approach for river identification and width measurement in SAR images of Coastal Karnataka. Comput. Geosci. 2021, 154, 104805. [Google Scholar] [CrossRef]
- Xu, C.; Zhang, S.; Zhao, B.; Liu, C.; Sui, H.; Yang, W.; Mei, L. SAR image water extraction using the attention U-net and multi-scale level set method: Flood monitoring in South China in 2020 as a test case. Geo-Spat. Inf. Sci. 2021, 25, 155–168. [Google Scholar] [CrossRef]
- Li, J.; Wang, C.; Xu, L.; Wu, F.; Zhang, H.; Zhang, B. Multitemporal Water Extraction of Dongting Lake and Poyang Lake Based on an Automatic Water Extraction and Dynamic Monitoring Framework. Remote Sens. 2021, 13, 865. [Google Scholar] [CrossRef]
- Ren, Y.; Li, X.; Yang, X.; Xu, H. Development of a Dual-Attention U-Net Model for Sea Ice and Open Water Classification on SAR Images. IEEE Geosci. Remote Sens. Lett. 2022, 19, 4010205. [Google Scholar] [CrossRef]
- Dang, B.; Li, Y. MSResNet: Multiscale Residual Network via Self-Supervised Learning for Water-Body Detection in Remote Sensing Imagery. Remote Sens. 2021, 13, 3122. [Google Scholar] [CrossRef]
- Chen, L.; Zhang, P.; Xing, J.; Li, Z.; Xing, X.; Yuan, Z. A Multi-Scale Deep Neural Network for Water Detection from SAR Images in the Mountainous Areas. Remote Sens. 2020, 12, 3205. [Google Scholar] [CrossRef]
- Nemni, E.; Bullock, J.; Belabbes, S.; Bromley, L. Fully Convolutional Neural Network for Rapid Flood Segmentation in Synthetic Aperture Radar Imagery. Remote Sens. 2020, 12, 2532. [Google Scholar] [CrossRef]
- Kim, M.U.; Oh, H.; Lee, S.-J.; Choi, Y.; Han, S. A Large-Scale Dataset for Water Segmentation of SAR Satellite. In Proceedings of the 2021 IEEE/RSJ International Conference on Intelligent Robots and Systems (IROS), Prague, Czech Republic, 27 September–1 October 2021. [Google Scholar]
- Bai, Y.; Wu, W.; Yang, Z.; Yu, J.; Zhao, B.; Liu, X.; Yang, H.; Mas, E.; Koshimura, S. Enhancement of Detecting Permanent Water and Temporary Water in Flood Disasters by Fusing Sentinel-1 and Sentinel-2 Imagery Using Deep Learning Algorithms: Demonstration of Sen1Floods11 Benchmark Datasets. Remote Sens. 2021, 13, 2220. [Google Scholar] [CrossRef]
- Huang, H.; Lin, L.; Tong, R.; Hu, H.; Zhang, Q.; Iwamoto, Y.; Han, X.; Chen, Y.-W.; Wu, J. Unet 3+: A Full-Scale Connected Unet for Medical Image Segmentation. In Proceedings of the 2020 IEEE International Conference on Acoustics, Speech, and Signal Processing, Barcelona, Spain, 4–8 May 2020. [Google Scholar]
- Deng, Y.J.; Hou, Y.L.; Yan, J.T.; Zeng, D.X. ELU-Net: An Efficient and Lightweight U-Net for Medical Image Segmentation. IEEE Access 2022, 10, 35932–35941. [Google Scholar] [CrossRef]
- Xia, L.; Zhang, J.; Zhang, X.; Yang, H.; Xu, M. Precise Extraction of Buildings from High-Resolution Remote-Sensing Images Based on Semantic Edges and Segmentation. Remote Sens. 2021, 13, 3083. [Google Scholar] [CrossRef]
- Shi, Y.X.; Xu, D.G. Robotic Grasping Based on Fully Convolutional Network Using Full-Scale Skip Connection. In Proceedings of the 2020 Chinese Automation Congress (CAC 2020) 2020, Shanghai, China, 6–8 November 2020; pp. 7343–7348. [Google Scholar] [CrossRef]
- Zhang, H.; Yuan, J.T.; Tian, X.; Ma, J.Y. GAN-FM: Infrared and Visible Image Fusion Using GAN With Full-Scale Skip Connection and Dual Markovian Discriminators. IEEE Trans. Comput. Imaging 2021, 7, 1134–1147. [Google Scholar] [CrossRef]
- Xiang, X.Z.; Tian, D.S.; Lv, N.; Yan, Q.N. FCDNet: A Change Detection Network Based on Full-Scale Skip Connections and Coordinate Attention. IEEE Geosci. Remote Sens. Lett. 2022, 19. [Google Scholar] [CrossRef]
- Li, R.; Duan, C.X.; Zheng, S.Y.; Zhang, C.; Atkinson, P.M. MACU-Net for Semantic Segmentation of Fine-Resolution Remotely Sensed Images. IEEE Geosci. Remote Sens. Lett. 2022, 19. [Google Scholar] [CrossRef]
- Schlemper, J.; Oktay, O.; Schaap, M.; Heinrich, M.; Kainz, B.; Glocker, B.; Rueckert, D. Attention gated networks: Learning to leverage salient regions in medical images. Med. Image Anal. 2019, 53, 197–207. [Google Scholar] [CrossRef] [PubMed]
- Twele, A.; Cao, W.; Plank, S.; Martinis, S. Sentinel-1-based flood mapping: A fully automated processing chain. Int. J. Remote Sens. 2016, 37, 2990–3004. [Google Scholar] [CrossRef]
- Clement, M.A.; Kilsby, C.G.; Moore, P. Multi-temporal synthetic aperture radar flood mapping using change detection. J. Flood Risk Manag. 2018, 11, 152–168. [Google Scholar] [CrossRef]
- Possa, E.M.; Maillard, P. Precise Delineation of Small Water Bodies from Sentinel-1 Data using Support Vector Machine Classification. Can. J. Remote Sens. 2018, 44, 179–190. [Google Scholar] [CrossRef]
- Manjusree, P.; Kumar, L.P.; Bhatt, C.M.; Rao, G.S.; Bhanumurthy, V. Optimization of Threshold Ranges for Rapid Flood Inundation Mapping by Evaluating Backscatter Profiles of High Incidence Angle SAR Images. Int. J. Disaster Risk Sci. 2012, 3, 113–122. [Google Scholar] [CrossRef]
- Xu, H.Q. Modification of normalised difference water index (NDWI) to enhance open water features in remotely sensed imagery. Int. J. Remote Sens. 2006, 27, 3025–3033. [Google Scholar] [CrossRef]
- Souza, W.D.; Reis, L.G.D.; Ruiz-Armenteros, A.M.; Veleda, D.; Neto, A.R.; Fragoso, C.R.; Cabral, J.; Montenegro, S. Analysis of Environmental and Atmospheric Influences in the Use of SAR and Optical Imagery from Sentinel-1, Landsat-8, and Sentinel-2 in the Operational Monitoring of Reservoir Water Level. Remote Sens. 2022, 14, 2218. [Google Scholar] [CrossRef]
- Badrinarayanan, V.; Kendall, A.; Cipolla, R. SegNet: A Deep Convolutional Encoder-Decoder Architecture for Image Segmentation. IEEE Trans. Pattern Anal. Mach. Intell. 2017, 39, 2481–2495. [Google Scholar] [CrossRef]
- Chen, L.-C.; Zhu, Y.; Papandreou, G.; Schroff, F.; Adam, H. Encoder-Decoder with Atrous Separable Convolution for Semantic Image Segmentation. In Proceedings of the Computer Vision—ECCV 2018, Munich, Germany, 8–14 September 2018. [Google Scholar]
Figure 1.
Methodological framework of the overall methods used in this study.

Figure 2.
Preprocessing flowchart.

Figure 3.
Attention-UNet3+ architecture.

Figure 4.
Illustration of how to generate .

Figure 5.
Comparison of skip connections: (a) UNet ordinary skip connections; (b) UNet3+ full-scale skip connections.
Figure 5.
Comparison of skip connections: (a) UNet ordinary skip connections; (b) UNet3+ full-scale skip connections.

Figure 6.
Structure of attention module.

Figure 7.
Schematic diagram of deep supervision (the weights of ×4, ×5, ×6, ×7, and ×8 are 1, 2, 4, 8, and 16 in order).
Figure 7.
Schematic diagram of deep supervision (the weights of ×4, ×5, ×6, ×7, and ×8 are 1, 2, 4, 8, and 16 in order).

Figure 8.
Schematic diagram of the study area.

Figure 9.
Flowchart of the sample production process.

Figure 10.
Sample patches: (a) small tributary samples with thin strips; (b) large, blocky lake samples; (c,d) samples of mountain water. (a1–d1) are SAR images; (a2–d2) are corresponding label images.
Figure 10.
Sample patches: (a) small tributary samples with thin strips; (b) large, blocky lake samples; (c,d) samples of mountain water. (a1–d1) are SAR images; (a2–d2) are corresponding label images.

Figure 11.
Four validation samples (VV polarization) and corresponding ground truth labels. Val. 1 is the small mountain river. Val. 2 is the plain lake surface in the wet season. Val. 3 is the plain lake surface in the dry season. Val. 4 is the mountain branch lake.
Figure 11.
Four validation samples (VV polarization) and corresponding ground truth labels. Val. 1 is the small mountain river. Val. 2 is the plain lake surface in the wet season. Val. 3 is the plain lake surface in the dry season. Val. 4 is the mountain branch lake.

Figure 12.
Comparison of experimental results. Val. 1–4 represent four different validation samples.
Figure 12.
Comparison of experimental results. Val. 1–4 represent four different validation samples.

Figure 13.
Prediction time and IOU of deep supervision and other models.

Figure 14.
Stage output results: (a,b) zoom in for details of Out1 and Out5, respectively.

Figure 15.
Sequence diagram of temporal and spatial variations of Poyang Lake in 2021.

Figure 16.
The water area and level of Poyang Lake in 2021.

Figure 17.
Results of mountain shadow and narrow rivers. (a–g) Raw images, TS, SegNet, Deeplabv3+, UNet, Attention-UNet, and Attention-UNet3+, respectively.
Figure 17.
Results of mountain shadow and narrow rivers. (a–g) Raw images, TS, SegNet, Deeplabv3+, UNet, Attention-UNet, and Attention-UNet3+, respectively.

Table 2.
Detailed Sentinel-1 data.
| No. | Time | Orbit | No. | Time | Orbit |
|---|---|---|---|---|---|
| 1 | 4 January 2021 | 35,987 | 13 | 3 July 2021 | 38,612 |
| 2 | 4 January 2021 | 35,987 | 14 | 3 July 2021 | 38,612 |
| 3 | 9 February 2021 | 36,512 | 15 | 8 August 2021 | 39,137 |
| 4 | 9 February 2021 | 36,512 | 16 | 8 August 2021 | 39,137 |
| 5 | 5 March 2021 | 36,862 | 17 | 1 September 2021 | 39,487 |
| 6 | 5 March 2021 | 36,862 | 18 | 1 September 2021 | 39,487 |
| 7 | 10 April 2021 | 37,387 | 19 | 7 October 2021 | 40,012 |
| 8 | 10 April 2021 | 37,387 | 20 | 7 October 2021 | 40,012 |
| 9 | 4 May 2021 | 37,737 | 21 | 12 November 2021 | 40,537 |
| 10 | 4 May 2021 | 37,737 | 22 | 12 November 2021 | 40,537 |
| 11 | 9 June 2021 | 38,262 | 23 | 30 December 2021 | 40,087 |
| 12 | 9 June 2021 | 38,262 | 24 | 30 December 2021 | 40,087 |
Table 3.
IOU results of different methods in each validation sample (%).
| IOU | Val. 1 | Val. 2 | Val. 3 | Val. 4 | AVG | STD |
|---|---|---|---|---|---|---|
| TS | 45.92 | 86.23 | 70.22 | 77.56 | 69.98 | 15 |
| SegNet | 64.16 | 94.4 | 81.21 | 93.92 | 83.42 | 12.32 |
| Deeplabv3+ | 73.71 | 95.17 | 88.55 | 93.44 | 87.72 | 8.44 |
| UNet | 84.19 | 94.64 | 81.09 | 89.99 | 87.48 | 5.22 |
| Att-UNet | 90.81 | 96.13 | 89.25 | 92.75 | 92.24 | 2.57 |
| Att-UNet3+ | 94.94 | 96.54 | 93.02 | 95.58 | 95.02 | 1.29 |
Table 4.
Kappa results of different methods in each validation sample (%).
| Kappa | Val. 1 | Val. 2 | Val. 3 | Val. 4 | AVG | STD |
|---|---|---|---|---|---|---|
| TS | 61.82 | 90.04 | 78.17 | 84.86 | 78.72 | 10.63 |
| SegNet | 77.56 | 96.18 | 87.13 | 96.29 | 89.29 | 7.72 |
| Deeplabv3+ | 84.48 | 96.71 | 92.56 | 95.99 | 92.44 | 4.85 |
| UNet | 91.21 | 96.38 | 87.06 | 93.8 | 92.11 | 3.44 |
| Att-UNet | 95.06 | 97.4 | 93.1 | 95.57 | 95.28 | 1.53 |
| Att-UNet3+ | 97.34 | 97.67 | 95.57 | 97.32 | 96.98 | 0.82 |
Table 5.
F1-Score results of different methods in each validation sample (%).
| F1-Score | Val. 1 | Val. 2 | Val. 3 | Val. 4 | AVG | STD |
|---|---|---|---|---|---|---|
| TS | 62.93 | 92.61 | 82.51 | 87.36 | 81.35 | 11.22 |
| SegNet | 78.17 | 97.12 | 89.63 | 96.86 | 90.44 | 7.7 |
| Deeplabv3+ | 84.87 | 97.53 | 93.93 | 96.61 | 93.24 | 5.01 |
| UNet | 91.41 | 97.25 | 89.56 | 94.73 | 93.24 | 2.97 |
| Att-UNet | 95.18 | 98.03 | 94.32 | 96.24 | 95.94 | 1.38 |
| Att-UNet3+ | 97.4 | 98.24 | 96.38 | 97.74 | 97.44 | 0.68 |
Table 6.
Comparison of results of deep supervision and other models.
| Out1 | Out2 | Out3 | Out4 | Out5 | SegNet | Deeplabv3+ | |
|---|---|---|---|---|---|---|---|
| Time (s) | 3.61 | 3.86 | 4.15 | 4.83 | 10.06 | 6.55 | 6.01 |
| Parameters | 18.87 M | 21.96 M | 24.94 M | 27.96 M | 31.09 M | 29.46 M | 41.28 M |
| IOU (%) | 73.25 | 79.99 | 86.64 | 91.54 | 95.02 | 83.42 | 87.72 |
| Kappa (%) | 81.84 | 87.1 | 91.74 | 94.51 | 96.98 | 89.29 | 92.44 |
Publisher’s Note: MDPI stays neutral with regard to jurisdictional claims in published maps and institutional affiliations. |
© 2022 by the authors. Licensee MDPI, Basel, Switzerland. This article is an open access article distributed under the terms and conditions of the Creative Commons Attribution (CC BY) license (https://creativecommons.org/licenses/by/4.0/).
Share and Cite
MDPI and ACS Style
Jiang, C.; Zhang, H.; Wang, C.; Ge, J.; Wu, F. Water Surface Mapping from Sentinel-1 Imagery Based on Attention-UNet3+: A Case Study of Poyang Lake Region. Remote Sens. 2022, 14, 4708. https://doi.org/10.3390/rs14194708
AMA Style
Jiang C, Zhang H, Wang C, Ge J, Wu F. Water Surface Mapping from Sentinel-1 Imagery Based on Attention-UNet3+: A Case Study of Poyang Lake Region. Remote Sensing. 2022; 14(19):4708. https://doi.org/10.3390/rs14194708
Chicago/Turabian StyleJiang, Chaowei, Hong Zhang, Chao Wang, Ji Ge, and Fan Wu. 2022. "Water Surface Mapping from Sentinel-1 Imagery Based on Attention-UNet3+: A Case Study of Poyang Lake Region" Remote Sensing 14, no. 19: 4708. https://doi.org/10.3390/rs14194708
Note that from the first issue of 2016, this journal uses article numbers instead of page numbers. See further details here.