
Glacier Mass Loss Simulation Based on Remote Sensing Data: A Case Study of the Yala Glacier and the Qiyi Glacier in the Third Pole

1
Department of Earth Sciences, University of Gothernburg, 41320 Gothenburg, Sweden
2
Aerospace Information Research Institute, Chinese Academy of Sciences, Beijing 100053, China
*
Author to whom correspondence should be addressed.
Remote Sens. 2022, 14(20), 5190; https://doi.org/10.3390/rs14205190
Submission received: 4 September 2022
/
Revised: 12 October 2022
/
Accepted: 13 October 2022
/
Published: 17 October 2022
(This article belongs to the Special Issue Land-Atmosphere Interactions and Effects on the Climate of the Tibetan Plateau and Surrounding Regions II)
Abstract
:The climate warming over the Third Pole is twice as large as that in other regions and glacier mass loss is considered to be more intensive in the region. However, due to the vast geographical differences, the characteristics of glacier mass loss might be very different between different parts of the Third Pole, such as between the southern and northern Third Pole. It is, therefore, very important to clarify the characteristics of glacier mass loss between different parts of the Third Pole, particularly between the southern and northern Third Pole. We selected the Yala Glacier in the Central Himalayas and the Qiyi Glacier in the Qilian Mountains to study the different characteristics of glacier mass loss between the southern and northern Third Pole using remote sensing data and in situ data. Based on the results, we found that the Yala Glacier has not only been in a status of mass loss but also in a status of intensive and accelerating mass loss. Our analysis showed that the average multi-year mass loss of the Yala Glacier is −736 mm w.e.a−1, with a maximum of −1815 mm w.e.a−1. At the same time, the Qiyi Glacier has experienced a mild glacier mass loss process compared with the Yala Glacier. The Qiyi Glacier’s mass loss is −567 mm w.e.a−1 with a maximum of −1516 mm w.e.a−1. Our results indicate that the mass loss of the Yala Glacier is much stronger than that of the Qiyi Glacier. The major cause of the stronger mass loss of the Yala Glacier is from the decrease of glacier accumulation associated with precipitation decrease under the weakening Indian monsoon. Other factors have also contributed to the more intensive mass loss of the Yala Glacier.

1. Introduction
Glaciers are important water resources for the whole world [1,2]. The Third Pole (TP) stores the world’s largest glacier mass outside Antarctica and the Arctic [2,3,4]. Abnormal climate warming over the TP is twice as large as that in other regions [5,6,7]. Under the background of the intensive glacier melt at global scale caused by global warming [8,9], the glacier melt in the TP is more intensive because of abnormal warming [10,11,12,13,14,15]. The intensive glacier melt in the TP causes runoff increase in the short term, benefiting water resources supply in the downstream areas [16,17,18,19]. However, on a longer time scale, glacier melt ultimately causes substantial runoff decrease and impacts the water supply, and more than 2 billion people living in the region would face water shortage [16]. The direct impact of glacier melt on water resource is its close relationship to the rivers of the Asian Water Tower such as the Yangtze, Yellow, Mekong, Ganges and Indus Rivers, as well as large inland rivers such as the Tarim, Amu Darya, and SYR Darya. Glacier melt also causes global sea level rising [4,20] through river discharge contribution. Intensive glacier melt is also directly related to emerging disasters such as ice collapse, which is a new serious phenomenon of intensive glacier mass loss [20,21,22]. It is, therefore, very important to know the status of glacier mass loss in the TP and to clarify the mass loss difference between the southern and northern TP for a comprehensive understanding of its water resource supplying capability and for the hazard risk management of the societies.
A previous study pointed out spatial heterogeneity of glacier mass loss in the TP [23]. Remote-sensing monitoring showed that glaciers experienced intense mass loss and area shrinkage in the southern TP, particularly in the Himalayas, with glacier mass loss from 0.21 to 0.38 m w.e. a−1 in different periods [24,25,26,27], with glacier area reduction of −0.18 ± 0.07% a−1 [28] during the 1970s–2010s. In the Central Himalayas, the mass loss was −0.40 ± 0.09 m w.e. a−1 in 2011–2013 for the Yala Glacier [29], and −0.20 ± 0.30 m w.e. a−1 for the other four glaciers in 2014 [30]. In the Qilian Mountains located in the northern TP, the average mass loss was −0.24 ± 0.03 m w.e. a−1 during 1961–2010 [31]. The accelerated melt in the Qilian Mountains began in the early 1990s, as was confirmed by the observations [3,32]. The mass loss in the Qiyi Glacier reached −0.29 ± 0.22 m w.e. a−1 during 2000–2009 [33]. In the Qilian Mountains, there was rapid glacier mass loss in the eastern but slow glacier mass loss in the central and in the western [31,34]. Recently, more intensive mass loss of −0.43± 0.03 m w.e. a−1 was estimated for glaciers in the Lenglongling Mountains in the very eastern of the Qilian Mountains during 1972–2016, whereas less mass loss of −0.27 ± 0.07 and −0.28 ± 0.03 m w.e. a−1 was estimated for glaciers in the Beida River basin in the central and Shule River basin in the western [35,36,37,38].
The differences in glacier regimes are very important for understanding the differences of mass loss between the southern TP. In the southern TP, most glaciers are maritime temperate glaciers. However, most glaciers are continental cold glaciers in the northern TP. The characteristics of the glacier regimes are determined by both the different temperature and precipitation characteristics associated with atmospheric circulation processes over the TP [3,23]. Generally speaking, glaciers in the southern TP are more sensitive to temperature variations than those in the northern TP since ice temperature is higher in the glaciers in the southern TP. Furthermore, the southern TP is dominated by the Indian monsoon, while the northern TP is dominated by the westerly. In the central Himalayas, more annual precipitation fell in summer [30] compared with that in the Qilian Mountains [39]. Due to the vast territory of the TP, different geographical zones have different climate conditions under the dominance of different atmospheric circulation processes, resulting in great differences in the characteristics of glacier mass loss. Therefore, an important scientific question is how we can clarify the major difference of the characteristics of glacier mass loss between the northern and southern TP.
In order to quantitatively study the differences in the characteristics of glacier mass loss between the northern and southern TP, we selected two representative glaciers, the Yala Glacier in the southern TP and the Qiyi Glacier in the northern TP and used remote sensing data, combined with the in situ data, to model the different characteristics of glacier mass loss shown by the two different types of glaciers, and the potential mechanisms causing differences in glacier mass loss. Our study will help improve the understanding of glacier mass loss in the TP under the background of the abnormal climate warming, and deepens the understanding of the impact mechanism of climate change on glacier fluctuations over the TP.
2. Methods
2.1. Selection for the Representative Glaciers in the Southern and Northern Third Pole
The Yala Glacier (28°14′N, 85°37′E), lying on the south slope of the central Nepal Himalayas and representing maritime temperate glacier, is selected as the representative glacier for the southern TP (Figure 1). It is a summer accumulation glacier without debris, with area and length of 1.37 km2 and 1.5 km, respectively. The total area of all the glaciers in the region is 87.2 km2. The glacier flows southwest from the elevation of 5681 to 5143 m a.s.l. [40]. The Yala Glacier belongs to the Indian monsoon climate, with the highest precipitation in summer months (June to September) and a rather dry winter. At the same time, glacier mass loss reaches the maximum in summer. Based on in situ measurement, the Yala Glacier has been thinning at rates of −0.69 ± 0.25 during 1982–1996 and −0.75 ± 0.24 m a−1 during 1996–2009, with an accelerated mass loss since 1990s [41,42]. The glacier mass loss increased from −0.36 m w.e. in 1996 [41] to −0.81 ± 0.27 m w.e. in 2009 [40,43]. The total glacier mass loss is about 40% over the 27 years.
The Qiyi Glacier (39°15′N, 97°45′E), lying on the north slope of the Tuolai Mountains in the Qilian Mountain, representing continental cold glacier, is selected as a representative glacier for the northern TP (Figure 1). The Qiyi Glacier is also a summer accumulation glacier and is debris free. It flows northward from an elevation of 5159 to 4304 m a.s.l., with an area of 2.76 km2 and a length of 3.8 km [3]. The total area of all the glaciers in the region is 136 km2. The Qiyi Glacier is located in the westerly dominated area in the northern TP and the eastern margin is affected by the East Asian monsoon. The area is mainly the continental climate and dominant by the cold air mass in winter, but occasionally affected by the East Asian monsoon in summer. Based on the in situ measurement, the equilibrium line altitude (ELA) was respectively 4600 m a.s.l. in 1970s, 4708 m a.s.l. in 1980s, 4935 m a.s.l. in 2000s [44] and 4941 m a.s.l. in 2010s [45]. In addition, the glacier mass was positive before 1980s (+0.26 m w.e. in 1970s, 0.004 m w.e. in 1980s). Glacier mass loss began after the 1990s (−0.47 m w.e. in 2000s and −0.50 m w.e. in 2010s [3,32,46]).
2.2. MODIS Temperature Data and TRMM Precipitation Data Acquisition
MODIS is the abbreviation of Moderate Resolution Imaging Spectroradiometer. There are many sensors used to acquire MODIS temperature data. The MODIS temperature data for the present study is from the Terra-MOD11A1 which provides observed results four times a day, 1:30 a.m., 10:30 a.m., 1:30 p.m., 10:30 p.m., through optical and infrared sensors. We used the Data Interpolating Empirical Orthogonal Functions (abbreviated as DINEOF method), proposed by Zhou et al. [47], to get accurate remote sensing MODIS temperature data. The MODIS temperature data we have obtained are satisfactory with RMSE of 2.91 °C and bias of −1.19 °C. Based on the interpolation in the DINEOF method, the data are still satisfactory with RMSE of 1.77 °C and bias of −0.52 °C Even under the condition of cloud day.
TRMM is the abbreviation of Tropical Rainfall Measuring Mission. TRMM sensor consists of a precipitation scanning radar (PR), a passive microwave imager (TRMM TMI) and an infrared imager (VIRS). TMI provides water vapor and the intensity of precipitation, which is therefore the core sensor for the TRMM data. The TRMM precipitation data for the present study are from TRMM 3B43. The time resolution of the TRMM 3B43 is one day and the spatial resolution is 0.25°. We used the method proposed by Zhang et al. [48] to obtain the accurate TRMM precipitation data.
2.3. Model Principle
2.3.1. Model Setup
The glacier mass loss was computed using degree day model [49].
where is the meltwater (mm w.e.a−1); is the degree day factor for snow and ice melting; is the temperature; is the temperature threshold, when > , the melting started.
Total daily precipitation at certain elevation is calculated using observed at automatic weaher station (AWS) and a vertical gradient of precipitation (). Then, rainfall and snowfall were separated from total precipitation by linear interpolation using two temperature thresholds for rain () and snow ().
In order to use the remote-sensing data to simulate glacier mass loss, we assembled four sub-models. The four sub-models driven by four different driving data sets to get different glacier mass loss: Sub-model1 was driven by the combined data set of in situ temperature and precipitation data; sub-model2 was driven by the combined data set of in situ temperature and precipitation data associated with the lapse rate calculated from the MODIS temperature data from different elevations in the Yala Glacier and Qiyi Glacier; sub-model3 was driven by the combined data set of MODIS temperature and TRMM precipitation data; sub-model4 was driven by the combined data set of in situ temperature data and TRMM precipitation data associated with the lapse rate calculated from the MODIS temperature data from different elevations in the Yala Glacier and Qiyi Glacier.
2.3.2. Model Input Data
The main inputs that the model requires are as follows: (1) The glacier outlines of the Yala and Qiyi glacier obtained from the second glacier inventory dataset of China [50] and the Randolph Glacier Inventory V6.0 (RGI6.0) [51], and the SRTM DEM (90m) is used as the glacier surface; (2) observed daily data at two AWSs are used as driving data to drive the model. In addition, MODIS temperature and MODIS temperature lapse rate were computed from MOD11A1 and MYD11A1 production, TRMM precipitation were withdraw from TRMM production; , and are linear interpolated to each grid cell by using their vertical gradients; (3) The initial snow depth on the glacier is computed using the linear relationship between measured snow depth and elevations; (4) The density of ice and fresh snowfall are assumed to be 900 and 200 kg m−3, respectively.
2.3.3. Model Calibration and Validation
The parameter ranges are summarized in Table 1. Monte Carlo simulation method is used to obtain the optimal combination of parameters for glacier mass loss simulation. The model results, with the lowest root mean square error (RMSE) between modeled glacier mass loss and observed ones and between modeled annual point mass loss and observed ones, are acceptable for selecting the optimal combination of parameters.
We divided the total observations into two periods: one period (2010–2015 for the Yala Glacier and 2001–2012 for the Qiyi Glacier) was used to calibrate the model, and the other period (2016–2019 for the Yala Glacier and 2013–2018 for the Qiyi Glacier) was used to validated the models. The optimal driving data parameters of sub-models 1–4 for the Yala and Qiyi Glacier are shown in Table 2 and Table 3.
3. Data
In this study, we used two sets of data: remote sensing data and in situ data.
3.1. Remote Sensing Data
The remote sensing data in the study include land surface temperature based on MODIS and precipitation based on TRMM, °C.
MODIS Temperature Data
The most important parameter for glacier mass loss study is temperature. We have used the MODIS temperature data to study glacier mass loss for the Yala Glacier and Qiyi Glaicer. Since MODIS land surface temperature product has already been widely validated by scientific community, such as Wan et al. [52], Wan et al. [53] and Hu et al. [54], it can be concluded that MODIS land surface temperature can be used to study glacier mass loss in this study although some errors exist. The daily mean, minimum and maximum temperatures data from 2000 to 2008 are calculated from MODIS for the Yala Glacier and Qiyi Glacier. All the MODIS temperature data were calculated for the whole glacier rather than pixel temperature. Figure 2 shows the daily mean, minimum and maximum temperatures from 2000 to 2008 for the Yala Glacier. The MODIS temperature data indicate obvious diurnal and seasonal changes, reflecting the basic characteristics of temperature change from 2000 to 2008. The averaged minimum temperature is −4.42 °C, the averaged maximum temperature is 18.86 °C, and the mean temperature is 9.83 °C.
Figure 3 shows the daily mean, minimum and maximum MODIS temperature data from 2000 to 2013 for the Qiyi Glacier. The MODIS temperature data indicate obvious diurnal and seasonal changes, reflecting the basic characteristics of temperature change. The MODIS temperature data clearly indicated the temperature increase from 2000 to 2013. The averaged minimum temperature is 3.11 °C, the averaged maximum temperature is 20.25 °C, and the mean temperature is 7.93 °C.
3.2. TRMM Precipitation Data
The TRMM precipitation data for the Yala Glacier and Qiyi Glacier were obtained by: firstly, the in situ data were used to verify and correct the TRMM data from the seasonal distribution to ensure that the relative proportions of the average monthly precipitation of the two data sites in a year are stable; then, precipitation are considered with the assumption that the amount of occurrence and the amount of accumulative precipitation are proportional to the deviation correction of TRMM data.
By evaluating the daily mean, monthly mean, and annual mean precipitation and by calculating the root mean square error of the accumulated precipitation and the difference of the accumulated precipitation times, the TRMM precipitation data were calibrated. The missing data were supplemented by interpolation to ensure the completeness and consistency of the data.
In Situ Data
The in situ air temperature data were from the records of the AWS and the fixed long-term observing station. The AWS (Figure 1d) for the Yala Glacier is located at the terminus of the Yala Glacier (5058 m a.s.l.), and the fixed observing station (Kyanging, 2821 m a.s.l., Figure 1b) in the middle reaches of the Langtang River basin. The AWS (Figure 1e) for the Qiyi Glacier is located at the tongue (4408 m a.s.l.) of the Qiyi Glacier. The fixed observing station (Tuole station, 3367 m a.s.l., Figure 1c) is located in the upper reaches of the Tuole River basin. The meteorological data, including temperature, precipitation, humidity, air pressure, wind velocity and direction, were measured synchronously with glacier mass balance. In addition to the observation data by AWS, some data are from Chinese Meteorological Agency (CMA) (http://data.cma.cn/ (accessed on 20 March 2020)) and TPE data (data.tpdc.ac.cn (accessed on March 21 2020)). The discontinuous in situ measurements for the two glaciers were carried out since 1970s. The glacier mass balance was measured by measuring stakes installed in the two glaciers. The observing system included 8 stakes for the Yala Glacier (Figure 1d) and 26 stakes for the Qiyi Glacier (Figure 1e), respectively. The observations of the Yala Glacier were carried out by Fujita et al. [41,55], Racoviteanu et al. [56], ICIMOD and Acharya and Kayastha [40], and a recent observation was performed by Li (unpublished). The observations of the Qiyi Glacier were carried out by Guo et al. [57], Wang et al. [45,58], and Pu et al. [32].
4. Results and Discussions
Figure 4 shows the simulations of mass loss for the Yala Glacier by the four sub-models. It can be seen from the figure that the simulation of the sub-model3 is the best to simulate glacier mass loss and stake measured point mass loss, compared with the other sub-models in the calibration period. Although the sub-model4 is improved after adding calibrating data in the validation period, the sub-mode3 is still the best. The above analyses indicate that the sub-model using MODIS temperature data and TRMM Precipitation data at the same time has the highest simulation accuracy. Under some particular conditions, the use of MODIS temperature lapse rate might also help improve the outcomes of the sub-models.
Figure 5 shows the results of the mass loss for the Qiyi Glacier simulated by four sub-models. It can be seen from the figure that the sub-model2 is better than the other sub-models in simulating glacier mass loss and stake measured point mass loss. The sub-model3 and sub-model4 overestimated the in situ measurement of glacier mass loss during the calibration period and underestimated the glacier mass loss during the validation period, showing the inter-annual instability of TRMM precipitation data. Similar to the Yala Glacier, the Qiyi Glacier also reflects the importance of precipitation data accuracy to glacier mass loss simulation.
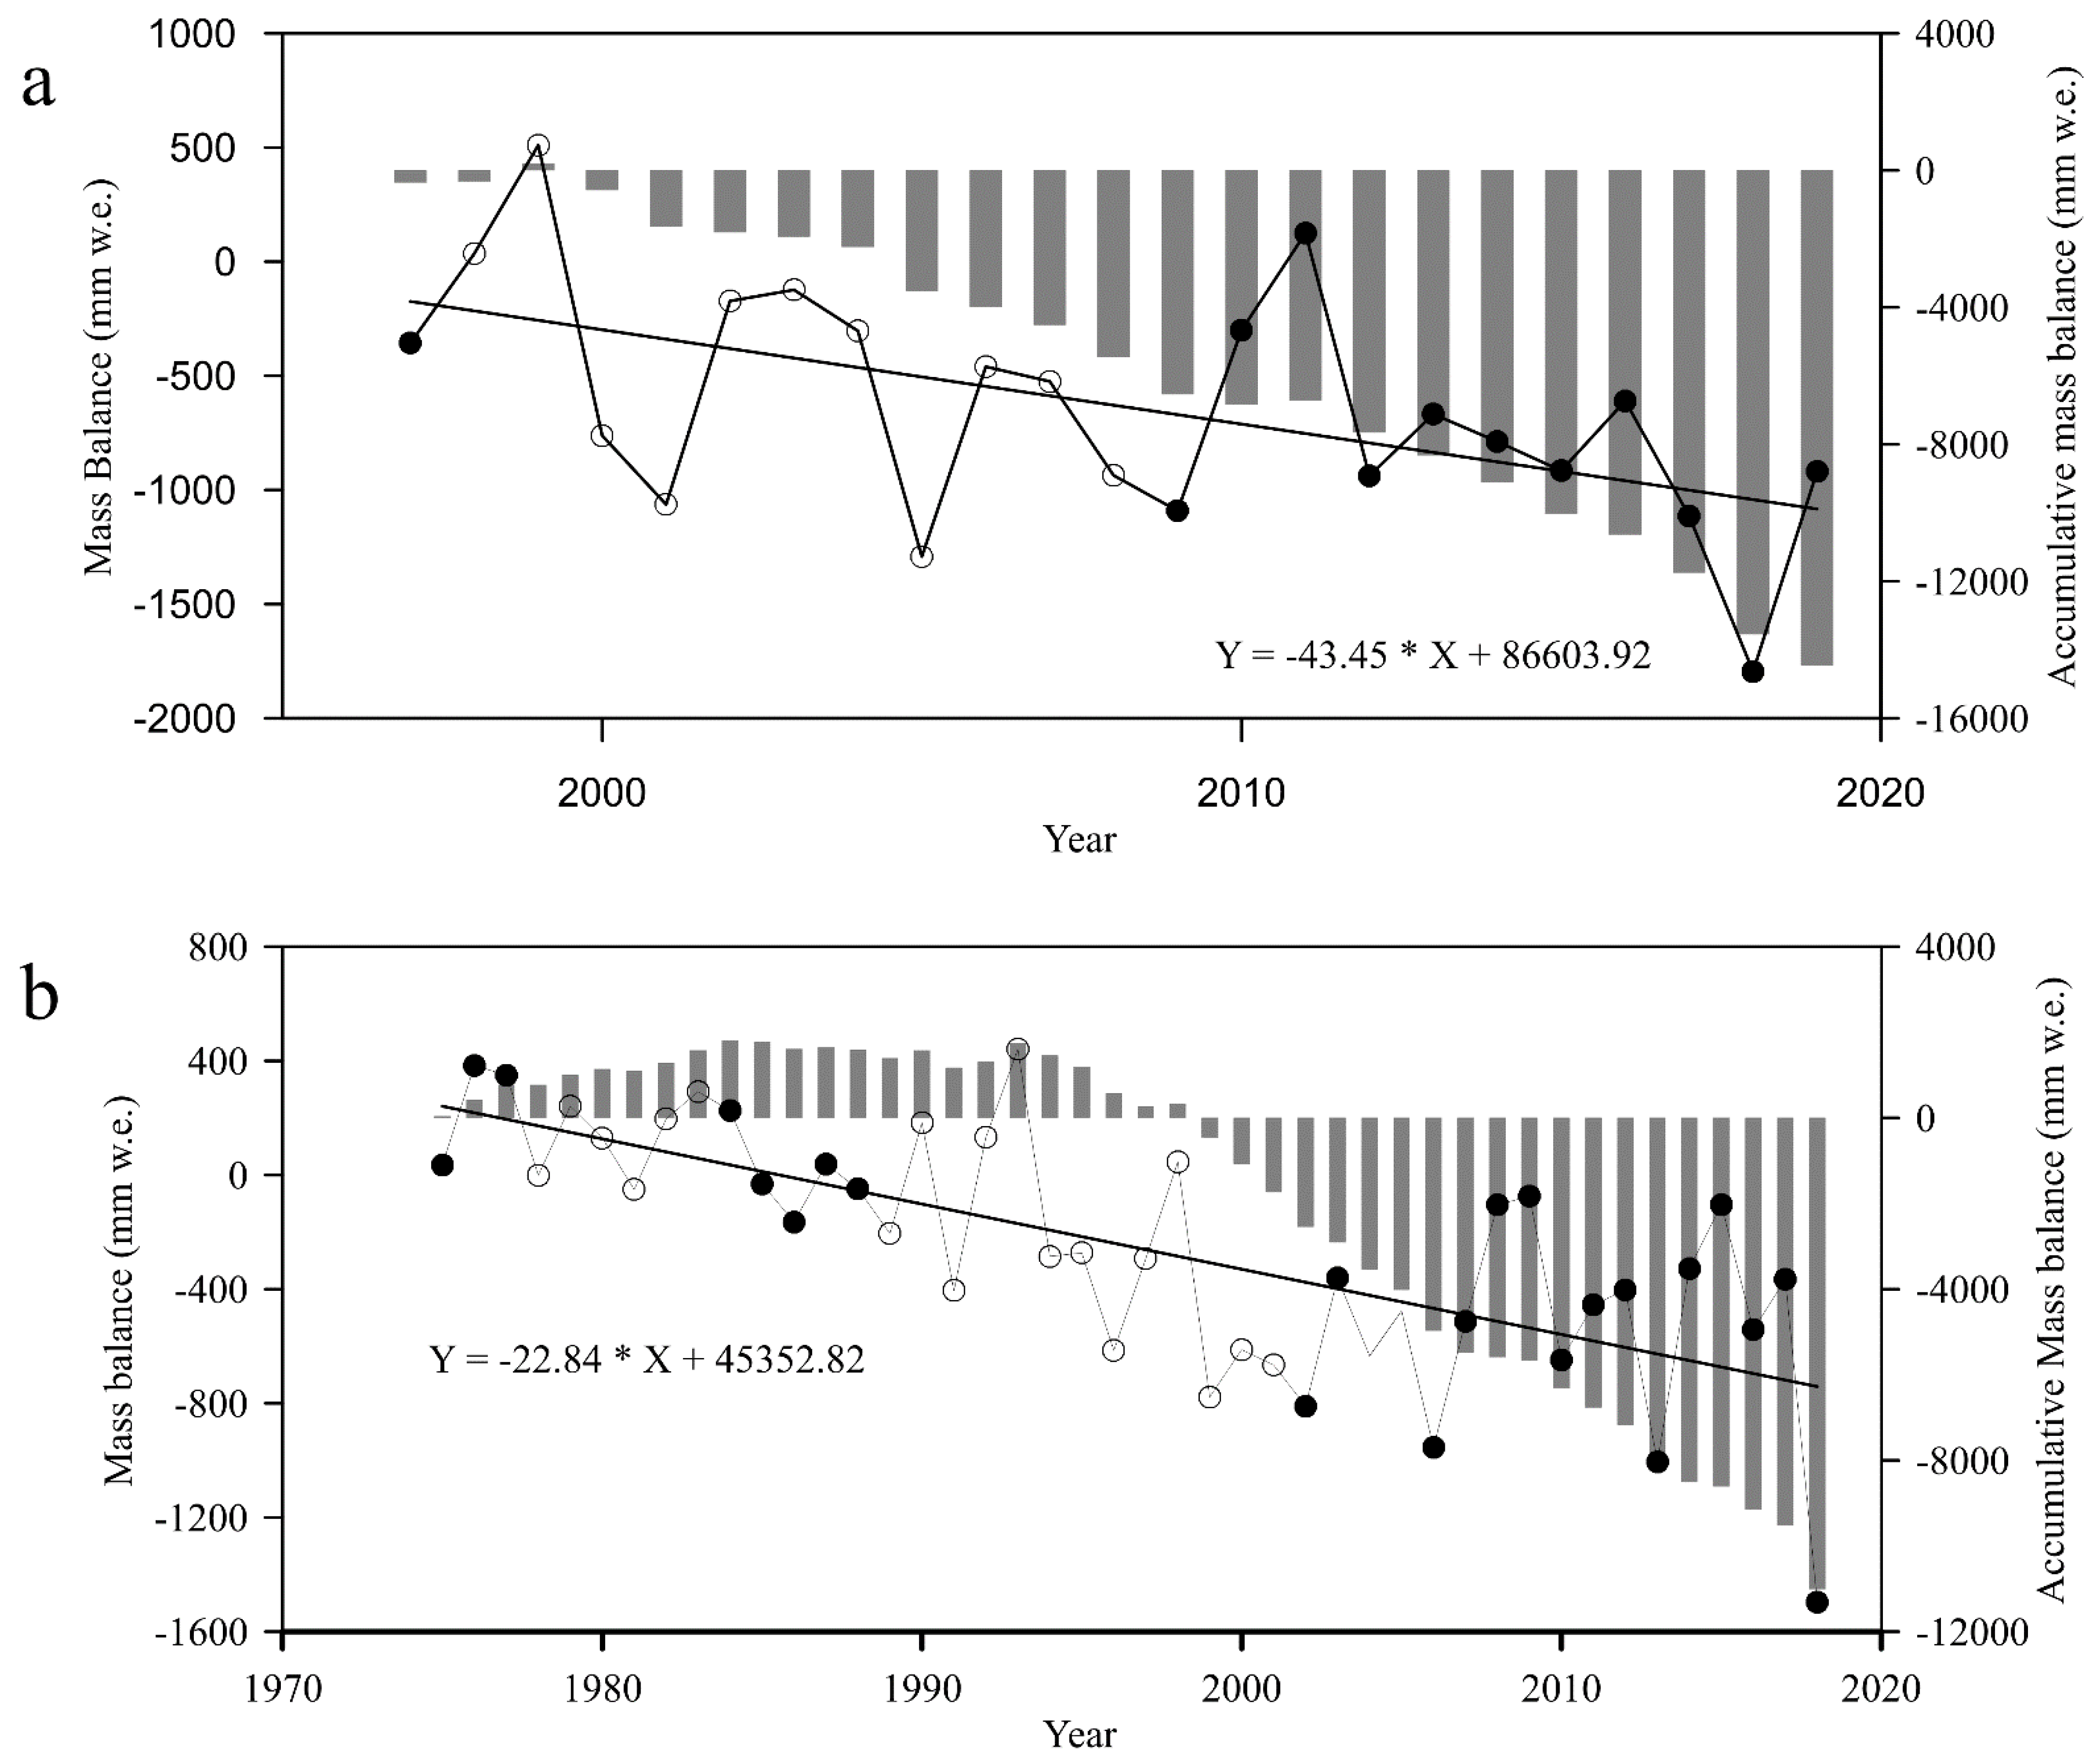
Using the best sub-model for the Yala Glacier driven by the combined data set of MODIS temperature and TRMM precipitation data, we have made a regression to get the mass blance rusults for the Yala Glacier, which is shown as Figure 6a:
MB = −16788.91 + 3177.81 × Ty + 1.98 × Py − 867.86 × Ts − 1521.92 × Tw − 0.92 × Pw
In the regression, Ty is annuan mean temperature, Py annual precipitation, Ts summer temperature, Tw winter temperature, Pw winter precipitation, R2 0.90 and RMSE 128.8 mm w.e.
Similarly, using the best sub-model for the Qiyi Glacier driven by the combined data set of in situ temperature and precipitation data associated with the lapse rate calculated from the MODIS temperature data from different elevations, we have made a regression to get the mass blance rusults for the Qiyi Glacier, which is shown as Figure 6b:
MB = −124.63 − 14606.2 × Ty + 193.62 × Py + 4642.50 × Ts − 191.84 × Ps + 9566.3 × Tw − 189.22 × Pw
In the regression, Ty is annuan mean temperature, Py annual precipitation, Ts summer temperature, Tw winter temperature, Pw winter precipitation, R2 0.82 and RMSE 226.6 mm w.e.a−1.
Based on the analyses of the remote sensing data and the in situ data as well as the results through modeling using four sub-models, we have analyzed the characteristics of glacier mass loss for both the Yala Glacier located in the southern TP and the Qiyi Glacier located in the northern TP.
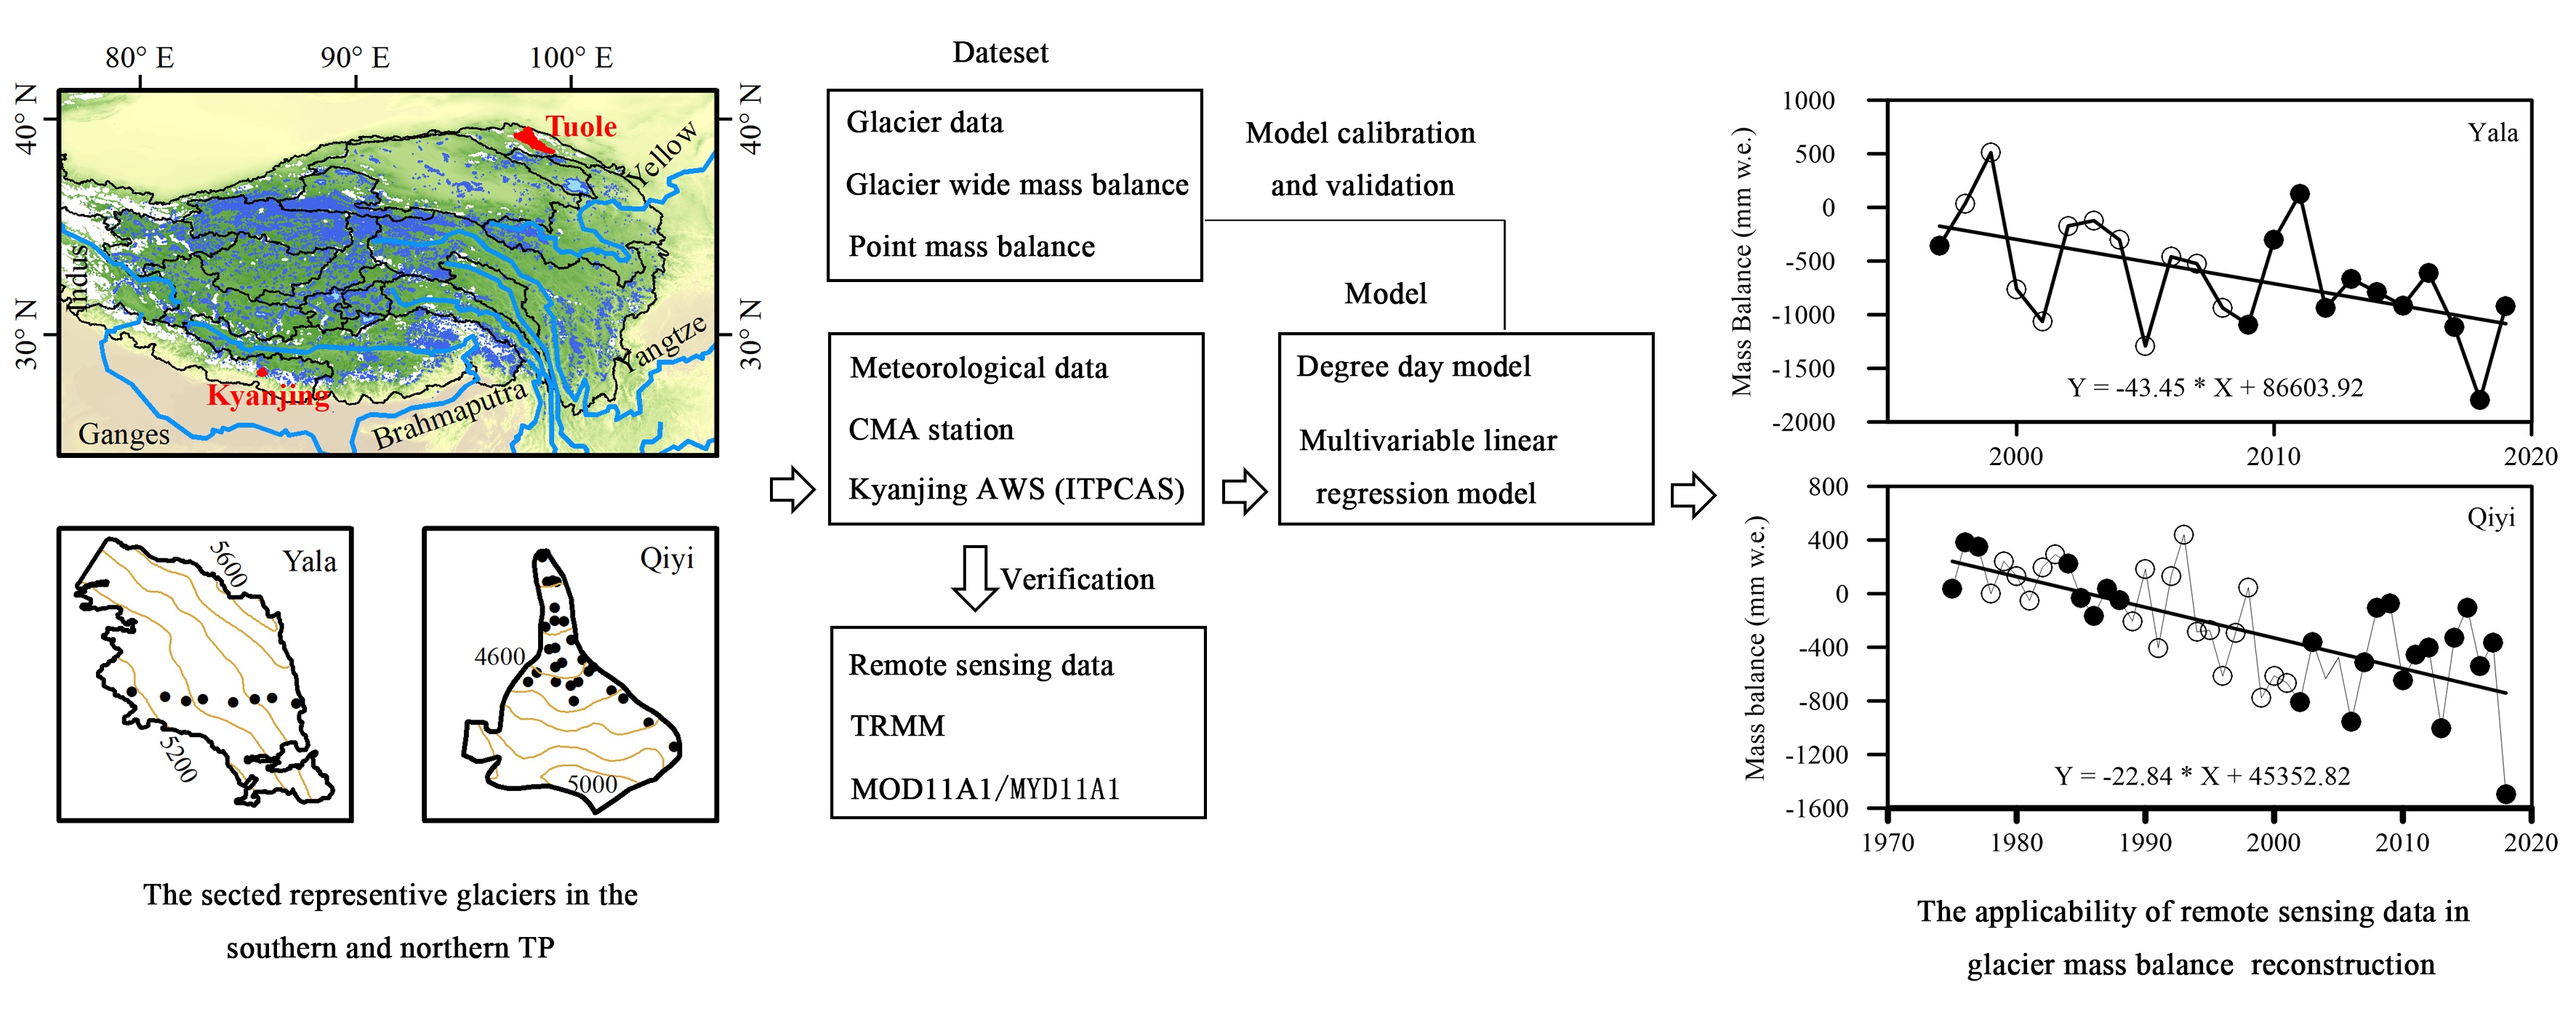
The average multi-year mass loss of the Yala Glacier is −736 mm w.e.a−1, while that of the Qiyi Glacier is −567 mm; the maximum mass loss is −1815 mm w.e.a−1 for the Yala Glacier and −1516 mm w.e.a−1 for the Qiyi Glacier. Based on a statistics of glacier mass loss comparison of the two glaciers in the same year, the mass loss of the Yala Glacier is much stronger than that of the Qiyi Glacier. From 2000 to 20018, the mass loss of the Yala Glacier is keeping at a rate −43.8 mm w.e.a−1, while that of Qiyi glacier is keeping at a rate of −9.4 mm w.e.a−1. The glacier mass loss of the Yala Glacier is significantly faster than that of the Qiyi Glacier on a longer time scale. The glacier mass loss of the Yala Glacier was low before 1996. It was only −357 mm w.e. in 1996, but entered into a rapid mass loss period in the 21st century, particularly after 2011, except 2012/13. At the same time, the Qiyi Glacier showed mild melt status compared with the Yala Glacier.
The major cause why the mass loss of the Yala Glacier is more intensive than that of the Qiyi Glacier is from the decrease of glacier accumulation associated with precipitation decrease under the weakening Indian monsoon and from the more intensified glacier ablation. In addition, the precipitation increases under the dominance of the westerly enhancing reduced the glacier ablation in the Qiyi Glacier. The more intensive glacier mass loss of the Yala Glacier than that of the Qiyi glacier is also related to the low latitude where glaciers receive more solar radiation, which will result in more intensive melt.
5. Conclusions
Remote sensing data and in situ data were obtained to study the glacier mass loss in the two galciers, the Yala Glacier in the Central Himalayas in the southern TP and the Qiyi Glacier in the Qilian Mountains in the northern TP. By obtaining the remote sensing data including MODIS land surface temperature and TRMM precipitation data, with calibration and validation with in situ data, the glacier mass loss were simulated. Based on the study of glacier mass loss together with the changes of temperature and precipitation, the climatological factors that resulted in the differences in the two glacier were analyzed. We concluded from the analyses that the remote sensing data are useful in the glacier mass loss study on the TP. When the remote sensing data are used to model the glacier mass loss parameters, they show that the MODIS temperature and TRMM precipitation, after a simply adjustment, can be used to drive effective models and get accurate mass loss results. The modeled results show different characteristics of glacier mass loss between the southern ansd northern parts of the TP. The Yala Glacier has not only been in a state of mass loss, but also in a status of intensive and accelerating mass loss. Our analyses have also shown that the average multi-year mass loss of the Yala Glacier is −736 mm w.e.a−1, with a maximum of −1815 mm w.e.a−1. At the same time, the Qiyi Glacier has experienced a mild glacier mass loss process compared with the Yala Glacier. The Qiyi Glacier’s mass loss is −567 mm with a maximum of −1516 mm w.e.a−1. Our results indicate that the mass loss of the Yala Glacier is much stronger and faster than that of the Qiyi Glacier.
Author Contributions
R.Y. has obtained the data, made the analyses and the figures, and written the text. J.S. has proposed the idea and designed the structure of the paper. All authors have read and agreed to the published version of the manuscript.
Funding
This research was funded by the Ministry of Science and Technology of China through the Second Tibetan Plateau Scientific Expedition and Research (STEP) program [grant no. 2019QZKK0206].
Conflicts of Interest
The authors declare no conflict of interest.
References
- Farinotti, D.; Huss, M.; Fürst, J.J.; Landmann, J.; Machguth, H.; Maussion, F.; Pandit, A. A consensus estimate for the ice thickness distribution of all glaciers on Earth. Nat. Geosci. 2019, 12, 168–173. [Google Scholar] [CrossRef] [Green Version]
- Viviroli, D.; Dürr, H.H.; Messerli, B.; Meybeck, M.; Weingartner, R. Mountains of the world water towers for humanity: Typology, mapping, and global significance. Water Resour. Res. 2007, 43, 74–79. [Google Scholar] [CrossRef] [Green Version]
- Yao, T.; Thompson, L.; Yang, W.; Yu, W.; Gao, Y.; Guo, X.; Yang, X.; Duan, K.; Zhao, H.; Xu, B.; et al. Different glacier status with atmospheric circulations in Tibetan Plateau and surroundings. Nat. Clim. Chang. 2012, 2, 663–667. [Google Scholar] [CrossRef]
- Zemp, M.; Huss, M.; Thibert, E.; Eckert, N.; McNabb, R.; Huber, J.; Barandun, M.; Machguth, H.; Nussbaumer, S.U.; Gärtner-Roer, I.; et al. Global glacier mass changes and their contributions to sea-level rise from 1961 to 2016. Nature 2019, 568, 382–386. [Google Scholar] [CrossRef] [PubMed] [Green Version]
- Liu, X.; Cheng, Z.; Yan, L.; Yin, Z. Elevation dependency of recent and future minimum surface air temperature trends in the Tibetan Plateau and its surroundings. Glob. Planet. Chang. 2009, 68, 164–174. [Google Scholar] [CrossRef]
- Liu, X.; Yin, Z.; Shao, X.; Qin, N. Temporal trends and variability of daily maximum and minimum, extreme temperature events, and growing season length over the eastern and central Tibetan Plateau during 1961–2003. J. Geophys. Res. Atmos. 2006, 111, D19109. [Google Scholar] [CrossRef] [Green Version]
- Yao, T.; Xue, Y.; Chen, D.; Chen, F.; Thompson, L.; Cui, P.; Koike, T.; Lau, W.K.M.; Lettenmaier, D.; Mosbrugger, V.; et al. Recent Third Pole’s rapid warming accompanies cryospheric melt and water cycle intensification and interactions between monsoon and environment: Multi-disciplinary approach with observation, modeling and analysis. Bull. Am. Meteorol. Soc. 2018, 100, 423–444. [Google Scholar] [CrossRef]
- Hugonnet, R.; McNabb, R.; Berthier, E.; Menounos, B.; Nuth, C.; Girod, L.; Farinotti, D.; Huss, M.; Dussaillant, I.; Brun, F.; et al. Accelerated global glacier mass loss in the early twenty-first century. Nature 2021, 592, 726–731. [Google Scholar] [CrossRef]
- Huss, M.; Hock, R. Global-scale hydrological response to future glacier mass loss. Nat. Clim. Chang. 2018, 8, 135–140. [Google Scholar] [CrossRef] [Green Version]
- Kraaijenbrink, P.D.A.; Bierkens, M.F.P.; Lutz, A.F.; Immerzeel, W.W. Impact of a global temperature rise of 1.5 degrees Celsius on Asia’s glaciers. Nature 2017, 549, 257–260. [Google Scholar] [CrossRef]
- Rounce, D.R.; Hock, R.; Shean, D.E. Glacier mass change in High Mountain Asia through 2100 using the open-source Python Glacier Evolution Model (PyGEM). Front. Earth Sci. 2020, 7, 331. [Google Scholar] [CrossRef] [Green Version]
- Kraaijenbrink, P.D.A.; Stigter, E.E.; Yao, T.; Immerzeel, W.W. Climate change decisive for Asia’s snow meltwater supply. Nat. Clim. Chang. 2021, 11, 591–597. [Google Scholar] [CrossRef]
- Zhang, Z.; Jiang, L.; Liu, L.; Sun, Y.; Wang, H. Annual glacier-wide mass balance (2000–2016) of the interior Tibetan Plateau reconstructed from MODIS albedo products. Remote Sens. 2018, 10, 1031–1036. [Google Scholar] [CrossRef] [Green Version]
- Potocki, M.; Mayewsky, P.A.; Mathews, T.; Perry, L.B.; Schwikowski, M.; Tait, A.M.; Korotkikh, E.; Clifford, H.M.; Kang, S.; Sherpa, T.C.; et al. Mt. Everest’s highest glacier is a sentinel for accelerating ice loss. npj Clim. Atmos. Sci. 2022, 5, 7. [Google Scholar] [CrossRef]
- Maurer, J.M.; Schaefer, J.M.; Rupper, S.; Corley, A. Acceleration of ice loss across the Himalayas over the past 40 years. Sci. Adv. 2019, 5, eaav7266. [Google Scholar] [CrossRef] [Green Version]
- Immerzeel, W.W.; Lutz, A.F.; Andrade, M.; Bahl, A.; Biemans, H.; Bolch, T.; Hyde, S.; Brumby, S.; Davies, B.J.; Elmore, A.C.; et al. Importance and vulnerability of the world’s water towers. Nature 2020, 577, 364–369. [Google Scholar] [CrossRef]
- Biemans, H.; Siderius, C.; Lutz, A.F.; Nepal, S.; Ahmad, B.; Hassan, T.; von Bloh, W.; Wijngaard, R.R.; Wester, P.; Shrestha, A.B.; et al. Importance of snow and glacier mass loss water for agriculture on the Indo-Gangetic Plain. Nat. Sustain. 2019, 2, 594–601. [Google Scholar] [CrossRef] [Green Version]
- Pritchard, H.D. Asia’s shrinking glaciers protect large populations from drought stress. Nature 2019, 569, 649–654. [Google Scholar] [CrossRef]
- Yao, T.; Bolch, T.; Chen, D.; Gao, J.; Immerzeel, W.W.; Piao, S.; Su, F.; Thompson, L.; Wada, Y.; Wang, L.; et al. The imbalance of the Asian Water Tower. Nat. Rev. Earth Environ. 2022, 3, 618–632. [Google Scholar] [CrossRef]
- Jacob, T.; Wahr, J.; Pfeffer, W.T.; Swenson, S. Recent contributions of glaciers and ice caps to sea level rise. Nature 2012, 482, 514–518. [Google Scholar] [CrossRef]
- Veh, G.; Korup, O.; Walz, A. Hazard from Himalayan glacier lake outburst floods. Proc. Natl. Acad. Sci. USA 2020, 117, 907–912. [Google Scholar] [CrossRef] [PubMed]
- Kääb, A.; Leinss, S.; Gilbert, A.; Bühler, Y.; Gascoin, S.; Evans, S.G.; Bartelt, P.; Berthier, E.; Brun, F.; Chao, W.; et al. Massive collapse of two glaciers in western Tibet in 2016 after surge-like instability. Nat. Geosci. 2018, 11, 114–120. [Google Scholar] [CrossRef] [Green Version]
- Yao, T.; Yu, W.; Wu, G.; Xu, B.; Yang, W.; Zhao, H.; Wang, W.; Li, S.; Wang, N.; Li, Z.; et al. Glacier anomalies and relevant disaster risks on the Tibetan Plateau and surroundings. Chin. Sci. Bull. 2019, 64, 2770–2782. (In Chinese) [Google Scholar]
- Ragettli, S.; Bolch, T.; Pellicciotti, F. Heterogeneous glacier thinning patterns over the last 40 years in Langtang Himal, Nepal. Cryosphere 2016, 10, 2075–2097. [Google Scholar] [CrossRef] [Green Version]
- Zhou, Y.; Li, Z.; Li, J.; Zhao, R.; Ding, X. Glacier mass balance in the Qinghai-Tibet Plateau and its surroundings from the mid-1970s to 2000 based on Hexagon KH-9 and SRTM DEMs. Remote Sens. Environ. 2018, 210, 96–112. [Google Scholar] [CrossRef]
- King, O.; Bhattacharya, A.; Bhambri, R.; Bolch, T. Glacial lakes exacerbate Himalayan glacier mass loss. Sci. Rep. 2019, 9, 18145. [Google Scholar] [CrossRef] [Green Version]
- Lovell, A.M.; Carr, J.R.; Stokes, C.R. Spatially variable glacier changes in the Annapurna Conservation area, Nepal, 2000 to 2016. Remote Sens. 2019, 11, 1452. [Google Scholar] [CrossRef] [Green Version]
- Zhao, X.; Wang, X.; Wei, J.; Jiang, Z.; Zhang, Y.; Liu, S. Spatiotemporal variability of glacier changes and their controlling factors in the Kanchenjunga region, Himalaya based on multi-source remote sensing data from 1975 to 2015. Sci. Total Environ. 2022, 745, 140995. [Google Scholar] [CrossRef]
- Miles, E.S.; Willis, I.; Buri, P.; Steiner, J.F.; Arnold, N.S.; Pellicciotti, F. Surface pond energy absorption across four Himalayan glaciers accounts for 1/8 of total catchment ice loss. Geophys. Res. Lett. 2018, 45, 10464–10473. [Google Scholar] [CrossRef] [Green Version]
- Bonekamp, P.N.J.; de Kok, R.J.; Collier, E.; Immerzeel, W.W. Contrasting meteorological drivers of the glacier mass balance between the Karakoram and Central Himalaya. Front. Earth Sci. 2019, 7, 107. [Google Scholar] [CrossRef]
- Sun, M.; Liu, S.; Yao, X.; Guo, W.; Xu, J. Glacier changes in the Qilian Mountains in the past half-century: Based on the revised First and Second Chinese Glacier Inventory. J. Geograph. Sci. 2018, 28, 206–220. [Google Scholar] [CrossRef]
- Pu, J.; Yao, T.; Duan, K.; Sakai, A.; Fujita, K.; Matsuda, Y. Mass balance of the Qiyi glacier in the Qilian mountains: A new observation. J. Glaciol. Geocryol. 2005, 27, 199–206. (In Chinese) [Google Scholar]
- Wang, Y.; Ren, J.; Qin, D.; Qin, X. Regional glacier volume changes derived from satellite data: A case study in the Qilian Mountains. J. Glaciol. Geocryol. 2013, 35, 583–592. (In Chinese) [Google Scholar]
- He, J.; Wang, N.; Chen, A.; Yang, X.; Hua, T. Glacier changes in the Qilian Mountains, Northwest China, between the 1960s and 2015. Water 2019, 11, 623. [Google Scholar] [CrossRef] [Green Version]
- Cao, B.; Pan, B.; Wen, Z.; Guan, W.; Li, K. Changes in glacier mass in the Lenglongling Mountains from 1972 to 2016 based on remote sensing data and modeling. J. Hydrol. 2019, 578, 124010. [Google Scholar] [CrossRef]
- Wang, S.; Yao, T.; Tian, L.; Pu, J. Glacier mass variation and its effect on surface runoff in the Beida River catchment during 1957–2013. J. Glaciol. 2017, 63, 523–534. [Google Scholar] [CrossRef] [Green Version]
- Zhang, X.; Li, H.; Zhang, Z.; Wu, Q.; Zhang, S. Recent glacier mass balance and area changes from DEMs and Landsat Images in Upper Reach of Shule River Basin, northeastern edge of Tibetan Plateau during 2000 to 2015. Water 2018, 10, 796. [Google Scholar] [CrossRef] [Green Version]
- Wang, X.; Tang, Z.G.; Wang, J.; Wang, X.; Wei, J. Monitoring of snowline altitude at the end of melting season in High Mountain Asia based on MODIS snow cover products. Acta Geogr. Sin. 2020, 75, 470–484. (In Chinese) [Google Scholar]
- Li, Z.; Yuan, R.; Feng, Q.; Zhang, B.; Lv, Y.; Li, Y.; Wei, W.; Chen, W.; Ning, T.; Gui, J.; et al. Climate background, relative rate, and runoff effect of multiphase water transformation in Qilian Mountains, the third pole region. Sci. Total Environ. 2019, 663, 315–328. [Google Scholar] [CrossRef]
- Acharya, A.; Kayastha, R.B. Mass and energy balance estimation of Yala Glacier (2011–2017), Langtang Valley, Nepal. Water 2019, 11, 6. [Google Scholar] [CrossRef] [Green Version]
- Fujita, K.; Takeuchi, N.; Seko, K. Glaciological observations of Yala Glacier in Langtang Valley, Nepal Himalayas, 1994 and 1996. Bull. Glacier Res. 1998, 16, 75–78. [Google Scholar]
- Sugiyama, S.; Fukui, K.; Fujita, K.; Tone, K.; Yamaguchi, S. Changes in ice thickness and flow velocity of Yala Glacier, Langtang Himal, Nepal, from 1982 to 2009. Ann. Glaciol. 2013, 54, 157–162. [Google Scholar] [CrossRef] [Green Version]
- Baral, P.; Kayastha, R.B.; Immerzeel, W.W.; Pradhananga, N.S.; Bhattarai, B.C.; Shahi, S.; Galos, S.; Springer, C.; Joshi, S.P.; Mool, P.K. Preliminary results of mass-balance observations of Yala Glacier and analysis of temperature and precipitation gradients in Langtang Valley, Nepal. Ann. Glaciol. 2014, 55, 9–14. [Google Scholar] [CrossRef] [Green Version]
- Wang, N.; He, J.; Pu, J.; Jiang, X.; Jing, Z. Variations in equilibrium line altitude of the Qiyi Glacier, Qilian Mountains, over the past 50 years. Chin. Sci. Bull. 2010, 55, 3810–3817. [Google Scholar] [CrossRef]
- Wang, S.; Yao, T.; Pu, J. Spatial and temporal variations in mass balance of Qiyi Glacier in Qilian Mountains. J. Nat. Resour. 2020, 35, 399–412. (In Chinese) [Google Scholar]
- Fujita, K.; Ageta, Y. Effect of summer accumulation on glacier mass balance on the Tibetan Plateau revealed by mass-balance model. J. Glaciol. 2000, 46, 244–252. [Google Scholar] [CrossRef]
- Zhou, W.; Peng, B.; Shi, J.; Wang, T.; Dhital, Y.P.; Yao, R.; Yu, Y.; Lei, Z.; Zhao, R. Estimating High Resolution Daily Air Temperature Based on Remote Sensing Products and Climate Reanalysis Datasets over Glacierized Basins: A Case Study in the Langtang Valley, Nepal. Remote Sens. 2017, 9, 959. [Google Scholar] [CrossRef] [Green Version]
- Zhang, S.; Wang, D.; Qin, Z.; Zheng, Y.; Guo, J. Assessment of the GPM and TRMM precipitation products using the Rain Gauge Network over the Tibetan Plateau. J. Meteorol. Res. 2018, 32, 324–336. [Google Scholar] [CrossRef]
- Hock, R. Glacier melt: A review of processes and their modelling. Progr. Phys. Geogr. 2005, 29, 362–391. [Google Scholar] [CrossRef]
- Guo, W.; Xu, J.; Liu, S.; Shangguan, D.; Wu, L.; Yao, X.; Zhao, J.; Liu, Q.; Jiang, Z.; Li, P. The Second Glacier Inventory Dataset of China (Version 1.0); Cold and Arid Regions Science Data Center: Lanzhou, China, 2014. [Google Scholar]
- RGI Consortium. Randolph Glacier Inventory—A Dataset of Global Glacier Outlines, Version 6; National Snow and Ice Data Center: Boulder, CO, USA, 2017; p. 576. [CrossRef]
- Wan, Z.; Zhang, Y.; Zhang, Q.; Li, Z.L. Quality assessment and validation of the MODIS global land surface temperature. Int. J. Remote Sens. 2004, 25, 261–274. [Google Scholar] [CrossRef]
- Wan, Z.M. New refinements and validation of the MODIS Land-Surface Temperature/Emissivity products. Remote Sens. Environ. 2008, 112, 59–74. [Google Scholar] [CrossRef]
- Hu, Y.; Zhong, L.; Ma, Y.; Zou, M.; Xu, K.; Huang, Z.; Feng, L. Estimation of the land surface temperature over the Tibetan Plateau by using Chinese FY-2C Geostationary Satellite Data. Sensors 2018, 18, 376. [Google Scholar] [CrossRef] [PubMed] [Green Version]
- Fujita, K. Effect of precipitation seasonality on climatic sensitivity of glacier mass balance. Earth Planet. Sci. Lett. 2008, 276, 14–19. [Google Scholar] [CrossRef]
- Racoviteanu, E.; Rittger, K.; Armstrong, R. An automated approach for estimating snowline altitudes in the Karakoram and Eastern Himalaya from remote sensing. Front. Earth Sci. 2019, 7, 220. [Google Scholar] [CrossRef] [Green Version]
- Guo, Z.; Wang, N.; Shen, B.; Gu, Z.; Wu, Y.; Chen, A. Spatiotemporal trends in glacier snowline altitude at the end of the melt season in the Qilian Mountains, China. Remote Sens. 2021, 13, 4935. [Google Scholar] [CrossRef]
- Wang, S.; Pu, J.; Wang, N. Study on mass balance and sensitivity to climate change in summer on the Qiyi Glacier, Qilian Mountains. Sci. Cold Arid. Reg. 2012, 4, 281–287. [Google Scholar]
Figure 1.
Locations of the Yala Glacier and Qiyi Glacier. In the figure, (a) is for the locations of the Yala Glacier and Qiyi Glacier, (b,d) are for the river basin where the Yalal Glacier is located and the contour map of the Yala Glacier, (c,e) for the river basin where the Qiyi Glacier is located and the contour map of the Qiyi Glacier.

Figure 2.
The glacier surface temperature data for the Yala Glacier. In the figure, we have shown the daily mean, minimum and maximum temperatures from MOD11A1 and MYD11A1 products.
Figure 2.
The glacier surface temperature data for the Yala Glacier. In the figure, we have shown the daily mean, minimum and maximum temperatures from MOD11A1 and MYD11A1 products.
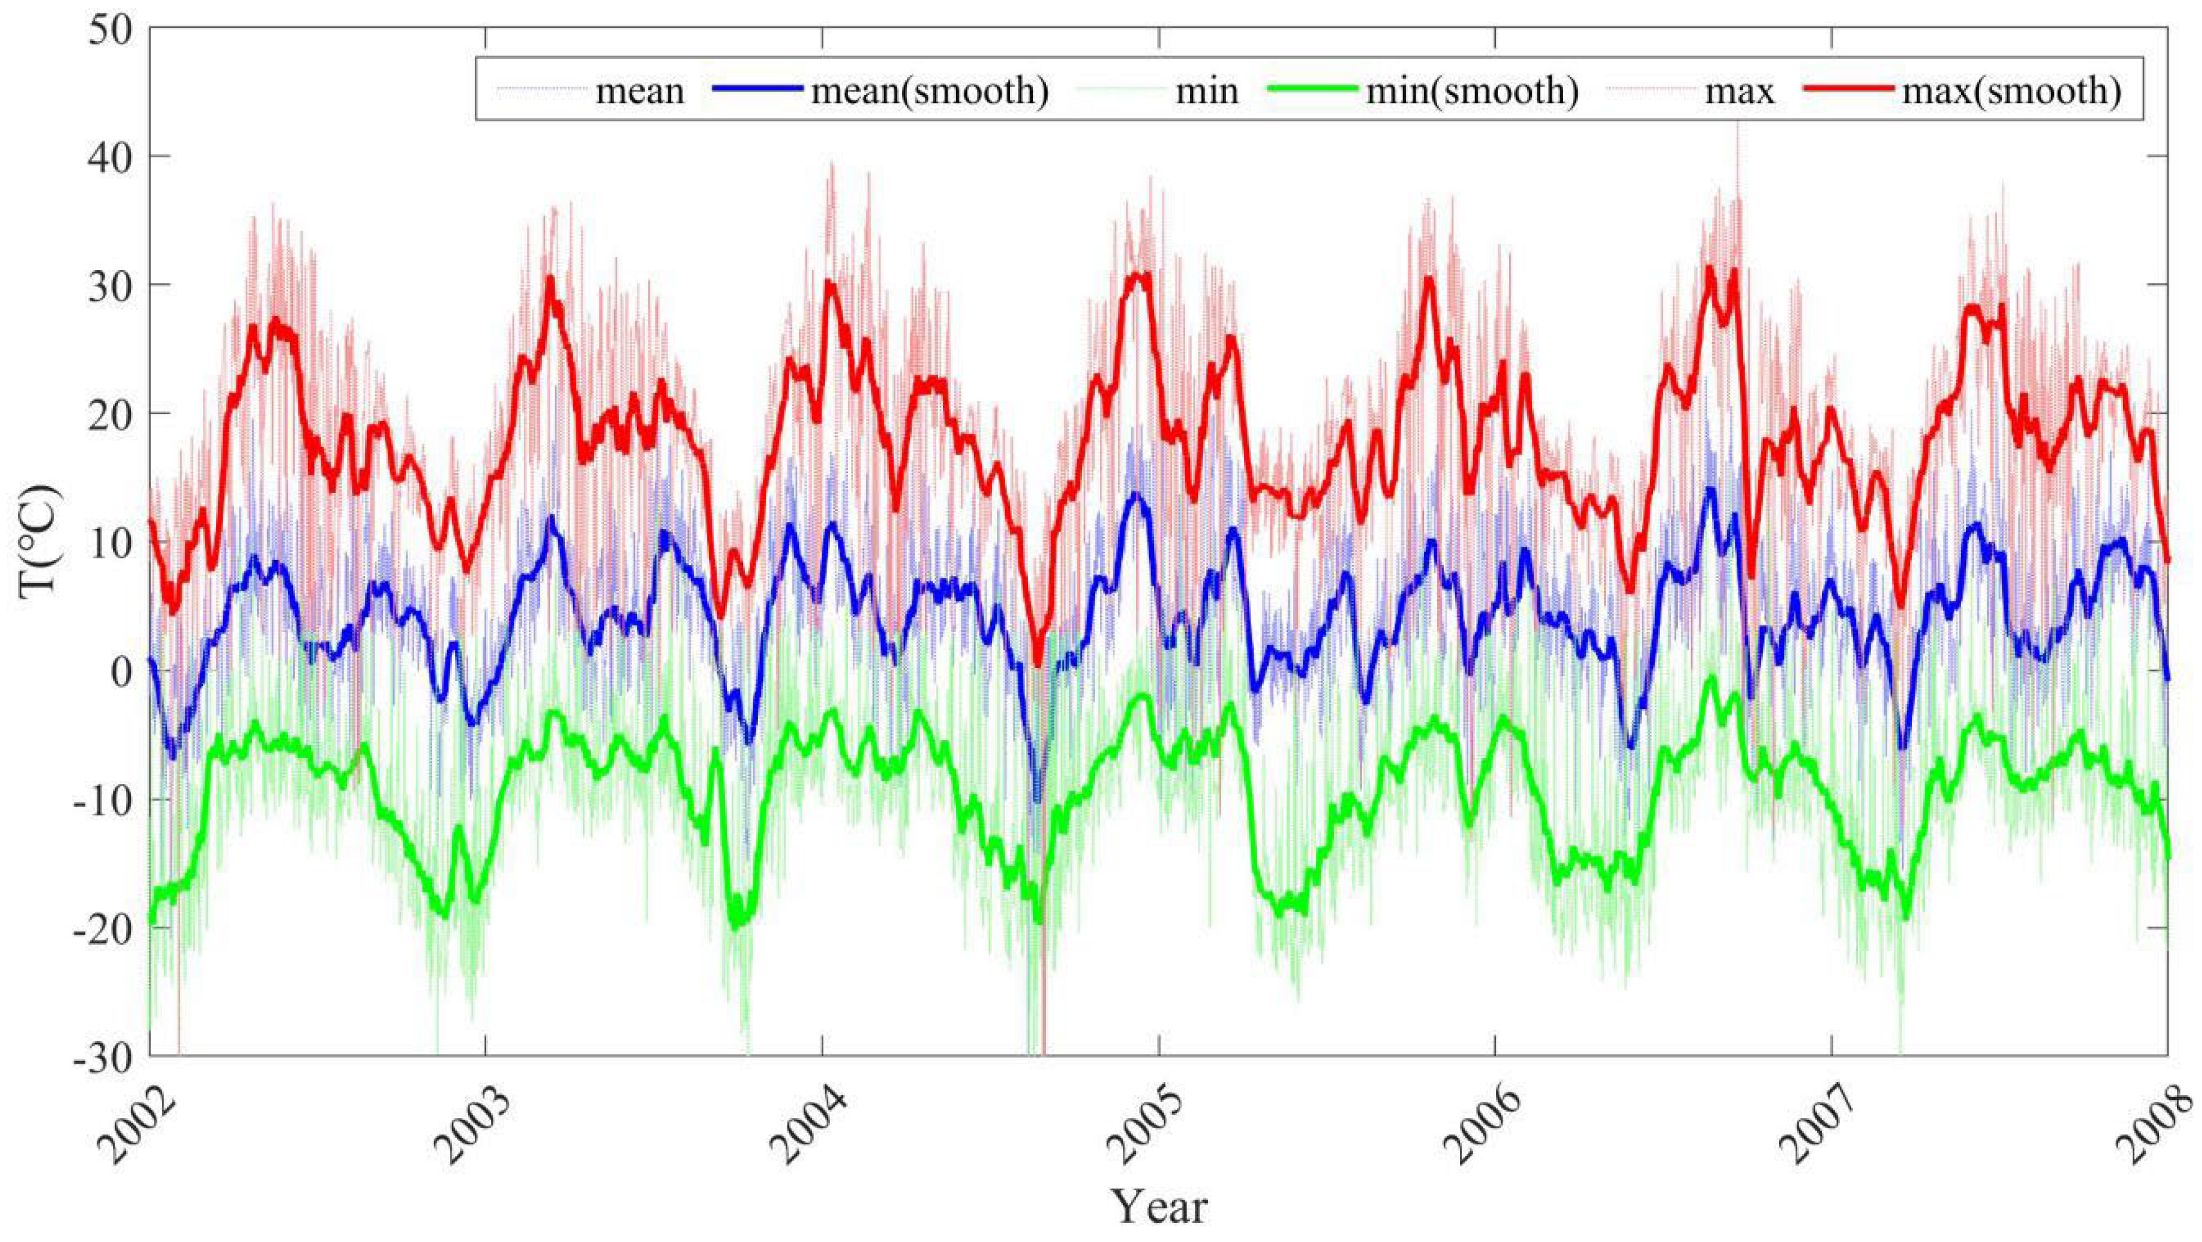
Figure 3.
The glacier surface temperature data for the Qiyi Glacier. In the figure, we have shown the daily mean, minimum and maximum temperatures from MOD11A1 and MYD11A1 products.
Figure 3.
The glacier surface temperature data for the Qiyi Glacier. In the figure, we have shown the daily mean, minimum and maximum temperatures from MOD11A1 and MYD11A1 products.

Figure 4.
The modeled glacier mass loss and the stake measured mass loss as well as point mass loss of the Yala Glacier by the four sub-models. In the figure, the red circles are the data of calibration period and the blue crosses are the data of validation period; (a,c,e,g) are the simulated GMB (Glacier Mass Blalnce for the whole glacier) results of the four sub-models; (b,d,f,h) are the simulated PMB (Poin Mass Balance of the glacier).
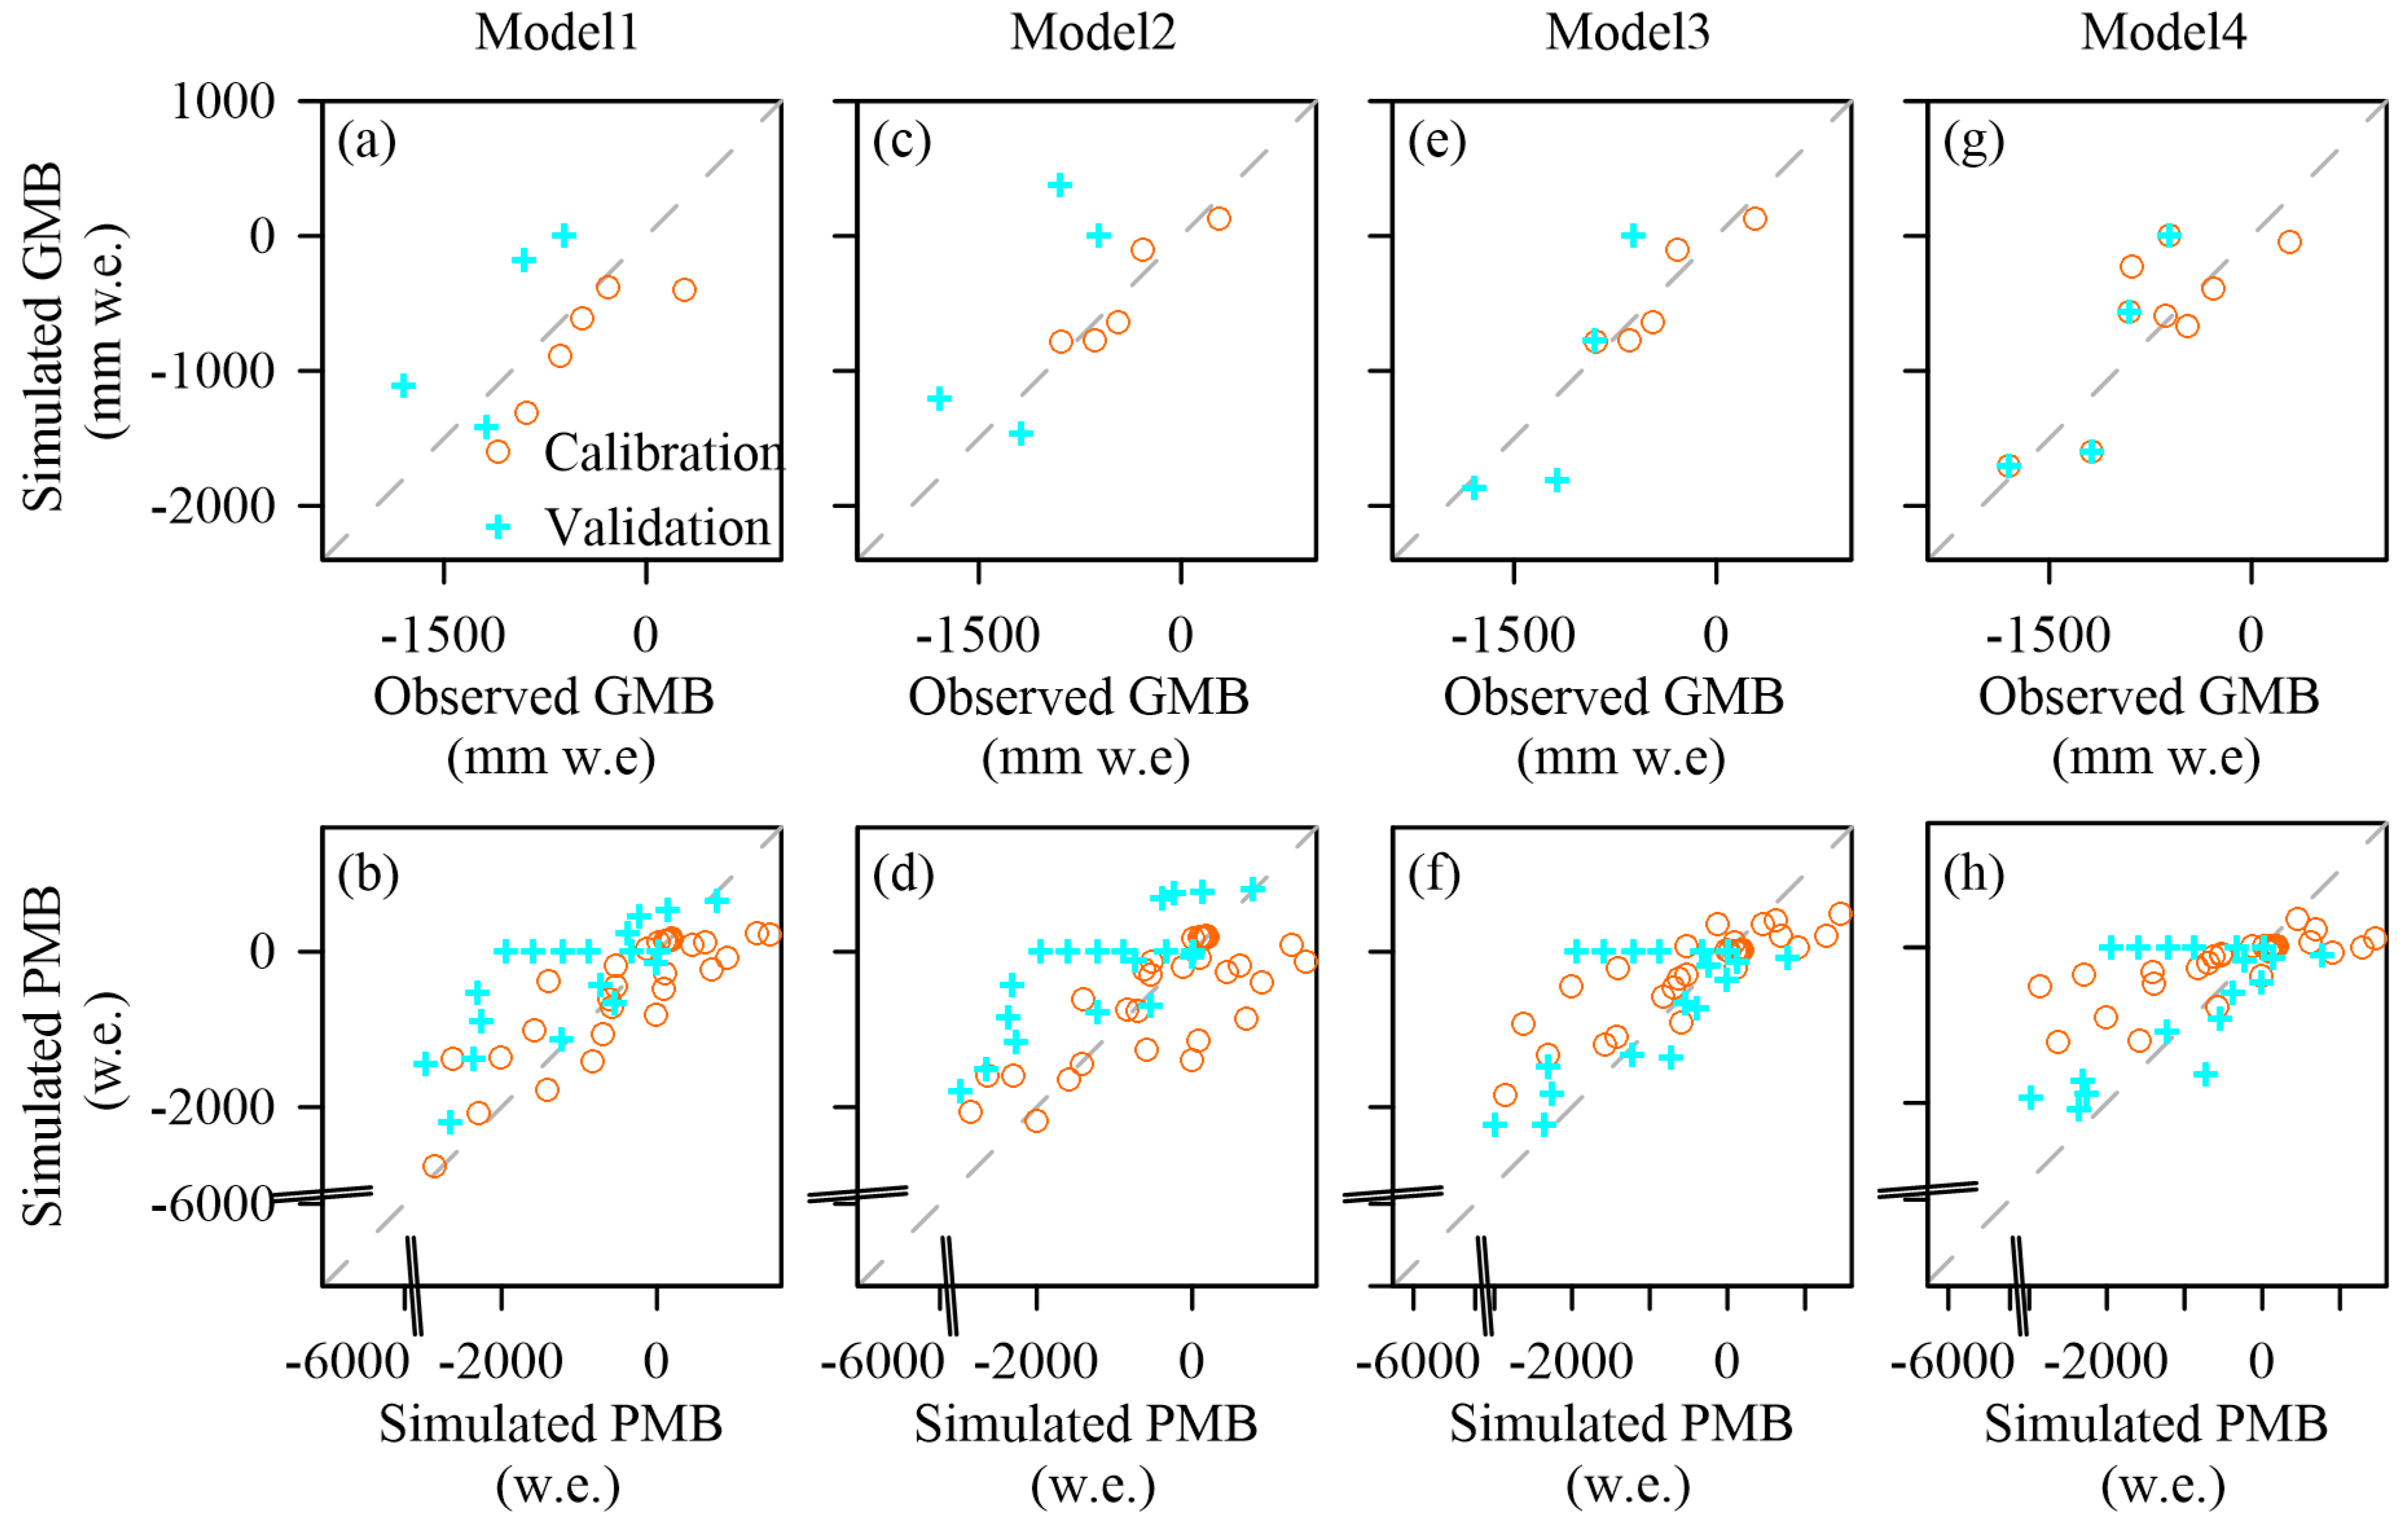
Figure 5.
The modeled glacier mass loss and stake measured mass loss as well as point mass loss of the Qiyi Glacier by using the four sub-models. In the figure, the red circles are the data of calibration period and the blue crosses are the data of validation period; (a,c,e,g) are the simulated GMB (Glacier Mass Blalnce for the whole glacier) results of the four sub-models; (b,d,f,h) are the simulated PMB (Poin Mass Balance of the glacier).
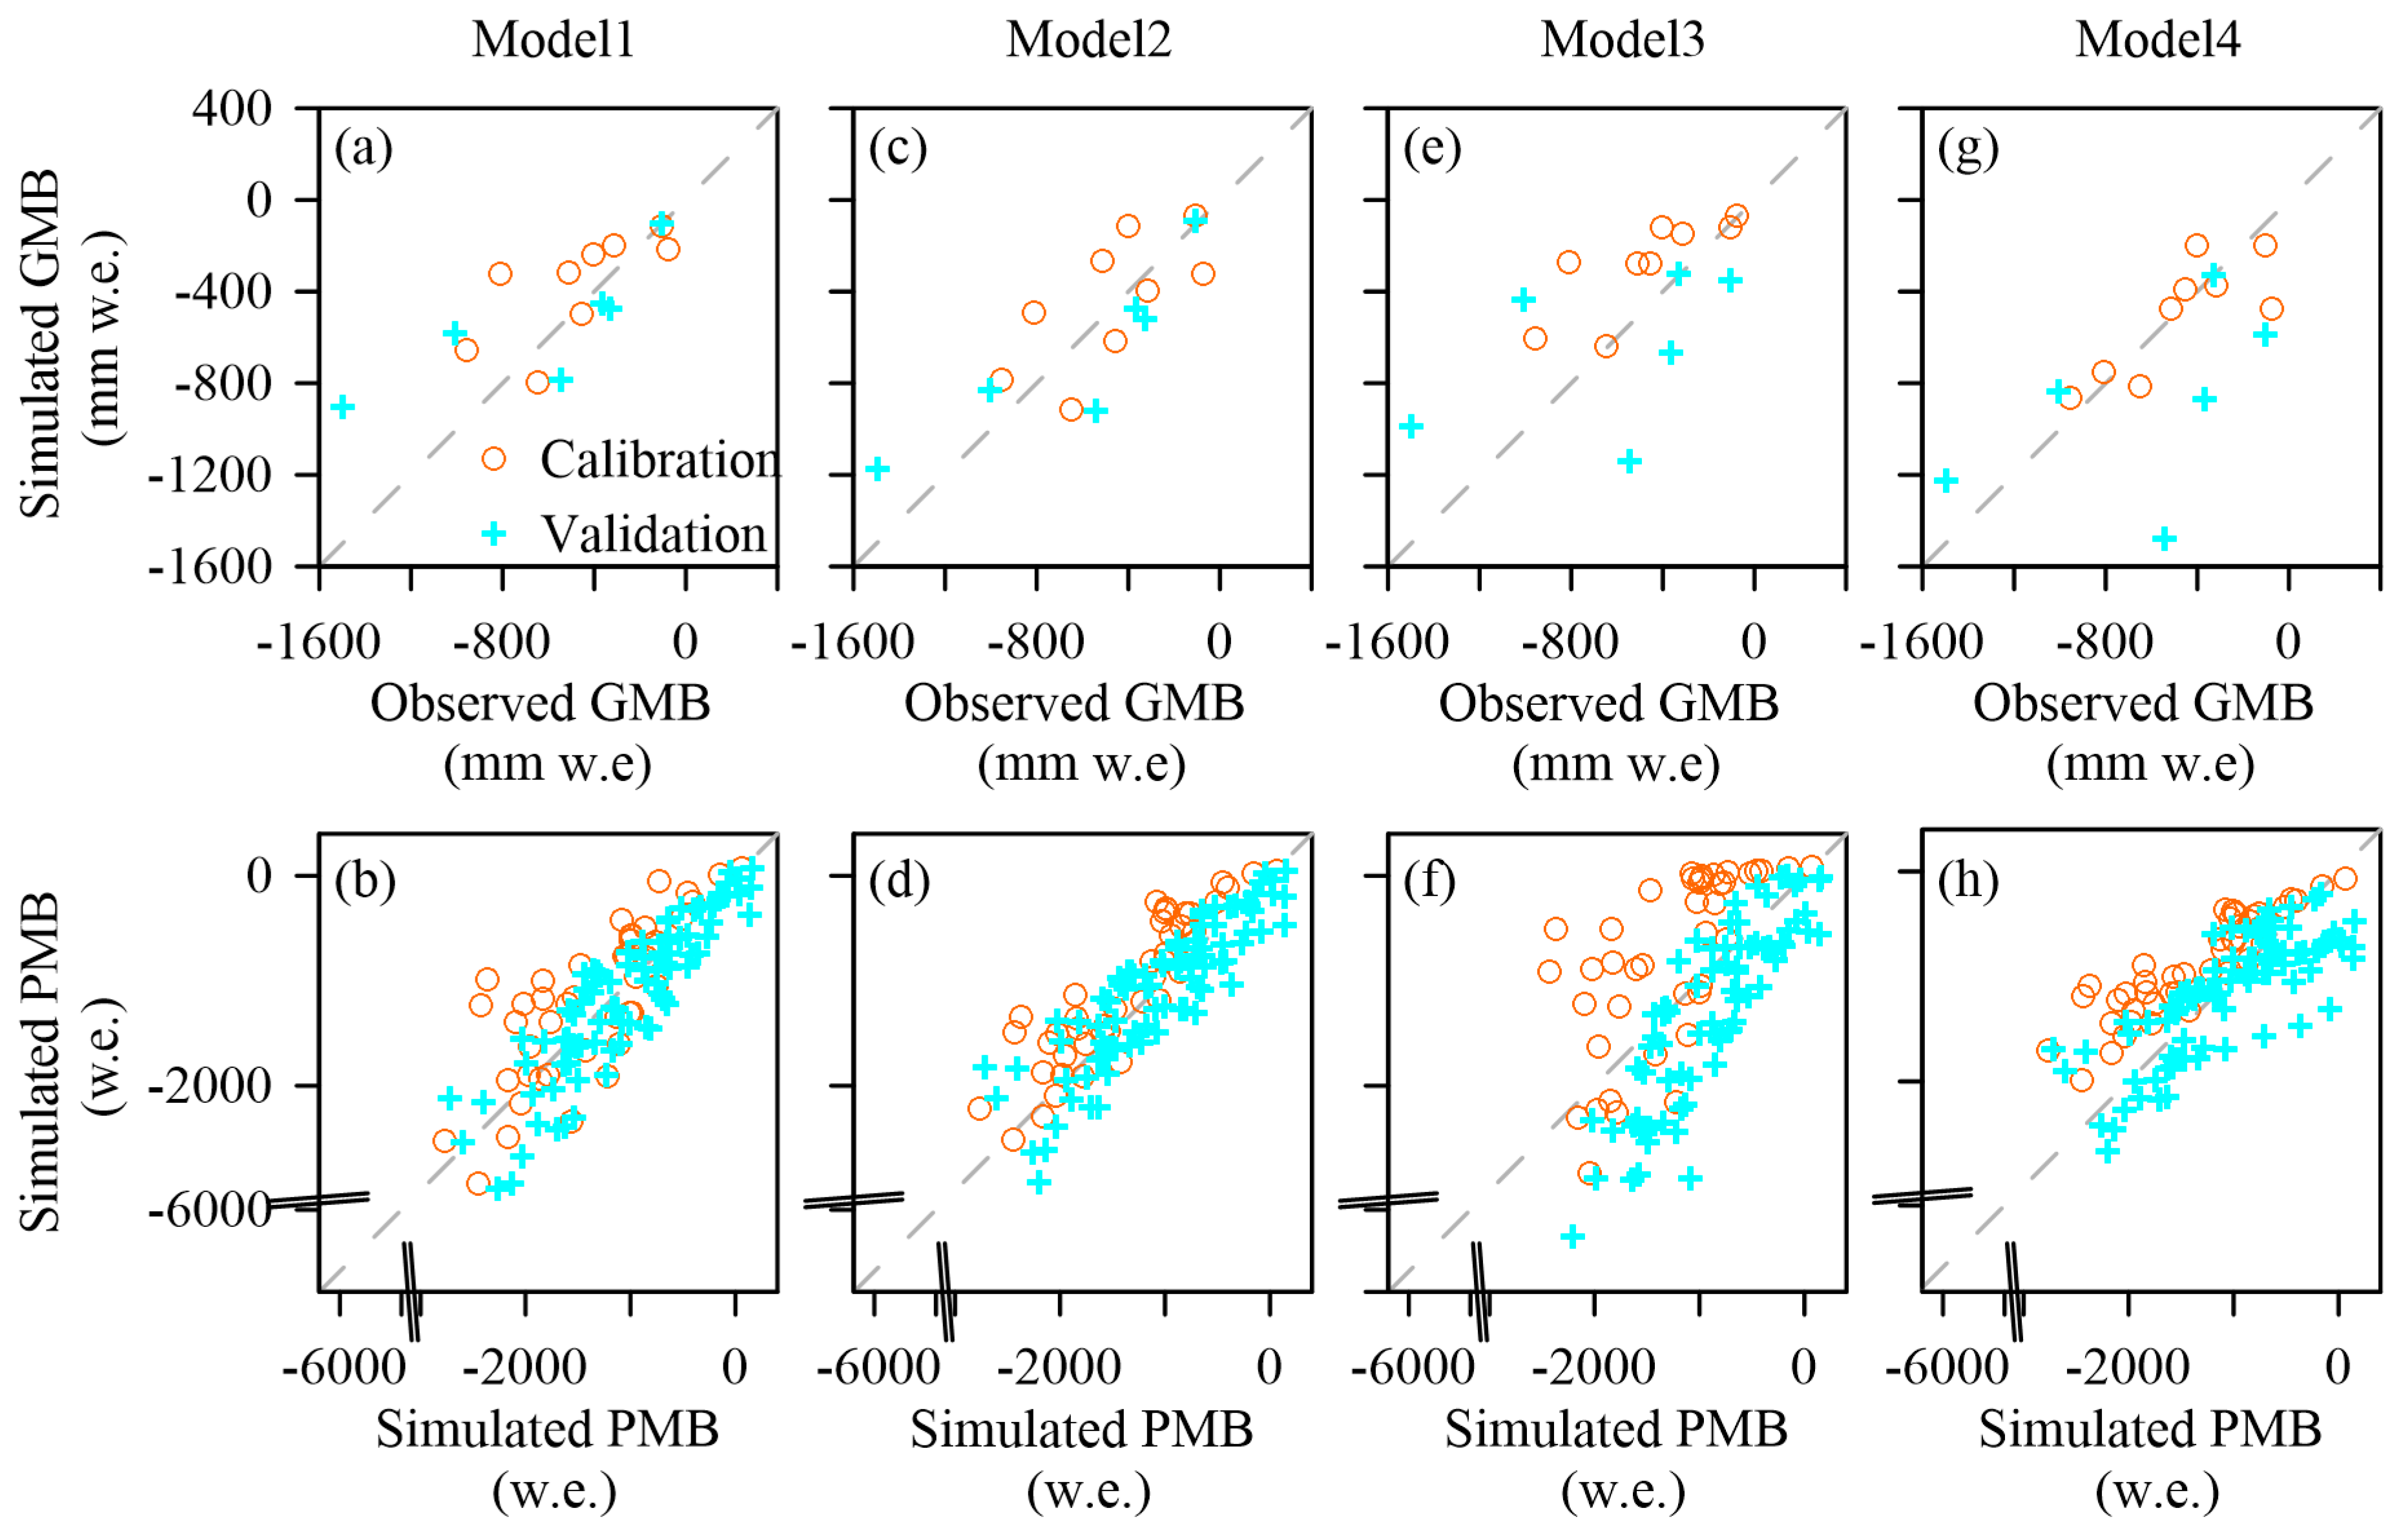
Figure 6.
The modeled glacier mass balance changes of the of the Yala Glacier and Qiyi Glacier. In the figure, (a) is for the modeled glacier mass balance changes of the Yala Glacier and the (b) for the modeled glacier mass balance changes of the Qiyi Glacier.
Figure 6.
The modeled glacier mass balance changes of the of the Yala Glacier and Qiyi Glacier. In the figure, (a) is for the modeled glacier mass balance changes of the Yala Glacier and the (b) for the modeled glacier mass balance changes of the Qiyi Glacier.

Table 1.
List of model parameters, their initial ranges.
| Symbol | Parameter | Range |
|---|---|---|
| Gradient of precipitation | 0–0.2 m−1 | |
| Lapse rate of temperature | 0.2–0.9 °C/100 m | |
| Phase threshold for snow | 2–6 °C | |
| Phase threshold for rain | −4–2 °C | |
| Degree day factor of fresh snow | 1–5 mm w.e./°C | |
| Degree day factor of ice | 1–10 mm w.e./°C |
Table 2.
The optimal driving data parameters of the sub-models 1–4 for the Yala Glacier.
| Parameters | Sub-Model 1 | Sub-Model 2 | Sub-Model 3 | Sub-Model 4 |
|---|---|---|---|---|
| TLR | 0.46 °C | 0.41 °C | 0.51 °C | 0.42 °C |
| Tsnow | 1.78 °C | 2.97 °C | 0.20 °C | 2.87 °C |
| Train | 3.72 °C | 3.0 °C | 3.49 °C | 3.64 °C |
| DDFice | 6.46 °C | 5.36 °C | 7.95 °C | 6.45 °C |
| DDFsnow | 5.08 °C | 3.11 °C | 5.79 °C | 3.33 °C |
Table 3.
The optimal driving data parameters of the sub-models 1–4 for the Qiyi Glacier.
| Parameters | Sub-Model 1 | Sub-Model 2 | Sub-Model 3 | Sub-Model 4 |
|---|---|---|---|---|
| TLR | 0.78 °C | 0.94 °C | ||
| Tsnow | 1.61 °C | 2.70 °C | 0.55 °C | 2.84 °C |
| Train | 3.10 °C | 5.62 °C | 5.13 °C | 5.71 °C |
| DDFice | 4.04 °C | 3.05 °C | 11.10 °C | 2.48 °C |
| DDFsnow | 1.64 °C | 0.78 °C | 2.93 °C | 1.25 °C |
In the above two tables, temperature lapse rate (TLR) is based on MODIS temperature data, phase threshold for snow (Tsnow), phase threshold for rain (Train), degree day factor for ice (DDFice), degree day factor for snow (DDFsnow) were also calculated and shown.
Publisher’s Note: MDPI stays neutral with regard to jurisdictional claims in published maps and institutional affiliations. |
© 2022 by the authors. Licensee MDPI, Basel, Switzerland. This article is an open access article distributed under the terms and conditions of the Creative Commons Attribution (CC BY) license (https://creativecommons.org/licenses/by/4.0/).
Share and Cite
MDPI and ACS Style
Yao, R.; Shi, J. Glacier Mass Loss Simulation Based on Remote Sensing Data: A Case Study of the Yala Glacier and the Qiyi Glacier in the Third Pole. Remote Sens. 2022, 14, 5190. https://doi.org/10.3390/rs14205190
AMA Style
Yao R, Shi J. Glacier Mass Loss Simulation Based on Remote Sensing Data: A Case Study of the Yala Glacier and the Qiyi Glacier in the Third Pole. Remote Sensing. 2022; 14(20):5190. https://doi.org/10.3390/rs14205190
Chicago/Turabian StyleYao, Ruzhen, and Jiancheng Shi. 2022. "Glacier Mass Loss Simulation Based on Remote Sensing Data: A Case Study of the Yala Glacier and the Qiyi Glacier in the Third Pole" Remote Sensing 14, no. 20: 5190. https://doi.org/10.3390/rs14205190
Note that from the first issue of 2016, this journal uses article numbers instead of page numbers. See further details here.