Article

Susceptibility Assessment of Flash Floods: A Bibliometrics Analysis and Review

1
State Key Laboratory of Hydraulics and Mountain River Engineering, Sichuan University, Chengdu 610065, China
2
College of Hydraulic and Hydroelectric Engineering, Sichuan University, Chengdu 610065, China
3
National Meteorological Center of China Meteorological Administration, Beijing 100081, China
4
Institute of Mountain Hazards and Environment, Chinese Academy of Sciences, Chengdu 610041, China
5
School of Earth Science, Chengdu University of Technology, Chengdu 610059, China
6
Aerospace Information Research Institute, Chinese Academy of Sciences, Beijing 100094, China
7
Faculty of Geosciences and Environmental Engineering, Southwest Jiaotong University, Chengdu 611756, China
8
Key Laboratory of Mountain Hazards and Surface Processes, Institute of Mountain Hazards and Environment, Chinese Academy of Sciences, Chengdu 610041, China
9
Sichuan Earthquake Administration, Chengdu 610041, China
*
Author to whom correspondence should be addressed.
Remote Sens. 2022, 14(21), 5432; https://doi.org/10.3390/rs14215432
Submission received: 27 August 2022 / Revised: 16 October 2022 / Accepted: 25 October 2022 / Published: 28 October 2022

Abstract

:
A flash flood disaster is one of the most destructive natural disasters. With the increase in extreme rainfall events, more and more areas will be threatened by flash floods. The flash flood susceptibility assessment is the basis of flash flood risk assessment and is also an important step in flash flood disaster management. Based on Citespace analysis tools, this study made a bibliometric and visualized analysis of 305 documents collected in the core collection of Web of Science in the past 15 years, including the analysis of the number of publications and citation frequency, influence analysis, keyword analysis, author co-citation analysis, and institutional co-operation analysis. This paper summarizes the current research status and future development trend of flash flood susceptibility assessment from five key research subfields, including assessment scale, assessment unit, assessment index, assessment model, and model assessment method, discusses the analysis of the application of remote sensing and GIS in flash flood susceptibility assessment, discusses the problems encountered in the current research of the five subfields, and provides suggestions for flash flood hazard control.

1. Introduction

Flash floods refer to the floods that hit low-lying areas [1], which are often affected by extreme rainfall [2,3], and are characterized by suddenness, large water volume, fast flow rate [4,5], and strong destructive power [6,7,8]. Flash flood disasters refer to the flash flood events that cause economic loss or loss of life and property due to the outbreak of flash floods [9], including landslides, debris flows, and dam breaks [4]. They can cause massive property damage [10,11,12,13], affect economic development [2,14,15], and pose a big threat to people’s lives [16,17,18,19] because of their complex characteristics. Flash flood disasters threatened many areas such as the United States [20], Iran [21], India [22], Saudi Arabia [23], Italy [24], and Bangladesh [25]. Affected by extreme climate, the flood frequency will increase significantly in the future [26]. Among various flood disasters, the number of deaths caused by flash floods was the highest [27,28]. From 2010 to 2016, more than 10,000 flash flood events occurred in China, accounting for 70% of the total number of casualties of flood events [29]. In particular, the number of dead or missing in 2010 reached 3887 and accounted for 92% of the total number of casualties of flood events [30]. The great destructiveness of flash flood disasters has made the research of flash floods receive more attention and win a place in the study of natural disasters [31].
Susceptibility evaluation is used to estimate the areas where dangerous events may occur [32]. The flash flood susceptibility assessment is to assess the scale, outbreak characteristics and spatial distribution of flash floods that have occurred or may occur in a particular area based on the geographic information system (GIS) and remote sensing technology (RS), which is the basis for hazard and risk analysis of flash floods. Flash flood events are usually more likely to occur in areas with high susceptibility. Flash flood susceptibility zoning includes the catalog of flash floods that have occurred in the area and the estimation of possible flash floods in the future. RS and GIS are widely used in natural disasters, and they are also the basis of flash flood susceptibility assessment. With the help of remote sensing and GIS, flash flood susceptibility assessment can predict the possibility of the occurrence of future flash floods in the area. The increased number of future flash floods and conducting flash flood susceptibility assessment will reduce economic losses from flash floods and even prevent human casualties from flash floods. Flash flood susceptibility assessment is a key step in managing flash flood disasters [33], and also helps to prevent flash flood disasters [34,35] and manage flash flood risks [36]. In addition, the concept of flash flood guidance (FFG) mentioned in some studies needs to be distinguished [37,38]. FFG is an estimate of the amount of rainfall required to cause stream flooding in a given area and the time for a flash flood warning [39]. FFG differs from flash flood susceptibility assessment in two aspects: (1) Spatial scale. FFG is generally estimated based on streams and rivers. Compared with FFG, the scale of flash flood susceptibility assessment is wider, including river basins, urban counties, etc. (2) Time scale. FFG considers rainfall and soil moisture in streams and requires real-time monitoring of changes in factors, so it is a dynamic assessment. The assessment of flash flood susceptibility is a static assessment, which is usually carried out at the end of a flood season or after the occurrence of the flash flood. Thus, they are not the same. It is of great research value to summarize the research status of flash flood susceptibility assessment.
The uncertainty of flash floods makes it challenging to carry out susceptibility assessments. Currently, the research on the flash flood susceptibility assessment is still in the exploratory stage, a mature assessment process has not been formed, and few scholars have summarized and analyzed it. In the research field, only seven review articles were published in the past 15 years, and few studies systematically summarized the flash flood susceptibility assessment. Therefore, it is essential to determine the assessment framework of flash flood susceptibility, and the statistical analysis of articles in this field has constructive significance for future studies. Table 1 listed some reviews and analyzed their review methods. It could be found that the review often adopted a research development method based on time sequence, a method based on analyzing cases to summarize the research focus, a PRIAMA approach, and a method based on a thematic logical structure. Bibliometric analysis and knowledge mapping were used in this review, which is the novelty of this review. There are three advantages of using bibliometric analysis and scientific knowledge mapping. (1) Provide a clear search process and an intuitive scientific knowledge map. (2) Enable the development of research fields to be analyzed and referenced from multiple perspectives, such as a temporal ruler, institutional perspective, journal perspective, country perspective, author perspective, etc. (3) Acquire the key points of the research content through visual mapping. On this basis, this study made a visualized analysis of documents on the flash flood susceptibility assessment in the core collection of Web of Science by using Citespace (version 6.1), analyzed the research status of five important subfields (including the assessment scale [1,33,40,41], assessment unit [36,42,43], assessment index [34,44,45], assessment model [46,47,48,49], and accuracy assessment method [50,51,52] of flash flood susceptibility), sorted out and summarized the research hotspots and trends of flash flood susceptibility assessment, analyzed the application of remote sensing in flash flood susceptibility assessment, and discussed the limitations of existing studies and put forward suggestions for future studies.

2. Materials and Methods

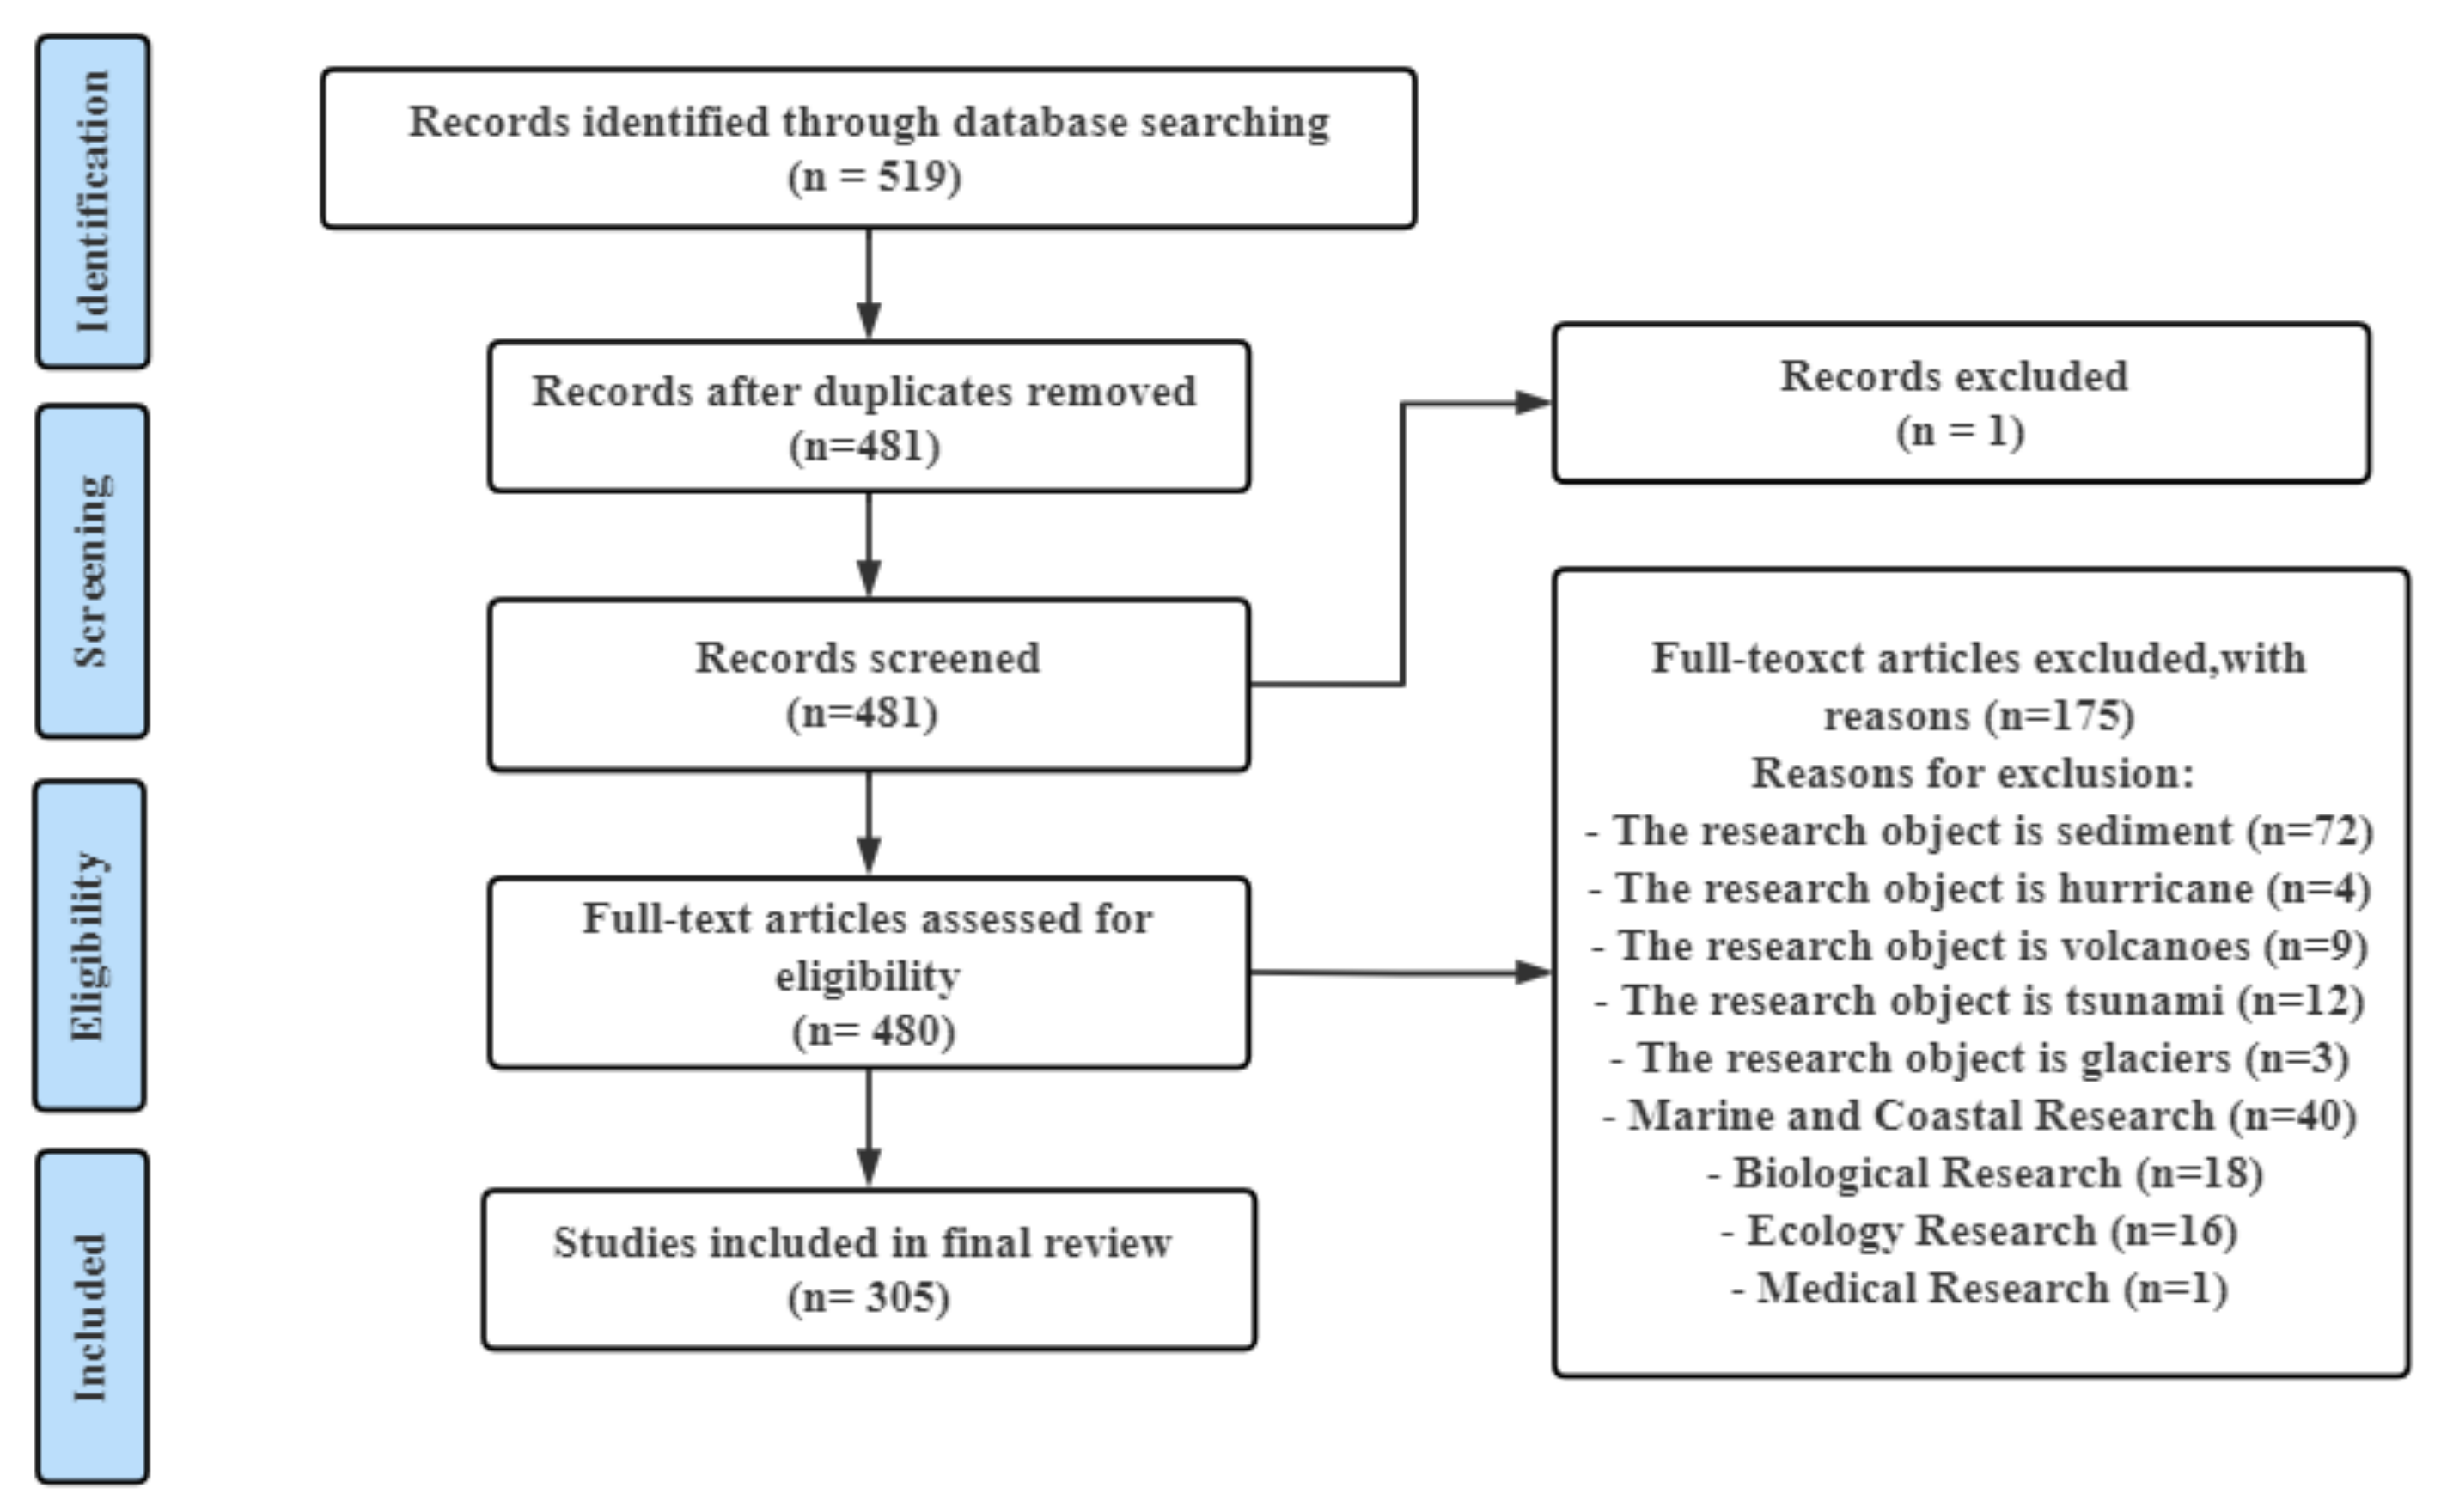
2.1. Research Methods

As a method for quantitative analysis of the authors, fields, institutions, and research topics of documents [60], the bibliometric method combines statistics, bibliography, mathematics, and other methods. It can obtain the developmental direction of a discipline through meta-analysis of a field [61]. Since being proposed by Pritchard [62] in 1969, it has been widely used for the analysis of documents in various fields, such as computer science [63], management [64], chemistry [65], education [66], etc. The bibliometric analysis includes performance analysis and scientific research mapping [67]. Performance analysis makes statistics on the publication of authors, countries, publications, and journals, and funding institutions and evaluates the publication performance [68] by citation analysis and other means. In this study, the influence of authors, countries, publications and journals, and funding institutions was analyzed through the citation count provided by WOS.
It is now a popular method to analyze the development process and future trends in the document research field based on scientific knowledge mapping. CiteSpace, VOSviewer, CitNetExplorer, etc., are popular software used to execute bibliometric analysis procedures. Che et al. [69] compared nine kinds of software, such as CiteSpace, VOSviewer, and CitNetExplorer. They proved that CiteSpace is the software that can maximize the utilization of document information and have the highest comprehensiveness. As a kind of software that carries out document detection based on Java programs and makes a visualized analysis of emerging trends in the research field in the time dimension [70], Citespace can provide various types of bibliometric analysis [71], such as co-word analysis, co-citation analysis, and co-operative network analysis, analyze the title, abstract and keywords from the perspective of the keywords, authors, institutions, and countries, as well as provide analysis functions including double graph superposition and timeline. Therefore, in this study, Citespace was used to process the data of flash flood susceptibility assessment, and the analysis of keyword co-occurrence, keyword burst, author co-citation, and institutional co-operation was successively made to study the future development direction of flash flood susceptibility assessment.

2.2. Data Sources

The document data of this paper comes from the core collection database of the Web of Science (WOS). Web of Science, as one of the most famous database sites, can provide high quality research data and ensure the reliability of research data [72]. In addition, WOS is recommended as the database of choice for Citespace analysis. In this study, the “AND” operator was used to perform Boolean operations on two search expressions by advanced search. The first search expression is as follows: TS = “flash flood *”, where “*” is a wildcard, including “flash flood”, “flash floods”, “flash flooding”, etc. The second search expression is TS = “fluvial flooding”. The third search expression is TS = “inundation”. The fourth search expression is TS = “susceptibility”. A total of 519 journal papers were searched after the deadline for the search was set as 8 July 2022, and the time interval was set from 2000 to 2022, including conference papers, conference reviews, and letters. Then, after the search results were refined, an editorial article (a study on glacioclimatology and magnetic mineralogy [73]), 175 irrelevant articles, and 38 duplicates were excluded to finally obtain 305 valid records (as the source of analysis data). The specific search process is shown in Figure 1. The article citation frequency for this study was based on the WOS Core Collection database. Five representative papers were mined in the search process, as shown in Table 2. These five articles focus on five subfields of research: assessment scale, assessment unit, assessment index, assessment model, and accuracy assessment in flash flood susceptibility assessment.

3. Results

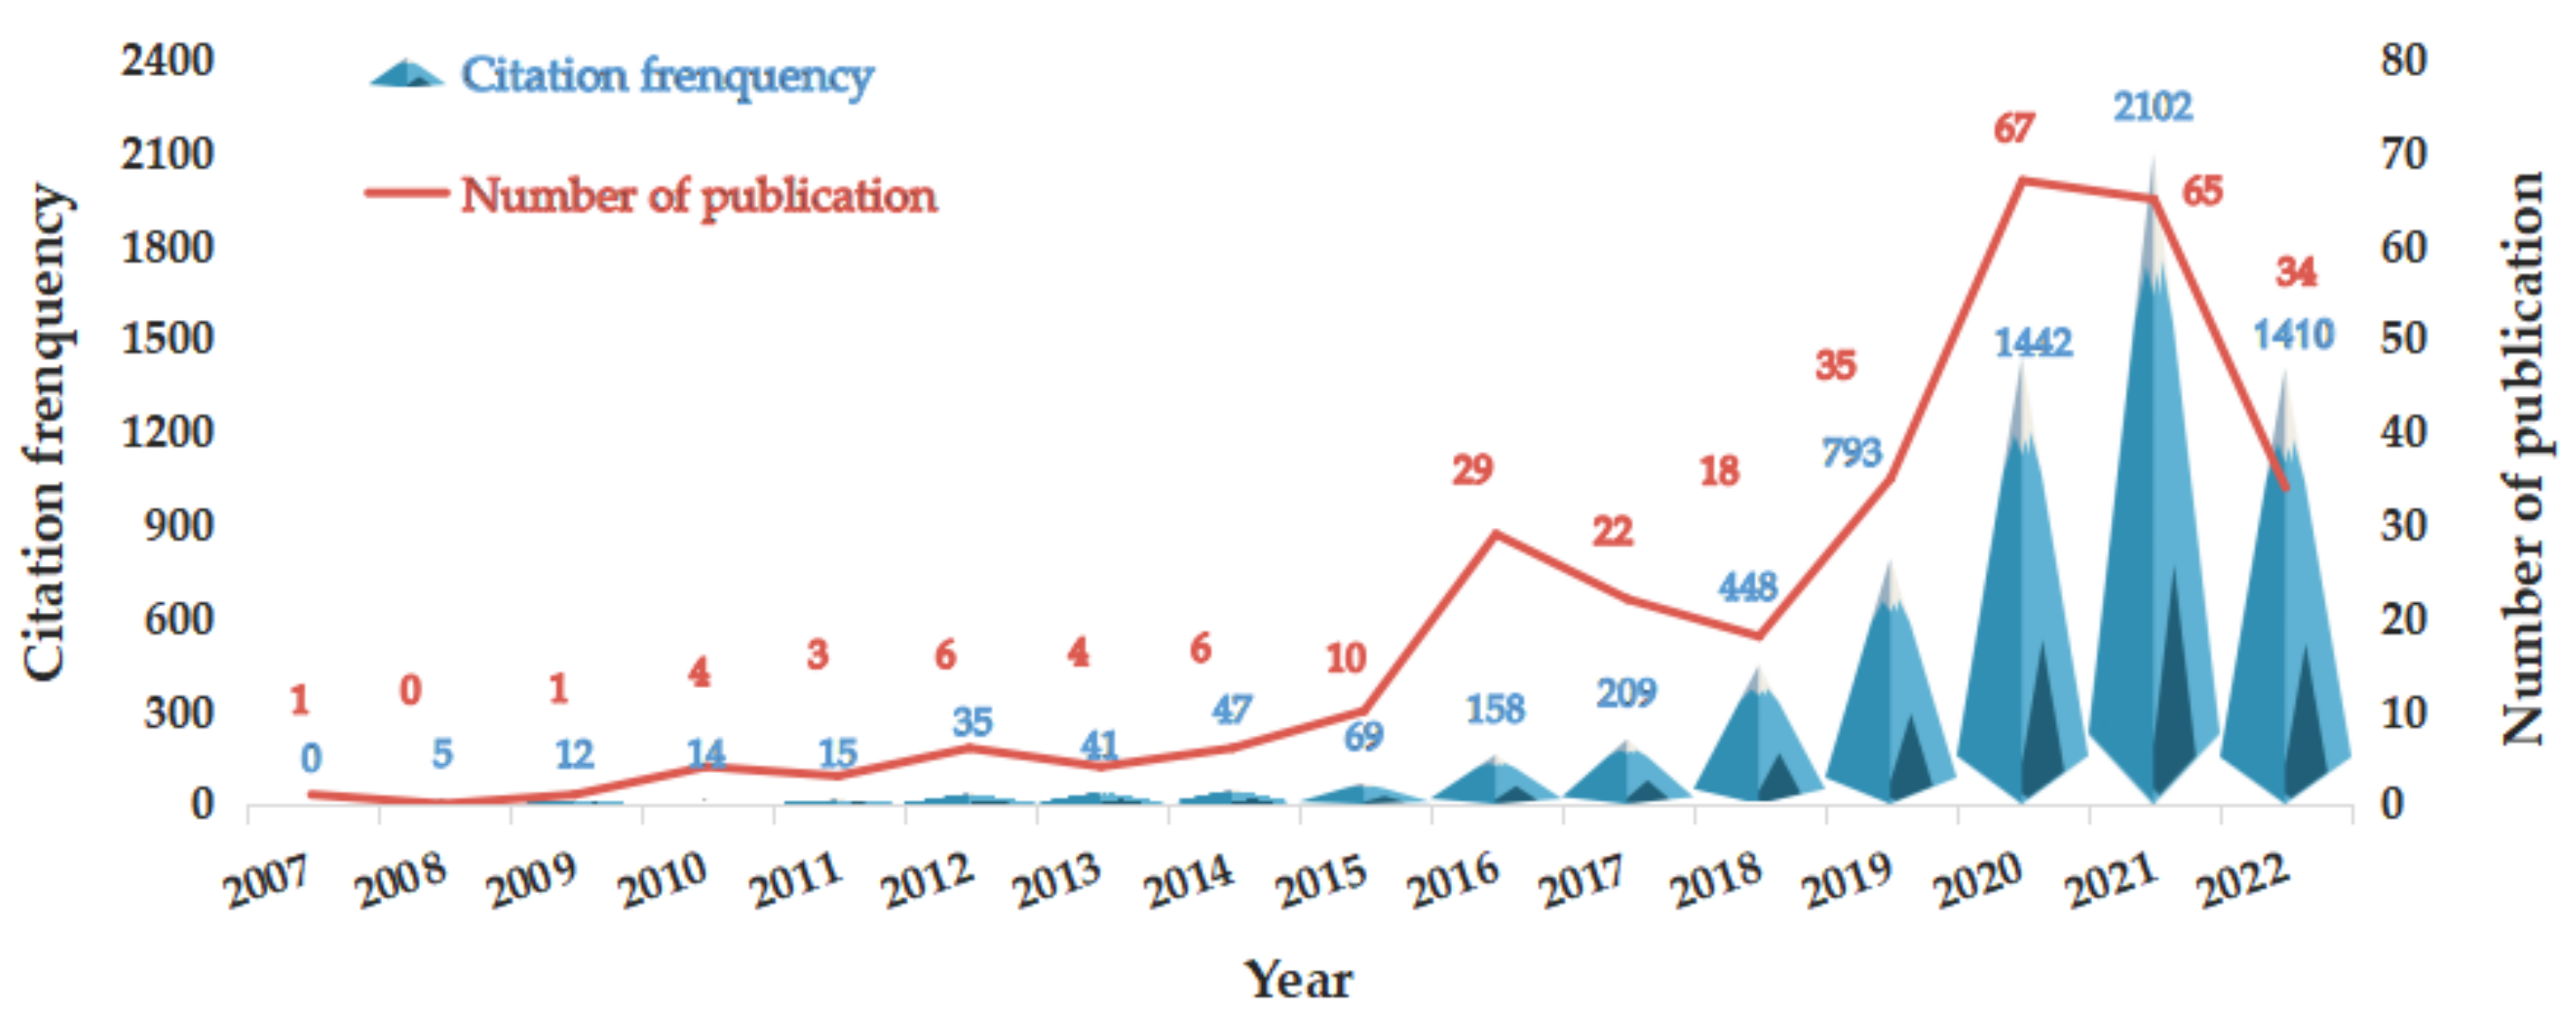
3.1. Analysis of the Number of Publications and Citation Frequency

Through the analysis of the document data in the core collection of WOS, the time distribution diagram of the number of publications and citation frequency of flash flood susceptibility was obtained, as shown in Figure 2. The number of publications and citation frequency showed an upward trend from 2007 to 2021. The field of flash flood susceptibility assessment was divided into three stages.
(1)
The first stage: The period from 2007 to 2015 is the embryonic stage of flash flood susceptibility assessment, in which the number of articles published in the research field every year was less than 10 per year, the number of citations per article per year was not much, and an obvious structural interruption could be seen in 2008 and 2011.
(2)
The second stage: The period from 2016 to 2019 is the exploration stage of the development of this field, in which 26 articles were published per year. Although only 18 articles were published in 2018, the number of citations (448) was about twice that of 2017 (the number of articles published was 22), indicating that the field of flash flood susceptibility assessment received significant attention in 2018. This result was consistent with that of Franceschinis [77]. In addition, Franceschinis et al. [77] conducted a questionnaire on risk awareness of residents in 2005 and 2018. In 2005, residents did not have knowledge and experience of floods and believed that the possibility of occurrence of floods in the future was extremely low. Still, in 2018, the number of residents decreased significantly, and frequent floods increased people’s attention and research efforts.
(3)
The third stage: Since 2020, the number of articles published and the number of citations per article per year have increased significantly. The number of articles published in 2020 reached 67, and the number of citations topped 1442, reaching a new height. This stage is a stage of vigorous development in this field. The research work from 2007 to 2015 accounted for 11.5% of all research work. The relative share rose to 34.10% from 2016 to 2019 and reached 54.4% after 2020, indicating that flash flood susceptibility assessment will be the research hotspot in the following years.
Figure 2. Time distribution of number of publication and citation frequency from 2007 to 2022.
Remotesensing 14 05432 g002
Five articles with the highest citation frequency were selected from 305 articles, as shown in Table 3. The highly cited articles can reflect the research hotspots in the research field and are generally forward-looking, and the research results are often helpful for future research. Khosravi et al. [78] conducted research on the assessment of flash flood susceptibility by four hybrid machine learning models (the research article was cited 300 times, and its citation frequency ranked first), showing that the advanced decision tree model has a good application prospect in the assessment of flash flood susceptibility. De Moel et al. [79] showed that inundation depth, land use, the value of risk elements, and sensitive hydrological conditions could reduce the uncertainty in flood damage estimates. Hong et al. [80] suggested that the result of flood susceptibility assessment should be compared with the result of flood simulation model in the future to estimate the speed, depth and duration of flood. Rahmati et al. [81] suggested that GIS and the analytic hierarchy process (AHP) could be used to assess potential flooding in areas without data. Collier et al. [82] made it clear that constrained flash flood forecasting is a method to improve the forecast accuracy; accurate flash flood forecasting is conducive to the timely prevention and control of regional disasters and the forecasting of flash flood intensity in flash flood-prone areas and is conducive to the further study of flash flood susceptibility. This article, published in 2007, is the first article in this field. This article has not received much attention within eight years after its publication. However, as the research is incessantly deepened, as this article has been cited 172 times. It is one of five highly cited articles published in the past ten years and has landmark significance.
Three of the five highly cited articles used different models for the flash flood susceptibility assessment in a particular area [78,80,81], showing that methods of flash flood susceptibility assessment tend to be diversified [36,49,83].

3.2. Influence Analysis

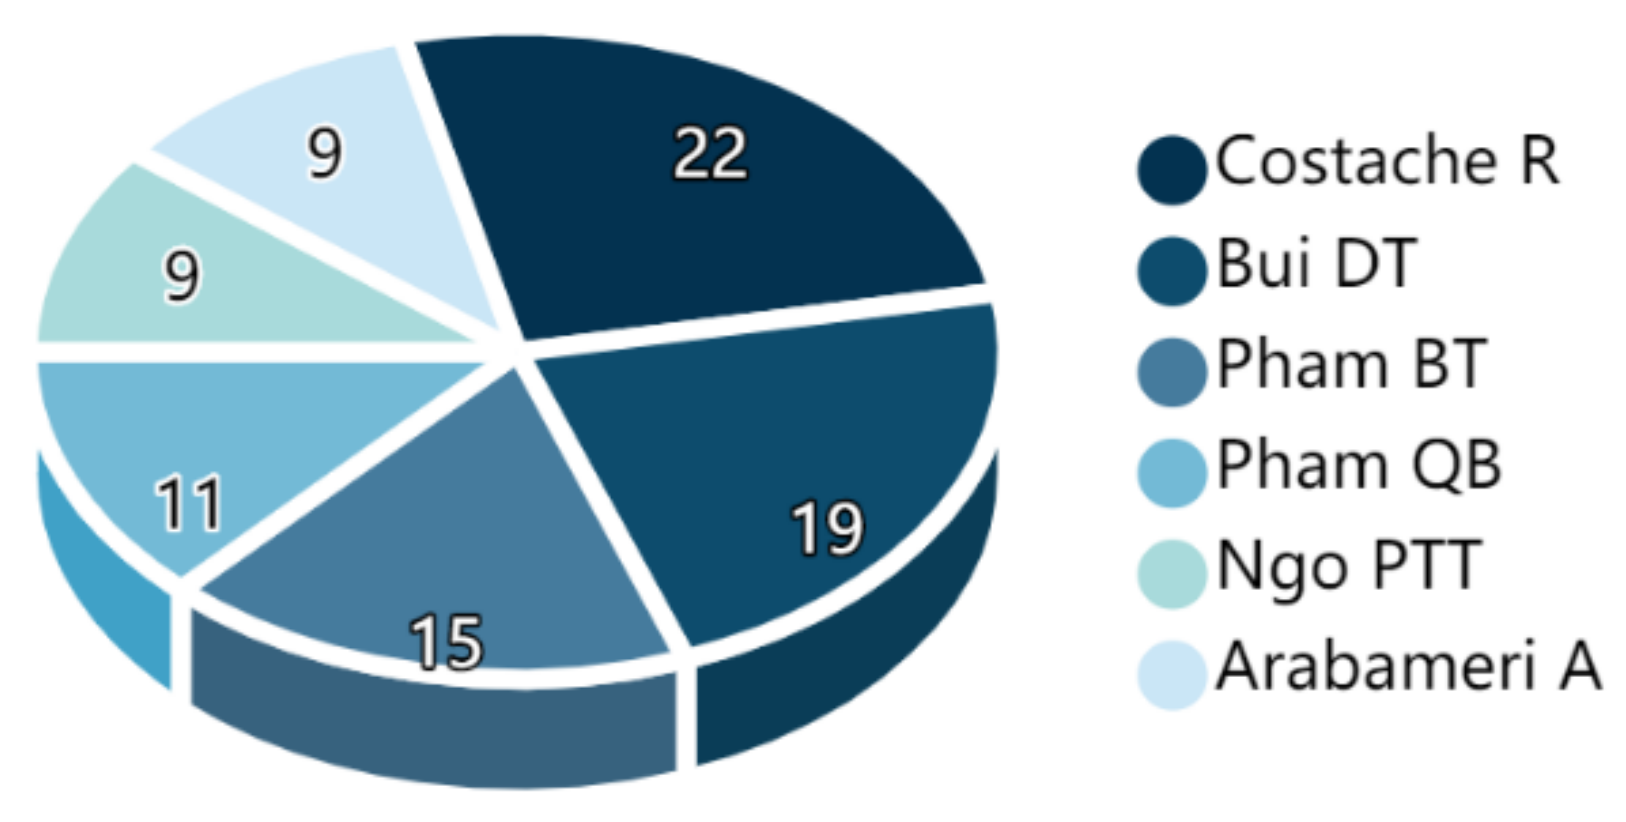
3.2.1. Analysis of Authors’ Productivity

The Price Law measures the distribution law of document authors in various disciplines, M = 0.749 (nmax)/2, where nmax represents the maximum number of papers published by authors in this field, and authors who have published more than M papers in this field are considered as core authors. Through the analysis of the core collection database of WOS, it was found that Costache is the author who has published the most significant number of papers (22 articles in total, nmax = 22). The M value is 8.24, so the author who has published more than eight articles is the core author, as shown in Figure 3.
As one of the most productive authors, Costache has published 22 articles, 16 of which were published by Costache as the first author. With strong research ability, this author has maintained high productivity since publishing articles in 2017. For example, this author published four articles in 2019 and 2021 and five articles in 2020, and had higher productivity than most of the authors. Costache mainly studied the situation of flash floods in Romania, and assessed the flash flood susceptibility by different models [48,84,85] (or determined the flash flood potential index (FFPI) [31,86,87]). Arabameri participated in all of Costache’ studies [48,84,85]. Pham Q.B. participated in some of Costache’ research [48,74,88]. As the second most productive scholar, Bui published 19 articles during the search process, mainly studying the flash flood susceptibility in Vietnam. Bui proposed many new models for assessing flash flood susceptibility, such as the integrated algorithm of FURIA-GA, LogitBoost, Bagging, and AdaBoost taking fuzzy rule as the basis and the GA as the search method [76], integrated model PSO-ELM of extreme learning machine (ELM) and particle swarm optimization (PSO) [89], and integrated model based on multivariate adaptive regression splines (MARS) and particle swarm optimization (PSO) [90]. As the third most productive scholar, Pham B.T. studied the accuracy difference in assessing flash flood susceptibility through different intelligent learning models [36,45]. Ngo studied the flash flood susceptibility in northwest Vietnam and put forward integrated intelligent learning assessment models: an integrated model of hybrid quantum particle swarm optimization (QPSO) and Credal decision tree (CDT), QPSO-CDTreeEns model [34], and integrated model FA-LM-ANN of firefly algorithm (FA) and back-propagation artificial neural network (FA-LM) [91].

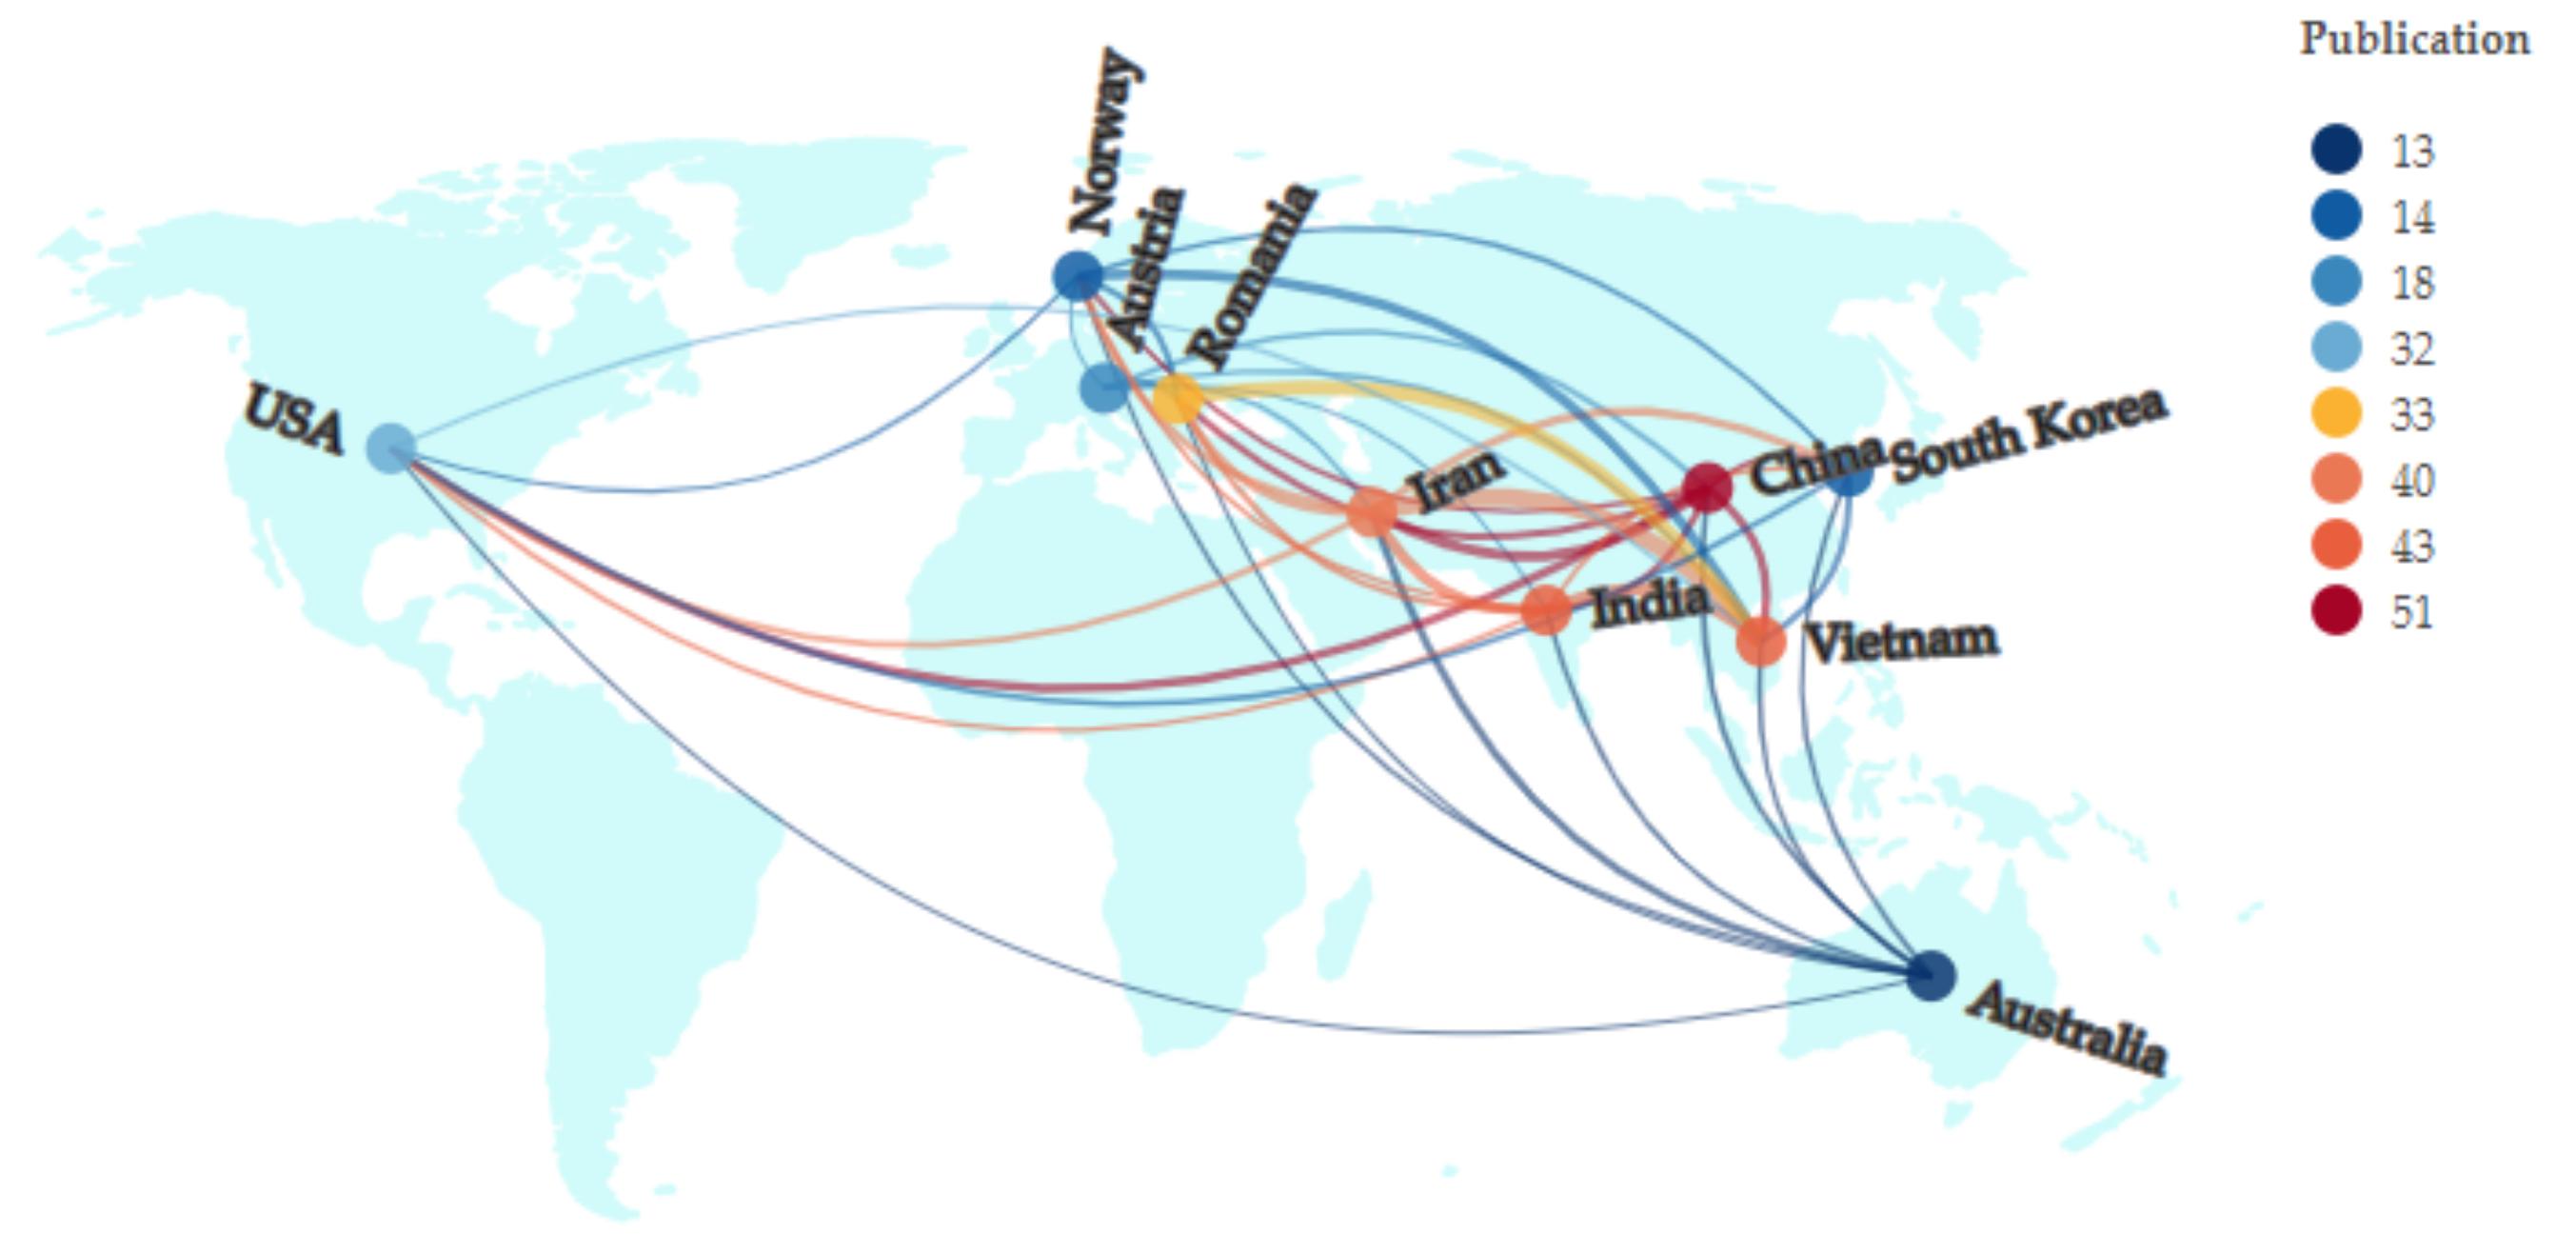
3.2.2. Analysis of the Influence of Countries/Regions

Based on the analysis of the core collection of WOS, the number of publications of countries/regions studied is shown in Figure 4. China (51) made the largest contribution to the flash flood susceptibility assessment, followed by Vietnam (43), India (43), Iran (40), Romania (33), the United States (32), Austria (18), Norway (14), Korea (14), and Australia (13). China is a country that has long been threatened with flash floods, and many scholars have researched flash flood disaster early warning [92,93,94], risk assessment [19,95], and so on. In 2018, a flash flood occurred in the north-western mountainous area of Vietnam, which is the area that has been studied most in Vietnam [90,96,97]. Among all the studies on flash flood susceptibility assessment in India, Uttarakhand is the area that has been studied most, which is also the area with the most significant number of deaths caused by flash floods in India [98]. This area has four pilgrimage towns and is the origin of two important rivers in India (Ganges and Yamuna). The flash floods happened to occur during the pilgrimage period [22]. Therefore, the frequent occurrence of flash floods has brought huge threats to life safety and caused economic losses in this area [99,100]. According to Figure 4, research in developing countries is significantly more than that in developed countries. Flash floods not only cause losses to developing countries but also to developed countries. However, the losses of developing countries are much greater than those of developed countries. This is because developing countries’ economies and science and technology are weaker than those of developed countries, and developing countries cannot predict disasters or reduce losses in time [101] due to the lack of an official flash flood early warning system [102]. Therefore, developing countries have suffered a deeper impact from flash floods and conducted more research on flash flood susceptibility assessment.

3.2.3. Influence of Publications and Journals

Figure 5 shows the journals with the number of papers published ranking in the top six. Many high-level research results on flash flood susceptibility assessment were concentrated in these journals. Natural Hazards, as a journal that pays most attention to the flash flood susceptibility assessment, has focused on the prediction and risk management of natural disasters such as landslides, floods, and earthquakes and has provided many high-level academic papers since its establishment in 1988. Geocarto International is a journal that serves many fields such as geographic information systems, remote sensing, geoscience, and environmental science. It pays attention to the new development, technology, and application of remote sensing and geographic information system. Journal of Hydrology and Science of the total environment are prominent journals. Science of the total environment involves environmental science. Based on IF data released by SCI, this journal publishes 9349 articles every year, and it is the journal with the most significant number of articles per year among the five journals and has great influence. Water covers all aspects of water research, including water science, hydrology, and water resources management. Remote Sensing is an international journal in the field of remote sensing. In about 11 years after its establishment, this journal published 5119 articles every year and attached importance to the quality and innovation of articles, which had a high influence in this field at that time. Among these five journals, Natural Hazards is an American journal, Journal of Hydrology and Science of the total environment are Dutch journals, Geocarto International, Water, and Remote Sensing are from the UK and Switzerland, respectively, all of which prove that developed countries with advanced science and economy have published a large number of publications with high quality [103].

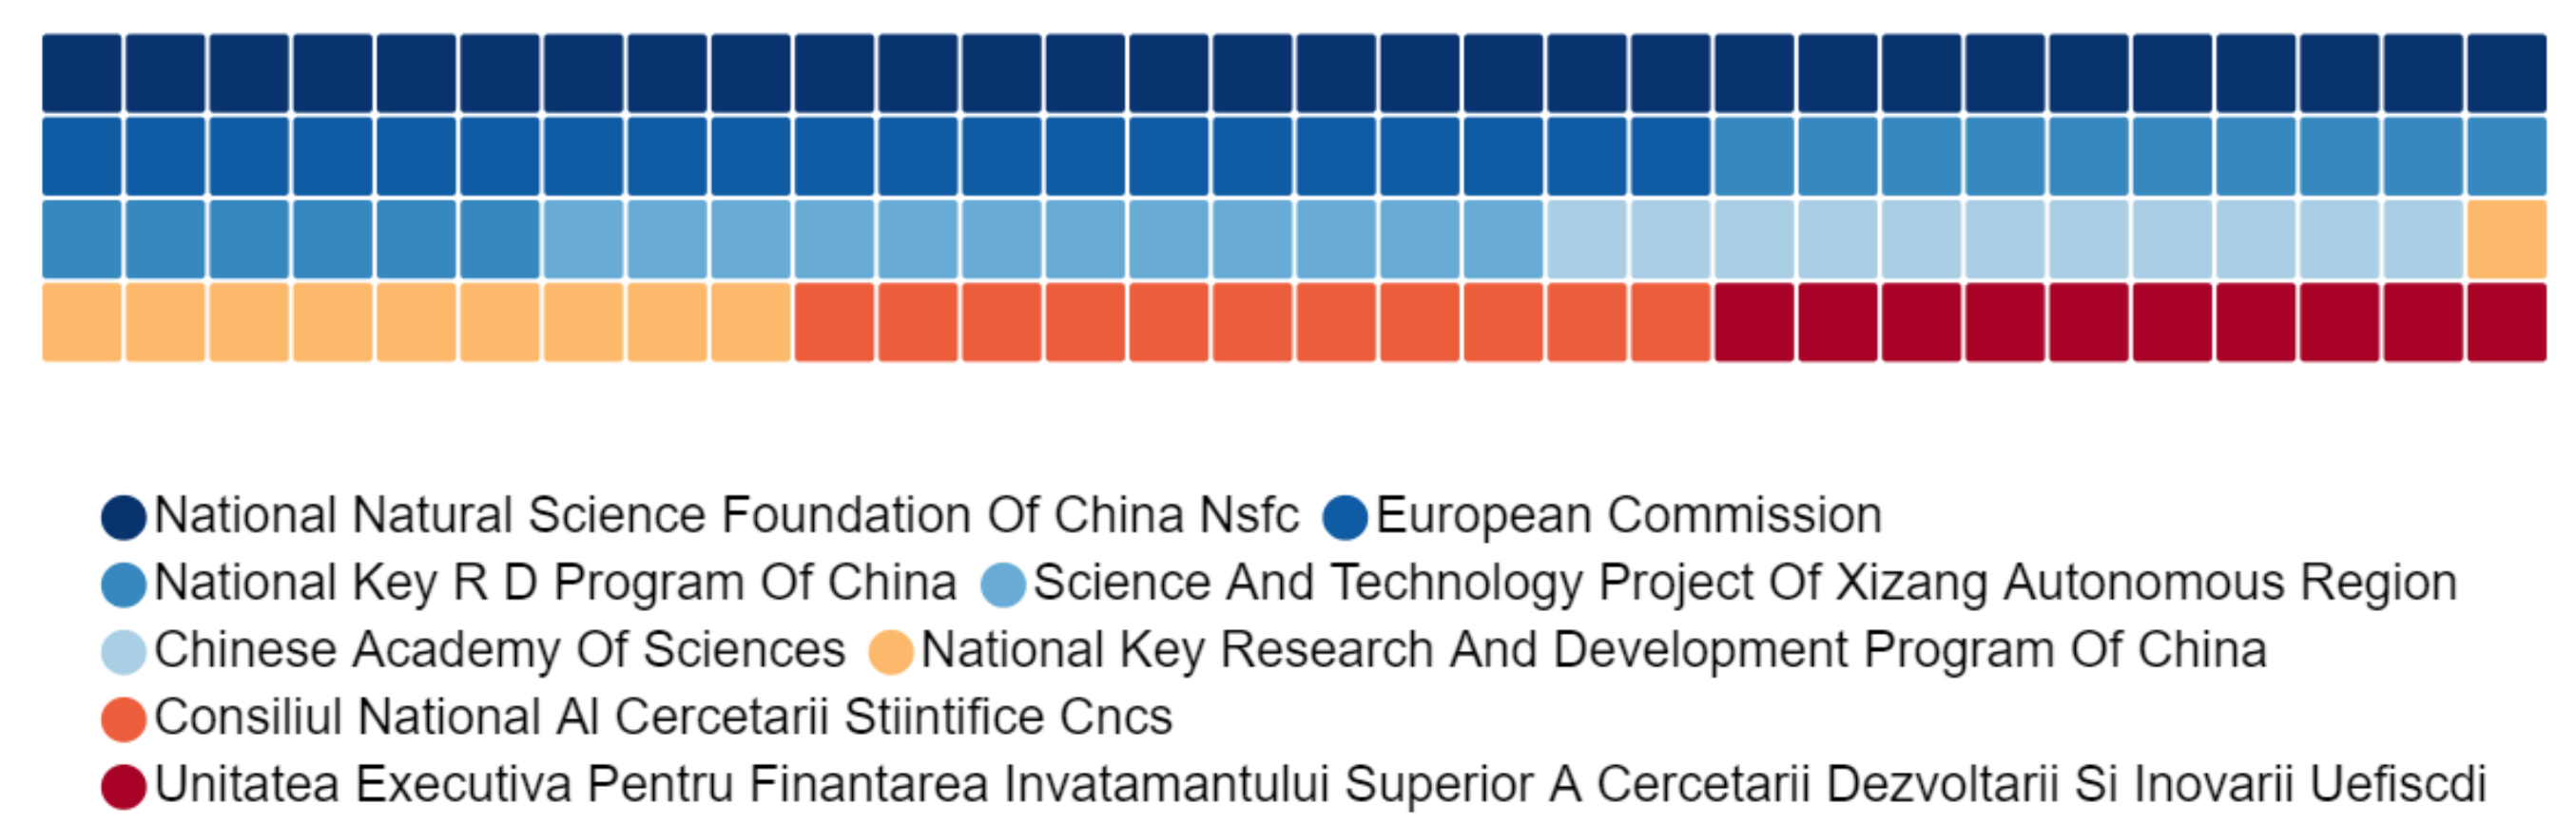
3.2.4. Analysis of the Influence of Funding Institutions

Institutions and organizations that pay attention to flash floods can be identified by analyzing the funding institutions. The institutions that have provided funds more than five times were obtained based on the analysis of core collection of WOS, as shown in Figure 6. National Natural Science Foundation of China, which has been recorded 17 times, is an institution that cares most about the flash flood susceptibility assessment and also a funding institution that supports the research of flash flood susceptibility assessment. The European Commission and Science and National Key R&D Program of China have been recorded 12 times and 9 times, respectively. Five of the eight funding institutions are from China, a country that is frequently threatened by flash floods and has an annual average number of deaths of 984 caused by flash floods [104]. Therefore, China has invested a significant amount money in the study of flash floods.

3.3. Keyword Analysis

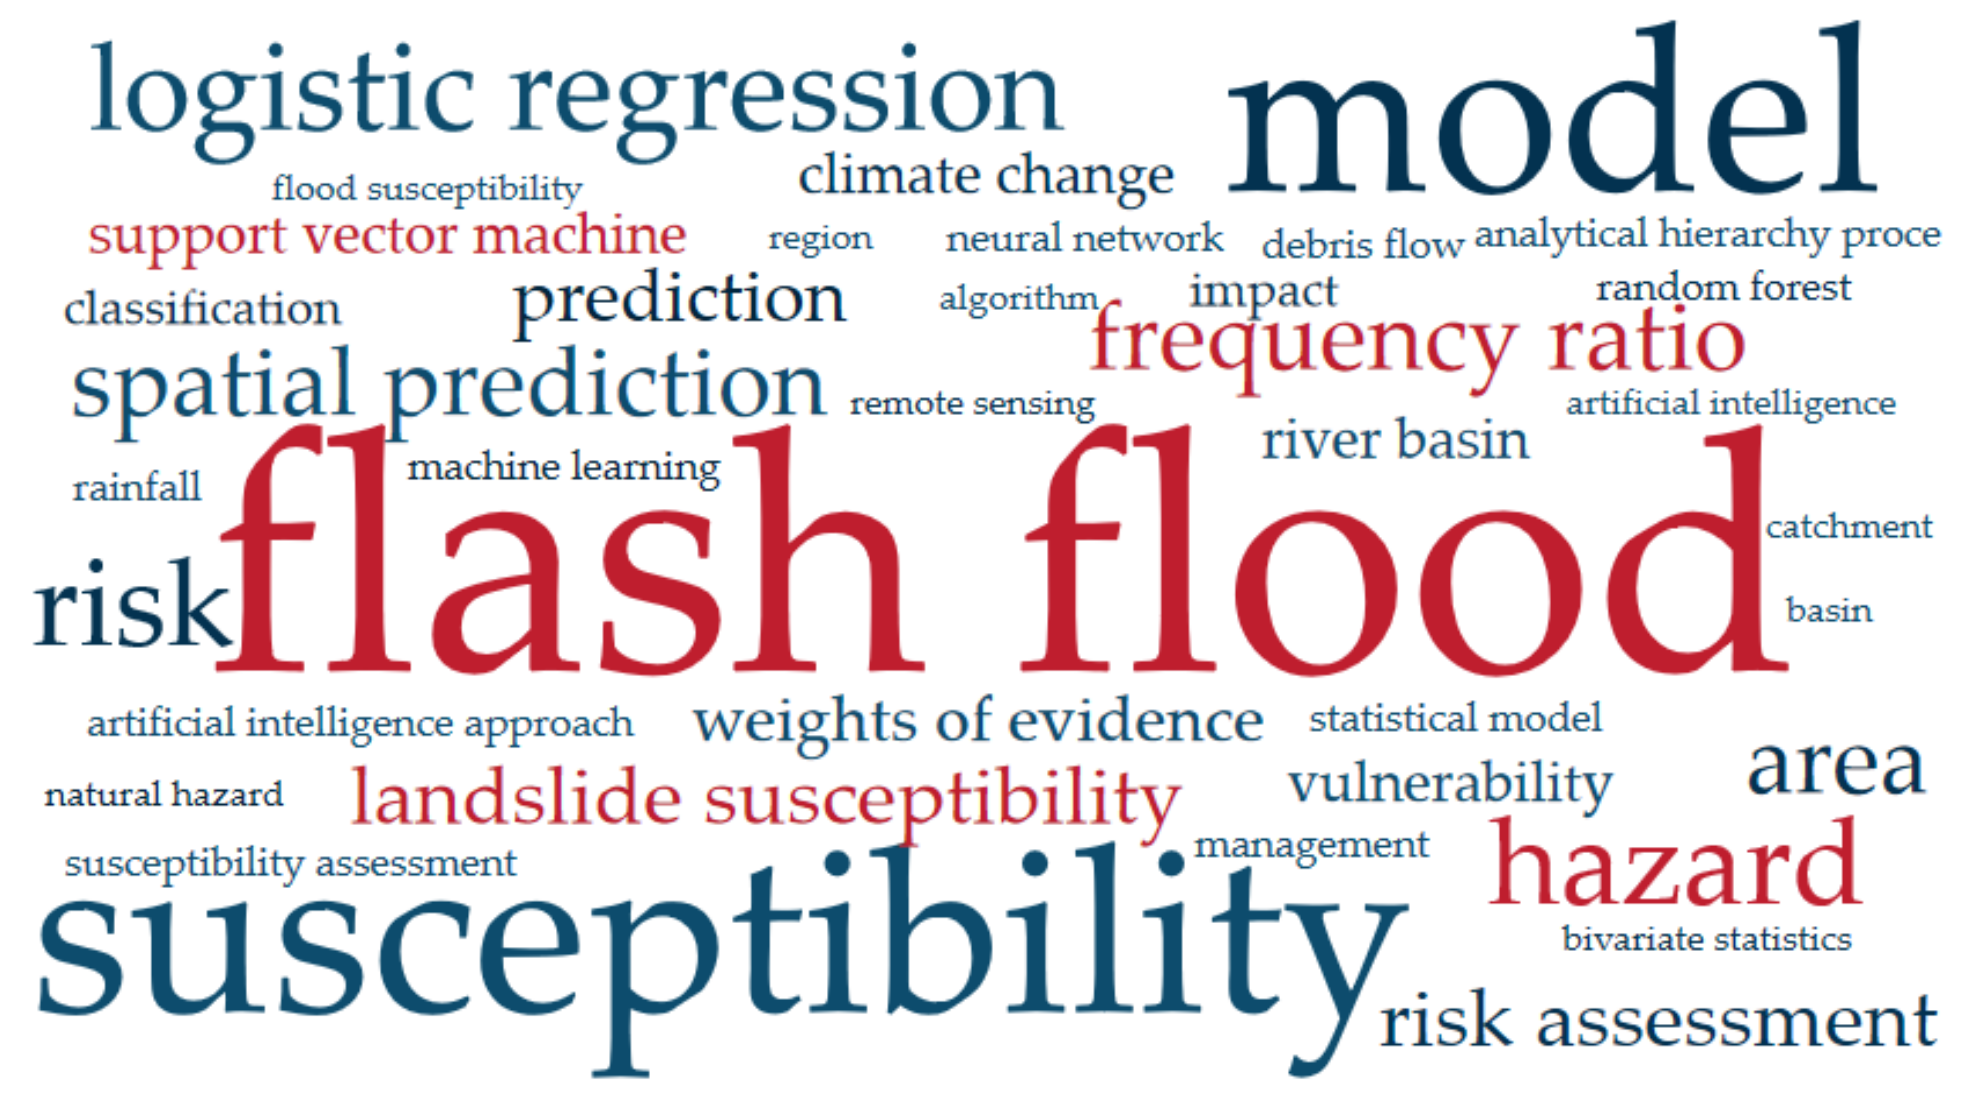
3.3.1. Keyword Co-Occurrence Analysis

The keyword is a condensed version of the abstract of a paper. The frequency of keywords can determine the focus of the research field. The higher the frequency of keywords is, the more attention will be paid to the research field. Citespace software was used to de-duplicate and analyze the articles in core collection of WOS, the time slice was set to 1 year, keyword nodes were used, and “Minimum Spanning Tree + Pruning the merged network” was used for network tailoring. Words that can be generally used and are irrelevant, such as “event” were deleted, and keywords that appear more than 10 times were retained to generate a keyword cloud image, as shown in Figure 7. In Figure 7, the larger the font size of the letter is, the higher the frequency of the letter is. The letter with the largest font size in the figure is “flash flood”, followed by “model” and “susceptibility”. The top 20 keywords with the highest frequency are shown in Table 4. Among these high-frequency keywords, keywords such as “hazard”, “spatial prediction”, “landslide susceptibility”, “area”, “risk”, “risk assessment”, “prediction”, “vulnerability”, “river basin”, “climate change”, “susceptibility assessment”, “classification”, and “debris flow” are subject words corresponding to the flash flood susceptibility assessment. Floods often occur in flat and low-altitude areas [105,106]. The catchment areas of the river were the main disaster-affected areas during the flash floods and the main research areas. Due to the complexity of flash floods and the dynamic environment of the river basin, the river basin was often seriously damaged [45], and more and more scholars carried out flash flood susceptibility assessments in catchment areas of the river [47,100]. As the keywords related to the flash flood susceptibility assessment, “logistic regression”, “frequency ratio”, “weights of evidence”, and “support vector machine” were also the most frequently used models in the mountain flood susceptibility assessment. Logistic regression (LR) is a machine learning method for solving binary classification. As the contribution rate of each parameter can be quantified by using logistic regression as an assessment model for flash flood susceptibility assessment [107], many scholars adopted hybrid models formed by logistic regression and other methods for research [108,109,110]. Frequency ratio (FR), a statistical method of quantitative probability analysis, has the advantages of convenient data processing and an easily understood calculation process [111], and is often used in geological hazard analysis [112,113]. LR and FR were applied to the flash flood susceptibility assessment earlier than other models. Youssef et al. [23] used FR and the integrated model of LR and FR to assess the flood susceptibility of Saudi Arabia, in 2016, which was also the first time the integrated model of FR and LR was applied to the research in this field. In addition, the weight of evidence and the support vector machine (SVM) is GIS-based machine learning models, which have been applied since 2016, indicating that the model of flash flood susceptibility assessment has gradually changed from the statistical model to the machine learning model.

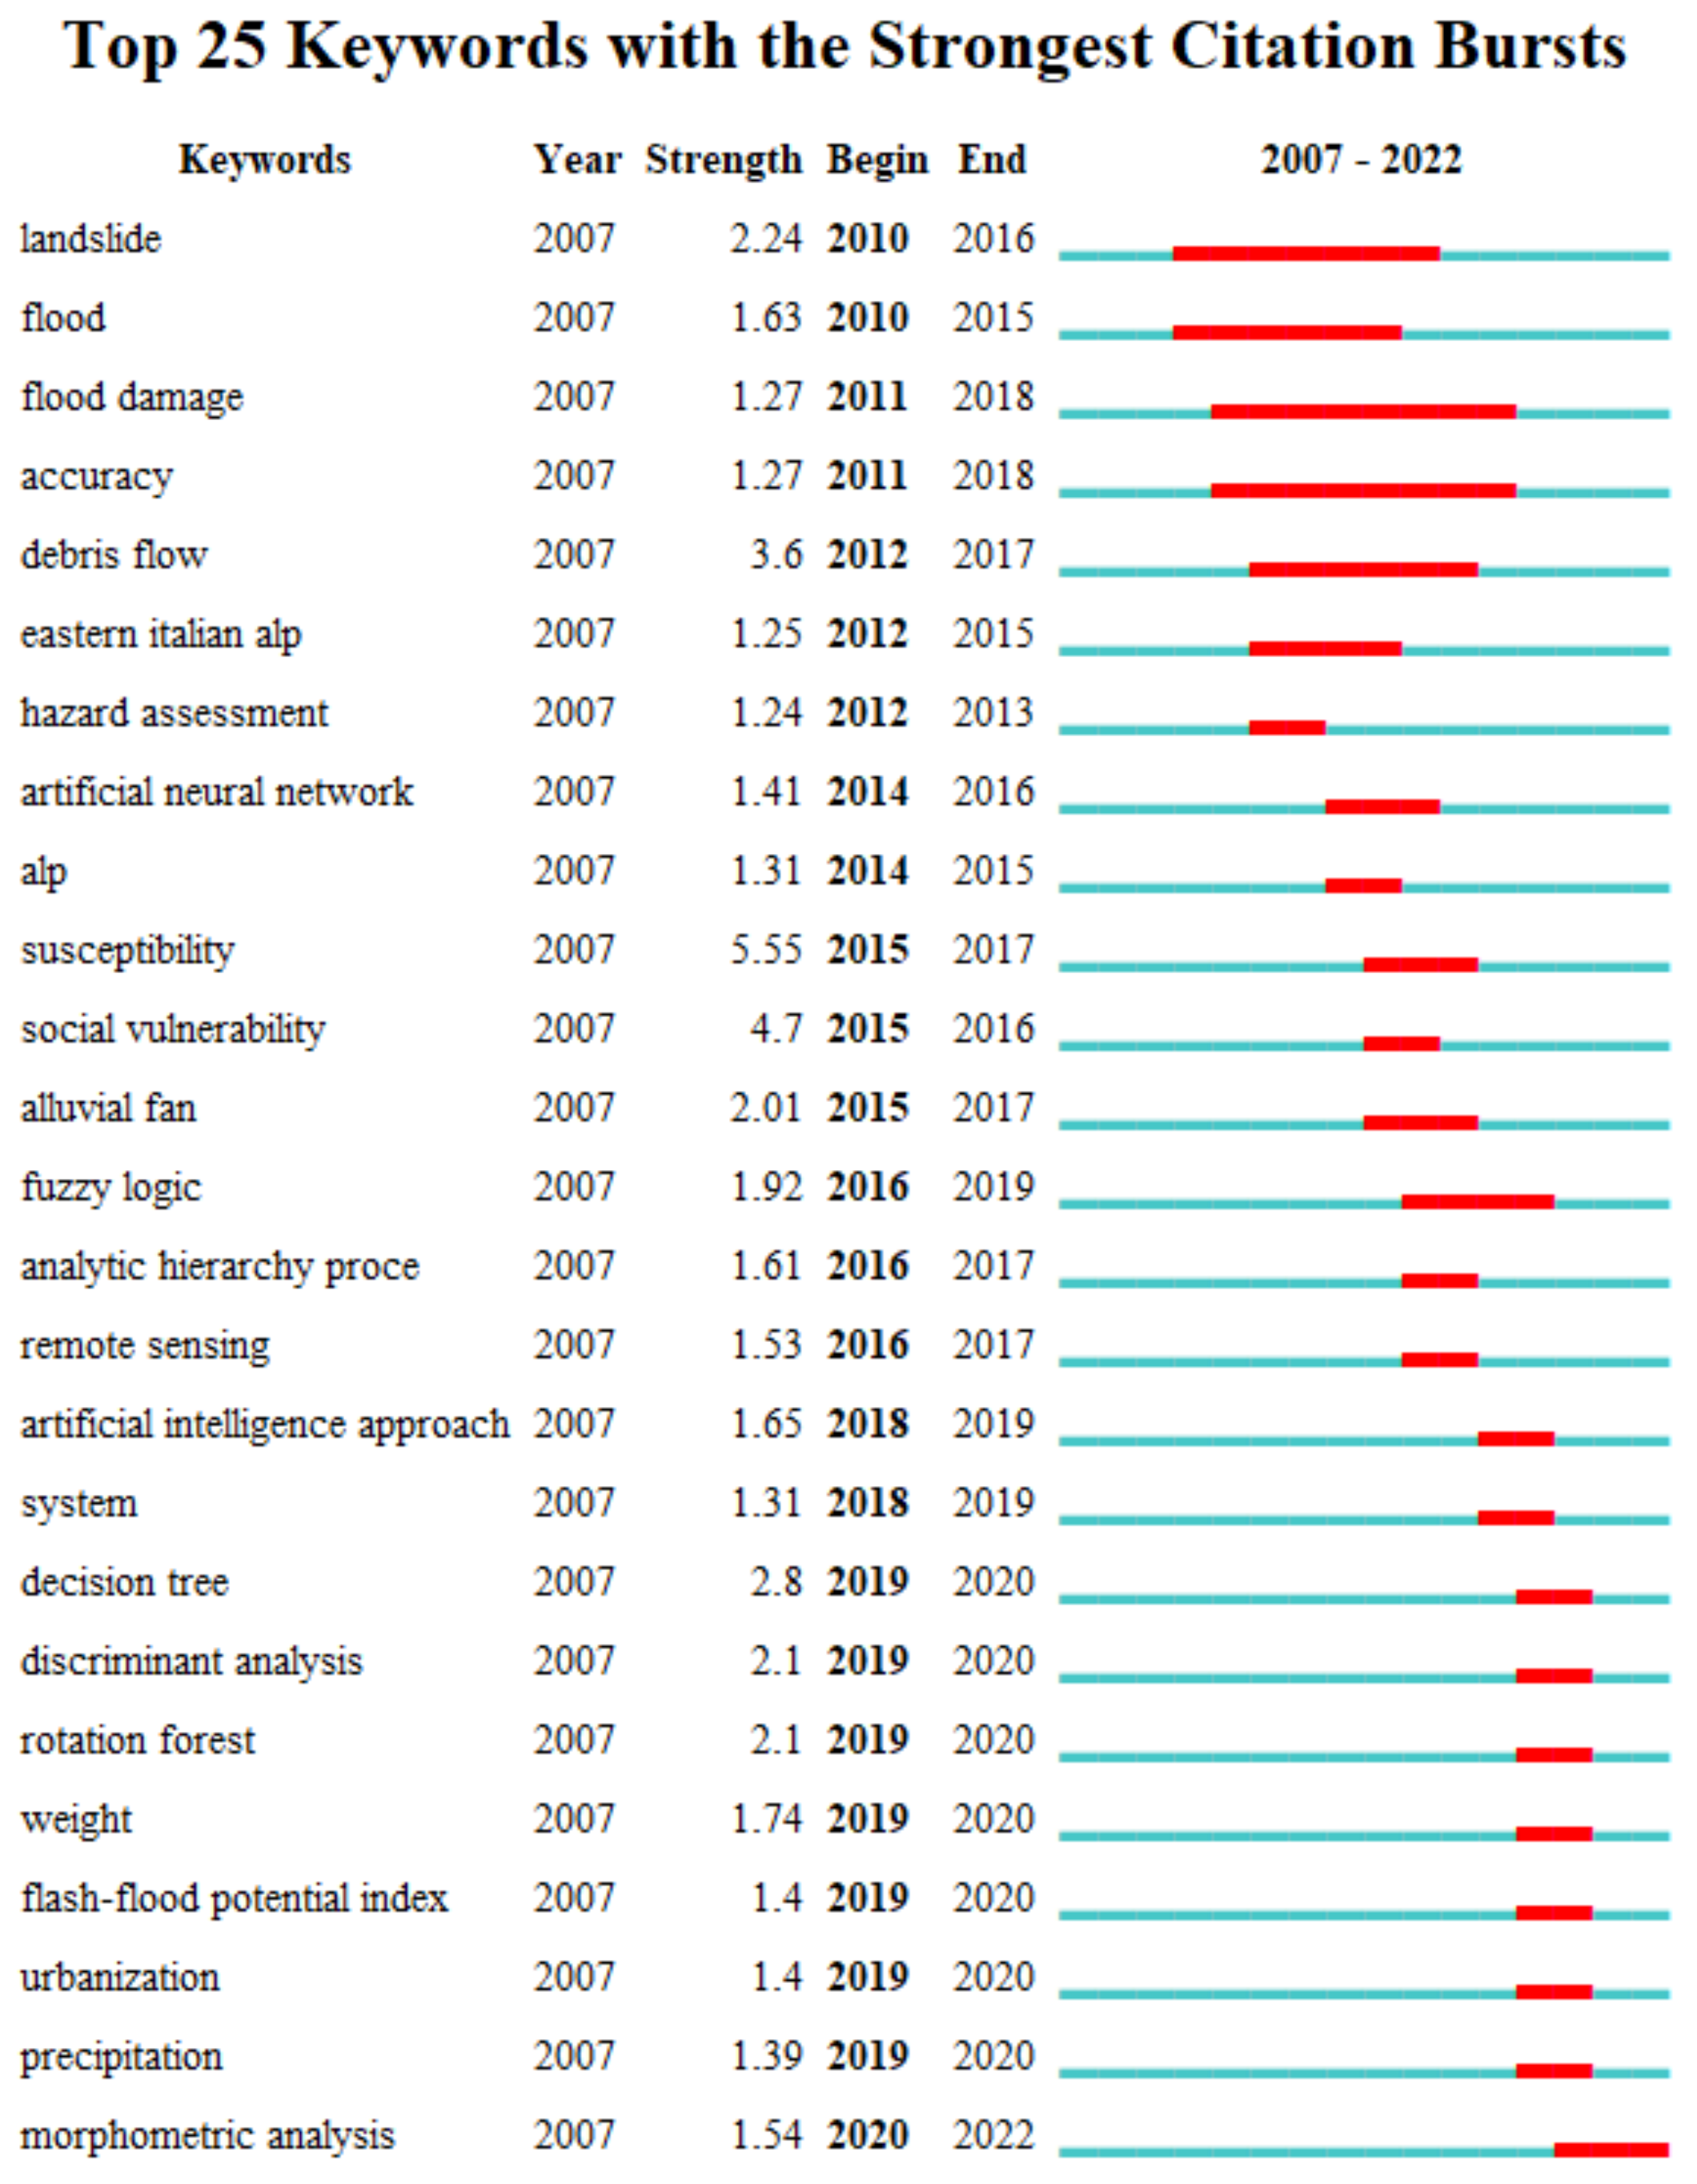
3.3.2. Keyword Burst Analysis

The keyword changes of citations can be detected through the Burst function of Citespace. Figure 8 shows the top 25 keywords with the strongest citation bursts from 2007 to 2022, including each research topic’s first appearance time and duration. As a word with the maximum burst strength, “susceptibility” began to appear in 2015 and ended in 2017, with a strength value of 5.55. The study of flash flood susceptibility is helpful in preventing flash flood disasters and reducing property losses and casualties. “Flood damage” is the keyword with the most extended duration. Floods are one of the most destructive natural disasters. Many countries and regions around the world suffer from flash floods, resulting in economic loss, damage to infrastructure, and loss of lives [21,22,23]. The keyword with high burst strength in recent years was “morphometric analysis”, which is also the current research hotspot. Morphometry was often used in watershed studies. The digital elevation model in the GIS system was used to generate morphometric parameters, such as area, perimeter, drainage frequency, etc., to evaluate the risk degree of flash floods in the watershed [25,35].
As shown in Figure 8, the research on the flash flood susceptibility assessment in different periods in chronological order mainly focuses on the following core topics:
(1)
The first stage is the period from 2010 to 2015. At this stage, the keyword “debris flow” had a maximum strength of 3.6, followed by landslide and flood, showing that scholars who studied the flash flood susceptibility assessment during this stage mainly discussed the hazard assessment of debris flows and landslides. The word “debris flow” originally covered flash floods, so the combined events of debris flows and flash floods were studied in many articles [114,115]. For example, Stolle et al. [116] analyzed the susceptibility of debris flow in the Ladakh Range by morphometric method, but later researchers found that the identification of different disaster processes by debris flow would affect the analysis of risk assessment and others [117], so more and more independent studies had been conducted for flash floods after 2015. In addition, as rainfall was the main disaster-causing factor, Mei et al. [118] conducted their research on precipitation estimation in the river basin in the eastern Italian Alps, which was also the main research area at this stage.
(2)
The second stage is the period from 2015 to 2017. The keywords with the highest strength were “susceptibility” (5.55) and “social vulnerability” (4.7). Social vulnerability assessment could understand the impact of flash floods and was an important part of flood risk assessment framework [119]. Remote sensing was one of the key words in this period. The map of the research area and the data of the influencing factors could be obtained by remote sensing technology, which provided sufficient preparation for the research.
(3)
The third stage is the period from 2018 to 2022. The keywords of “decision tree” had the maximum strength (with strength of 2.8), followed by the keyword of “rotation tree” and “discriminant analysis” (both of which were 2.1). At this stage, the research on the flash flood susceptibility assessment focused on the potential index and assessment model of flash floods. The accurate determination of the assessment index of flash flood susceptibility could help improve the model’s accuracy. The weight was an important determination criterion, so the strength of the importance was larger at this stage. With the introduction of artificial intelligence and the exposure of models such as “rotation forest”, “decision forest”, and “morphometric analysis”, the assessment models of flash flood susceptibility became more diversified.
(4)
The research and analysis of the above three development periods found that the academic community explored more and more deeply the flash flood susceptibility assessment and tended to determine high-precision assessment models and complete susceptibility assessment.

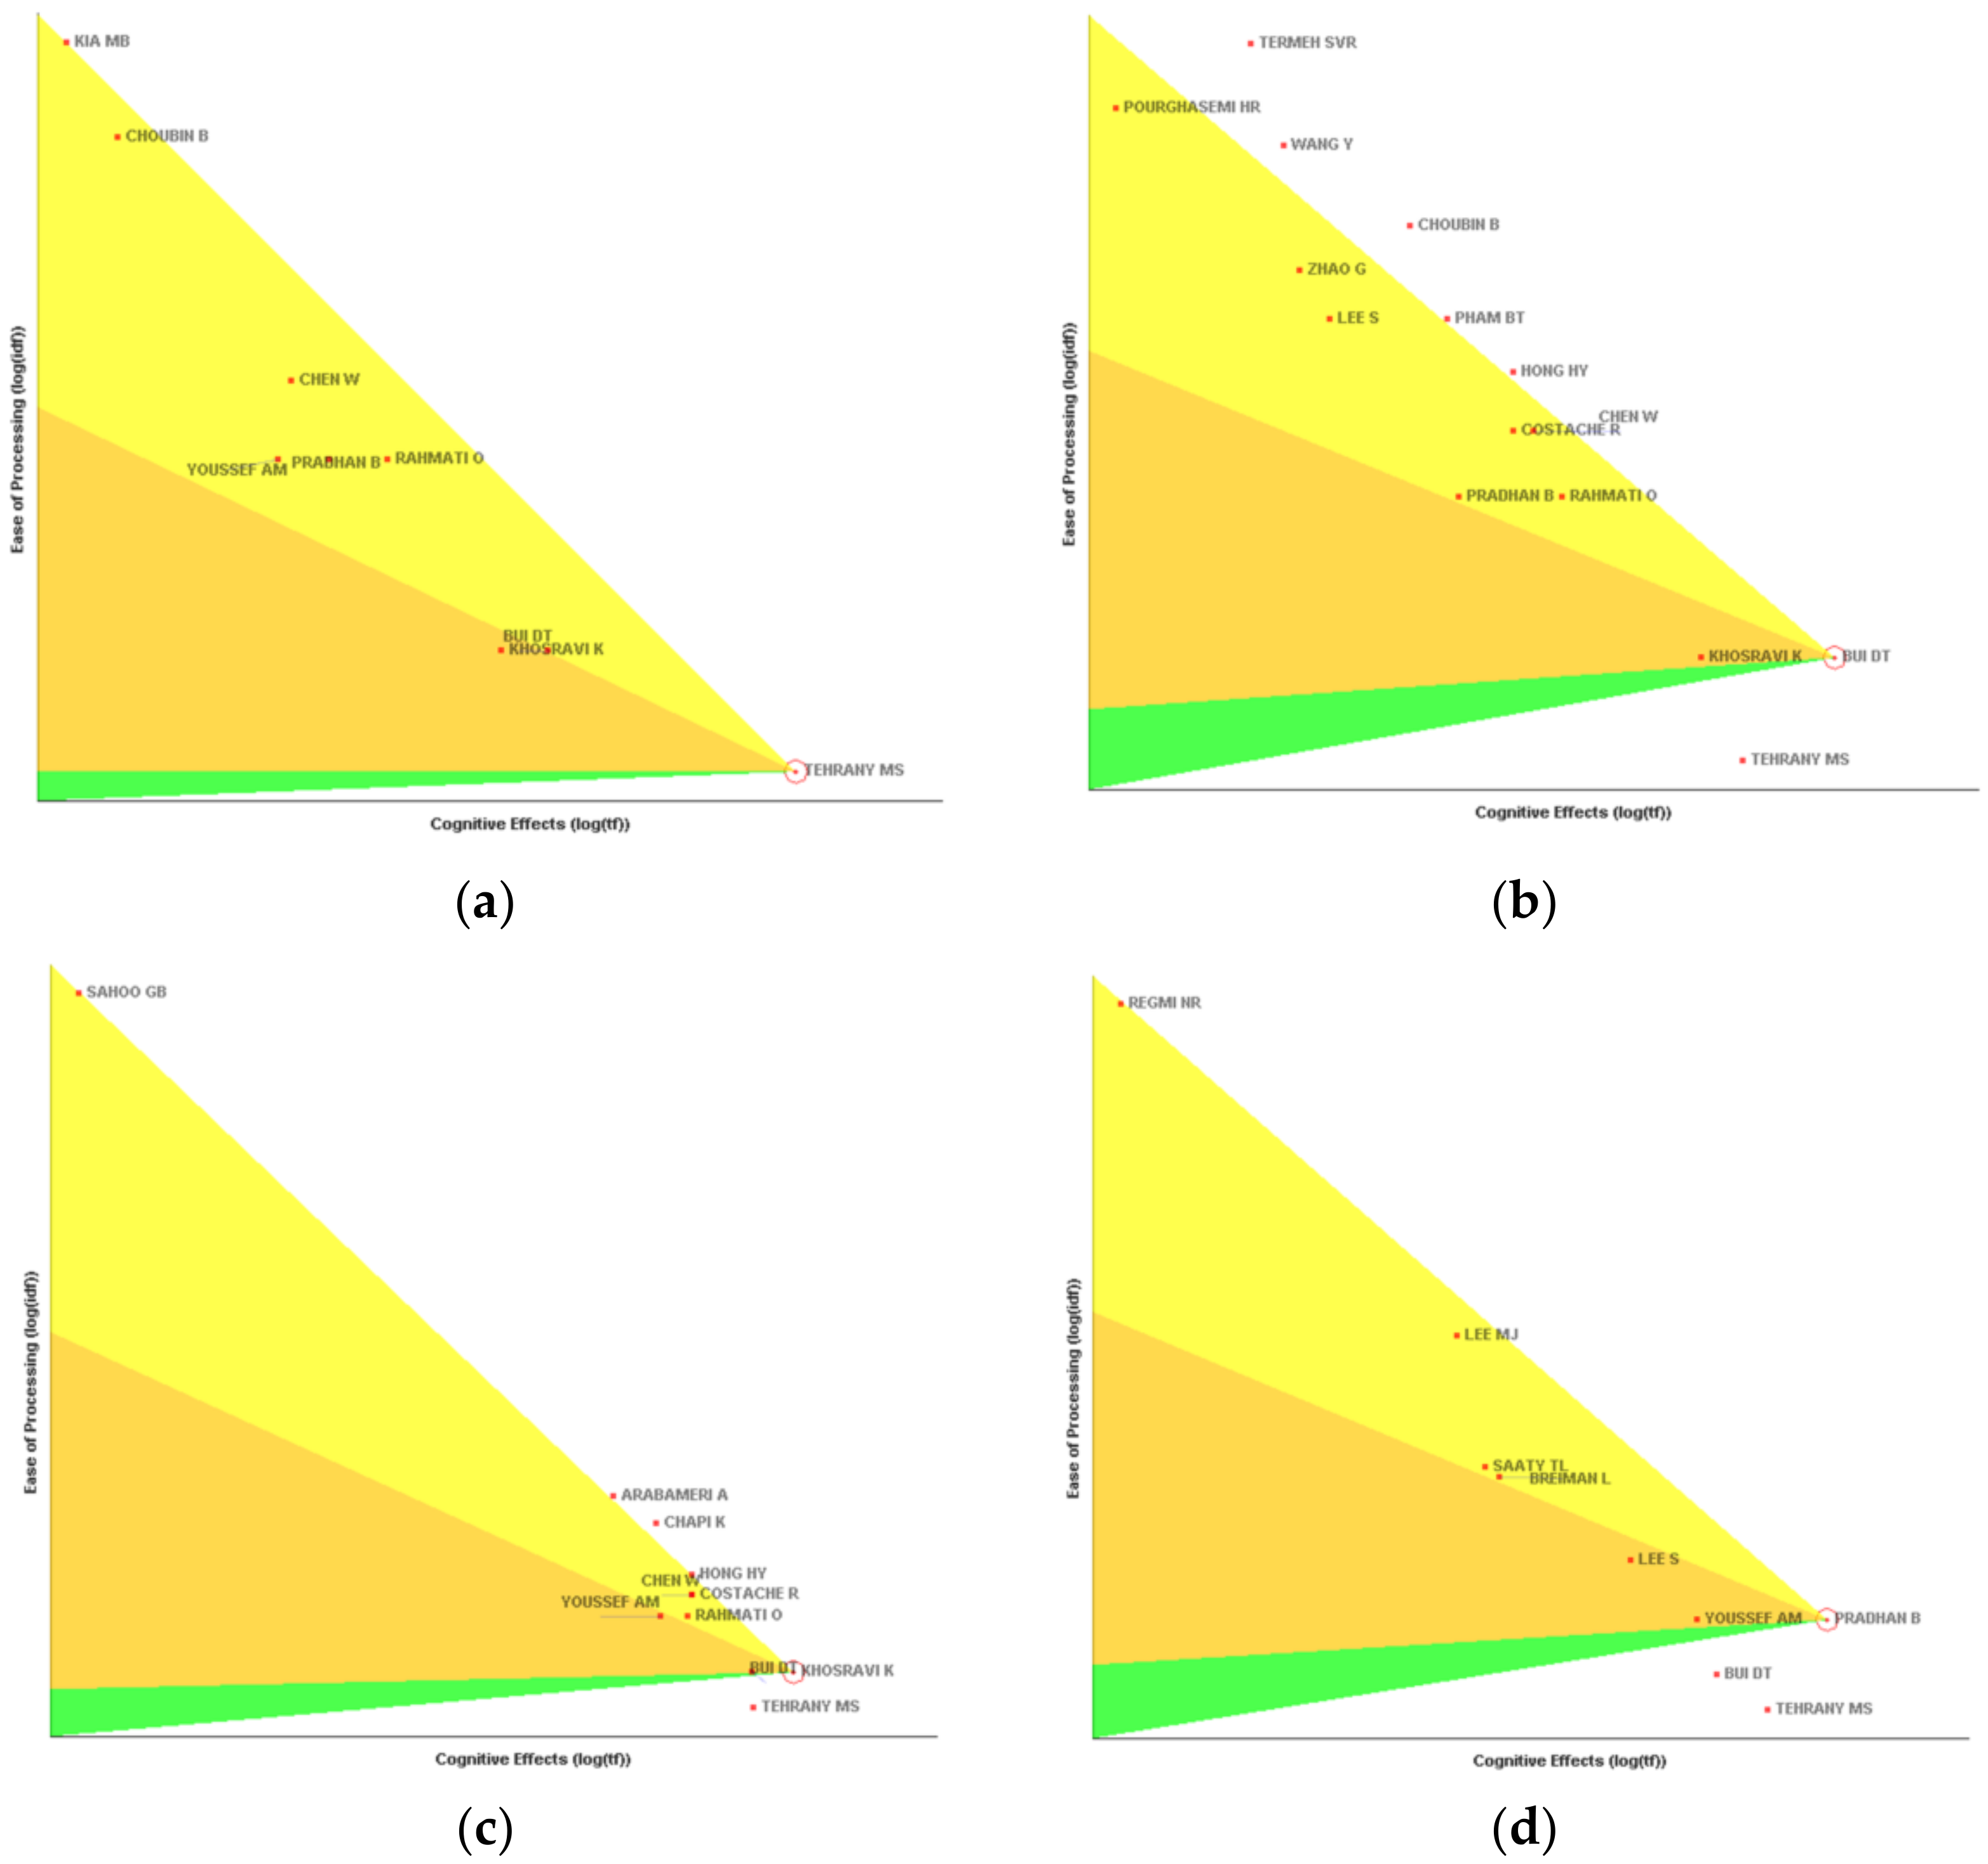
3.4. Author Co-Citation Analysis

Suppose scholars B and C are cited simultaneously in the articles of scholar A. In that case, there is a co-citation relationship between B and C. Through author co-citation analysis, the distribution of highly cited authors in the field of flash flood susceptibility assessment can be obtained to identify outstanding scholars in this field. The preprocessed data were imported into Citespace, the cluster analysis was made by tf*idf weighted algorithm, and K (Keywords) was used to name clusters to generate a timeline graph. The co-citation network is shown in Figure 9, the pennant diagrams of the first four highly cited authors are shown in Figure 10, and the co-citation cluster is shown in Figure 11. In order to increase the readability of the results, the map was optimized and adjusted in a co-citation network diagram (Figure 9) to display important information. In the co-citation cluster map (Figure 11), the number of network nodes N = 624, the number of connection lines E = 853, and the network density is 0.0044. The index for exploring the structure and clarity of clustering network Modularity Q is 0.7421 (>0.3), indicating that the clustering network has significant structure; Mean Silhouette is 0.9266 (>0.5), indicating that the clustering result is reasonable. In the figure, the color of each cluster represents the year when the co-citation relationship first appeared, and the progressive process of cluster color from gray to blue to yellow indicates an increased process over the years from 2007 to 2022. The node represents the co-citation author. The larger the node is, the more times the author is cited. The connection line between the nodes represents the co-citation relationship.
In Figure 9, the center color of the nodes of most authors is blue first and then continues until red appears, indicating that since 2016, a large number of authors in research fields have been cited, and currently, they still have a higher number of citations.
In Figure 9, the most cited authors are Tehrany (112), Bui (94), Khosravi (91), and Pradhan (76), respectively, who are the authors with high influence in the field of flash flood susceptibility assessment. According to Figure 9, almost all of the top four authors with the highest citations have been cited since 2016, and the research field has also increased since that year. Moreover, their articles were widely cited in 2020 and 2021, and these two years was also the peak period for the publication of articles in this field, indicating that they are highly influential authors, and the research on the flash flood susceptibility assessment has attracted a lot of attention in 2020 and 2021. Figure 10 shows the pennant figure of four authors. Figure 10a–d represent the four authors of Tehrany, Bui, Khosravi, and Pradhan, respectively. In Figure 10, the yellow, orange, and green color areas from top to bottom represent the subsequent scholars, contemporary scholars, and previous scholars related to the highly influential authors, respectively. In general, people tend to cite scholars who are on the upper part of the pennant figure in the idf hierarchical system in the pennant figure. All highly influential authors in the pennant figure tend to cite previous scholars or contemporary scholars, while subsequent scholars tend to cite highly effective authors [120]; therefore, the closer the author is to the bottom of the figure, the more times the author is cited.
The research topic of Tehrany tended towards environment science and ecology and geology, and its research on the application of weights of evidence function, frequency ratio, support vector machine, and other methods in flood sensitivity map [121,122,123,124] received a lot of attention. Khosravi made greater contributions to landslides, debris flowed, susceptibility, and groundwater, and published the most cited articles [78] (as described in Section 3.1), which cited Tehrany, Bui, Pradhan, and the author himself, forming a co-citation relationship. Bui was not only the author with the second highest number of citations but also the author with the second highest productivity (see Section 3.2.1), indicating that this author has an irreplaceable position in this research field. These four authors were included in the #1 machine learning cluster in terms of clustering analysis. They studied many machine learning methods, one of the critical points in the flash flood susceptibility assessment. Additionally, they showed that the assessment model is a research hotspot in the flash flood susceptibility assessment.
Figure 11 shows six clusters, i.e., #0 flash flood, #1 machine learning, #2 surface run-off, #3 decision trees, #4 logistic regression, and #5 road network. The second cluster #1 machine learning has 63 members, including Costache, who is the author with the highest productivity. The authors with stronger influence are all members of this cluster. Machine learning has been widely used in research fields as the most used model in flash flood susceptibility assessment. However, with the development of information technology and the improvement of science and technology, a single model was no longer used in the machine learning method for flash flood susceptibility assessment, and many hybrid models appeared. For example, Arabameri et al. [125] adopted three hybrid machine learning integrated models to assess the flash flood susceptibility in the Gorgan basin, Iran; Bui et al. [76] assessed the flash flood susceptibility in Bao Yen District and Bac Ha District of Lao Cai Province, Vietnam by the integrated models of FURIA-GA with three models (namely LogitBoost, Bagging, and AdaBoost). At the same time, it can be found that the GIS-based machine learning model is the main model for flash flood susceptibility assessment.

3.5. Institutional Co-Operation Analysis

The co-operation between different institutions can improve the research level of institutions and maximize the utilization of resources [61]. Through the analysis of institutional distribution, the research groups for flash flood susceptibility assessment were found, and a co-operation network diagram of institutions for publishing documents in this field was generated after the preprocessed data were imported into Citespace, as shown in Figure 12.
As shown in Figure 12, the larger the node is, the more documents the institution publishes. The thickness between nodes represents the number of co-operative papers between institutions. The color of the connection line represents the year of co-operation. The more prominent the purple circle on the outer side of the node is, the greater the centrality value is. In the figure, the number of network nodes N = 287, the number of connection lines E = 242, and the network density is 0.0059, indicating that at present, the co-operation between the institutions for flash flood susceptibility assessment is not close, and most institutions tend to study independently. The centrality of University of Bucharest is 0.10 (=0.1), and it is a crucial node, showing that this institution is a significant turning point for institutional co-operation in the research field and the core institution in institutional co-operation network. According to Figure 12, a co-operation circle with University of Bucharest as the core has been formed in the field of flash flood susceptibility assessment, including Duy Tan University, Natl Inst Hydrol & Water Management and Ton Duc Thang University. As the institution that has made the most significant contribution to the research field, and one of the most influential institutions in Vietnam, Duy Tan University has published 26 articles covering computer, medicine, and other disciplinary fields, and carried out a lot of high-quality studies [126,127], since its articles were published in 2011. It also established the most frequent co-operation with Ton Duc Thang University. Chinese Acad Sci (CAS), which ranks fifth in the number of publication, rarely co-operated with the top four institutions. As the most famous academic and scientific institution in the field of natural science in China, it mainly collaborated with domestic institutions in China, such as University of Chinese Acad Sci and China Inst Water Resources & Hydropower Res, etc. As there were not many connection lines between nodes in the co-operation network, CAS tended to study independently compared with the top four institutions. Table 5 showed the institution with a top five ranking in the number of papers published. The five institutions published a total of 100 papers, accounting for 32.79% of the total number of articles published. Four of the five institutions were university units, which also showed that universities are the main contributors in the research field.

4. Main Subfields of Flash Flood Susceptibility Assessment

Through the analysis of keywords and research hotspots, it was found that the selection of the assessment model was the focus of the flash flood susceptibility assessment. The assessment index of the screening directly affected the precision of the assessment model and the accuracy of the model with statistical model assessment methods, such as error of judgment. In addition, it was found in the analysis that the assessment scale and assessment unit were the basis steps for conducting susceptibility assessment. Therefore, comprehensively, this study divided the research in the field of flash flood susceptibility assessment into five subfields: assessment scale, assessment unit, assessment index, assessment model, and model assessment method.

4.1. Assessment Scale

The selection of the assessment scale is the basis of the flash flood susceptibility assessment. At present, the scale of the research area for flash flood susceptibility assessment is mainly divided into three scales: administrative division, watershed, and disaster-affected site. The administrative division is the administrative region divided by regions, including countries, provinces, and cities/districts/counties in the flash flood susceptibility assessment. Among the existing research, there is a lack of research on susceptibility assessment on a national scale. The main reason is that many factors affect flash floods, and the research on a national scale increases the complexity and difficulty.
Watershed refers to the scale in the research of flash flood susceptibility assessment. The research area is dominated by watersheds and basins, the most commonly used scales in the existing research. The main reason is that watersheds and basins can more easily lead to flash floods under extreme rainfall due to the unique topography, and there is heterogeneity in the impact of flash floods under different administrative units.
The data of flash flood disaster-affected sites not only help to generate the flash flood disaster catalog map but also the basis for forming the spatial geographic database of flash flood susceptibility. The use of rich data can more accurately study the regional flash flood susceptibility. In the flash flood susceptibility assessment on a scale of the disaster-affected site, the flood indexes related to historical flash flood events can be extracted by field investigation and other means to improve the assessment accuracy.
The research on the representative assessment scales is listed in Table 6. It is convenient to obtain map data by remote sensing technology with the administrative region assessment scale. Evaluating watershed parameters in the watershed scale can help assess flash flood susceptibility. The assessment accuracy is increased by obtaining accurate data based on disaster points. Different research scales have different geographical assessment conditions, and researchers can choose the appropriate assessment scale according to the study area.

4.2. Assessment Unit

The assessment unit is the minimum spatial unit used in the flash flood disaster susceptibility assessment, which directly affects the assessment effect of disasters. Therefore, reasonable selection and division of units are vitally important for the susceptibility assessment. The assessment unit in the existing research is generally divided into a grid unit, slope unit, topographical unit, unique condition unit, and geomorphic unit. Different assessment units are usually selected for different types of disasters. For example, the grid unit and geomorphic unit are often used as the assessment unit for debris flow susceptibility assessment; the grid unit and slope unit are often used as the assessment unit for landslide susceptibility assessment; grid unit, slope unit, and sub-basin-based geomorphological units are often used for flash flood susceptibility assessment. Sub-basin based geomorphological units are used to analyze susceptibility through spatial visualization by quantifying geomorphological parameters. The application of such units is rather limited, so grid units and geomorphological units are most often used in flash flood susceptibility assessment.

4.2.1. Type of the Assessment Unit

The susceptibility assessment units’ selection should be related to the actual topography. The appropriate assessment unit should be selected according to the topography to obtain higher accuracy [132]. The methods, advantages, and disadvantages of the assessment units are shown in Table 7.
Geomorphic units are commonly used in watershed-based assessments. Researchers generally divided the watershed into several sub-basin units. For example, Ahmad et al. [2] divided the Dir lower watershed into five sub-basins; Mahmood et al. [43] adopted a threshold of 4 km2 to divide Ushairy Basin into 17 sub-basins; Mahmood et al. [75] adopted a threshold of 25 km2 to divide Panjkora Basin into 30 sub-basins; El-Fakharany et al. [133] divided the Heliopolis basin into 10 sub-basins; Singh et al. [99] divided Ganga Basin into 29 sub-basins. However, not all basins were divided into sub-basin units for assessment, and many researchers used grid units for assessment [47,134].

4.2.2. Size of the Assessment Unit

The grid unit is the most commonly used assessment unit for flash flood susceptibility assessment. The grids generally generate the assessment unit for the flash flood susceptibility assessment with a certain resolution created by GIS software. The selection of appropriate map resolution can improve the accuracy of the assessment unit, but if the resolution is too coarse or too fine, the optimal accuracy cannot be guaranteed. In addition, the division of the optimal unit size needs to be further studied. The representative studies on the assessment unit of flash flood susceptibility are shown in Table 8.

4.3. Assessment Index

Many factors affect flash floods’ occurrence, including terrain, geology, hydrometeorology, human activities, etc., which are also essential indexes for the flash flood susceptibility assessment. Band et al. [33] considered 15 hydrological, climate, and geographical environmental factors and showed that topographic and hydrological parameters (such as elevation, slope, and distance from the river) were the most effective. Pham et al. [45] analyzed nine factors affecting flash floods and showed that the distance from the river was the most important factor. Ngo et al. [34] considered 10 flash flood factors and pointed out that land use/land cover (LULC), slope, curvature, and Topographic Wetness Index (TWI) were the most important indicators. Dejen et al. [138] considered nine flash flood risk parameters and pointed out that LULC and slope were the key indicators. Flash floods mainly occur in areas with flat curvature. The surface flow floods caused by heavy rainfall are more likely to occur in shallow soils with poor permeability and soils in low-lying areas. Therefore, rainfall intensity, LULC, TWI, and others are essential factors that cause flash floods. In general, rainfall, slope, curvature, Stream Power Index (SPI), TWI, LULC, NDVI, and distance to the river are all assessment indexes to be considered, among which slope, LULC, and distance to the river are the most important indicators, but still need to be screened for different research areas.
The correct selection of assessment indexes can improve the accuracy of flash flood susceptibility prediction. At present, the research on the screening of assessment indexes is generally divided into two situations: (1) the assessment indexes are determined by analyzing the correlation between factors. The main methods include Pearson correlation coefficient (PCC), multicollinearity, geographic detector interaction detector, etc. (2) the correlation between flash flood impact factors and flash floods is judged to determine index weight and select high weight factor as the assessment index. The main methods include principal component analysis, correlation-based feature selection method, geographic detector factor detector, etc. The research on the screening of representative assessment indexes is listed in Table 9.
A researcher can choose the screening of assessment indexes according to their wishes. Pearson correlation coefficients are used for the analysis of the independence of assessment factors. This method can be operated easily, and it will be more intuitive to describe the correlation between variables through the formed matrix. The multiple linear regression method uses the variance inflation factor (VIF) to determine the correlation between independent variables. The higher the VIF value is, the more serious the multicollinearity between independent variables is. The principal component analysis (PCA) simplifies the judgment of collinearity by reducing the number of variables.
There are also some methods that can not only measure the correlation between factors but also the correlation between independent and dependent variables. The correlation-based feature selection method (CFS) is based on the assumption that “the basis of good feature subsets is to be highly correlated with classes but not correlated with each other”, and includes the correlation analysis between random variables and the correlation analysis between independent variables and dependent variables. Geodetector is a method to measure the relationship between independent variable X and dependent variable Y [44]. The interaction detector can reflect whether the independent variables X1 and X2 (and more X factors) interact with the dependent variable Y. The factor detector can judge the correlation between independent variables and dependent variables. The advantage of this method is that the results are intuitive and reliable, and no assumptions or restrictions on independent and dependent variables are required.
Generally speaking, PCC and VIF are easy to manipulate when analyzing correlations between assessment metrics. Analyzing the correlation between assessment indicators and torrents is more intuitive using the results of Geodetector. The correlation between assessment indicators and the correlation with flash floods both influence the accuracy of the assessment. Therefore, researchers are advised to consider all aspects of the assessment and choose a more appropriate screening method.

4.4. Assessment Model

The assessment model is an essential means of flash flood susceptibility assessment. Assessment models can predict the possibility of occurrence of regional flash floods. Hydrological models and hydrodynamic models are mainly used to simulate the occurrence of flash floods. However, the hydrological model has excellent uncertainty due to the neglect of some physical mechanisms of flash floods and the need to calibrate many historical data. The hydrodynamic model can describe the surface flow dynamics in detail but requires certain assumptions and a large amount of calculation. Currently, the mainstream assessment models include traditional statistical models, hydrological models, hydrodynamic models, and intelligent learning models based on machine learning, deep learning, and hybrid models. Among them, statistical models, intelligent learning models, and hybrid models are the most used models in existing studies. The studies on representative models are shown in Table 10.
(1)
Intelligent learning model: This model selects appropriate flash flood susceptibility assessment indexes based on artificial intelligence and big data, conducts data test, determines the sample set and realizes the training dataset through a specific algorithm. The models such as artificial neural network (ANN), deep learning neural network (DLNN), random forest model, multilayer perceptron (MLP), particle swarm optimization (PSO), support vector machine (SVM), etc. are often used in the research of flash flood susceptibility.
(2)
Statistical model: This model is generated by applied mathematical and statistical methods, which generally analyze the relationship between independent and dependent variables by determining the weight or probability of each independent variable. Frequency ratio (FR), statistical index (SI) model, logistic regression, consequences of evidence model (WOE), fuzzy analytical hierarchy process (FAHP), and analytical hierarchy process (AHP), etc., are often used in the study of flash flood susceptibility.
(3)
Hydrological model: This model simulates the occurrence process of flash floods with factors, such as rainfall, hydrological soil, land cover, etc., quantifies surface runoff, and obtains flash flood sensitivity map with the help of remote sensing and geographic information system technology for further susceptibility assessment.
(4)
Hydrodynamic model: This model determines the boundary conditions and simulates the possibility of flash flood disasters by using hydrodynamics equations (such as Manning Formula, Energy Equation, Saint-Venant Equation, etc.).
(5)
Hybrid model: The model is an integration of a GIS-based intelligent learning model, statistical model, hydrological model, and hydrodynamic model, including a multi-intelligent learning model, dual statistical model, intelligent learning-statistical model, intelligent learning-hydrodynamic model, and hydrological-hydrodynamic model. Most of the studies adopt multi-intelligent learning models, dual statistical models, and intelligent learning-statistical models, while very few scholars use intelligent learning-hydrodynamic models and hydrological-hydrodynamic models for their studies.
From the review, it was found that the research in recent years had been biased toward the application of GIS-based hybrid models. The advantage of using a hybrid model for susceptibility assessment was that the model had higher accuracy than a single model and had a larger development space. Liu et al. [142] combined four machine learning models: fuzzy membership value (FMV), binary statistical method, support vector machine (SVM), classification and regression tree (CART), and convolutional neural network (CNN) were integrated to form three hybrid models, including SVM-FMV, CART-FMV, and CNN-FMV to predict flood susceptibility. It indicated that the accuracy of the three hybrid models was higher than that of the respective single machine-learning models. Ding et al. [143] also confirmed this statement.

4.5. Accuracy Assessment

To verify the accuracy of the assessment results of flash flood susceptibility, some methods need to be used to evaluate the performance of the assessment model in the study. Receiver operating characteristic curve (ROC), area under the curve (AUC), and statistical error index are usually used to evaluate the model’s performance.
(1)
ROC-AUC method
The receiver operating characteristic curve (ROC) is the most frequently used assessment method in flash flood susceptibility assessment. The curve is drawn with the true positive rate (TPR) as the ordinate and the false positive rate (FPR) as the abscissa mainly evaluates the performance of the model by the value of the area under the curve (AUC). When the AUC value is between 0.5–1.0, the closer the AUC value is to 1, the higher the accuracy of the model is. When the AUC value is 0.9–1.0, it means that the model has high accuracy; when the AUC value is 0.7–0.9, the model has general accuracy; when the AUC value is 0.5–0.7, it means that the model has low accuracy.
(2)
Error statistical index
Error statistical indexes include sensitivity (SST), specificity (SPF), accuracy (ACC), root mean square error (RMSE), mean absolute error (MAE), Kappa statistics, coefficient of determination (R2), etc. Generally, the statistical index combined with more than three indexes is used for evaluation, and different indexes may generate models with additional optimal accuracy. The frequently used error statistical indexes in the study are listed in Table 11.
The two methods of ROC-AUC and error statistical index can be used together or separately. In most studies, the ROC-AUC method is used to evaluate the model’s performance. However, when different optimal prediction models are generated using multiple statistical indexes, the optimal model developed by the ROC-AUC method is more reliable.

5. Application of Remote Sensing and GIS in Flash Flood Susceptibility Assessment

Remote sensing and GIS are essential components of the spatial analysis of various natural hazards and are the basis of flash flood susceptibility assessment. Remote sensing technology and GIS play an important role in assessment scale, assessment unit, assessment index, and assessment model. From the visual analysis of this study, the application of remote sensing technology and GIS in flash flood susceptibility assessment will become more and more extensive in the future.
(1)
Application of remote sensing and GIS in the flash flood susceptibility assessment scale
Identification of study areas based on remote sensing and GIS is an essential tool for delineating the scale of flash flood susceptibility assessment. DEM and multiple remote sensing satellite images have become popular tools for identifying delineated flash flood susceptibility areas.
As the flash flood susceptibility assessment in the administrative scale, GIS was used to obtain maps of the target area and flash flood inventory maps. Pham et al. [36] acquired an inventory map of flash flood hazards at Nghe An Province, Vietnam, from satellite images and aerial photographs. Saber et al. [46] obtained and produced inventory maps of flash flood sites through remote sensing.
In watershed-scale flash flood susceptibility assessment, watershed boundaries are usually delineated in a GIS environment through DEM. It is worth mentioning that the combined application of RS and GIS has promoted the development of watershed flash flood susceptibility assessment. Determination of watersheds using GIS software has replaced the traditional manual determination of watersheds and has become the dominant method of measurement [35]. Nasir et al. [35] used the ArcHydro tool in ArcGIS to delineate the Swat River watershed. Mahmood et al. [43] used inverse radiometer and satellite-based thermal emission. Mahmood et al. [75] used a watershed modeling approach to delineate the Panjkra basin based on the GIS environment. In addition, flash flood inventory maps of the watershed are also frequently accessed through remote sensing techniques. For example, Abedi et al. [148] acquired flash flood inventory maps by orthophoto. Pham et al. [45] delineated flash flood hazard points on a map with GIS software. Costach et al. [149] obtained flash flood hazard points with the help of high-resolution satellite images.
For disaster point-based scale assessment, disaster data are used to classify the test and validation sets, so the accuracy of disaster data affects the reliability of the assessment. The application of remote sensing technology and GIS has improved the accuracy of disaster data [57]. Remote sensing images such as Sentinel-1 c-band SAR images and handheld GIS tools are often used in studies to identify flash flood sites. Ngo et al. [34] acquired data from Sentinel-1 c-band SAR images. Ngo et al. [96] used Sentinel-1 C-band SAR images to identify flash flood lists. Bui et al. [90] used handheld GIS to confirm the polygons of flash flood points in their research.
Research showed that remote sensing and GIS databases were the primary databases for flash flood susceptibility assessment [101,149]. Therefore, the databases for future studies will still be dominated by GIS databases.
(2)
Application of remote sensing and GIS in flash flood susceptibility assessment unit
The generation of raster units of specific pixel size based on GIS software is the most common method of grid unit division in existing studies [44,96]. Researchers divided remote sensing images into specific size units to conveniently construct of thematic maps of each factor for the next step of the study. For example, Pham et al. [36] used ArcGIS software to generate raster units with 20 m pixels to construct thematic maps. Arabameri et al. [125] built topographic factor thematic maps with 12.5 m resolution in a GIS environment. Bui et al. [89] divided remote sensing images into 20 m size units in GIS software and made thematic maps. Bui et al. [90] divided remote sensing images into 10 m raster units. Since the image sources are primarily remotely sensed images, RS and GIS software will continue to be applied in future studies.
(3)
Application of remote sensing and GIS in flash flood susceptibility assessment index
Accurate identification of flash flood influencing factors is an essential part of flash flood susceptibility assessment [101]. Remote sensing technology plays a significant role in acquiring influencing factors and is an instrument for the acquisition of assessment indexes. Costach et al. [48] selected 8 out of 10 assessment indexes by remote sensing technology. Hang et al. [16] selected 12 factors as assessment indexes and 7 of them acquired by remote sensing data. Bui et al. [89] chose elevation, slope, curvature, top shade, aspect, TWI, and SPI from DEM and NDVI from Landsat-8 Operational Land Imagery. Janizadeh et al. [49] considered elevation, slope, slope aspect from the DEM, and land use from the OLI Landsat satellite imagery. Waqas et al. [129] chose factors including distance to the river, drainage density slope, and elevation from DEM and Sentinel-2 satellites, and land cover based on Advanced Land Observing Satellite (ALOS).
Overall, topographical factors, such as slope, curvature, stream power index (SPI), and topographic wetness index (TWI), can be obtained by digital elevation model, hydrological data can be obtained by radar satellite, and remote sensing parameters including vegetation cover and land use/land cover (LULC) are generally obtained through remote sensing image interpretation. The images of each assessment index are indispensable data for flash flood susceptibility assessment. Therefore, remote sensing technology and GIS are still essential ways to acquire assessment indicators in future studies.
(4)
Application of remote sensing and GIS in a flash flood susceptibility assessment model
The accuracy of prediction of flood risk areas has been improved by GIS combined with other methods in recent studies [54]. Ding et al. [143] considered machine learning as the most cutting-edge method. With the development of deep learning, GIS-based machine learning and deep learning intelligent learning models have become the mainstream models for flash flood susceptibility assessment. Bui et al. [36] used four machine learning methods, including Kernel Logistic Regression (KLR), Radial Basis Function Classifier (RBFC), Naive Bayes Multinomial (NBM), and Logistic Model Tree (LMT) to assess the flash flood susceptibility. Chakrabortty et al. [139] tested three models, namely swarm optimization (PSO), an artificial neural network (ANN), and a deep-leaning neural network (DLNN). Janizadeh et al. [49] used five machine learning methods, including alternating decision tree (ADT), functional tree (FT), kernel logistic regression (KLR), multilayer perceptron (MLP), and Quadratic Discriminant Analysis (QDA) to assess the flash flood susceptibility. Khosravi et al. [78] used four decision tree-based machine learning models, i.e., Logical Model Tree (LMT), Reduced Error Pruning Tree (REPT), Naive Bayes Tree (NBT), and ADT for flash flood susceptibility mapping.
Current research tends to use a hybrid model dominated by intelligent learning models other than a single one. Costach et al. [84] used AHP, DNN, FR-DNN, and AHP-DNN to assess flash-flood susceptibility, indicating that the DNN-AHP hybrid model had higher accuracy. Costach et al. [47] tested the Index of Entropy (IOE), AHP, ADT-IOE, and ADT-AHH, showing that the accuracy of the hybrid model is higher than that of the single model. Costach et al. [150] used four stand-alone models, including ADT, Rotation Forest (RT), WOE, and Logistic Model Tree (LMT), and three hybrid models, namely ADT-WOE, RT-WOE, and LMT-WOE, showing that among the seven models, the ADT-WOE hybrid model was the best in terms of accuracy. Meanwhile, these studies showed that using hybrid models can improve prediction accuracy. In addition, GIS-based machine learning models possess higher accuracy than statistical models even when the number of flash flood points decreases [54]. Therefore, the application of GIS in flash flood susceptibility assessment models is also increasing.

6. Discussions

In the past 15 years, flash flood susceptibility assessment has received significant attention and made substantial progress. However, it continues to face great challenges due to the limitations of incomplete data, uncertainty in optimal resolution, and the master control factors and models. Accurate prediction of flash flood-prone areas is prospective for reducing the impact of flash floods. Therefore, this study examined five subfields of assessment scales, assessment units, assessment metrics, assessment models, and model assessment methods to look into the future direction of flash flood susceptibility assessment research. It will enhance the assessment framework of this research area and increase the accuracy of flash flood susceptibility assessment.
For assessment scale, the watershed as the assessment scale is the most studied assessment scale, which facilitates risk management by policymakers. The main reason is the ability to respond to the spatial variability of flash floods at relatively small administrative scales [40] and the convenience of dividing small scales into multiple homogeneous regions [151], since flash flood impacts are heterogeneous across administrative divisions [40]. Therefore, whether future studies need to investigate at the national scale needs further exploration. Disaster databases help researchers understand the changing nature of flash flood disasters [152,153]. The statistical analysis method of flash flood disasters based on GIS and RS is very popular, which makes it possible to carry out multidisciplinary integrated analysis of flash flood disasters based on the data management function of GIS [91,101]. The prerequisite for analyzing flash flood susceptibility using GIS is historical flash flood data with higher accuracy [154]. At present, only 38.46% of the databases providing disaster data on the Internet have open access [155], and the data contained in each database is not the same, while the spatio-temporal coverage is limited [W36]. Therefore, establishing an open flash flood disaster database based on the GIS platform and acquisition of multi-period flash flood disaster data will help solve such a problem.
For the assessment unit, sub-basin units are the primary assessment units in a relatively small number of watershed-scale studies [2,43,75]. However, most studies continue to divide remote sensing images into multiple grid units based on GIS software [34,44,156]. The grid units were divided into several sizes, including 5 m [23], 12.5 m [125], 15 m [135], 20 m [36], 30 m [136], and 90 m [137], which were chosen by various researchers. Tian et al. [157] showed that the raster resolution affects the topographic parameters. However, it would not mean that the higher the resolution, the higher the accuracy [157]. Moreover, the optimal resolution depends on the size of the study area. Therefore, the optimal resolution varies from the study area to study area. The best resolution can be acquired by assessing and comparing the accuracy of each resolution, and the grid unit divided using the best resolution size is more accurate. Therefore, it is possible to improve the accuracy of flash flood susceptibility assessment by using grid units with the best resolution size.
For the assessment index, flash flood hazards have different regularities under different environmental conditions, which diversify the factors for assessing flash flood susceptibility [101,158]. Correlations among assessment factors influence the analytical accuracy of models [109,159], and flood risk mitigation can be performed by identifying the key drivers [160]. Current studies seldom focus on the correlation between assessment indexes. Hence, the choosing of correlation effects among mutually independent assessment factors or softening factors is one of the basic trends in quantitative studies of flash flood susceptibility and an aspect which should not be ignored in the accuracy requirements of flash flood susceptibility analysis. Second, current studies tend to assess the susceptibility of areas with flash floods that have occurred by means of flash flood hazard inventories and lack predictions of future flash flood events [47,88]. Correctly assessing the relationship between predictors and floods improves accuracy in predicting future flood-affected areas [84], which provides direction for predicting future flash flood events.
For the assessment model, a GIS-based hybrid model applied to flash flood susceptibility assessment increases the accuracy [54]. With the wide application of machine learning and artificial intelligence in natural hazard assessment [51,109,159,161], the hybrid intelligent learning model will be the dominant flash flood susceptibility assessment model. However, current research mostly builds multi-intelligent learning hybrid models, and rarely creates hybrid models that combine with traditional hydrological and hydrodynamic models [83]. Belloset al. [162] indicated that compared to traditional hydrological models, hydrodynamic models can describe surface flow dynamics. Additionally, hydrodynamic models can predict large flash floods [141]. Therefore, the establishment of a hybrid model of hydrodynamic model and GIS-based machine learning model is of great help for the dynamic assessment and prediction of future flash flood events.
For model assessment accuracy, using different error statistics metrics may lead to varying optimal accuracy models. For example, Costache et al. [149] analyzed SST, SPF, ACC, and Kappa to obtain different best models. Pham et al. [36] used SST, SPF, Kappa, RMSE, and ROC curves to evaluate the accuracy of the four models and got different results. Additionally, Bui et al. [76] pointed out that this situation is limited mainly by the data quality and the identification of non-flooded areas. More accurate results tended to be obtained using ROC curves [76]. Therefore, the ROC curve is a mandatory model assessment method when performing a model assessment.

7. Conclusions

This study used bibliometric and visual analysis to systematically analyze the relevant literature in the field of flash flood susceptibility assessment, including influence analysis, keyword co-occurrence analysis, keyword outbreak analysis, author co-citation analysis, and institutional co-operation analysis. Based on the analysis, the study summarized and discussed the current status and development trends of research in five key subfields, i.e., assessment scales, assessment units, assessment indexes, assessment models, and model assessment methods, and analyzed the application of RS and GIS.
It showed that: (1) Current assessment scales were divided into administrative division, watershed, and disaster point data scales, and watershed was the primary assessment scale. (2) The assessment units were mainly sub-basin units and grid units. For grid units, adopting optimal resolution size units can increase the assessment accuracy. (3) Slope, LULC, and distance to the river are the most dominant assessment indexes. Choosing the primary control factors and reducing the correlation between assessment indexes can improve assessment accuracy and reduce the flood impact. (4) Hybrid models based on GIS were the mainstream models for assessment, and using hybrid models based on GIS machine learning and hydrodynamics can predict future flash flood events. (5) Model assessment methods include ROC curves and error statistics indicators such as SST, with ROC curves being the model’s indispensable method for assessment; RS and GIS were the basis of flash flood susceptibility assessment and remain applicable in future research. In general, flash flood hazard susceptibility assessment remains in the developmental stage and still faces many challenges. This study can provide research directions for subsequent researchers to provide a basis for early identification of flash floods.

Author Contributions

L.D. and H.L. (Heng Lu) drafted the manuscript and were responsible for the research design, experiment, and analysis. C.L., H.X., T.L., G.L., X.D. and Z.Y. reviewed and edited the manuscript. H.P., H.L. (Haizhi Liu), X.Y., D.Z., X.F. and X.L. supported the data preparation and the interpretation of the results. All of the authors contributed to editing and reviewing the manuscript. All authors have read and agreed to the published version of the manuscript.

Funding

This research was supported by the National Key R&D Program of China (2019YFC1510700), the National Natural Science Foundation of China (41701499), the Sichuan Science and Technology Program (2018GZ0265), the Geomatics Technology and Application Key Laboratory of Qinghai Province, China (QHDX-2018-07), the Major Scientific and Technological Special Program of Sichuan Province, China (2018SZDZX0027), and the Key Research and Development Program of Sichuan Province, China (2018SZ027, 2019-YF09-00081-SN).

Data Availability Statement

The data that support the findings of this study are available from the corresponding author upon reasonable request.

Conflicts of Interest

The authors declare no conflict of interest.

References

  1. Haque, M.N.; Siddika, S.; Sresto, M.A.; Saroar, M.M.; Shabab, K.R. Geo-spatial Analysis for Flash Flood Susceptibility Mapping in the North-East Haor (Wetland) Region in Bangladesh. J. Earth Syst. Environ. 2021, 5, 365–384. [Google Scholar] [CrossRef]
  2. Ahmad, W.; Nasir, M.J.; Iqbal, J. Flash flood susceptibility modeling for drainage basins of Dir Lower Khyber-Pakhtunkhwa: A comparative analysis of morphometric ranking and El-Shamy’s approach. In Proceedings of the SPIE Conference Remote Sensing for Agriculture, Ecosystems, and Hydrology XXII, Online Only, UK, 21–25 September 2020; p. 115280E. [Google Scholar]
  3. Einfalt, T.; Hatzfeld, F.; Wagner, A.; Seltmann, J.; Castro, D.; Frerichs, S. Urbas: Forecasting and management of flash floods in urban areas. Urb. Water 2009, 6, 369–374. [Google Scholar] [CrossRef]
  4. Ma, M.; He, B.; Wan, J.; Jia, P.; Guo, X.; Gao, L.; Maguire, L.W.; Hong, Y. Characterizing the Flash Flooding Risks from 2011 to 2016 over China. Water 2018, 10, 704. [Google Scholar] [CrossRef] [Green Version]
  5. Zeng, Z.; Tang, G.; Long, D.; Xu, H.; Chen, Y.; Hong, Y. Development of GIS-based FFPI for China’s flash flood forecasting. In Proceedings of the 2015 23rd International Conference on Geoinformatics, Wuhan, China, 19–21 June 2015; p. 15702354. [Google Scholar]
  6. Dragomir, A.; Tudorache, A.V.; Costache, R. Assessement of flash-flood susceptibility in Small river basins. Present Environ. Sustain. Dev. 2020, 14, 119–130. [Google Scholar]
  7. Xiong, J.; Pang, Q.; Fan, C.; Cheng, W.; Ye, C.; Zhao, Y.; He, Y.; Cao, Y. Spatiotemporal Characteristics and Driving Force Analysis of Flash Floods in Fujian Province. ISPRS Int. J. Geo-Inf. 2020, 9, 133. [Google Scholar] [CrossRef] [Green Version]
  8. Li, H.; Zhang, S.; Li, Q.; Zhang, X.; Guo, L. Research on flash flood disaster warning index: Case study of Luoning County. J. IOP Conf. Ser. Earth Environ. Sci. 2019, 218, 012075. [Google Scholar] [CrossRef]
  9. Wang, N.; Lombardo, L.; Tonini, M.; Cheng, W.; Guo, L.; Xiong, J. Spatiotemporal clustering of flash floods in a changing climate (China, 1950–2015). J. Nat. Hazards Earth Syst. Sci. 2020, 21, 2109–2124. [Google Scholar] [CrossRef]
  10. Alrehaili, N.R. A systematic review of the emergency planning for flash floods response in the Kingdom of Saudi Arabia. Aust. Inst. Disaster Resil. 2021, 36, 82–88. [Google Scholar] [CrossRef]
  11. Zhang, Y.; Wang, Y.; Chen, Y.; Xu, Y.; Zhang, G.; Lin, Q.; Luo, R. Projection of changes in flash flood occurrence under climate change at tourist attractions. J. Hydrol. 2021, 595, 126039. [Google Scholar] [CrossRef]
  12. Lin, K.; Chen, H.; Xu, C.; Yan, P.; Lan, T.; Liu, Z.Y.; Dong, C.Y. Assessment of flash flood risk based on improved analytic hierarchy process method and integrated maximum likelihood clustering algorithm. J. Hydrol. 2020, 584, 124696. [Google Scholar] [CrossRef]
  13. Younis, J.; Anquetin, S.; Thielen, J. The benefit of high-resolution operational weather forecasts for flash flood warning. Hydrol. Earth Syst. Sci. 2018, 12, 1039–1051. [Google Scholar] [CrossRef]
  14. Goyal, H.R.; Ghanshala, K.K.; Sharma, S. Flash flood risk management modeling in indian cities using IoT based reinforcement learning. Mater. Today Proc. 2021, 46, 10533–10538. [Google Scholar] [CrossRef]
  15. Arshad, S.H.M.; Ishak, A.M.H.; Muhamad, N.; Pereira, J.J. Assessing Effectiveness of Kuala Lumpur SMART Tunnel for Flood Prevention. Geogafia-Malays. J. Soc. Space 2020, 16, 184–200. [Google Scholar]
  16. Hang, H.T.; Hoa, P.D.; Tru, V.N.; Phuong, N.V. Application of Shannon’s Entropy Model and GIS in Flash Flood Forecasting Along National Highway-6, Hoa Binh Province, Vietnam. Int. J. Geomate 2021, 21, 50–57. [Google Scholar] [CrossRef]
  17. Li, H.C.; Lei, X.H.; Shang, Y.Z.; Qin, T. Flash flood early warning research in China. Int. J. Water Resour. Dev. 2018, 34, 369–385. [Google Scholar] [CrossRef] [Green Version]
  18. Liu, Y.; Yuan, X.; Guo, L.; Huang, Y.; Zhang, X. Driving Force Analysis of the Temporal and Spatial Distribution of Flash Floods in Sichuan Province. Sustainability 2017, 9, 1527. [Google Scholar] [CrossRef] [Green Version]
  19. Wang, H.; Yun, R.; Zhao, R.; Qi, Z. Flash flood risk evaluation based on variable fuzzy method and fuzzy clustering analysis. J. Intell. Fuzzy Syst. 2019, 37, 4861–4872. [Google Scholar] [CrossRef]
  20. Gourley, J.J.; Flamig, Z.L.; Vergara, H.; Kirstetter, P.E.; Clark, R.A.; Argyle, E.; Arthur, A.; Martinaitis, S.; Terti, G.; Erlingis, J.M. The FLASH project: Improving the tools for flash flood monitoring and prediction across the United States. Bull. Am. Meteorol. Soc. 2017, 98, 361–372. [Google Scholar] [CrossRef]
  21. Shahabi, H.; Shirzadi, A.; Ronoud, S.; Asadi, S.; Pham, B.T.; Mansouripour, F.; Geertsema, M.; Clague, J.J.; Bui, D.T. Flash flood susceptibility mapping using a novel deep learning model based on deep belief network, back propagation and genetic algorithm. Geosci. Front. 2021, 12, 101100. [Google Scholar] [CrossRef]
  22. Arlikatti, S.; Maghelal, P.; Agnimitra, N.; Chatterjee, V. Should I stay or should I go? Mitigation strategies for flash flooding in India. J. Int. J. Disaster Risk Reduct. 2018, 27, 48–56. [Google Scholar] [CrossRef]
  23. Youssef, A.M.; Pradhan, B.; Sefry, S.A. Flash flood susceptibility assessment in Jeddah city (Kingdom of Saudi Arabia) using bivariate and multivariate statistical models. Environ. Earth Sci. 2015, 75, 12. [Google Scholar] [CrossRef]
  24. Giuseppe, E.; Fabio, M.; Germana, S. Analysis of Increasing Flash Flood Frequency in the Densely Urbanized Coastline of the Campi Flegrei Volcanic Area, Italy. J. Front. Earth Sci. 2018, 6, 63. [Google Scholar]
  25. Alam, A.; Ahmed, B.; Sammonds, P. Flash flood susceptibility assessment using the parameters of drainage basin morphometry in SE Bangladesh. Quat. Int. 2022, 575, 295–307. [Google Scholar] [CrossRef]
  26. Arnell, N.W.; Gosling, S.N. The impacts of climate change on river flood risk at the global scale. J. Clim. Change 2016, 134, 387–401. [Google Scholar] [CrossRef] [Green Version]
  27. Popa, M.C.; Simion, A.G.; Peptenatu, D.; Dima, C.; Draghici, C.C.; Florescu, M.S.; Dobrea, C.R.; Diaconu, D.C. Spatial assessment of flash-flood vulnerability in the Moldova river catchment (N Romania) using the FFPI. J. Flood Risk Manag. 2020, 13, e12624. [Google Scholar] [CrossRef]
  28. Marchi, L.; Borga, M.; Preciso, E.; Gaume, E. Characterisation of selected extreme flash floods in Europe and implications for flood risk management. J. Hydrol. 2010, 394, 118–133. [Google Scholar] [CrossRef]
  29. Zhai, X.; Zhang, Y.; Zhang, Y.; Guo, L.; Liu, R. Simulating flash flood hydrographs and behavior metrics across China: Implications for flash flood management. Sci. Total Environ. 2021, 763, 142977. [Google Scholar] [CrossRef]
  30. Guo, L.; He, B.; Ma, M.; Chang, Q.; Li, Q.; Zhang, K.; Hong, Y. A comprehensive flash flood defense system in China: Overview, achievements, and outlook. J. Nat. Hazards 2018, 92, 727–740. [Google Scholar] [CrossRef]
  31. Costache, R. Flash-Flood Potential Assessment in the Upper and Middle Sector of Prahova River Catchment (Romania). A Comparative Approach between Four Hybrid Models. Sci. Total Environ. 2019, 659, 1115–1134. [Google Scholar] [CrossRef]
  32. Abuzied, S.; Yuan, M.; Ibrahim, S.; Kaiser, M.; Saleem, T. Geospatial risk assessment of flash floods in Nuweiba area, Egypt. J. Arid. Environ. 2016, 133, 54–72. [Google Scholar] [CrossRef]
  33. Band, S.S.; Janizadeh, S.; Chandra Pal, S.; Saha, A.; Chakrabortty, R.; Melesse, A.M.; Mosavi, A. Flash Flood Susceptibility Modeling Using New Approaches of Hybrid and Ensemble Tree-Based Machine Learning Algorithms. Remote Sens. 2020, 12, 3568. [Google Scholar] [CrossRef]
  34. Ngo, P.; Pham, T.D.; Nhu, V.H.; Le, T.T.; Tran, D.A.; Phan, D.C.; Hoa, P.V.; Amaro-Mellado, J.L.; Bui, D.T. A novel hybrid quantum-PSO and credal decision tree ensemble for tropical cyclone induced flash flood susceptibility mapping with geospatial data. J. Hydrol. 2020, 596, 125682. [Google Scholar] [CrossRef]
  35. Nasir, M.J.; Iqbal, J.; Ahmad, W. Flash flood risk modeling of swat river sub-watershed: A comparative analysis of morphometric ranking approach and El-Shamy approach. J. Arab. J. Geosci. 2020, 13, 1082. [Google Scholar] [CrossRef]
  36. Pham, B.T.; Phong, T.V.; Nguyen, H.D.; Qi, C.; Al-Ansari, N.; Amini, A.; Ho, L.S.; Tuyen, T.T.; Yen, H.P.H.; Ly, H.B.; et al. A Comparative Study of Kernel Logistic Regression, Radial Basis Function Classifier, Multinomial Naïve Bayes, and Logistic Model Tree for Flash Flood Susceptibility Mapping. Water 2020, 12, 239. [Google Scholar] [CrossRef] [Green Version]
  37. Wu, Z.; Bhattacharya, B.; Xie, P.; Zevenbergen, C. Improving flash flood forecasting using a frequentist approach to identify rainfall thresholds for flash flood occurrence. Stoch. Environ. Res. Risk Assess. 2022. [Google Scholar] [CrossRef]
  38. Clark, R.A.; Gourley, J.J.; Flamig, Z.L.; Hong, Y.; Clark, E. CONUS-wide evaluation of national weather service flash flood guidance products. Weather Forecast. 2014, 29, 377–392. [Google Scholar] [CrossRef] [Green Version]
  39. Bournas, A.; Baltas, E. Investigation of the Gridded Flash Flood Guidance in a Peri-Urban Basin in Greater Athens area, Greece. J. Hydrol. 2022, 610, 127820. [Google Scholar] [CrossRef]
  40. Adnan, M.S.G.; Dewan, A.; Zannat, K.E.; Abdullah, A.M. The use of watershed geomorphic data in flash flood susceptibility zoning: A case study of the Karnaphuli and Sangu river basins of Bangladesh. J. Nat. Hazards 2019, 99, 425–448. [Google Scholar] [CrossRef]
  41. Ha, H.; Luu, C.; Bui, Q.D.; Pham, D.H.; Hoang, T.; Nguyen, V.P.; Vu, M.T.; Pham, B.T. Flash flood susceptibility prediction mapping for a road network using hybrid machine learning models. Nat. Hazards 2021, 109, 1247–1270. [Google Scholar] [CrossRef]
  42. Khosravi, K.; Pourghasemi, H.R.; Chapi, K.; Bahri, M. Flash flood susceptibility analysis and its mapping using different bivariate models in Iran: A comparison between Shannon’s entropy, statistical index, and weighting factor models. Environ. Monit. Assess. 2016, 188, 656. [Google Scholar] [CrossRef]
  43. Mahmood, S.; Rahman, A.U. Flash flood susceptibility modelling using geomorphometric approach in the Ushairy Basin, eastern Hindu Kush. J. Earth Syst. Sci. 2019, 128, 97. [Google Scholar] [CrossRef] [Green Version]
  44. Cao, Y.; Jia, H.; Xiong, J.; Cheng, W.; Li, K.; Pang, Q.; Yong, Z. Flash Flood Susceptibility Assessment Based on Geodetector, Certainty Factor, and Logistic Regression Analyses in Fujian Province, China. ISPRS Int. J. Geo-Inf. 2020, 9, 748. [Google Scholar] [CrossRef]
  45. Pham, B.T.; Avand, M.; Janizadeh, S.; Phong, T.V.; Al-Ansari, N.; Ho, L.S.; Das, S.; Le, H.V.; Amini, A.; Bozchaloei, S.K.; et al. GIS Based Hybrid Computational Approaches for Flash Flood Susceptibility Assessment. Water 2020, 12, 683. [Google Scholar] [CrossRef]
  46. Saber, M.; Boulmaiz, T.; Guermoui, M.; Abdrado, K.I.; Kantoush, S.A.; Sumi, T.; Boutaghane, H.; Nohara, D.; Mabrouk, E. Examining LightGBM and CatBoost models for wadi flash flood susceptibility prediction. Geocarto Int. 2021. [Google Scholar] [CrossRef]
  47. Costache, R.; Bui, D.T. Identification of areas prone to flash-flood phenomena using multiple-criteria decision-making, bivariate statistics, machine learning and their ensembles. Sci. Total Environ. 2020, 712, 136492. [Google Scholar] [CrossRef]
  48. Costache, R.; Pham, Q.B.; Sharifi, E.; Linh, N.T.T.; Abba, S.I.; Vojtek, M.; Vojteková, J.; Nhi, P.T.T.; Khoi, D.N. Flash-Flood Susceptibility Assessment Using Multi-Criteria Decision Making and Machine Learning Supported by Remote Sensing and GIS Techniques. Remote Sens. 2020, 12, 106. [Google Scholar] [CrossRef] [Green Version]
  49. Janizadeh, S.; Avand, M.; Jaafari, A.; Phong, T.V.; Bayat, M.; Ahmadisharaf, E.; Prakash, I.; Pham, B.T.; Lee, S. Prediction Success of Machine Learning Methods for Flash Flood Susceptibility Mapping in the Tafresh Watershed, Iran. Sustainability 2019, 11, 5426. [Google Scholar] [CrossRef] [Green Version]
  50. Nlansour, R.; El Ghali, A. Digital mapping of the risk of flooding in the North-East of Tunisia by the frequency ratio method and the statistical index. Rev. Int. Geomat. 2020, 29, 339–360. [Google Scholar]
  51. Darabi, H.; Haghighi, A.T.; Rahmati, O.; Shahrood, A.J.; Rouzbeh, S.; Pradhan, B.; Bui, D.T. A hybridized model based on neural network and swarm intelligence-grey wolf algorithm for spatial prediction of urban flood-inundation. J. Hydrol. 2021, 603, 126854. [Google Scholar] [CrossRef]
  52. Costache, R.D.; Arabameri, A.; Moayedi, H.; Pham, Q.B.; Santosh, M.; Nguyen, H.; Pandey, M.; Pham, B.T. Flash-Flood Potential Index estimation using Fuzzy Logic combined with Deep Learning Neural Network, Nave Bayes, XGBoost and Classification and Regression Tree. J. Geocarto Int. 2021, 37, 6780–6807. [Google Scholar] [CrossRef]
  53. Liu, C.; Guo, L.; Ye, L.; Zhang, S.; Zhao, Y.; Song, T. A review of advances in China’s flash flood early-warning system. Nat. Hazards 2018, 92, 619–634. [Google Scholar] [CrossRef] [Green Version]
  54. Saleh, A.; Yuzir, A.; Abustan, I. Flash flood susceptibility modelling: A review. IOP Conf. Ser. Mater. Sci. Eng. 2020, 712, 012005. [Google Scholar] [CrossRef]
  55. Ali, K.; Bajracharyar, R.M.; Raut, N. Advances and challenges in flash flood risk assessment: A review. J. Geogr. Nat. Disasters 2017, 7, 2. [Google Scholar] [CrossRef] [Green Version]
  56. Salman, A.M.; Li, Y. Flood risk assessment, future trend modeling, and risk communication: A review of ongoing research. Nat. Hazards Rev. 2018, 19, 04018011. [Google Scholar] [CrossRef]
  57. Hapuarachchi, H.A.P.; Wang, Q.J.; Pagano, T.C. A review of advances in flash flood forecasting. Hydrol. Process. 2011, 25, 2771–2784. [Google Scholar] [CrossRef]
  58. De Moel, H.; Jongman, B.; Kreibich, H.; Merz, B.; Penning-Rowsell, E.; Ward, P.J. Flood risk assessments at different spatial scales. Mitig. Adapt. Strategy Glob. Change 2015, 20, 865–890. [Google Scholar] [CrossRef] [PubMed] [Green Version]
  59. Hakim, W.L.; Lee, C.-W. A review on remote sensing and GIS applications to monitor natural disasters in Indonesia. Korean J. Remote Sens. 2020, 36, 1303–1322. [Google Scholar]
  60. Li, W.; Zhao, Y. Bibliometric analysis of global environmental assessment research in a 20-year period. Environ. Impact Assess. Rev. 2015, 50, 158–166. [Google Scholar] [CrossRef]
  61. Wang, X.; Zhao, W.; Wang, Y.; Zhao, Q.; Yang, X.; Su, K.; Gu, D. Visual Analysis on Information Theory and Science of Complexity Approaches in Healthcare Research. Entropy 2020, 22, 109. [Google Scholar] [CrossRef] [Green Version]
  62. Pritchard, J. Statistical-Bibliography or Bibliometrics? J. Doc. 1969, 25, 348–349. [Google Scholar]
  63. Ni, Y.; Zhang, T.; Xu, L.; Han, P. Research on the Evolution Path of Sentiment Analysis Technology Based on Bibliometrics. In Proceedings of the 2021 International Conference on Artificial Intelligence, Big Data and Algorithms (CAIBDA), Xi’an, China, 28–30 May 2021; pp. 150–157. [Google Scholar]
  64. Ye, M.; Yang, L.; Lu, J. Research on Information Management of Big Data Based on Bibliometrics. In Proceedings of the 2019 IEEE 3rd Advanced Information Management, Communicates, Electronic and Automation Control Conference (IMCEC), Chongqing, China, 11–13 October 2019; pp. 1465–1469. [Google Scholar]
  65. Huang, L.; Wang, X.; Wu, F.; Li, Q. Analysis on Evolution and Frontier Research of Selective Catalyst Reduction Technology for Diesel Engine Based on Bibliometrics. In Proceedings of the 2017 Portland International Conference on Management of Engineering and Technology (PICMET), Portland, OR, USA, 9–13 July 2017; p. 17413554. [Google Scholar]
  66. Zuccala, A. Inciting the metric oriented humanist: Teaching bibliometrics in a faculty of humanities. J. Educ. Inf. 2016, 32, 149–164. [Google Scholar] [CrossRef] [Green Version]
  67. Noyons, E.C.M.; Moed, H.F.; Luwel, M. Combining mapping and citation analysis for evaluative bibliometric purposes. J. Am. Soc. Inf. Sci. 1999, 50, 115–131. [Google Scholar] [CrossRef]
  68. Herrera-Viedma, E.; Martinez, M.; Herrera, M. Bibliometric tools for discovering information in database. In Trends in Applied Knowledge-Based Systems and Data Science, Proceedings of the 29th International Conference on Industrial, Engineering and Other Applications of Applied Intelligent Systems, Morioka, Japan, 2–4 August 2016; Fujita, H., Ali, M., Selamat, A., Sasaki, J., Kurematsu, M., Eds.; Springer: Cham, Switzerland, 2016; Volume 9799, pp. 193–203. [Google Scholar]
  69. Che, S.; Kamphuis, P.; Zhang, S.; Zhao, X.; Kim, J.H. A Visualization Analysis of Crisis and Risk Communication Research Using CiteSpace. Int. J. Environ. Res. Public Health 2022, 19, 2923. [Google Scholar] [CrossRef] [PubMed]
  70. Chen, C. CiteSpace II: Detecting and visualizing emerging trends and transient patterns in scientific literature. J. Am. Soc. Inf. Sci. Technol. 2006, 57, 359–377. [Google Scholar] [CrossRef] [Green Version]
  71. Chen, C. Science Mapping: A Systematic Review of the Literature. J. Data Inf. Sci. 2017, 2, 1–40. [Google Scholar] [CrossRef] [Green Version]
  72. Cui, Y.; Mou, J.; Liu, Y. Knowledge mapping of social commerce research: A visual analysis using CiteSpace. Electron. Commer. Res. 2018, 18, 837–868. [Google Scholar] [CrossRef]
  73. Srivastava, P.; Jovane, L. Misinterpreting proxy data for paleoclimate signals: A comment on Shukla et al. 2020. J. Holocene 2020, 30, 1866–1873. [Google Scholar] [CrossRef]
  74. Costache, R.; Hong, H.; Pham, Q.B. Comparative Assessment of the Flash-Flood Potential within Small Mountain Catchments Using Bivariate Statistics and Their Novel Hybrid Integration with Machine Learning Models. Sci. Total Environ. 2020, 711, 134514. [Google Scholar] [CrossRef]
  75. Mahmood, S.; Rahman, A. Flash flood susceptibility modeling using geo-morphometric and hydrological approaches in Panjkora Basin, Eastern Hindu Kush, Pakistan. Environ. Earth Sci. 2019, 78, 43. [Google Scholar] [CrossRef]
  76. Bui, D.T.; Tsangaratos, P.; Ngo, P.T.T.; Pham, T.D.; Pham, B.T. Flash Flood Susceptibility Modeling Using an Optimized Fuzzy Rule Based Feature Selection Technique and Tree Based Ensemble Methods. Sci. Total Environ. 2019, 668, 1038–1054. [Google Scholar] [CrossRef]
  77. Franceschinis, C.; Thiene, M.; Di Baldassarre, G.; Mondino, E.; Scolobig, A.; Borga, M. Heterogeneity in flood risk awareness: A longitudinal, latent class model approach. J. Hydrol. 2021, 599, 126255. [Google Scholar] [CrossRef]
  78. Khosravi, K.; Pham, B.T.; Chapi, K.; Shirzadi, A.; Shahabi, H.; Revhaug, I.; Prakash, I.; Tien Bui, D.; Pham, B.T.; Chapi, K.; et al. A comparative assessment of decision trees algorithms for flash flood susceptibility modeling at Haraz watershed, northern Iran. Sci. Total Environ. 2018, 627, 744–755. [Google Scholar] [CrossRef] [PubMed]
  79. De Moel, H.; Aerts, J.C.J.H. Effect of uncertainty in land use, damage models and inundation depth on flood damage estimates. Nat. Hazards 2011, 58, 407–425. [Google Scholar] [CrossRef] [Green Version]
  80. Hong, H.; Panahi, M.; Shirzadi, A.; Ma, T.; Liu, J.; Zhu, A.X.; Chen, W.; Kougias, I.; Kazakis, N.; Panahi, M.; et al. Flood susceptibility assessment in Hengfeng area coupling adaptive neuro-fuzzy inference system with genetic algorithm and differential evolution. Sci. Total Environ. 2018, 621, 1124–1141. [Google Scholar] [CrossRef] [PubMed]
  81. Rahmati, O.; Zeinivand, H.; Besharat, M. Flood hazard zoning in Yasooj region, Iran, using GIS and multi-criteria decision analysis. Geomat. Nat. Hazards Risk 2016, 7, 1000–1017. [Google Scholar] [CrossRef] [Green Version]
  82. Collier, C.G. Flash Flood Forecasting: What Are the Limits of Predictability? Q. J. R. Meteorol. Soc. 2007, 133, 3–23. [Google Scholar] [CrossRef]
  83. Elmahdy, S.; Ali, T.; Mohamed, M. Flash Flood Susceptibility Modeling and Magnitude Index Using Machine Learning and Geohydrological Models: A Modified Hybrid Approach. J. Remote Sens. 2020, 12, 2695. [Google Scholar] [CrossRef]
  84. Costache, R.; Ngo, P.T.T.; Bui, D.T. Novel Ensembles of Deep Learning Neural Network and Statistical Learning for Flash-Flood Susceptibility Mapping. Water 2020, 12, 1549. [Google Scholar] [CrossRef]
  85. Costache, R.; Barbulescu, A.; Pham, Q.B. Integrated Framework for Detecting the Areas Prone to Flooding Generated by Flash-Floods in Small River Catchments. Water 2021, 13, 758. [Google Scholar] [CrossRef]
  86. Zaharia, L.; Costache, R.; Prăvălie, R.; Ioana-Toroimac, G. Mapping flood and flooding potential indices: A methodological approach to identifying areas susceptible to flood and flooding risk. Case study: The Prahova catchment (Romania). Front. Earth Sci. 2017, 11, 229–247. [Google Scholar] [CrossRef]
  87. Costache, R.; Hong, H.; Wang, Y. Identification of torrential valleys using GIS and a novel hybrid integration of artificial intelligence, machine learning and bivariate statistics. Catena 2019, 183, 104179. [Google Scholar] [CrossRef]
  88. Costache, R.; Pham, Q.B.; Arabameri, A.; Diaconu, D.C.; Costache, I.; Crăciun, A.; Ciobotaru, N.; Pandey, M.; Arora, A.; Ali, S.A.; et al. Flash-flood propagation susceptibility estimation using weights of evidence and their novel ensembles with multicriteria decision making and machine learning. Geocarto Int. 2021. [Google Scholar] [CrossRef]
  89. Bui, D.T.; Ngo, P.T.T.; Pham, T.D.; Jaafari, A.; Minh, N.Q.; Hoa, P.V.; Samui, P. A novel hybrid approach based on a swarm intelligence optimized extreme learning machine for flash flood susceptibility mapping. Catena 2019, 179, 184–196. [Google Scholar] [CrossRef]
  90. Bui, D.T.; Hoang, N.D.; Pham, T.D.; Ngo, P.T.T.; Hoa, P.V.; Minh, N.Q.; Tran, X.T.; Samui, P. A new intelligence approach based on GIS-based Multivariate Adaptive Regression Splines and metaheuristic optimization for predicting flash flood susceptible areas at high-frequency tropical typhoon area. J. Hydrol. 2019, 575, 314–326. [Google Scholar]
  91. Ngo, P.T.T.; Hoang, N.D.; Pradhan, B.; Nguyen, Q.K.; Tran, X.T.; Nguyen, Q.M.; Nguyen, V.N.; Samui, P.; Tien Bui, D. A Novel Hybrid Swarm Optimized Multilayer Neural Network for Spatial Prediction of Flash Floods in Tropical Areas Using Sentinel-1 SAR Imagery and Geospatial Data. Sensors 2018, 18, 3704. [Google Scholar] [CrossRef] [Green Version]
  92. Ma, M.; Zhang, J.; Su, H.; Wang, D.; Wang, Z. Update of Early Warning Indicators of Flash Floods: A Case Study of Hunjiang District, Northeastern China. Water 2019, 11, 314. [Google Scholar] [CrossRef] [Green Version]
  93. Wang, Y.; Liu, R.; Guo, L.; Tian, J.; Zhang, X.; Ding, L.; Wang, C.; Shang, Y. Forecasting and Providing Warnings of Flash Floods for Ungauged Mountainous Areas Based on a Distributed Hydrological Model. Water 2017, 9, 776. [Google Scholar] [CrossRef]
  94. Zhai, X.; Guo, L.; Liu, R.; Zhang, Y. Rainfall threshold determination for flash flood warning in mountainous catchments with consideration of antecedent soil moisture and rainfall pattern. Nat. Hazards 2018, 94, 605–625. [Google Scholar] [CrossRef]
  95. Liu, C.J.; Ma, Q.; Zhang, X.; Li, C.; Li, Q.; Gourbesville, P.; Guo, L.; Ding, L. Identification and quantitative analysis of flash flood risks for small catchments in China: A new operational modelling approach. LHB-Hydrosci. J. 2022, 108, 2019561. [Google Scholar] [CrossRef]
  96. Ngo, P.T.T.; Pham, T.D.; Hoang, N.D.; Tran, D.A.; Amiri, M.; Le, T.T.; Hoa, P.V.; Van Bui, P.; Nhu, V.H.; Bui, D.T. A new hybrid equilibrium optimized SysFor based geospatial data mining for tropical storm-induced flash flood susceptible mapping. J. Environ. Manag. 2021, 280, 111858. [Google Scholar] [CrossRef]
  97. Bui, Q.T.; Nguyen, Q.H.; Nguyen, X.L.; Pham, V.D.; Nguyen, H.D.; Pham, V.M. Verification of novel integrations of swarm intelligence algorithms into deep learning neural network for flood susceptibility mapping. J. Hydrol. 2020, 581, 124379. [Google Scholar] [CrossRef]
  98. Pande, R.K. Flash flood disasters in Uttarakhand. J. Disaster Prev. Manag. 2010, 19, 565–570. [Google Scholar] [CrossRef]
  99. Singh, G.; Pandey, A. Flash flood vulnerability assessment and zonation through an integrated approach in the Upper Ganga Basin of the Northwest Himalayan region in Uttarakhand. Int. J. Disaster Risk Reduct. 2021, 66, 102573. [Google Scholar] [CrossRef]
  100. Singh, G.; Pandey, A. Hybrid ensemble modeling for flash flood potential assessment and susceptibility analysis of a Himalayan river catchment. Geocarto Int. 2021. [Google Scholar] [CrossRef]
  101. Bui, D.T.; Hoang, N.D.; Martínez-Álvarez, F.; Ngo, P.T.T.; Hoa, P.V.; Pham, T.D.; Costache, R. A novel deep learning neural network approach for predicting flash flood susceptibility: A case study at a high frequency tropical storm area. Sci. Total Environ. 2020, 701, 134413. [Google Scholar]
  102. Lindell, M.K.; Arlikatti, S.; Huang, S.K. Immediate behavioral response to the June 17, 2013 flash floods in Uttarakhand, North India. Int. J. Disaster Risk Reduct. 2019, 34, 129–146. [Google Scholar] [CrossRef]
  103. Gazni, T.A. An international comparison of journal publishing and citing behaviours. J. Informetr. 2012, 6, 516–531. [Google Scholar]
  104. Kim, E.S.; Choi, H.I. Estimation of the relative severity of floods in small ungauged catchments for preliminary observation on Flash flood preparedness: A case study in Korea. Int. J. Environ. Res. Public Health 2012, 9, 1507–1522. [Google Scholar] [CrossRef] [Green Version]
  105. Shirzadi, A.; Asadi, S.; Shahabi, H.; Ronoud, S.; Clague, J.J.; Khosravi, K.; Pham, B.T.; Ahmad, B.B.; Bui, D.T. A novel ensemble learning based on Bayesian Belief Network coupled with an extreme learning machine for flash flood susceptibility mapping. Eng. Appl. Artif. Intell. 2020, 96, 103971. [Google Scholar] [CrossRef]
  106. Nhu, V.H.; Thi Ngo, P.T.; Pham, T.D.; Dou, J.; Song, X.; Hoang, N.D.; Tran, D.A.; Cao, D.P.; Aydilek, İ.B.; Amiri, M.; et al. A New Hybrid Firefly–PSO Optimized Random Subspace Tree Intelligence for Torrential Rainfall-Induced Flash Flood Susceptible Mapping. Remote Sens. 2020, 12, 2688. [Google Scholar] [CrossRef]
  107. Ettinger, S.; Mounaud, L.; Magill, C.; Yao-Lafourcade, A.F.; Thouret, J.C.; Manville, V.; Negulescu, C.; Zuccaro, G.; De Gregorio, D.; Nardone, S. Building vulnerability to hydro-geomorphic hazards: Estimating damage probability from qualitative vulnerability assessment using logistic regression. J. Hydrol. 2016, 541, 563–581. [Google Scholar] [CrossRef]
  108. Trigila, A.; Iadanza, C.; Esposito, C.; Scarascia-Mugnozza, G. Comparison of Logistic Regression and Random Forests techniques for shallow landslide susceptibility assessment in Giampilieri (NE Sicily, Italy). Geomorphology 2015, 249, 119–136. [Google Scholar] [CrossRef]
  109. Yaseen, A.; Lu, J.; Chen, X. Flood susceptibility mapping in an arid region of Pakistan through ensemble machine learning model. Stoch. Environ. Res. Risk Assess. 2022, 36, 3041–3061. [Google Scholar] [CrossRef]
  110. Giovannettone, J.; Copenhaver, T.; Burns, M.; Choquette, S. A Statistical Approach to Mapping Flood Susceptibility in the Lower Connecticut River Valley Region. Water Resour. Res. 2018, 54, 7603–7618. [Google Scholar] [CrossRef]
  111. Lee, S.; Pradhan, B. Landslide hazard mapping at Selangor, Malaysia using frequency ratio and logistic regression models. J. Landslides 2007, 4, 33–41. [Google Scholar] [CrossRef]
  112. Oh, H.J.; Lee, S.; Soedradjat, G.M. Quantitative landslide susceptibility mapping at Pemalang area, Indonesia. J. Environ. Geol. 2010, 60, 1317–1328. [Google Scholar] [CrossRef]
  113. Sharma, S.; Mahajan, A.K. A comparative assessment of information value, frequency ratio and analytical hierarchy process models for landslide susceptibility mapping of a Himalayan watershed, India. J. Bull. Eng. Geol. Environ. 2018, 78, 2431–2448. [Google Scholar] [CrossRef]
  114. Aristizábal, E.; Arango Carmona, M.I.; Gómez, F.J.; López Castro, S.M.; De Villeros Severiche, A.; Riaño Quintanilla, A.F. Hazard Analysis of Hydrometeorological Concatenated Processes in the Colombian Andes. In Advances in Natural Hazards and Hydrological Risks: Meeting the Challenge; Advances in Science, Technology & Innovation; Springer: Cham, Switzerland, 2020; Volume 12, pp. 7–10. [Google Scholar]
  115. Hungr, O.; Leroueil, S.; Picarelli, L. The Varnes classification of landslide types, an update. Landslides 2014, 11, 167–194. [Google Scholar] [CrossRef]
  116. Stolle, A.; Langer, M.; Bloethe, J.H.; Korup, O. On predicting debris flows in arid mountain belts. J. Glob. Planet. Change 2015, 126, 1–13. [Google Scholar] [CrossRef]
  117. Santangelo, N.; Forte, G.; De Falco, M.; Chirico, G.B.; Santo, A. New insights on rainfall triggering flow-like landslides and flash floods in Campania (Southern Italy). Landslides 2021, 18, 2923–2933. [Google Scholar] [CrossRef]
  118. Mei, Y.; Anagnostou, E.N.; Nikolopoulos, E.I.; Borga, M. Error Analysis of Satellite Precipitation Products in Mountainous Basins. J. Hydrometeorol. 2014, 15, 1778–1793. [Google Scholar] [CrossRef]
  119. Karagiorgos, K.; Thaler, T.; Heiser, M.; Hübl, J.; Fuchs, S. Integrated flash flood vulnerability assessment: Insights from East Attica, Greece. J. Hydrol. 2016, 541, 553–562. [Google Scholar] [CrossRef]
  120. White, H.D. Combining bibliometrics, information retrieval, and relevance theory: Part 1: First examples of a synthesis. J. Am. Soc. Inf. Sci. Technol. 2007, 58, 536–559. [Google Scholar] [CrossRef]
  121. Tehrany, M.S.; Kumar, L.; Shabani, F. A novel GIS-based ensemble technique for flood susceptibility mapping using evidential belief function and support vector machine: Brisbane, Australia. PeerJ 2019, 7, e7653. [Google Scholar] [CrossRef] [PubMed]
  122. Tehrany, M.S.; Jones, S.; Shabani, F. Identifying the essential flood conditioning factors for flood prone area mapping using machine learning techniques. Catena 2019, 175, 174–192. [Google Scholar] [CrossRef]
  123. Tehrany, M.S.; Pradhan, B.; Jebur, M.N. Flood Susceptibility Analysis and Its Verification Using a Novel Ensemble Support Vector Machine and Frequency Ratio Method. Stoch. Environ. Res. Risk Assess. 2015, 29, 1149–1165. [Google Scholar] [CrossRef]
  124. Tehrany, M.S.; Lee, M.J.; Pradhan, B.; Jebur, M.N.; Lee, S. Flood susceptibility mapping using integrated bivariate and multivariate statistical models. Environ. Earth Sci. 2014, 72, 4001–4015. [Google Scholar] [CrossRef]
  125. Arabameri, A.; Saha, S.; Chen, W.; Roy, J.; Pradhan, B.; Bui, D.T. Flash flood susceptibility modelling using functional tree and hybrid ensemble techniques. J. Hydrol. 2020, 587, 125007. [Google Scholar] [CrossRef]
  126. Collaborators, I.P. Global, regional, and national incidence, prevalence, and years lived with disability for 310 diseases and injuries, 1990–2015: A systematic analysis for the Global Burden of Disease Study 2015. Lancet 2016, 388, 1545–1602. [Google Scholar]
  127. Afshin, A.; Sur, P.J.; Fay, K.A.; Cornaby, L.; Ferrara, G.; Salama, J.S.; Mullany, E.C.; Abate, K.H.; Abbafati, C.; Abebe, Z.; et al. Health effects of dietary risks in 195 countries, 1990–2017: A systematic analysis for the Global Burden of Disease Study 2017. Lancet 2019, 393, 1958–1972. [Google Scholar] [CrossRef]
  128. Zeng, Z.; Tang, G.; Long, D.; Zeng, C.; Ma, M.H.; Hong, Y.; Xu, H.; Xu, J. A cascading flash flood guidance system: Development and application in Yunnan Province, China. Nat Hazards 2016, 84, 2071–2093. [Google Scholar] [CrossRef]
  129. Waqas, H.; Lu, L.; Tariq, A.; Li, Q.; Baqa, M.F.; Xing, J.; Sajjad, A. Flash Flood Susceptibility Assessment and Zonation Using an Integrating Analytic Hierarchy Process and Frequency Ratio Model for the Chitral District, Khyber Pakhtunkhwa, Pakistan. Water 2021, 13, 1650. [Google Scholar] [CrossRef]
  130. Afreen, M.; Haq, F.; Mukhtar, Z. Flood susceptibility analysis of the Panjkora Valley Northern Pakistan, using frequencyratio approach. Int. J. Disaster Resil. Built Environ. 2022, 13, 601–614. [Google Scholar] [CrossRef]
  131. Saleh, A.; Yuzir, A.; Sabtu, N.; Abujayyab, S.K.M.; Bunmi, M.R.; Pham, Q.B. Flash flood susceptibility mapping in urban area using genetic algorithm and ensemble method. Geocarto Int. 2022. [Google Scholar] [CrossRef]
  132. Yu, C.; Chen, J. Application of a GIS-Based Slope Unit Method for Landslide Susceptibility Mapping in Helong City: Comparative Assessment of ICM, AHP, and RF Model. Symmetry 2020, 12, 1848. [Google Scholar] [CrossRef]
  133. El-Fakharany, M.A.; Hegazy, M.N.; Mansour, N.M.; Abdo, A.M. Flash flood hazard assessment and prioritization of sub-watersheds in Heliopolis basin, East Cairo, Egypt. Arab J Geosci. 2021, 14, 1693. [Google Scholar] [CrossRef]
  134. Karmokar, S.; De, M. Flash flood risk assessment for drainage basins in the Himalayan foreland of Jalpaiguri and Darjeeling Districts, West Bengal. Model. Earth Syst. Environ. 2020, 6, 2263–2289. [Google Scholar] [CrossRef]
  135. Tehrany, M.S.; Pradhan, B.; Jebur, M.N. Spatial prediction of flood susceptible areas using rule based decision tree (DT) and a novel ensemble bivariate and multivariate statistical models in GIS. J. Hydrol. 2013, 504, 69–79. [Google Scholar]
  136. Alaa, M.A.A.; Shamsuddin, S.; Ali, K.A.A. A GIS-based integration of catastrophe theory and analytical hierarchy process for mapping flood susceptibility: A case study of Teeb area, Southern Iraq. Environ. Earth Sci. 2016, 75, 687. [Google Scholar]
  137. Magnini, A.; Lombardi, M.; Persiano, S.; Tirri, A.; Conti, F.L.; Castellarin, A. Machine-Learning blends of geomorphic descriptors: Value and limitations for flood hazard assessment across large floodplains. J. Nat. Hazards Earth Syst. Sci. 2022, 22, 1469–1486. [Google Scholar] [CrossRef]
  138. Dejen, A.; Soni, S. Flash flood risk assessment using geospatial technology in Shewa Robit town, Ethiopia. Model. Earth Syst. Environ. 2021, 7, 2599–2617. [Google Scholar] [CrossRef]
  139. Chakrabortty, R.; Pal, S.C.; Rezaie, F.; Arabameri, A.; Lee, S.; Roy, P.; Saha, A.; Chowdhuri, I.; Moayedi, H. Flash-Flood Hazard Susceptibility Mapping in Kangsabati River Basin, India. Geocarto Int. 2022, 37, 6713–6735. [Google Scholar] [CrossRef]
  140. Cao, C.; Xu, P.; Wang, Y.; Chen, J.; Zheng, L.; Niu, C. Flash Flood Hazard Susceptibility Mapping Using Frequency Ratio and Statistical Index Methods in Coalmine Subsidence Areas. Sustainability 2016, 8, 948. [Google Scholar] [CrossRef] [Green Version]
  141. Huang, W.; Cao, Z.X.; Qi, W.J.; Pender, G.; Zhao, K. Full 2D hydrodynamic modelling of rainfall-induced flash floods. J. Mt. Sci. 2015, 12, 1203–1218. [Google Scholar] [CrossRef]
  142. Liu, J.; Wang, J.; Xiong, J.; Cheng, W.; Sun, H.; Yong, Z.; Wang, N. Hybrid Models Incorporating Bivariate Statistics and Machine Learning Methods for Flash Flood Susceptibility Assessment Based on Remote Sensing Datasets. Remote Sens. 2021, 13, 4945. [Google Scholar] [CrossRef]
  143. Ding, L.S.; Ma, L.; Li, L.G.; Liu, C.; Li, N.W.; Yang, Z.L.; Yao, Y.Z.; Lu, H. A Survey of Remote Sensing and Geographic Infor mation System Applications for Flash Floods. Remote Sens. 2021, 13, 1818. [Google Scholar] [CrossRef]
  144. Rahman, M.; Ningsheng, C.; Islam, M.M.; Mahmud, G.I.; Pourghasemi, H.R.; Alam, M.; Rahim, M.A.; Baig, M.A.; Bhattacharjee, A.; Dewan, A. Development of flood hazard map and emergency relief operation system using hydrodynamic modeling and machine learning algorithm. J. Clean. Prod. 2021, 311, 127594. [Google Scholar] [CrossRef]
  145. Zhang, M.; Dai, Z.; Bouma, T.J.; Bricker, J.; Townend, I.; Wen, J.; Zhao, T.; Cai, H. Tidal-flat reclamation aggravates potential risk from storm impacts. Coast. Eng. 2021, 166, 103868. [Google Scholar] [CrossRef]
  146. Mi, J.; Zhang, M.; Zhu, Z.; Vuik, V.; Wen, J.; Gao, H.; Bouma, T.J. Morphological Wave Attenuation of the Nature-Based Flood Defense: A Case Study from Chongming Dongtan Shoal, China. J. Sci. Total Environ. 2022, 831, 154813. [Google Scholar] [CrossRef]
  147. Zhao, G.; Pang, B.; Xu, Z.; Yue, J.; Tu, T.; Pang, B.; Xu, Z.; Yue, J.; Tu, T. Mapping flood susceptibility in mountainous areas on a national scale in China. Sci. Total Environ. 2018, 615, 1133–1142. [Google Scholar] [CrossRef]
  148. Abedi, R.; Costache, R.; Shafizadeh-Moghadam, H.; Pham, Q.B. Flash-flood susceptibility mapping based on XGBoost, random forest and boosted regression trees. Geocarto Int. 2022, 37, 5479–5496. [Google Scholar] [CrossRef]
  149. Costache, R.; Arabameri, A.; Blaschke, T.; Pham, Q.B.; Pham, B.T.; Pandey, M.; Arora, A.; Linh, N.T.T.; Costache, I. Flash-Flood Potential Mapping Using Deep Learning, Alternating Decision Trees and Data Provided by Remote Sensing Sensors. Sensors 2021, 21, 280. [Google Scholar] [CrossRef] [PubMed]
  150. Costache, R. Flash-flood Potential Index mapping using weights of evidence, decision Trees models and their novel hybrid integration. J. Stoch. Environ. Res. Risk Assess. 2019, 33, 1375–1402. [Google Scholar] [CrossRef]
  151. Zhang, R.; Chen, Y.; Zhang, X.; Ma, Q.; Ren, L. Mapping homogeneous regions for flash floods using machine learning: A case study in Jiangxi province, China. Int. J. Appl. Earth Obs. Geoinf. 2020, 108, 102717. [Google Scholar] [CrossRef]
  152. Kruczkiewicz, A.; Bucherie, A.; Ayala, F.; Hultquist, C.; Vergara, H.; Mason, S.; Bazo, J.; de Sherbinin, A. Development of a Flash Flood Confidence Index from Disaster Reports and Geophysical Susceptibility. Remote Sens. 2021, 13, 2764. [Google Scholar] [CrossRef]
  153. Archer, D.; O’Donnell, G.; Lamb, R.; Warren, S.; Fowler, H.J. Historical Flash Floods in England: New Regional Chronologies and Database. J. Flood Risk Manag. 2019, 12, e12526. [Google Scholar] [CrossRef]
  154. Kaiser, M.; Günnemann, S.; Disse, M. Providing guidance on efficient flash flood documentation: An application based approach. J Hydrol. 2020, 581, 124466. [Google Scholar] [CrossRef]
  155. Muhamad, N.; Arshad, S.; Pereira, J.J. Exposure Elements in Disaster Databases and Availability for Local Scale Application: Case Study of Kuala Lumpur, Malaysia. Front. Earth Sci. 2021, 9, 616246. [Google Scholar] [CrossRef]
  156. Su, M.; Ying, Z.; Yan, H.; Chen, Q.; Chen, S.; Chen, Z.; Hong, X. The influence of landscape pattern on the risk of urban water-logging and flood disaster. Ecol. Indic. 2017, 92, 133–140. [Google Scholar] [CrossRef]
  157. Tian, Y.; Xiao, C.; Liu, Y.; Wu, L. Effects of Raster Resolution on Landslide Susceptibility Mapping: A Case Study of Shenzhen. Sci. China Ser. Technol. Sci. 2008, 51, 188–198. [Google Scholar] [CrossRef]
  158. Baran-Zgłobicka, B.; Godziszewska, D.; Zgłobicki, W. The Flash Floods Risk in the Local Spatial Planning (Case Study: Lublin Upland, E Poland). Resources 2021, 10, 14. [Google Scholar] [CrossRef]
  159. Ruidas, D.; Chakrabortty, R.; Islam, A.M.T.; Saha, A.; Pal, S.C. A novel hybrid of meta-optimization approach for flash flood-susceptibility assessment in a monsoon-dominated watershed, Eastern India. Environ. Earth Sci. 2022, 81, 145. [Google Scholar] [CrossRef]
  160. Lin, J.; He, X.; Lu, S.; Liu, D.; He, P. Investigating the influence of three-dimensional building configuration on urban pluvial flooding using random forest algorithm. Environ. Res. 2021, 196, 110438. [Google Scholar] [CrossRef] [PubMed]
  161. Hu, Q.; Zhu, Y.; Hu, H.; Guan, Z.; Qian, Z.; Yang, A. Multiple Kernel Learning with Maximum Inundation Extent from MODIS Imagery for Spatial Prediction of Flood Susceptibility. Water Resour. Manag. 2022, 36, 55–73. [Google Scholar] [CrossRef]
  162. Bellos, V.; Papageorgaki, I.; Kourtis, I.; Vangelis, H.; Kalogiros, I.; Tsakiris, G. Reconstruction of a flash flood event using a 2D hydrodynamic model under spatial and temporal variability of storm. Nat. Hazards 2020, 101, 711–726. [Google Scholar] [CrossRef]
Figure 1. Search process.
Remotesensing 14 05432 g001
Figure 3. Distribution diagram of core authors.
Remotesensing 14 05432 g003
Figure 4. Distribution diagram of number of publication of countries/regions.
Remotesensing 14 05432 g004
Figure 5. Top six journals.
Remotesensing 14 05432 g005
Figure 6. Institutions providing funds for more than five times.
Remotesensing 14 05432 g006
Figure 7. Frequency diagram of keywords.
Remotesensing 14 05432 g007
Figure 8. Top 25 keywords with the strongest citation bursts.
Remotesensing 14 05432 g008
Figure 9. Author co-citation network.
Remotesensing 14 05432 g009
Figure 10. Diagram of pennant figures of the top four cited authors. (a). Diagram of pennant figures of Tehrany. (b). Diagram of pennant figures of Bui. (c). Diagram of pennant figures of Khosravi. (d). Diagram of pennant figures of Pradhan.
Remotesensing 14 05432 g010
Figure 11. Author co-citation clustering.
Remotesensing 14 05432 g011
Figure 12. Co-operation network diagram of institutions for publishing documents.
Remotesensing 14 05432 g012
Table 1. Summary of previous reviews.
MethodCharacteristicsResearchContent
Time sequenceFacilitate understanding of the evolution of the research field.A review of advances in China’s flash flood early-warning system [53]This paper reviewed the three stages of China’s flash flood early-warning system.
Case studyEasy acquisition of key elements of the study. However, a large amount of data is needed to support the theory.Flash flood susceptibility modeling: a review [54]This paper summarized the modeling process of flash flood susceptibility by six researchers.
PRISMA methodologyA clear literature search process; Standardized document analysis process; Objective analysis results.Advances and challenges in flash flood risk assessment: A review [55]This paper used the PRIAMA method to search nearly 60 articles in the Google scholar database to analyze the methods, uncertainties and challenges in flash flood risk assessment.
Logical structureLogical; The review methodology includes step-by-step analysis of research links in the field of study and categorical summaries, etc.; Easily identify the problems facing the field of study.Flood risk assessment, future trend modeling, and risk communication: a review of ongoing research [56]This paper first reviewed the common approaches to flood risk assessment. With the impact of climate change, population, and urbanization, this paper focused on the application of climate change and population and economic growth in risk assessment.
A review of advances in flash flood forecasting [57]This paper used the logical structure of flash flood forecasting and reviewed the development of quantitative precipitation estimation (QPE) and quantitative precipitation forecasting (QPF), remote sensing data products, and flow forecasting models in flash flood forecasting and uncertainty estimation.
Flood risk assessments at different spatial scales [58]This paper summarized the study of methods, use of assessments, and uncertainty in risk assessment at macroscopic and microscopic scales.
A review on remote sensing and GIS applications to monitor natural disasters in Indonesia [59]This paper was based on the logic sequence of image acquisition, classification, and map generation.
Table 2. Characteristic analysis of representative documents.
TitleYearCite FrequencyCountry/RegionsKeywordsThe Research Content
Comparative assessment of the flash-flood potential within small mountain catchments using bivariate statistics and their novel hybrid integration with machine learning models [74]202050RomaniaBâsca Chiojdului catchment; Flash-flood potential index; Statistical index; Machine learning models; Ensemble modelsThis study used a bivariate statistical method and multiple new ensemble models of multiple machine learning models to calculate the flash flood potential index in the Bâsca Chiojdului river basin.
Flash flood susceptibility modeling using geo-morphometric and hydrological approaches in Panjkora Basin, Eastern Hindu Kush, Pakistan [75]201934PakistanHindu Kush; Flash flood; Susceptibility model; Geo-morphometry; Surface run-offThis study divided the Panjkora Basin, Eastern Hindu Kush, Pakistan into 30 sub-basin units and used geo-morphometric and hydrological approaches to evaluate the flash flood susceptibility.
Flash Flood Susceptibility Assessment Based on Geodetector, Certainty Factor, and Logistic Regression Analyses in Fujian Province, China [44]20206ChinaGeodetector; Certainty factor; Flash flood susceptibility; GIS; Logistic regression; Fujian ProvinceThis study used Pearson Correlation coefficient and Geodetector to screen and evaluate the index weight and developed an integrated model of deterministic factor and logistic regression to assess the flash flood susceptibility.
Flash flood susceptibility modeling using an optimized fuzzy rule based feature selection technique and tree based ensemble methods [76]2019101VietnamBagging and boosting models; FURIA; Genetic algorithms; Flash flood susceptibility; VietnamThis study developed an integrated approach based on feature selection method (FSM) and tree for flash flood susceptibility.
Flash-Flood Susceptibility Assessment Using Multi-Criteria Decision Making and Machine Learning Supported by Remote Sensing and GIS Techniques [48]202077RomaniaFlash-flood potential index; K-Star; k-Nearest Neighbor; Analytical hierarchy process; Prahova river catchment; Machine learning This study evaluated the performance of the Analytical Hierarchy Process (AHP), fi (kNN), and K-Star (KS) algorithms and their ensembles for flash flood susceptibility mapping with statistical indicators: sensitivity, specificity, and accuracy.
Table 3. Five highly cited papers.
TitleTotal CitationsYearResearch PurposeResearch Contents
A comparative assessment of decision trees algorithms for flash flood susceptibility modeling at Haraz watershed, northern Iran [78]3002018Flash flood susceptibility mappingThe flash flood disaster susceptibility assessment at Haraz watershed, northern Iran was made by four machine learning hybrid models.
Effect of uncertainty in land use, damage models and inundation depth on flood damage estimates [79]2492011Flood damage uncertainty estimationThe study assessed the impact of uncertainty in inundation depth, land use, the value of risk elements, and sensitive hydrological conditions on flood damage estimates.
Flood susceptibility assessment in Hengfeng area coupling adaptive neuro-fuzzy inference system with genetic algorithm and differential evolution [80]1792018Flood susceptibility assessmentThe flood susceptibility assessment in Hengfeng County, China was made respectively by the hybrid model of adaptive neuro-fuzzy inference system (ANFIS) and genetic algorithm, and the hybrid model of adaptive neuro-fuzzy inference system (ANFIS) and differential evolution, showing that the hybrid model of ANFIS-DE has higher accuracy.
Flash flood forecasting: What are the limits of predictability? [82]1722007Flash flood forecasting methodThe method of forecasting flash floods under the limitations and uncertainties of meteorology and hydrology in the forecasting system was elaborated.
Flood hazard zoning in Yasooj region, Iran, using GIS and multi-criteria decision analysis [81]1592016Identify flood risk areasThe analytic hierarchy process (AHP) was used to identify flood risk areas, which showed that the method has high accuracy.
Table 4. Top 20 high-frequency keywords.
NumberKeywordsCountYearNumberKeywordsCountYear
1flash flood92201211climate change382012
2model76200712risk assessment362007
3susceptibility51201213vulnerability342010
4risk50201014prediction322007
5logistic regression47201215weights of evidence312016
6hazard43201016river basin302016
7spatial prediction43201817support vector machine252016
8area41201218susceptibility assessment252016
9landslide susceptibility40201019classification242012
10frequency ratio39201620debris flow242013
Table 5. Five most influential institutions in the research field.
InstitutionsCentralityCount
Duy Tan University0.0926
University of Bucharest0.1024
Natl Inst Hydrol & Water Management0.0818
Ton Duc Thang University0.0217
Chinese Acad Sci0.0415
Table 6. Assessment scale.
ScaleThe ResearchersResearch AreaThe Research Methods
Administrative divisionProvinceZeng et al. [128]Yunnan Province, ChinaThis study developed a cascade flash flood warning (CFFG) system, including flash flood potential index (FFPI), flash flood hazard index (FFHI), and flash flood risk index (FFRI), and showed that the counties in eastern Yunnan were the most vulnerable to mountain floods.
City/AreaWaqas et al. [129]Chitral in Khyber Pakhtunkhwa (KPK), PakistanThis study used a comprehensive analysis method and frequency ratio model to evaluate flash flood susceptibility.
WatershedWatershedBand et al. [33]the Kalvan watershed in Markazi Province, IranThis study used five machine learning models to assess the flash flood susceptibility and identify flood-prone areas in the study area.
BasinAfreen et al. [130]Panjkora BasinThis study used a frequency ratio model to identify flood-prone areas in the Panjkora Basin.
Disaster-affected siteDisaster-affected siteSaleh et al. [131]110 flash flood locations in the Sungai Pinang catchmentThis study used four integrated machine learning models: statistical index-logistic regression (SI-LR), statistical index-k-nearest neighbor (SI-KNN), statistical index-extreme Gradient Boosting (SI-XGBoost), and statistical index-Random Forest (SI-RF) to map flash flood susceptibility.
Table 7. Type of the assessment unit.
Unit TypeMethodsThe Advantages and Disadvantages
Grid unitThe study area is divided into squares of uniform size based on DEM, and then a matrix is formed for calculation. a. Convenient calculation and division;
b. Cannot reflect the unit geology and topography.
Slope unitThe region near similar terrain is divided into a nearly homogeneous unit.a. Reflect geological and topographical conditions;
b. Integrity.
Topographical unitThe continuous terrain surface is divided into several discrete terrain units with differences.a. Reflect the geology;
b. The higher the precision, the greater the number of units and the more complex the work.
Unique condition unitOverlay the assessment factor data layers to obtain multiple irregular assessment units of different sizes.a. It is suitable for the study of large regional scale;
b. High computational difficulty.
Geomorphic unitThe internal homogeneity and external difference of geomorphic types were maximized, and geomorphic units were taken as the assessment units.a. Reflect unit geology;
b. The division accuracy depends on the professional height.
Table 8. Size of the assessment unit.
The ResearchersResearch AreaUnit Size
Youssef et al. [23]Five Wadis in Jeddah, Saudi Arabia5 × 5 m
Alireza et al. [125]Gorgan Basin, Iran12.5 × 12.5 m
Tehrany et al. [135]the part of Kelantan River Basin in North East part of Peninsular Malaysia15 × 15 m
Pham, B.T et al. [36]Nghe An Province, north central coast region of Vietnam20 × 20 m
Al-Abadi et al. [136]Northeastern Missan province in southern Iraq30 × 30 m
Magnini, A. et al. [137]Most of northern Italy and a small part of Switzerland90 × 90 m
Table 9. Research on the screening of representative assessment indexes.
The ResearchersThe Assessment IndexScreening Method for Correlation between FactorsScreening of Correlation between Factors and Flash FloodThe Final Assessment Index
Cao et al. [44]Elevation, Slope, Topographic relief, NDVI, Land use type, Soil type,
Soil depth, Distance from rivers, 6 h precipitation (H6_100), 24 h precipitation (H24_100), Annual rainfall, Tropical cyclone index, Population density, Economic density.
Pearson correlation coefficientGeodetectorH24_100, Annual rainfall, Topographic relief, Elevation, NDVI, Land use type, Population density, Tropical cyclone index.
Pham, B.T. et al. [45]Distance from rivers, Aspect, Elevation, Slope, Rainfall, Distance from faults, Soil, Land use, Lithology.-Correlation based feature selection methodDistance from rivers, Slope, Elevation, Lithology, Soil, Rainfall, Land use, Aspect.
Costache et al. [74]Slope, L-S factor, Land use/Land cover, TWI, Convergence index, Lithology, Hydrological soil group, Stream Power Index (SPI), TPI, Profile curvature.Variance Inflation of multicollinearity investigation (VIF), Tolerance, Information Gain method-Slope, TPI, TWI, Land use, Lithology, L-S Factor, Convergence index, Hydrological soil groups
Liu et al. [18]Flash flood intensity, Ele and Slp, Soil, P5, P50, and P100, Vegetation Fractional Cover (VFC), POP, Pcul, and GDP, Variation in the flash flood intensity, Changes in precipitation, human activity factors.Geographic detector (interaction detector)Geographic detector (factor detector)VFC, POP, Pcul, and GDP, P5, P50, and P100, Human activity, Precipitation.
Table 10. Representative assessment models.
Research ModelsResearch AreaMethodsConclusions
Intelligent learning modelKangsabati watershed, India [139]The three models of particle swarm optimization (PSO), artificial neural network (ANN), and deep learning neural network (DLNN) were used for mapping the flash flood sensitivity in the research area, and classifying the flash flood prone areas in the research area.Among the three models, PSO model performed well, and can be used for the landscape sensitivity mapping in subtropical areas, eastern India.
Statistical modelXiqu Gully, Beijing, China [140]Frequency ratio (FR) and statistical index (SI) models were used to generate the flash flood sensitivity mapping in the research area.FR model was more suitable for the flash flood sensitivity mapping in this area.
Hydrological modelPanjkora Basin, Eastern Hindu Kush, Pakistan [67] The surface morphology hierarchical model and NRCS-CN hydrological model were used for estimating the flash flood susceptibility in the research area and mapping the flash flood sensitivity in the research area in combination with the parameters of surface morphology, hydrology, geology, and land cover in GIS environment.The flash flood sensitivity mapping can be well done by this method.
Hydrodynamic modelLengkou catchment, Shanxi Province, China [141]A hydrodynamic model of flash floods based on two-dimensional shallow water equation (2D-SWE), including rainfall and infiltration parameters was proposed in this research to simulate two flash floods in the research area.The model predicted the scale of flash floods more accurately, and can predict large-scale flash floods.
Hybrid modelBac Ha Bao Yen (BHBY) region in northwest Vietnam [91]A new hybrid machine learning method was proposed in this research for spatial prediction of flash floods in the research area.The hybrid model has high efficiency and is a new method for predicting flash flood susceptibility.
Table 11. Statistical indexes.
Error Statistical IndexStatistical IndexesCalculation Method
SST (%) [21,84]The closer the value is to 100, the more accurate the model is. S S T = A A + D [49]
SPF (%) [21,84]The closer the value is to 100, the more accurate the model is. S P F = C C + B . [49]
ACC (%) [48,105]The closer the value is to 100, the more accurate the model is. A C C = A + C A + C + B + D [49]
RMSE [144,145,146]The closer the value is to 0, the more accurate the model is. R M S E = i = 1 n y i t i 2 n [49]
MAE [144,147]The closer the value is to 0, the more accurate the model is. M A E = 1 n i = 1 n y i t i [89]
Kappa statistics [34,47,84]The closer the value is to 1, the more accurate the model is. K = P o P e s t 1 P e s t P o = ( A + C ) P e s t = ( A + D ) × ( A + D ) + ( B + C ) × ( D + C ) [49]
R2 [89]The closer the value is to 1, the more accurate the model is. R 2 = 1 i = 1 n y i t i 2 i = 1 n t i t 2 [89]
Note: A , B , C , and D are the number of true positive, false positive, true negative, and false negative, respectively. P o : relative consistency obtained by raters; P e s t : probability of assuming consistent opportunities; n: number of samples; y i : predicted value of sample i ; P e s t : predicted average value of the sample; t i : target value of sample i ; t : targeted average value.
Publisher’s Note: MDPI stays neutral with regard to jurisdictional claims in published maps and institutional affiliations.

