
Spectral Discrimination of Pumice Rafts in Optical MSI Imagery

1
School of Marine Sciences, Sun Yat-sen University, Zhuhai 519082, China
2
Southern Marine Science and Engineering Guangdong Laboratory (Zhuhai), Zhuhai 519000, China
3
Guangdong Provincial Key Laboratory of Marine Resources and Coastal Engineering, Guangzhou 510275, China
4
Pearl River Estuary Marine Ecosystem Research Station, Ministry of Education, Zhuhai 519000, China
*
Author to whom correspondence should be addressed.
Remote Sens. 2022, 14(22), 5854; https://doi.org/10.3390/rs14225854
Submission received: 13 October 2022
/
Revised: 2 November 2022
/
Accepted: 16 November 2022
/
Published: 18 November 2022
(This article belongs to the Section Ocean Remote Sensing)
Abstract
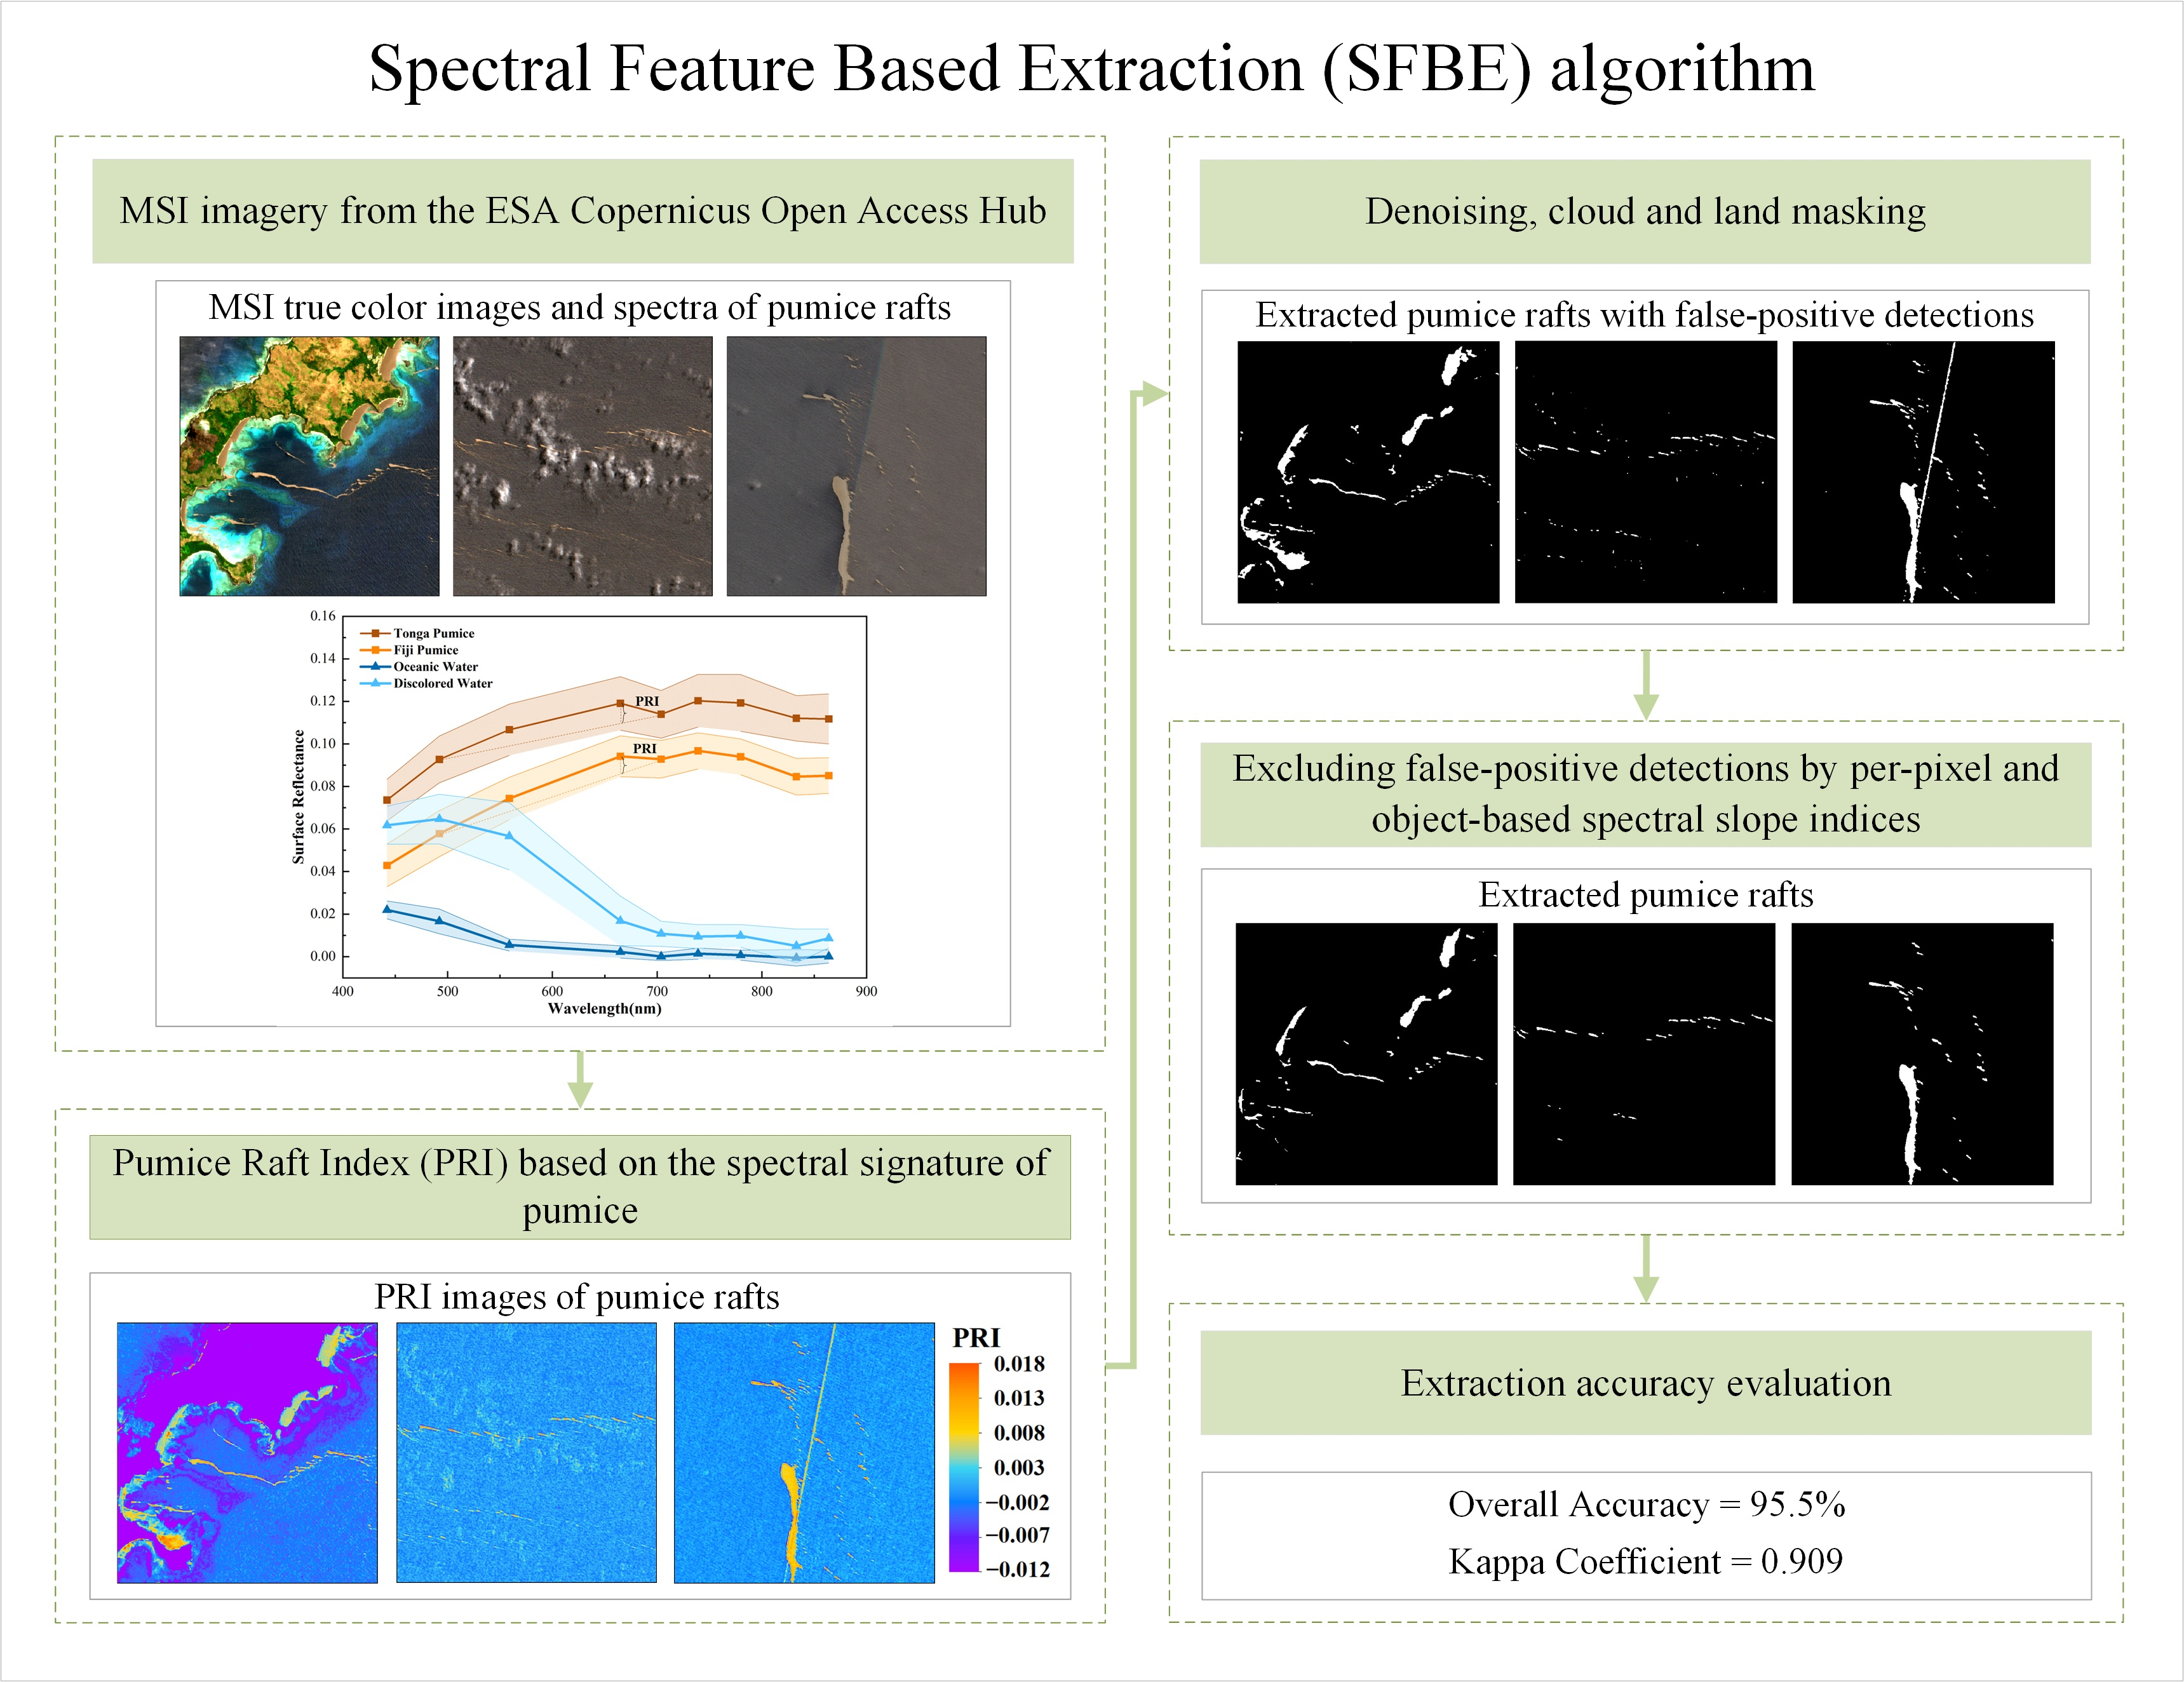
:Pumice rafts are considered to be a long-range drifting agent that promotes material exchange and the dispersal of marine species. Large ones can also interfere with vessel navigation and have a negative impact on the social economy and marine ecosystems. Synoptic observations from the Multispectral Instrument (MSI) on-board Sentinel-2, with a spatial resolution of up to 10 m, provide an excellent means to monitor and track pumice rafts. In this study, the use of a Spectral-Feature-Based Extraction (SFBE) algorithm to automatically discriminate and extract pumice on the ocean surface from submarine volcano eruptions was proposed. Specifically, a Pumice Raft Index (PRI) was developed based on the spectral signatures of pumice in MSI imagery to identify potential pumice features. After pre-processing, the PRI image was then subjected to a series of per-pixel and object-based processes to rule out false-positive detections, including shallow water, striped edges, mudflats, and cloud edges. The SFBE algorithm showed excellent performance in extracting pumice rafts and was successfully applied to extract pumice rafts near the Fiji Yasawa islands in 2019 and Hunga Tonga island in 2022, with an overall pumice extraction accuracy of 95.5% and a proportion of pixels mis-extracted as pumice of <3%. The robustness of the algorithm has also been tested and proved through applying it to data and comparing its output to results from previous studies. The timely and accurate detection of pumice using the algorithm proposed here is expected to provide important information to aid in response actions and ecological assessments, and will lead to a better understanding of the fate of pumice.

1. Introduction
Pumice is a natural multi-porous volcanic rock formed by various proportions of silica and alumina [1], which is produced by the intense vesiculation and quenching of siliceous magma from volcanic eruptions [2,3,4]. Pumice clasts’ buoyancy depends on their size, shape, vesicularity, permeability, and temperature after entering into seawater [2,5]. When there are a large number of low-density buoyant pumice aggregates on the sea surface, a mobile pumice raft may be formed. Pumice rafts are generally considered to be a drifting agent capable of promoting material exchange and is thought to provide a long-range dispersal mechanism for many marine species [6,7,8,9,10]. At the same time, however, pumice rafts can also have a negative impact on the marine environment. Some large pumice rafts can interfere with vessel navigation. One of the main fates of pumice rafts is being stranded on the coast [11]. Beaches being filled with pumice debris can greatly affect the tourism economy, especially in some Pacific Island countries [12]. In addition, pumice rafts block sunlight and, thus, affect marine life, air-ocean heat, and gas exchange in the upper ocean, which may significantly influence the marine ecosystems underneath [13]. Furthermore, pumice may float from periods of months to many years and travel a relatively long distance [2,6,8,14]. For example, the main pumice rafts from the 2006 explosive eruption of Home Reef Volcano in Tonga travelled ~5000 km and arrived in eastern Australian waters seven months after the eruption [2]. The long duration and long range of pumice dispersal necessitates the creation of effective means to detect and track floating pumice rafts. Additionally, the timely and accurate detection of pumice for the purpose of enabling immediate responses will also improve warning and prediction mechanisms, which may enable us to effectively prevent ecological and economic losses.
Satellite remote sensing provides important tools for use in pumice monitoring and tracking, which can be used for detecting various types of targets on the ocean surface [2,8,12,13,15,16,17]. Of the various targets, including Sargassum, Ulva, Trichodesmium, red Noctiluca, and pumice, studies have shown that pigment absorption around 670 nm and typical vegetation red-edge reflectance above 700 nm can be found in all targets other than red Noctiluca and pumice [18]. This demonstrated promise in detecting pumice and discriminating it from other floating targets via optical remote sensing imagery. Coarse-resolution imagery including Moderate Resolution Imaging Spectroradiometer (MODIS), Visible Infrared Imaging Radiometer Suite (VIIRS), Sea and Land Surface Temperature Radiometer (SLSTR), Ocean and Land Color Instrument (OLCI), and Himawari-8 are frequently used to detect and monitor discolored water and pumice rafts during underwater volcano eruptions, owing to their wide coverage and high frequent revisit [12,14,19,20]. For example, pumice rafts from the deep submarine eruption of the Havre caldera volcano in July 2012 were observed by MODIS images and tracked for 112 days through visual interpretation of the true color images [2]. During the August 2019 Tonga underwater volcanic eruption, the consolidated pumice and fragmented rafts could be automatically identified using a sea surface temperature product with level 2 flag values produced by SeaWiFS Data Analysis System (SeaDAS) software (version 7.5) [12].
As the areas of pumice raft vary spatially and temporally, small pumice rafts may be omitted from the coarse resolution satellite observations. Medium-resolution imagery, including the Multispectral Instrument (MSI) on-board Sentinel-2 and the Operational Land Imager (OLI) on board Landsat-8, as well as high-resolution imagery from PlanetScope and WorldView, were also used to detect and map pumice rafts on the ocean surface. For the 2019 Tonga underwater volcanic eruption event, satellite imagery from MODIS, OLCI, VIIRS, MSI, OLI PlanetScope, and synthetic aperture radar Sentinel-1 was utilized to extract pumice rafts and track their floating trajectories, which takes full advantages of the frequent observations provided by coarse-resolution imagery and the more detailed features provided by medium- to high-resolution imagery [13,21]. During the 2021 Fukutoku-Okanoba submarine volcano eruption, multiple satellite images, including the high resolution PlanetScope image, were used to track and analyze raft generation [14]. However, the pumice raft identification from the above studies is based mainly upon visual interpretation and manual digitalization [13,14,21]. A semi-automatic algorithm has been developed by supervised classification based on the Google Earth Engine and Random Forest classifiers in order to detect new submarine eruptions through the pumice rafts identified using the MSI satellite imagery [22]. This algorithm still requires intervention through manual interpretation or the checking of the results to rule out false-positive detections.
In this study, medium-resolution MSI imagery was used to detect pumice rafts because of its relatively high resolution (10–60 m) and quick revisit time (<5 days with Sentinel-2A and Sentinel-2B combined). Specifically, a Spectral-Feature-Based Extraction (SFBE) algorithm was proposed to extract pumice rafts fully automatically from the MSI imagery. The algorithm and the associated threshold set were tested through two previous underwater volcano eruptions, which included both pumice in offshore waters and stranded pumice on coasts. The robustness of the SFBE was tested and demonstrated by applying the algorithm to data and comparing the results with results in previous studies. The proposed algorithm in this study is expected to provide a reliable and fully automatic method to extract and track pumice rafts from MSI images.
2. Data
2.1. Study Area
The study area was located in the Southwest Pacific, with two sub-regions corresponding to the two volcano eruption events (Figure 1). Case 1 contained pumice near Fiji Yasawa islands, which was produced by the eruption of volcano 0403-091 in August 2019 (Figure 1a,c) [13]. Case 2 contained pumice near Hunga Tonga island, generated by the eruption of Hunga Tonga-Hunga Ha’apai volcano (volcano number: 243040) in January 2022 (Figure 1b,c). The underwater volcanoes from the two cases were within a 300 km distance (Figure 1c). However, the pumice near the Fiji Yasawa islands in case 1 travelled 850 km in distance and spent ~50 days on the ocean surface. The pumice rafts near Hunga Tonga island were freshly released and within ~80 km of their original source.
2.2. Satellite Data
Medium-resolution MSI L1C data were obtained from the ESA Copernicus Open Access Hub. They were then processed with the ACOLITE software (version 20211124.0, https://github.com/acolite/acolite/releases/tag/20211124.0 (accessed on 8 October 2022)) to produce surface level reflectance (R, dimensionless), which corrects for aerosol scattering based on a dark spectrum fitting method, and corrects for sun glint on the water surface after the dark spectrum fitting based on estimates from the shortwave infrared bands [23,24]. ACOLITE was developed by the Royal Belgian Institute of Natural Sciences for atmospheric correction and processing for aquatic applications of a various of satellite imagery. The surface reflectance for all the MSI bands was then resampled to a 10 m spatial resolution. Red-Green-Blue composites were generated for MSI using reflectance data centered at 665 nm (R), 559 nm (G), and 492 nm (B) bands. Details of the MSI images used in this study are listed in Table 1.
2.3. Cloud and Land Mask
The Function of Mask software (Fmask, version 4.3) was used to mask cloud pixels in MSI and Landsat imagery, which uses rules and statistics from the cloud and cloud shadow physical characteristics, using a haze-optimized transformation-based cloud probability for MSI and spectral-contextual features to effectively detect clouds and cloud shadows [25,26]. The results of Fmask (version 3.3) have been incorporated into the Landsat Collection 1 QA band by the United States Geological Survey (USGS) [27]. The “cloud probability threshold” was set to 50% in this study, with an additional dilation of 5 pixels from the detected cloud. The Shuttle Radar Topography Mission (SRTM) global data were used for land masking, which were obtained from the USGS. The SRTM images (1 arc-second) and Fmask results (20 m) were then resampled to a 10 m spatial resolution to match the MSI pixels.
3. Methods
3.1. The Pumice Raft Index
Figure 2 shows the true-color images taken over regions near the Fiji Yasawa islands (Figure 2a,b) and near Hunga Tonga island (Figure 2c–e). For both cases, pumice rafts can be clearly seen, characterized by golden brown colors in the shape of patches or filaments (Figure 2a–e). From each case, 15 locations with the presence of pumice and corresponding nearby clean water were randomly selected to check for differences in spectral reflectance between pumice and water. The averaged reflectance spectra are shown in Figure 2f. As can be seen, the averaged reflectance of pumice from the two cases demonstrated a difference in magnitude, though their spectral shapes were similar. Pumice reflectance increased from the blue to the red spectral domain, with peaks in the red or near infrared (NIR). The magnitude of reflectance was generally higher than that of the surrounding water. It is worth noting that a reflectance trough at the band centered at 704 nm can be clearly observed. Pumice rafts near Hunga Tonga island were mainly shown with the background of a discolored water plume, which was mostly seen near the associated volcano caused by fine particles of various chemical components [28,29]. The discolored water displayed an obviously higher reflectance in the blue-green bands compared with regular oceanic seawater (Figure 2f). For the rest of the bands, their reflectance spectral shapes were similar. According to the spectral signatures of pumice and their differences from those of water, a Pumice Raft Index (PRI) based on a baseline-subtraction approach is proposed here [17,30,31]. It is defined as:
where is the baseline reflectance in the red band derived from a linear interpolation between the blue and NIR bands and , , and represent reflectance at 492 nm, 665 nm, and 704 nm, respectively. λ denotes wavelength.
3.2. Cloud and Land Masking
Land pixels showed mostly low negative values in the PRI image (dark color, middle panel in Figure 3a), in contrast with the high value of pumice. However, the PRI for beach pixels at the edge of the land (west side) was significantly higher than that for nearby water (Figure 3a). The SRTM land data were then used to mask the land pixels. After the land masking, most of the bright shorelines could be removed from the PRI image (Figure 3a).
The results of the Fmask consist of 6 values: 0 for clear land, 1 for clear water, 2 for cloud shadow, 3 for snow, 4 for cloud, and 255 for no observation. Unfortunately, some of the pumice rafts were identified as snow by Fmask as well (Figure 3b). In this scenario, only cloud pixels marked by Fmask were used in the PRI image (Fmask = 4, Figure 3b). The additional justification of was used to remove the mis-identified thick cloud pixels which were incorrectly classified as snow (Figure 3c). By applying the above procedures, most of the thick clouds were correctly masked, and pumice pixels were thus unaffected (Figure 3b,c).
According to the averaged spectral reflectance, the increased reflectance in the red and NIR bands would theoretically enable positive values to be shown for pumice and negative values to be shown for background water in the PRI image. As shown in Figure 2a–e, the PRI image presented a strong contrast between pumice and background water. Moreover, the discolored water, which usually occurred near the volcano site or was associated with pumice rafts [12], presented little difference from the regular offshore water shown in the PRI image, and pumice can still clearly be observed in the PRI image (Figure 2c–e). Thick or thin cloud, however, would also create a positive contrast with water in the PRI images (Figure 2c–e). Clouds that were missed by Fmask, as well as other false positives, needed to be excluded in the following steps.
3.3. Pumice Raft Extraction
PRI values of pumice and water from four different regions (at MSI image center and edge for each case, marked in Figure 1a,b) were statistically analyzed to present their differences. As can be seen from Figure 4, the PRI values of pumice pixels are mostly >0.005, while those of water pixels are generally <0. According to the definition of PRI (Equation (1)), pumice pixels would result in positive PRI values, with water pixels resulting in negative PRI values. However, positive PRI values for water pixels were observed as demonstrated in Figure 2 and Figure 4. Still, pumice and water pixels can be potentially separated by certain PRI value (Figure 2 and Figure 4). A PRI threshold of 0.003 (PRI > 0.003) was then determined through trial and error to extract the potential pumice pixels, which applies to all MSI images in the SFBE algorithm. Here, potential pumice rafts with sizes of less than 2 pixels (an area of 200 m2) were also ignored for additional noise removal.
Scattered noise from wave-induced glint affected the automatic extraction of pumice. Such scattered noises were smoothed by the median filtering (3 × 3 window) of reflectance before the PRI calculation took place. A total variance (TV) filtering, which is based on a constrained optimization type of numerical algorithm [32,33], was completed in order to minimize the scattered noise from glint pixels [17]. As can be seen in Figure 5a, noises near the circled regions were successfully removed after the denoising processes had been conducted.
False positives with a high PRI were attributed to a variety of targets, including shallow water, stripe edge, mudflat, and cloud edge, in MSI imagery, as shown in Figure 5b–e. The reflectance spectra of the above targets are demonstrated in Figure 5f. A series of steps were taken to exclude them from the extracted potential pumice pixels based on the spectral difference between the varying targets and pumice.
Firstly, false positives due to shallow water pixels were excluded. Reflectance spectra for shallow-water pixels featured a reflectance peak at 559 nm and a drastic decrease in the red to NIR bands (Figure 5b,f). Here, the spectral slope between 559 nm and 864 nm (slpsw) was employed. It was calculated from
where a slpsw threshold () of −0.15 was determined through trial and error. As displayed in Figure 5b (circled regions), all the shallow water pixels were removed, leaving the pumice close to shorelines intact and unaffected.
Secondly, the stripe edge artifacts were removed. Stripe edges are caused by displacements of spectral bands in the overlap area from the different MSI detectors [34]. The reflectance spectra for the stripe edge pixels are shown in Figure 5f. While an increase in reflectance from the 492 to 665 nm band was observed in pumice, the opposite was found for stripe edges (Figure 5f). The spectral slope (slpse) between the two bands was then used to differentiate the stripe edge:
where the slpse threshold () was set to be −0.02.
After the above per-pixel operations were performed, some of the stripe edges were still mis-identified as pumice. An object-based approach was developed to exclude remaining pixels due to stripe edge, and for additional false-positive removal as well. Here, all connected pixels (through 8-neighbor searching) in the remaining PRI image denoted one object. The average and standard deviation of reflectance for pixels within the object were calculated. The relative magnitude of reflectance at 492 nm and 665 nm was compared with the justification that the reflectance of pumice at 442 nm should be less than at 665 nm.
Instead of 0, we used the standard deviation of 665-nm-reflectance for all the pixels within the object to justify the subtraction result (), accounting for the variance within the object. As demonstrated in Figure 5c, most of the stripe edge pixels were successfully excluded after the above processes were completed.
Thirdly, false-positive detections caused by mudflats were eliminated. Mudflat in the intertidal zone exhibited a high PRI, displaying similar spectral shapes to those of pumice (Figure 5d,f). Spectral differences between the mudflats and pumice were found in the NIR region, where reflectance for pumice at 739 nm was higher than that at 704 nm, with the opposite being true for mudflats. Therefore, the spectral difference between 704 nm and 739 nm (slpmf) for the PRI object was used to differentiate mudflat pixels. This was calculated from
where the slpmf threshold () was set to 0. As can been seen, a large majority of mudflats were rejected after the completion of the above process (Figure 5d).
Finally, false-positive detections due to cloud edges were removed. Cloud edges (mostly rainbow-colored pixels) not excluded through cloud masking also presented high PRI values. The rainbow color of the pixels was caused by the time offset between the alternating detectors of MSI during image sensing [35]. Figure 5e shows the reflectance spectra of the rainbow-colored cloud edges. The reflectance for pumice pixels was higher at 559 nm than at 442 nm and 492 nm. However, some of the cloud edge pixels usually have reflectance at 492 nm that is lower than at 442 nm or higher than at 559 nm (Figure 5f). Therefore, these objects could be considered pumice if the following criteria were met:
where denotes the standard deviation of reflectance at 492 nm for all pixels within the object, and is set to 0. The obtained image in Figure 5e shows clearly that the cloud edges were successfully removed after the use of the object-based approach.
3.4. SFBE Work Flow
The above processes were operated mainly based upon the spectral signatures of pumice. The flowchart in Figure 6 summarizes all the procedures used in this study to extract pumice raft from MSI. In general, there were three major steps in the SFBE algorithm: (1) PRI image generation after the smoothing of the reflectance data; (2) the extraction of potential pumice rafts with the PRI threshold after cloud and land masking, and TV filter denoising; (3) excluding PRI false-positive detections using a series of spectral slope indices, including per-pixel approaches to rule out false positives from shallow water and stripe edges, and additional objected approaches to exclude false-positive detections from stripe edges that are left over, mudflats, and cloud edges.
3.5. Pumice Raft Extraction Accuracy
Due to the lack of field observations, the pixels representing “truth” in this study were determined through the visual inspection of true color images [13,36]. Pumice rafts and non-pumice regions were randomly selected. A total of 95,966 “truth” pixels were selected, including 47,987 “true pumice” pixels (403 pumice rafts) and 47,979 “true others” pixels (168 non-pumice regions). The accuracy of the pumice extraction was then quantitatively evaluated by analyzing the confusion matrix, which is usually used to describe the performance of a classifier based on the calculation of accuracy and error from the true and classified pixels [36]. Among them, commission error was defined as the percentage of pixels misclassified as pumice; omission error indicated the percentage of pumice pixels misclassified as non-pumice; overall accuracy was the percentage of the correctly classified pumice and non-pumice pixels to the total selected pixels; kappa coefficient was used to test the consistency of the method’s determination with their true category combined with the above evaluation assessments. The closer the kappa coefficient was to 1, the higher the consistency between the two was. A kappa coefficient between 0.8 and 1 can be considered as perfect agreement [37]. The calculation equations of the above parameters are as follow:
where CE, OE, OA, and KC represent the commission error, omission error, overall accuracy, and kappa coefficient, respectively. OO and PP represent the number of other and pumice pixels that extracted correctly, respectively. OP represents the number of pixels that truly pumice extracted as others, and PO represents the number of pixels that truly others extracted as pumice.
4. Results
4.1. Extracted Pumice Raft
Figure 7 shows the results of the extracted pumice rafts. It can be seen that the pumice rafts were well extracted, with most of the false-positive features being successfully removed. Figure 7a–c presents pumice near the Fiji Yasawa islands, where pumice rafts near shallow waters, close to shorelines, or located near stripe edges were well extracted without contamination from false positives. Figure 7d,e shows pumice extracted near Hunga Tonga island. Although most large pumice rafts were captured by the algorithm, a small number of pumice pixels were omitted due to their small size.
Table 2 shows the confusion matrix for the extracted pumice. Statistical results show a commission error of 0.024. This means that 2.4% of the non-pumice pixels were extracted as pumice pixels, suggesting a high credibility of the extracted pumice. The omission error of 0.068 demonstrated that 6.8% of the pumice pixels were missed by the algorithm. The overall identification accuracy for pumice and non-pumice was 95.5% and the kappa coefficient was 0.909. If the two cases are considered separately, it can be seen that the extraction algorithm performed better near the Fiji Yasawa islands than around Hunga Tonga island. For the Fiji Yasawa islands, the overall accuracy was 96.5% with a kappa coefficient of 0.930. For Hunga Tonga island, the overall accuracy was 93.5% with a kappa coefficient of 0.869.
4.2. Pumice Rafts Distribution
The spatial distribution of pumice rafts from the two cases is shown in Figure 8. The pumice detected in case 1 was mainly distributed among the Yasawa Islands, Viti Levu, and Vanua Levi on 29 September 2019. Some of the pumice rafts were washed onshore along the east coast of the Yasawa Islands. While the pumices here travelled a distance of ~850 km from its origin, the pumices that were not stopped by the islands continued to drift northwestward. The total area of all detected pumice rafts for case 1 was 25.14 km2, with an average value of ~8600 m2. The largest and smallest rafts had areas of 2.31 km2 and 300 m2, respectively. The area of detected pumice rafts on the shorelines of the Yasawa islands was 1.03 km2, accounting for >4% of the total pumice detected in this area. For case 2, near Hunga Tonga island, the extracted pumice rafts were generally found around the eruption site (Hunga Tonga-Hunga Ha’apai), within a distance of 80 km. Note that the study area was covered by heavily distributed clouds, and many of the detected pumices were detected near the edge of the clouds. It can reasonably be presumed that more pumice rafts also existed underneath the clouds. The total area of all the pumice rafts extracted was 4.25 km2 in this case, with the largest one measuring 0.092 km2, the smallest one measuring 300 m2, and the average area being ~2300 m2.
4.3. Cross Checking
Because of a lack of field data to validate the extraction results, we applied the SFBE algorithm to MSI data that have been used/studied in previous research (Figure 9a–d) for cross checking. Pumice rafts in Figure 9a,b have been confirmed through field observations [12,13,22]. Details of the MSI images used for cross checking are listed in Table 3.
Figure 9a,b shows pumice rafts near the Late Island generated by the eruption of volcano 0403-091 in August 2019. The extraction results by SFBE are similar in shape and location to VIIRS and MODIS detections of the same date in Whiteside et al. [12]. Clearly, however, results from MSI presented a more detailed distribution of the rafts, and the long slick of narrow rafts in the lower part of Figure 9b was well extracted by SFBE in MSI but was not clearly presented in the coarse-resolution imagery. The inset in Figure 9e displays a zoomed-in image of the extraction results; the same image was displayed in Jutzeler et al. [13] for pumice raft tracking. As can be seen, the pumice rafts were well extracted except for locations under cloud cover. In addition, the pumice rafts near the shoreline of Yasawa Islands (Figure 5b and Figure 7c) were also presented in Jutzeler et al. [13], which were well extracted through the SFBE algorithm in this study.
Figure 9c,d demonstrates pumice rafts near Rabaul, Papua New Guinea. The extraction results by SFBE in Figure 9e demonstrate raft distributions that are similar to the classification results from Zheng et al. [22], and the SFBE algorithm, as well, showed a similar performance to the classification scheme by Zheng et al. [22] in areas presented in Figure 9a. The classification results of Figure 9c were not shown in Zheng et al. [22]. Still, the SFBE showed good performance in extracting the majority of the pumice rafts with few false-positive detections. As pumice rafts have been well extracted under various circumstances, including scattered cloud cover (Figure 9a), large cloud cover (Figure 9b), close to shorelines (Figure 9c,d), and with influence of sun glint (Figure 9d), the robustness of the SFBE algorithm has been well proved.
5. Discussion
As shown in Figure 10, the majority of the pumice rafts extracted had areas in the range of approximately 300 m2 to 10,000 m2 for both regions, with a median area of 2600 m2 and 900 m2 near Fiji Yasawa islands and Hunga Tonga island, respectively. Based on the pixel size of the coarse-resolution optical imagery, 99.98%, 99.94%, and 99.21% in the numbers and 92.1%, 87.7%, and 68.1% in areas of the pumice rafts in the two subregions would be less than the pixel size of MODIS (1 × 1 km2 for ocean bands), VIIRS (0.75 × 0.75 km2), and OLCI (0.3 × 0.3 km2), respectively. Moreover, most of the pumice rafts were filaments with elongated shapes. Consequently, pumice detection using coarse-resolution optical imagery may suffer from the issue of mixed pixels and the detected overall pumice area may be substantially underestimated. On the other hand, some of the large pumice rafts can still be detected. For example, pumice rafts as large as 195 km2 were reported to have been freshly released from the Tonga Arc volcano eruption during August 2019 [13]. However, the large early rafts were seen broken up into hundreds of small (<1 km2) ones after three weeks [13]. The use of medium-resolution images such as MSI would enable us to better understand the fate of the floating rafts, which is still a challenging topic because of the limited data, sampling, and observations [13,38].
A total of 6.8% (omission error) of the pumice pixels were not extracted and were classified as non-pumice. The omitted pumices were mainly from rafts of small sizes or the boundary pixels of the pumice rafts (Figure 7 and Figure 9). The algorithm proposed in this study used multiple bands in MSI to extract pumice, including the 10 m spatial resolution 492, 559, and 665 nm bands, 20 m spatial resolution 704 and 865 nm bands, and 60 m spatial resolution 442 nm band, though the latter band was only used in the object-based approach and not the per-pixel approach. While some of the small-area pumice rafts had narrow and elongated shapes (a few pixels in width), those pixels may have been excluded during the justification procedure because of the pixel-mixing from nearby waters (Figure 7 and Figure 9). Other than the pixel-mixing effect, the omission error can also be introduced for the following reasons: some pumice pixels were mis-identified as clouds by Fmask (Figure 7e); many of the spectral slope thresholds for false-positive exclusions were strictly set for correct identification of pumice, which in turn lead incorrectly to the removal of the pumice pixels. Note that the minimum area of extracted pumice detected was 300 m2, and potential objects less than two pixels in width were deliberately removed in the de-noising process. The results suggested that the pumice extraction method proposed in this paper performed relatively better for capturing large pumice rafts. The omission of the pumice pixels would lead to an underestimation of the pumice area through the algorithm proposed in this study. Though omitting some of the pumice pixels, part of the pumice raft can still be identified, thus allowing for the locating of the pumice based on the extracted pixels and facilitating a range of actions being taken.
The overall extraction accuracy around Hunga Tonga island was relatively lower (93.5% vs. 96.5%) than that near the Fiji Yasawa islands. This phenomenon was mainly correlated with omission error, as the pumice rafts observed near Tonga generally had smaller areas than those seen near Fiji (average area of 2300 m2 vs. 8600 m2). Another possible reason for the slightly lower pumice extraction accuracy values found near the Hunga Tonga region could be the coverage of scattered clouds. Pumice detection near the clouds or underneath the thin clouds was affected by stray light or thin cloud contamination (Figure 7e), with the spectral shapes and magnitudes being modified. The evaluation results suggested that 2.4% (commission error) of the non-pumice pixels were incorrectly extracted as pumice. This mis-identification was attributed to their spectral similarities to pumice, such as their incomplete rejection of mudflats (Figure 5d), strip edges (Figure 5c), and several unremoved thin clouds. Note that the commission error was slightly higher near Fiji Yasawa islands (~3.6%) than that near Hunga Tonga island (~0.5%), because of the shoreline environment of the former introducing more false positives (e.g., mudflats).
Similar spectral shapes of the averaged pumice reflectance were observed from the two cases, even though the pumice originated from different volcanoes and drifted for different periods of time (>50 days in case 1 and a few days in case 2) on the ocean surface. Though the reflectance magnitude is different, the reflectance increase trend from blue to red, and local trough at the band centered at 704 nm, are clearly presented in both cases. This increase trend agrees well with the MODIS and VIIRS pumice spectra from the August 2019 Tonga eruption [12], while the local reflectance trough at the 704 nm band in MSI has been observed from various underwater eruption cases [22], and at the 709 nm band in OLCI from the August 2019 Tonga eruption [15]. Other than the false-positive targets discussed in this study, floating debris (e.g., microplastic particles and plastic bags or bottles) on the ocean surface may also affect the automatic extraction of pumice pixels, which features a gradual increase in reflectance in the 400–500 nm, and rather flat reflectance in the 500–900 nm, wavelength ranges [18]. However, the area of the marine debris is usually not comparable to pumice rafts.
Other than the additional justification for removing thick cloud, all the thresholds in this study were based on spectral shapes (e.g., spectral slope and relative magnitude between bands) of pumice and the various targets. Some of the threshold values were zero (T’ce and Tmf), while some were slightly deviated from zero (Tpri, Tsw, Tse, Tce, and T’se), with the latter threshold values determined through trial and error. A sensitivity analysis was carried out by increasing and decreasing the non-zero thresholds, with pumice extraction results evaluated by the same confusion matrix method presented in Section 3.5. During the sensitivity test, only one threshold was changed. For example, the PRI threshold was modified from 0.003 (used in this study) to 0 with all other thresholds being the same as the determined thresholds in this study. Then, the pumice extraction performance was evaluated, with an overall accuracy of 92.3% and kappa coefficient of 0.845 (Table 4), slightly lower than threshold set of the original set of 0.003 (overall accuracy of 95.5% and kappa coefficient of 0.909). Moreover, a change of Tsw from −0.15 to 0 would greatly decrease the extraction accuracy (from 95.5% to 84.8%, Table 4). Other than the above two threshold values, a slight modification of the determined threshold values (Tse, Tce, and T’se) would slightly decrease the extraction performance (Table 4). Overall, the threshold values determined in this study show the best performance among the test values. The same set of thresholds has been applied to 10 MSI images, including pumice rafts from four locations with pumice originated from more than two different underwater volcano eruptions (the source of the pumice rafts from Papua New Guinea is unknown) with satisfactory extraction results, which proves the robustness of the algorithm.
6. Conclusions
In summary, this paper proposed the use of a new algorithm for the fully automatic extraction of pumice using optical MSI imagery. This Spectral-Feature-Based Extraction algorithm was demonstrated to have an excellent performance in extracting pumice both in offshore waters and when stranded on coast, with an overall extraction accuracy of 95.5%, kappa coefficient of 0.909, and commission rate of 2.4%. This approach is expected to provide useful tools for the identification and extraction of pumice, to facilitate response actions and ecological assessment, and to lead to a better understanding of the fate of pumice.
Author Contributions
Conceptualization, S.S.; Funding acquisition, S.S.; Methodology, X.C.; Writing—original draft, X.C. and S.S.; Writing—review & editing, X.C., S.S., J.Z. and B.A. All authors have read and agreed to the published version of the manuscript.
Funding
This research was funded by the National Natural Science Foundation of China, grant number 42106173, the Guangdong Basic and Applied Basic Research Foundation, grant number 2020A1515110957, and the Dragon 5 Cooperation, grant number 59193.
Data Availability Statement
Sentinel-2 MSI data are openly accessible from https://scihub.copernicus.eu/ (accessed on 8 October 2022), SRTM data are openly accessible from https://earthexplorer.usgs.gov/ (accessed on 10 October 2022).
Acknowledgments
The authors would like to thank ESA for providing MSI data, and USGS for providing SRTM data.
Conflicts of Interest
The authors declare no conflict of interest.
References
- Mourhly, A.; Khachani, M.; Hamidi, A.E.; Kacimi, M.; Halim, M.; Arsalane, S. The Synthesis and Characterization of Low-Cost Mesoporous Silica SiO2 from Local Pumice Rock. Nanomater. Nanotechnol. 2015, 5, 35. [Google Scholar] [CrossRef]
- Jutzeler, M.; Marsh, R.; Carey, R.J.; White, J.D.; Talling, P.J.; Karlstrom, L. On the fate of pumice rafts formed during the 2012 Havre submarine eruption. Nat. Commun. 2014, 5, 3660. [Google Scholar] [CrossRef] [PubMed] [Green Version]
- Allen, S.R.; Fiske, R.S.; Cashman, K.V. Quenching of steam-charged pumice: Implications for submarine pyroclastic volcanism. Earth Planet. Sci. Lett. 2008, 274, 40–49. [Google Scholar] [CrossRef]
- Manga, M.; Fauria, K.E.; Lin, C.; Mitchell, S.J.; Jones, M.; Conway, C.E.; Degruyter, W.; Hosseini, B.; Carey, R.; Cahalan, R.; et al. The pumice raft-forming 2012 Havre submarine eruption was effusive. Earth Planet. Sci. Lett. 2018, 489, 49–58. [Google Scholar] [CrossRef]
- Fauria, K.E.; Manga, M.; Wei, Z. Trapped bubbles keep pumice afloat and gas diffusion makes pumice sink. Earth Planet. Sci. Lett. 2017, 460, 50–59. [Google Scholar] [CrossRef] [Green Version]
- Bryan, S.E.; Cook, A.G.; Evans, J.P.; Hebden, K.; Hurrey, L.; Colls, P.; Jell, J.S.; Weatherley, D.; Firn, J. Rapid, long-distance dispersal by pumice rafting. PLoS ONE 2012, 7, e40583. [Google Scholar] [CrossRef] [Green Version]
- Jokiel, P.L. Transport of reef corals into the Great Barrier Reef. Nature 1990, 347, 665–667. [Google Scholar] [CrossRef]
- Bryan, S.; Cook, A.; Evans, J.; Colls, P.; Wells, M.; Lawrence, M.; Jell, J.; Greig, A.; Leslie, R. Pumice rafting and faunal dispersion during 2001–2002 in the Southwest Pacific: Record of a dacitic submarine explosive eruption from Tonga. Earth Planet. Sci. Lett. 2004, 227, 135–154. [Google Scholar] [CrossRef]
- Jokiel, P.L.; Cox, E.F. Drift pumice at Christmas Island and Hawaii: Evidence of oceanic dispersal patterns. Mar. Geol. 2003, 202, 121–133. [Google Scholar] [CrossRef]
- Velasquez, E.; Bryan, S.E.; Ekins, M.; Cook, A.G.; Hurrey, L.; Firn, J. Age and area predict patterns of species richness in pumice rafts contingent on oceanic climatic zone encountered. Ecol. Evol. 2018, 8, 5034–5046. [Google Scholar] [CrossRef]
- Ohno, Y.; Iguchi, A.; Ijima, M.; Yasumoto, K.; Suzuki, A. Coastal ecological impacts from pumice rafts. Sci. Rep. 2022, 12, 11187. [Google Scholar] [CrossRef] [PubMed]
- Whiteside, A.; Dupouy, C.; Singh, A.; Frouin, R.; Menkes, C.; Lefèvre, J. Automatic Detection of Optical Signatures within and around Floating Tonga-Fiji Pumice Rafts Using MODIS, VIIRS, and OLCI Satellite Sensors. Remote Sens. 2021, 13, 501. [Google Scholar] [CrossRef]
- Jutzeler, M.; Marsh, R.; van Sebille, E.; Mittal, T.; Carey, R.J.; Fauria, K.E.; Manga, M.; McPhie, J. Ongoing Dispersal of the 7 August 2019 Pumice Raft From the Tonga Arc in the Southwestern Pacific Ocean. Geophys. Res. Lett. 2020, 47, e1701121. [Google Scholar] [CrossRef]
- Fauria, K.; Jutzeler, M.; Mittal, T.; Gupta, A.; Kelly, L.; Rausch, J.; Bennartz, R.; Delbridge, B.; Retailleau, L. Simultaneous creation of a large vapor plume and pumice raft by a shallow submarine eruption. Earth Space Sci. Open Arch. 2022. [Google Scholar] [CrossRef]
- Qi, L.; Hu, C.; Mikelsons, K.; Wang, M.; Lance, V.; Sun, S.; Barnes, B.B.; Zhao, J.; Van der Zande, D. In search of floating algae and other organisms in global oceans and lakes. Remote Sens. Environ. 2020, 239, 111659. [Google Scholar] [CrossRef]
- Wang, M.; Hu, C. Mapping and quantifying Sargassum distribution and coverage in the Central West Atlantic using MODIS observations. Remote Sens. Environ. 2016, 183, 350–367. [Google Scholar] [CrossRef]
- Wang, M.; Hu, C. Automatic extraction of Sargassum features from sentinel-2 msi images. IEEE Trans. Geosci. Remote Sens. 2020, 59, 2579–2597. [Google Scholar] [CrossRef]
- Hu, C. Remote detection of marine debris using satellite observations in the visible and near infrared spectral range: Challenges and potentials. Remote Sens. Environ. 2021, 259, 112414. [Google Scholar] [CrossRef]
- Carey, R.; Soule, S.A.; Manga, M.; White, J.D.L.; McPhie, J.; Wysoczanski, R.; Jutzeler, M.; Tani, K.; Yoerger, D.; Fornari, D.; et al. The largest deep-ocean silicic volcanic eruption of the past century. Sci. Adv. 2018, 4, e1701121. [Google Scholar] [CrossRef] [Green Version]
- Coca, J.; Ohde, T.; Redondo, A.; García-Weil, L.; Santana-Casiano, M.; González-Dávila, M.; Arístegui, J.; Nuez, E.F.; Ramos, A.G. Remote sensing of the El Hierro submarine volcanic eruption plume. Int. J. Remote Sens. 2014, 35, 6573–6598. [Google Scholar] [CrossRef]
- Brandl, P.A.; Schmid, F.; Augustin, N.; Grevemeyer, I.; Arculus, R.J.; Devey, C.W.; Petersen, S.; Stewart, M.; Kopp, H.; Hannington, M.D. The 6–8 Aug 2019 eruption of ‘Volcano F’ in the Tofua Arc, Tonga. J. Volcanol. Geotherm. Res. 2020, 390, 106695. [Google Scholar] [CrossRef] [Green Version]
- Zheng, M.; Mittal, T.; Fauria, K.E.; Subramaniam, A.; Jutzeler, M. Pumice Raft Detection Using Machine-Learning on Multispectral Satellite Imagery. Front. Earth Sci. 2022, 10, 838532. [Google Scholar] [CrossRef]
- Vanhellemont, Q. Adaptation of the dark spectrum fitting atmospheric correction for aquatic applications of the Landsat and Sentinel-2 archives. Remote Sens. Environ. 2019, 225, 175–192. [Google Scholar] [CrossRef]
- Vanhellemont, Q.; Ruddick, K. Acolite for Sentinel-2: Aquatic applications of MSI imagery. In Proceedings of the 2016 ESA Living Planet Symposium, Prague, Czech Republic, 9–13 May 2016; pp. 9–13. [Google Scholar]
- Zhu, Z.; Wang, S.; Woodcock, C.E. Improvement and expansion of the Fmask algorithm: Cloud, cloud shadow, and snow detection for Landsats 4–7, 8, and Sentinel 2 images. Remote Sens. Environ. 2015, 159, 269–277. [Google Scholar] [CrossRef]
- Qiu, S.; Zhu, Z.; He, B. Fmask 4.0: Improved cloud and cloud shadow detection in Landsats 4–8 and Sentinel-2 imagery. Remote Sens. Environ. 2019, 231, 111205. [Google Scholar] [CrossRef]
- Foga, S.; Scaramuzza, P.L.; Guo, S.; Zhu, Z.; Dilley, R.D.; Beckmann, T.; Schmidt, G.L.; Dwyer, J.L.; Joseph Hughes, M.; Laue, B. Cloud detection algorithm comparison and validation for operational Landsat data products. Remote Sens. Environ. 2017, 194, 379–390. [Google Scholar] [CrossRef] [Green Version]
- Urai, M.; Machida, S. Discolored seawater detection using ASTER reflectance products: A case study of Satsuma-Iwojima, Japan. Remote Sens. Environ. 2005, 99, 95–104. [Google Scholar] [CrossRef]
- Mantas, V.M.; Pereira, A.; Morais, P.V. Plumes of discolored water of volcanic origin and possible implications for algal communities. The case of the Home Reef eruption of 2006 (Tonga, Southwest Pacific Ocean). Remote Sens. Environ. 2011, 115, 1341–1352. [Google Scholar] [CrossRef]
- Hu, C. A novel ocean color index to detect floating algae in the global oceans. Remote Sens. Environ. 2009, 113, 2118–2129. [Google Scholar] [CrossRef]
- Xing, Q.; Hu, C. Mapping macroalgal blooms in the Yellow Sea and East China Sea using HJ-1 and Landsat data: Application of a virtual baseline reflectance height technique. Remote Sens. Environ. 2016, 178, 113–126. [Google Scholar] [CrossRef]
- Rudin, L.I.; Osher, S.; Fatemi, E. Nonlinear total variation based noise removal algorithms. Phys. D Nonlinear Phenom. 1992, 60, 259–268. [Google Scholar] [CrossRef]
- Chambolle, A. An Algorithm for Total Variation Minimization and Applications. J. Math. Imaging Vis. 2004, 20, 89–97. [Google Scholar] [CrossRef]
- ESA, V.B.; Szantoi, Z.; Gascon, F. Copernicus Sentinel-2 Mission: Calibration and Validation activities. GSICS Q 2020, 14, 1. [Google Scholar]
- Liu, Y.; Xu, B.; Zhi, W.; Hu, C.; Dong, Y.; Jin, S.; Lu, Y.; Chen, T.; Xu, W.; Liu, Y. Space eye on flying aircraft: From Sentinel-2 MSI parallax to hybrid computing. Remote Sens. Environ. 2020, 246, 111867. [Google Scholar] [CrossRef]
- Wang, M.; Hu, C. Extracting oil slick features from VIIRS nighttime imagery using a Gaussian filter and morphological constraints. IEEE Geosci. Remote Sens. Lett. 2015, 12, 2051–2055. [Google Scholar] [CrossRef]
- Rwanga, S.S.; Ndambuki, J.M. Accuracy assessment of land use/land cover classification using remote sensing and GIS. Int. J. Geosci. 2017, 8, 611. [Google Scholar] [CrossRef] [Green Version]
- Mitchell, S.J.; Fauria, K.E.; Houghton, B.F.; Carey, R.J. Sink or float: Microtextural controls on the fate of pumice deposition during the 2012 submarine Havre eruption. Bull. Volcanol. 2021, 83, 80. [Google Scholar] [CrossRef]
Figure 1.
Study area near (a) Fiji Yasawa islands (study case 1) and (b) Hunga Tonga island (study case 2). The red arrow points to the location of the Hunga Tonga-Hunga Ha’apai volcano (volcano number: 243040) for the January 2022 eruption. (c) The two regions are located in the Southwest Pacific region, with the extent of panels a and b marked in black and red boxes, respectively. The pumice near the Fiji Yasawa Islands in panel a was actually from the eruption of volcano 0403-091 (black arrow pointed location) in August 2019, ~300 km from the eruption location for case 2. The locations marked by red squares in panels a and b are used in Section 3.3 to diagnose pumice raft index threshold for separating pumice and water.

Figure 2.
RGB true color and the corresponding PRI images in sub regions (a–e). Sub-regions in panels a and b were from near the Fiji Yasawa islands with background of regular oceanic water, while the sub-regions in panels (c–e) were from near Hunga Tonga island with a background of mostly discolored water. Clear contrasts can be observed from the pumice with the background water in the PRI image. (f) Average reflectance spectra of pumice and water in selected locations, partly marked in panels (a–e). Standard deviations of the spectra are shown in shaded areas.

Figure 3.
(a) The beach shoreline pixels displayed a high value in the PRI image (marked in red ellipse), which were mostly removed after SRTM land masking. (b) Pumice and (c) thick cloud pixels are mis-identified as snow (Fmask = 3). Cloud pixels were successfully excluded using Fmask = 4 and additional justifications described in Section 3.2. Cloud and land pixels were masked in grey color in the third column.

Figure 4.
Mean and standard deviation of PRI from pumice and water pixels in selected regions (marked in Figure 1a,b). Areas > 300 pumice pixels were selected at each region for statistics.
Figure 4.
Mean and standard deviation of PRI from pumice and water pixels in selected regions (marked in Figure 1a,b). Areas > 300 pumice pixels were selected at each region for statistics.

Figure 5.
Examples of RGB image, the initially extracted PRI, and PRI image after (a) TV screen, and after the removal of false-positive detections from (b) shallow water, (c) stripe edge, (d) mudflat, and (e) cloud edge, respectively. Scattered noise and false-positive detections from the various targets marked in red eclipses and rectangles have been successfully removed after the procedures described in Section 3.3. (f) Average reflectance spectra of mudflat, shallow water, stripe edge, wave-induced glint, cloud edges and pumice in selected locations, partly marked in panels (a–e).

Figure 6.
Workflow for automatically extracting pumice pixels in an MSI image.

Figure 7.
True color image (first row) and the extracted pumice rafts (second row) in sub-regions (a–e).
Figure 7.
True color image (first row) and the extracted pumice rafts (second row) in sub-regions (a–e).

Figure 8.
(a,b) show the distribution of pumice rafts near the Fiji Yasawa islands in September 2019 and near Hunga Tonga island in January 2022, respectively.
Figure 8.
(a,b) show the distribution of pumice rafts near the Fiji Yasawa islands in September 2019 and near Hunga Tonga island in January 2022, respectively.

Figure 9.
Application of the SFBE algorithm to MSI images used in previous studies. (a) Data used in Whiteside et al. [12], Jutzeler et al. [13], and Zheng et al. [22] near Late Island from Tonga volcano eruption on 11 August 2019; (b) data used in Whiteside et al. [12] near Late Island from Tonga volcano eruption on 21 August 2019. Data used in Zheng et al. [22] from Rabaul, Papua New Guinea on (c) 15 April 2020, and (d) 20 April 2020; (e–h) the extracted pumice rafts by SFBE algorithm proposed in this study from images listed in panels a to d, respectively. The white color areas indicate pumice rafts, and the black areas indicate others in panels (e–h). Insets in panels a and e show the zoomed in image and extraction results in the red rectangular area, respectively.

Figure 10.
The frequency of area for all extracted pumice rafts.


Table 1.
MSI images used in this study.
| Study Case | Location | Image | Date |
|---|---|---|---|
| Case 1 | Fiji Yasawa islands | L1C_T60KWG_A013397_20190929T223009 | 29 September 2019 |
| L1C_T60KXG_A013397_20190929T223009 | 29 September 2019 | ||
| Case 2 | Hunga Tonga island | L1C_T01KFT_A025423_20220117T215909 | 17 January 2022 |
| L1C_T01KET_A025423_20220117T215909 | 17 January 2022 |
Table 2.
Confusion matrix evaluation of extracted pumice rafts.
| Commission Error | Omission Error | |
|---|---|---|
| Pumice | 0.024 | 0.068 |
| Others | 0.065 | 0.022 |
| Overall Accuracy = 95.5% | ||
| Kappa Coefficient = 0.909 | ||
Table 3.
MSI images used for comparison and verification.
| Case | Location | Image | Date | References |
|---|---|---|---|---|
| Volcano 0403-091 eruption in August 2019 | Late Island | L1C_T01KFV_A012696_20190811T220043 | 11 August 2019 | Whiteside et al. [12] Zheng et al. [22] Jutzeler et al. [13] |
| L1C_T01KGV_A012696_20190811T220043 | 11 August 2019 | |||
| L1C_T01KFV_A012839_20190821T220042 | 21 August 2019 | Whiteside et al. [12] | ||
| L1C_T01KEV_A012839_20190821T220042 | 21 August 2019 | |||
| Unknown source | Rabaul, Papua New Guinea | L1C_T56MMA_A025138_20200415T001721 | 15 April 2020 | Zheng et al. [22] |
| L1C_T56MMA_A016301_20200420T001716 | 20 April 2020 |
Table 4.
Pumice extraction performance from the threshold sensitivity analysis. The algorithm performance using determined threshold values from this study has an overall accuracy of 95.5% and a kappa coefficient of 0.909.
Table 4.
Pumice extraction performance from the threshold sensitivity analysis. The algorithm performance using determined threshold values from this study has an overall accuracy of 95.5% and a kappa coefficient of 0.909.
| Threshold | Determined Values | Test Values | Overall Accuracy | Kappa Coefficient |
|---|---|---|---|---|
| Tpri | 0.003 | 0.006 | 89.0% | 0.780 |
| 0 | 92.3% | 0.845 | ||
| Tsw | −0.15 | 0 | 84.8% | 0.697 |
| −0.3 | 95.0% | 0.900 | ||
| Tse | −0.02 | 0 | 94.4% | 0.887 |
| −0.04 | 95.3% | 0.906 | ||
| Tce | Std_492 | 2 × Std_492 | 94.9% | 0.899 |
| 0 | 94.7% | 0.893 | ||
| T’se | Std_665 | 2 × Std_665 | 94.9% | 0.899 |
| 0 | 95.0% | 0.899 |
Publisher’s Note: MDPI stays neutral with regard to jurisdictional claims in published maps and institutional affiliations. |
© 2022 by the authors. Licensee MDPI, Basel, Switzerland. This article is an open access article distributed under the terms and conditions of the Creative Commons Attribution (CC BY) license (https://creativecommons.org/licenses/by/4.0/).
Share and Cite
MDPI and ACS Style
Chen, X.; Sun, S.; Zhao, J.; Ai, B. Spectral Discrimination of Pumice Rafts in Optical MSI Imagery. Remote Sens. 2022, 14, 5854. https://doi.org/10.3390/rs14225854
AMA Style
Chen X, Sun S, Zhao J, Ai B. Spectral Discrimination of Pumice Rafts in Optical MSI Imagery. Remote Sensing. 2022; 14(22):5854. https://doi.org/10.3390/rs14225854
Chicago/Turabian StyleChen, Xi, Shaojie Sun, Jun Zhao, and Bin Ai. 2022. "Spectral Discrimination of Pumice Rafts in Optical MSI Imagery" Remote Sensing 14, no. 22: 5854. https://doi.org/10.3390/rs14225854
Note that from the first issue of 2016, this journal uses article numbers instead of page numbers. See further details here.