
Spatiotemporal Assessment of Forest Fire Vulnerability in China Using Automated Machine Learning
by
 ,
,
Hongge Ren
1,2,3, 
Li Zhang
1,2,
Min Yan
1,2,*,
Bowei Chen
1,2,
Zhenyu Yang
1,4 and
Linlin Ruan
1,2,3 1
Key Laboratory of Digital Earth Science, Aerospace Information Research Institute, Chinese Academy of Sciences, Beijing 100094, China
2
International Research Center of Big Data for Sustainable Development Goals, Beijing 100094, China
3
University of Chinese Academy of Sciences, Beijing 100049, China
4
School of Marine Technology and Geomatics, Jiangsu Ocean University, Lianyungang 222005, China
*
Author to whom correspondence should be addressed.
Remote Sens. 2022, 14(23), 5965; https://doi.org/10.3390/rs14235965
Submission received: 10 October 2022
/
Revised: 21 November 2022
/
Accepted: 22 November 2022
/
Published: 25 November 2022
(This article belongs to the Section Forest Remote Sensing)
Abstract
:Frequent forest fires cause air pollution, threaten biodiversity and spoil forest ecosystems. Forest fire vulnerability assessment is a potential way to improve the ability of forests to resist climate disasters and help formulate appropriate forest management countermeasures. Here, we developed an automated hybrid machine learning algorithm by selecting the optimal model from 24 models to map potential forest fire vulnerability over China during the period 2001–2020. The results showed forest aboveground biomass (AGB) had a vulnerability of 26%, indicating that approximately 2.32 Gt C/year of forest AGB could be affected by fire disturbances. The spatiotemporal patterns of forest fire vulnerability were dominated by both forest characteristics and climate conditions. Hotspot regions for vulnerability were mainly located in arid areas in western China, mountainous areas in southwestern China, and edges of vegetation zones. The overall forest fire vulnerability across China was insignificant. The forest fire vulnerability of boreal and temperate coniferous forests and mixed forests showed obviously decreasing trends, and cultivated forests showed an increasing trend. The results of this study are expected to provide important support for the forest ecosystem management in China.
1. Introduction
Forests are key components in terrestrial systems that provide many ecosystem services contributing to climate mitigation [1,2] and human well-being [3,4]. Forest fire remains one of the main natural and widespread disturbance factors. Although forests can resist some surrounding environmental changes, fires damage forest ecosystems and increase their vulnerability to environmental changes [5,6,7]. As a result, quantifying forest vulnerability to fire disturbances and understanding the underlying mechanisms are critical for projecting climate impacts and developing effective adaptation strategies [8].
Forest ecosystem vulnerability results from both natural and anthropogenic activities [9,10], and high vulnerability generally results in reduced forest area, dramatic mass reduction in biomass, gradual loss of biodiversity, decline of forest ecological functions and deterioration of system stability [11,12]. However, a widely accepted and operational framework for evaluating forest ecosystem vulnerability to disturbances, including exotic pests, habitat destruction, and fire [13,14,15], remains to be outlined [16]. Forest fire has been viewed as the most common and serious hazard in forest ecosystems [17] because of the warmer and drier climate conditions [18,19,20]. Forest fire vulnerability is often defined as the potential loss from fire [21]. Several scholars have investigated forest fire vulnerability at regional scale. Amalina et al. [22] developed a fire vulnerability map in Way Kambas National Park based on biophysical and human disturbance factors and classified the vulnerability into high, medium, and low levels. Dupire et al. (2019) explored alpine forest fire vulnerability by simulating fire behavior and ultimately post-fire tree mortality using surface fuel measurements, forest inventory and fire weather data. They found that summer fires occurring in extremely dry conditions promote high mortality across all forest communities with different climatic conditions. Buotte et al. [23] calculated and predicted recent forest vulnerability to drought and fire in the western United States based on simulated future changes in burned area relative to historical burned area. They indicated that the proposed drought vulnerability metrics can be incorporated into Earth system models as probabilistic mortality rates. Forzieri et al. [8] defined forest vulnerability as the relative biomass loss following the occurrence of a given disturbance and quantified the vulnerability of European forests to fires, windthrows and insect outbreaks during the period 1979–2018 by the random forest regression method. They showed that about 33.4 billion tonnes of forest biomass could be seriously affected by these disturbances, with higher relative losses when exposed to windthrows (40%) and fires (34%) compared with insect outbreaks (26%). Overall, the current methods for vulnerability estimation can be summarized into two categories: knowledge-based and data-based methods. The knowledge-based method is determined by expert systems and a priori knowledge to capture and assess vulnerability, for example, the AHP-fuzzy integrated evaluation method [24], landscape ecology method [25], gray cluster analysis method [26], and principal component analysis method [27]. Such methods typically adopt a priori knowledge to identify the functional relationships and the possible amplification or dampening effects that may emerge at local scale from interactions among multiple factors [8]. The data-based method applies in vulnerability assessment with more complete data, mainly including machine learning or deep learning methods [28]. With the advancement of vulnerability concepts, the enrichment of indicator systems, and the expansion of data availability in recent years, popular methods have shifted from mathematical knowledge-based methods to spatiotemporal analysis in view of machine learning models. Machine learning can effectively identify patterns and trends of complex problems without human intervention. The newly developed automated machine learning (AutoML) framework is more efficient and flexible than a single machine learning algorithm. It has the advantages of accurately selecting specific algorithms for hyperparameters, using cross validation to adjust the model to avoid over fitting, and training stacked models [29,30]. As a comprehensive issue, forest fire vulnerability is involved in forest vegetation characteristics, climate and landscape characteristics. Therefore, it is necessary to assess forest fire vulnerability using AutoML at large scales.
For a long time, forest fire prevention and control have been very important factors included in China’s ecological planning. However, due to natural and historical factors, forest fires have occurred frequently in China. According to the China Forestry Statistical Yearbook, a total of 58,545 forest fire accidents occurred in China from 2008 to 2018 [31]. Although they displayed an overall downward trend, the frequency of forest fires is still high [32]. Currently, forest fire vulnerability in China is primarily estimated using data from provincial field surveys with a coarse resolution (around 300,000 km2) [33,34,35,36], and detailed forest fire vulnerability under different vegetation types and climatic zones is still lacking. The increasing high-spatial-resolution satellite datasets could support large-scale comprehensive efforts for regional forest parameters and disturbances. Compared with traditional forest surveys, remote sensing has the advantages of large detection range, fast data acquisition, fewer ground restrictions, and a large amount of information acquisition [37,38]. Technologically, the combination of machine learning and massive computation assists large-scale ecosystem vulnerability assessment effectively [39,40]. Thus, more systematic and in-depth research on forest vulnerability assessment in China is necessary [41,42].
In this paper, forest fire vulnerability was investigated using AutoML over China from 2001 to 2020. The specific objectives of this study were to: (1) develop a novel framework for vulnerability assessment using multisource datasets and AutoML; (2) explore the spatial and temporal patterns of vulnerability and detect possible forest hotspots that are highly sensitive to fire disturbance; and (3) discover the driving factors affecting forest vulnerability to fire. This work will shed fresh light on the quantification of the spatial and temporal vulnerability of natural disturbances on ecosystems.
2. Study Area
Forests cover approximately 21.63% (2009–2013) of the land surface in China and have a carbon stock of approximately 84.27 billion tons [43]. China’s forests range from boreal forests in the northeast to tropical rainforests in south and southwest, which include almost all major forest biomes in Northern Hemisphere [44]. They provide a set of ecosystem services that contribute to human well-being and climate regulation.
Forest distribution and types (Figure 1) in China were obtained by integrating the forest cover data from the Terra MODIS Vegetation Continuous Fields (VCF) product [45] with the 1:1,000,000 vegetation type map from The Data Center for Resources and Environmental Sciences, Chinese Academy of Sciences (RESDC, http://www.resdc.cn, accessed on 6 November 2021). We extracted the areas with tree cover greater than 10% and patches area greater than 0.5 hectares as forests from annual VCF product from 2001 to 2020 [46]. Then, the forests were further classified into alpine vegetation, broad-leaved forest, mixed forest, coniferous forest, shrub forest and artificial forest based on the 1:1,000,000 vegetation type map. To investigate the spatial differences of fire vulnerability, we used the Vegetation Regionalization Map of China from RESDC. From east to west, vegetation distribution was determined by moisture conditions, ranging from humid to dry, the area was divided into forest zones (I, II, III, IV and V), temperate grasslands zone (VI) and temperate desert zone (VII) [47]. From north to south, vegetation distribution was determined by the temperature, forest zones were further categorized into cold-temperate needleleaf forest zone (I), temperate coniferous and broadleaf mixed forests zone (II), warm-temperate deciduous broadleaf forests zone (III), subtropical evergreen broadleaf forests zone (IV) and tropical monsoon rainforest and rainforest zone (V) [48]. Considering the influence of vertical zonality or other non-zonal factors (such as geomorphic structure), the Qinghai-Tibetan Plateau alpine vegetation zone was divided.
3. Data and Methodology
Forest fire vulnerability was expressed as the relative loss of aboveground biomass (AGB) following the occurrence of a given fire disturbance. The workflow of the annual potential forest fire vulnerability map in China is presented in Figure 2. In this section, we provide a list of data collection and preprocessing (Section 3.1), dimensionality reduction in explanatory variables (Section 3.2.1), vulnerability models evaluation and selection (Section 3.2.2 and Section 3.2.3), and spatiotemporal patterns and key drivers of forest fire vulnerability (Section 3.2.4).
3.1. Data Collection and Preprocessing
Fire data were retrieved from the Global Wildfire Information System (GWIS, https://gwis.jrc.ec.europa.eu/ (accessed on 9 October 2022)) using the MODIS dataset MCD64A1, and this product was computed by an algorithm relying on encoding in a graph structure a space–time relationship among patches of burned areas [49]. Each fire record was represented by a vector feature describing the spatial range of the damaged forest patch. The results were verified by visual aerial photointerpretation, satellite imagery, and field surveys [49]. We obtained a fire record database containing 107,168 forest fire records in China from 2001 to 2019 by overlying the observed fire area with the annual forest area.
Time series annual AGB are required to assess the expected AGB loss for a given fire disturbance event. To reconstruct annual AGB changes over 2001 and 2020, we integrated 100 m aboveground AGB map (AGB2010) in 2010 as the reference data from the European Space Agency-Data User Element Global Biomass Project (https://globbiomass.org/products/globalmapping/ (accessed on 15 September 2021)) [50] and MODIS VCF product [45]. Time series AGB maps were reproduced under the assumption that AGB changes are entirely dependent on the change in forest cover, similar to the approach used by Forzieri et al. [8]. For each fire-disturbed forest area at year t in the fire record database, the relative AGB loss (AGBLrel) was quantified based on the difference of the AGB before and after disturbance. We also computed one-year-lagged AGB (AGBlag) estimates to retrieve information on carbon stocks of the recent past. The equations are as follows:
where is the relative AGB loss caused by fire disturbance. is the AGB map of fire disturbances in year t. is the AGB map before fire disturbances for year t − 1. is the AGB map after fire disturbance for year t + 1. To focus on effective fire disturbance events, records with > 5% were selected, and yielding 90,208 events in total.
We collected 26 variables, including forest features, climate and landscape factors, which were used as potential predictors in the vulnerability models. Table 1 shows the explanatory variables used in the vulnerability models. These variables were collected from multiple sources, including satellite images and reanalysis products. Data collection and processing were completed on the Google Earth Engine cloud platform. Please see Appendix A for specific information on explanatory variable extraction and processing.
We extracted the explanatory variables for each of the fire records to train the vulnerability models. Specifically, the explanatory variables were spatially averaged according to each fire-burned forest area. Considering the loss of forest features before and after fire, we deleted the fire records if the variables had null values or the change in LAI was less than 5%. Finally, we built a forest fire record database with 41,188 fire records. Each fire record consisted of multiple attributes, including AGBLrel and multiple explanatory variables. Spatial distribution maps of all explanatory variables were obtained and converted to raster with 1000 m resolution for the fire vulnerability prediction in China.
3.2. Methodology
3.2.1. Vulnerability Indicator Construction
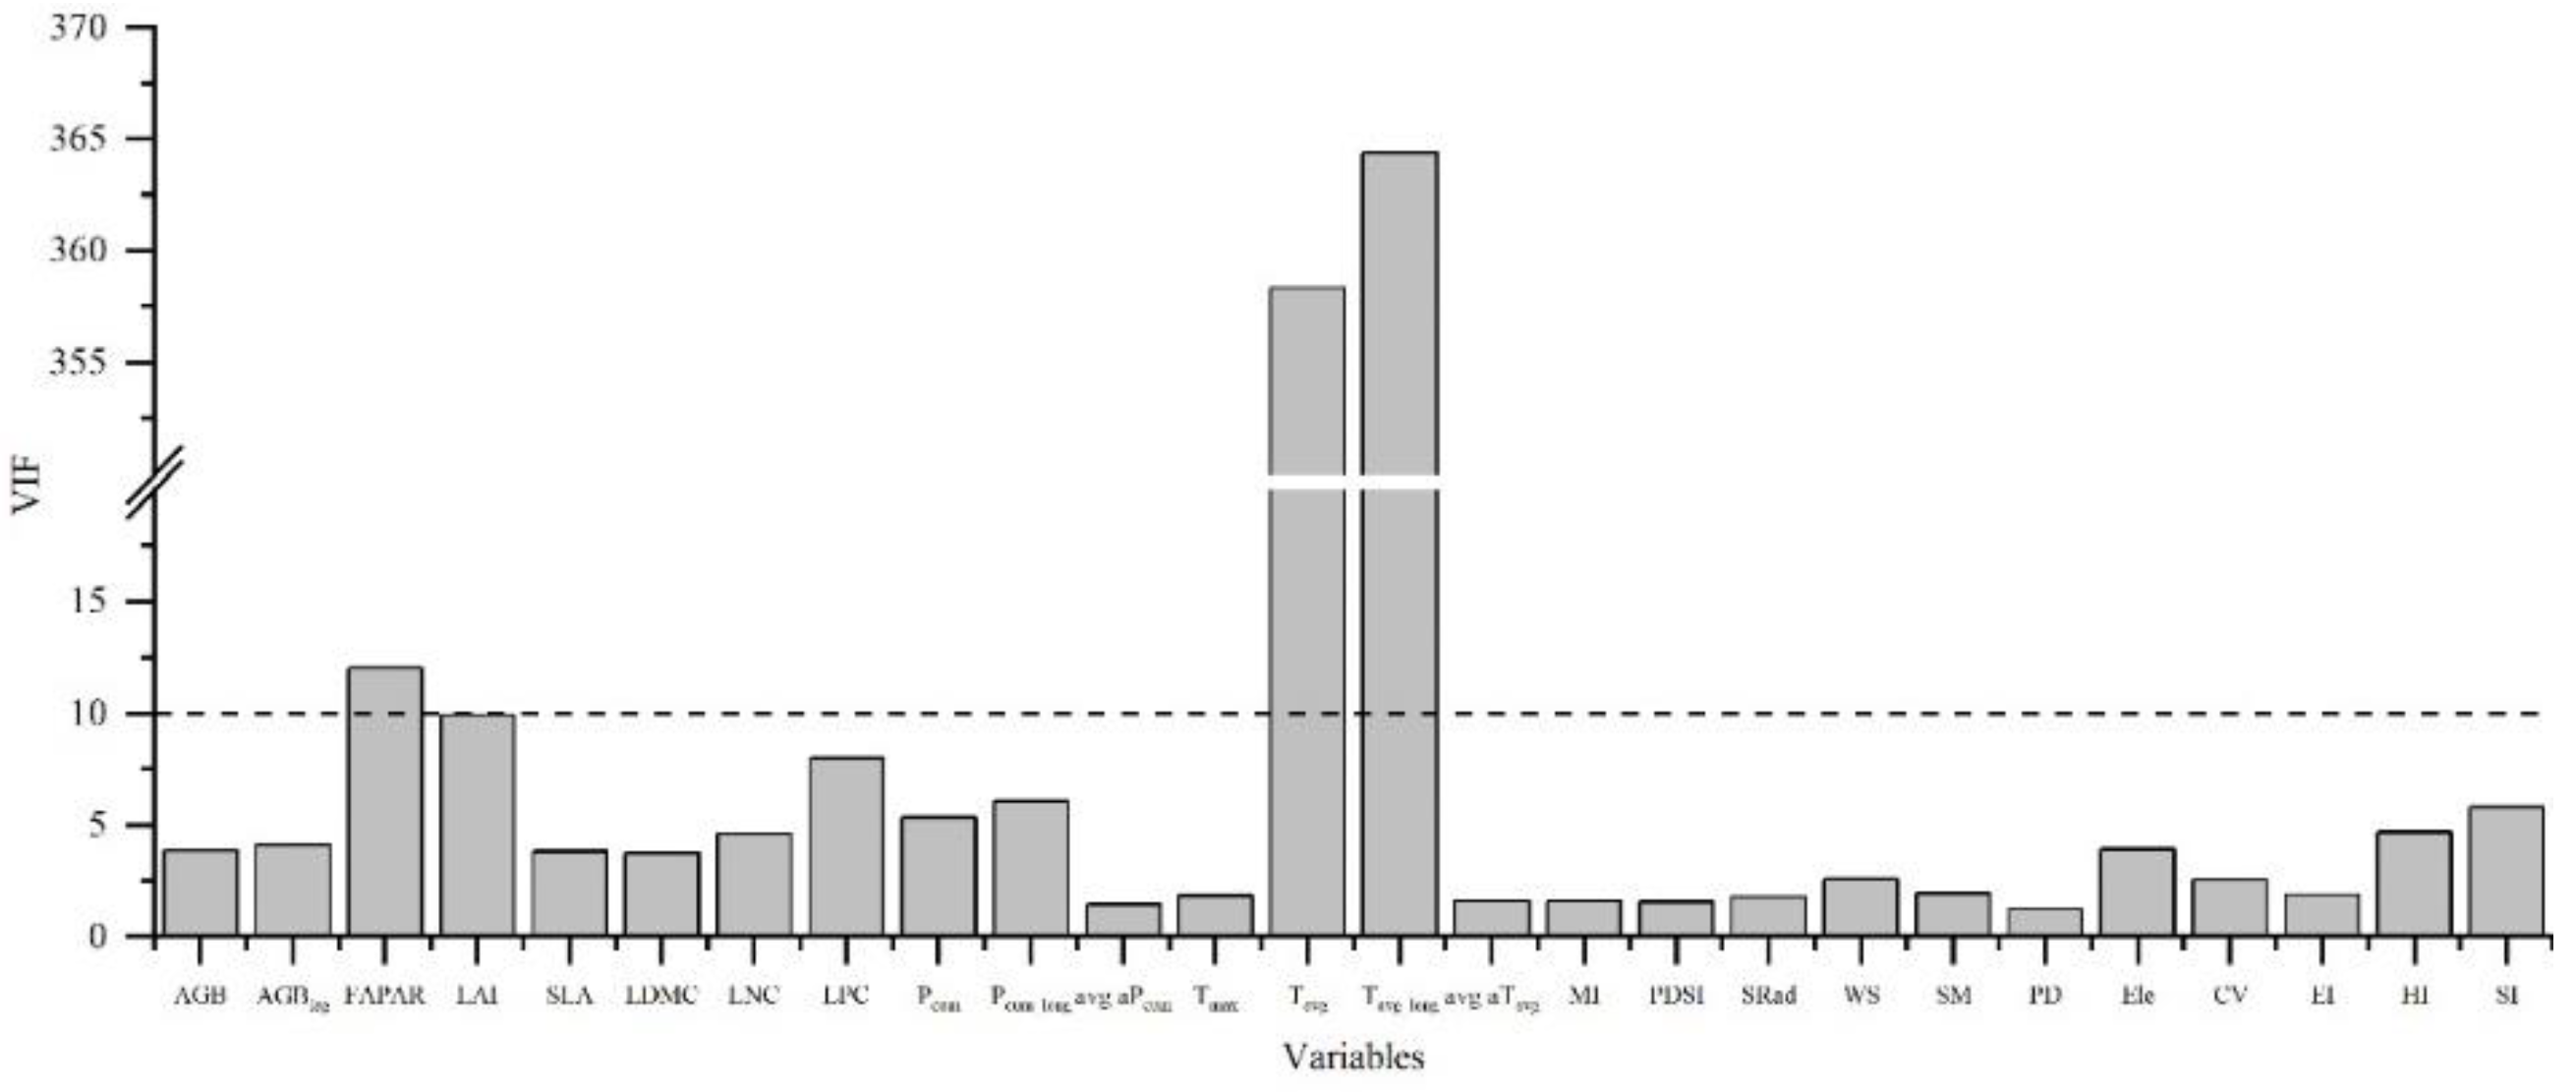
The variance inflation factor (VIF) was widely used to quantify the collinearity among the explanatory variables [51,52,53]. VIF is calculated from the correlation determination coefficient in the regression analysis:
where is the square of the correlation determination coefficient of independent variable xi for the regression analysis of other independent variables. The VIF values were determined using the “car” package in R version 4.1.1. The results showed that the VIF values of FPAR, Tavg and Tavg_long were greater than 10 (Appendix A: Figure A1). Thus, we removed these 3 variables and finally obtained 23 explanatory variables for vulnerability modeling.
3.2.2. Vulnerability Modeling Based on the Regression Method of Auto ML
Vulnerability expresses the degree to which a forest ecosystem is affected when exposed to a given fire disturbance. In this study, we quantified the vulnerability in terms of potential relative AGB losses (PBLrel) following the occurrence of a specific fire (0 means a forest is not vulnerable to the given fire events, and 1 means a forest is completely damaged when exposed to the given fire events).
We developed and tested an optimal AutoML model to predict the observed AGBLrel (response variable) based on 23 explanatory variables (predictors/features). We randomly selected 75% (30,888 fire records) of the forest fire record database for training the vulnerability model and 25% (10,300 fire records) for verifying the results.
AutoML makes the machine learning available for non-machine learning experts, improves efficiency of machine learning and accelerates research on machine learning [54,55]. H2O AutoML interface was used to generate a regression model for fire disturbance vulnerability estimation. H2O AutoML is an machine learning framework that enables the automated training of a large selection of candidate models on a dataset [39]. The framework included many popular machine learning algorithms, such as the simple/deep neural network (NN) [56,57], generalized linear model (GLM) [58,59], gradient boosting machine (GBM) [60,61], distributed random forest (DRF) [62,63], and stacked ensemble learning of these models [54,64]. The H2O AutoML interface performs random grid searches to select machine learning models and automatically completes hyperparameter optimization for each model. Finally, 24 models were developed based on the training set.
3.2.3. Performance Metrics
To evaluate the performances of the AutoML models, the estimated PBLrel was evaluated against the AGBrel by the root mean square error (RMSE), mean square error (MSE), mean absolute error (MAE) and root mean squared logarithmic error (RMSLE). The coefficient of determination (R2) between the simulation results of the optimal model and the AGBrel in the test set was also calculated. These statistical indexes are calculated using the following equations:
where is the i-th estimated PBLrel and is the i-th sampled AGBrel in the test set. is the average value of all sampled AGBrel in the test set, and n is the number of sampled AGBrel in the test set.
3.2.4. Spatiotemporal Patterns and Key Drivers of Forest Fire Vulnerability
The best-performing model in AutoML was used to evaluate the vulnerability of forests annually between 2001 and 2020 for each grid cell (1 × 1 km2) in China. The potential absolute AGB loss (PBLobs) was constructed by multiplying the estimated PBLrel by the available biomass. Therefore, the vulnerability value in each grid cell reflects the biomass (relative or absolute) that will be affected when exposed to fire disturbance based on its specific local and temporal environmental conditions. The temporal and spatial vulnerability patterns and driving mechanisms were analyzed in R.
To better understand fire disturbance vulnerability in various forest biomes, we compared the vulnerability in different vegetation zones by regional statistical methods using the “raster” and “rgdal” packages in R.
Long-term trends in vulnerability were quantified for 2001–2020 by forest types and grid level, and their trend and significance were measured by 2-sided Mann–Kendall tests using the “Kendall” package in R. Kendall’s rank correlation coefficient (τ) indicated the strength of the vulnerability trend, and positive or negative values indicated an upward or downward trend, respectively. Kendall’s p represents the significance level of the trend statistics, with the significance set to p < 0.1.
The variable importance tool describes the extent to which covariables contribute to the results of the prediction model [65]. We quantified and ranked how individual explanatory variables affected forest fire vulnerability through “caret” package and “iml” package in R. For each of the explanatory variables, we also performed a correlation analysis comparing vulnerability against each of the datasets at the pixel level using Spearman’s correlation coefficient by gridcorts in R [66].
4. Results
4.1. Vulnerability Model Evaluation
Table 2 shows the statistical error results of the vulnerability models of PBLrel and AGBrel in the training set. The accuracy of different types of models ranked as follows: stacked ensemble > GBM > DRT > XRT > GLM > deep learning, according to the model accuracy from high to low. Through comparative analysis, we found that the accuracy evaluation results of the above machine learning models are similar. The optimal model explained 0.095 of the RMSE, with values of 0.009, 0.009, 0.067 and 0.074 for the mean residual deviance, MSE, MAE and RMSLE, respectively. The RMSE, MSE, MAE and RMSLE of the last ranked model were 0.201, 0.040, 0.165 and 0.154, respectively. Figure 3 shows R2 between the optimal model simulation PBLrel and AGBrel in the test set. The optimal model explained 63% of the correlation between the estimated relative biomass loss and the samples. This model was used to further generate the vulnerability distribution over China.
4.2. Spatiotemporal Patterns of Vulnerability
4.2.1. Spatial Distribution of Vulnerability
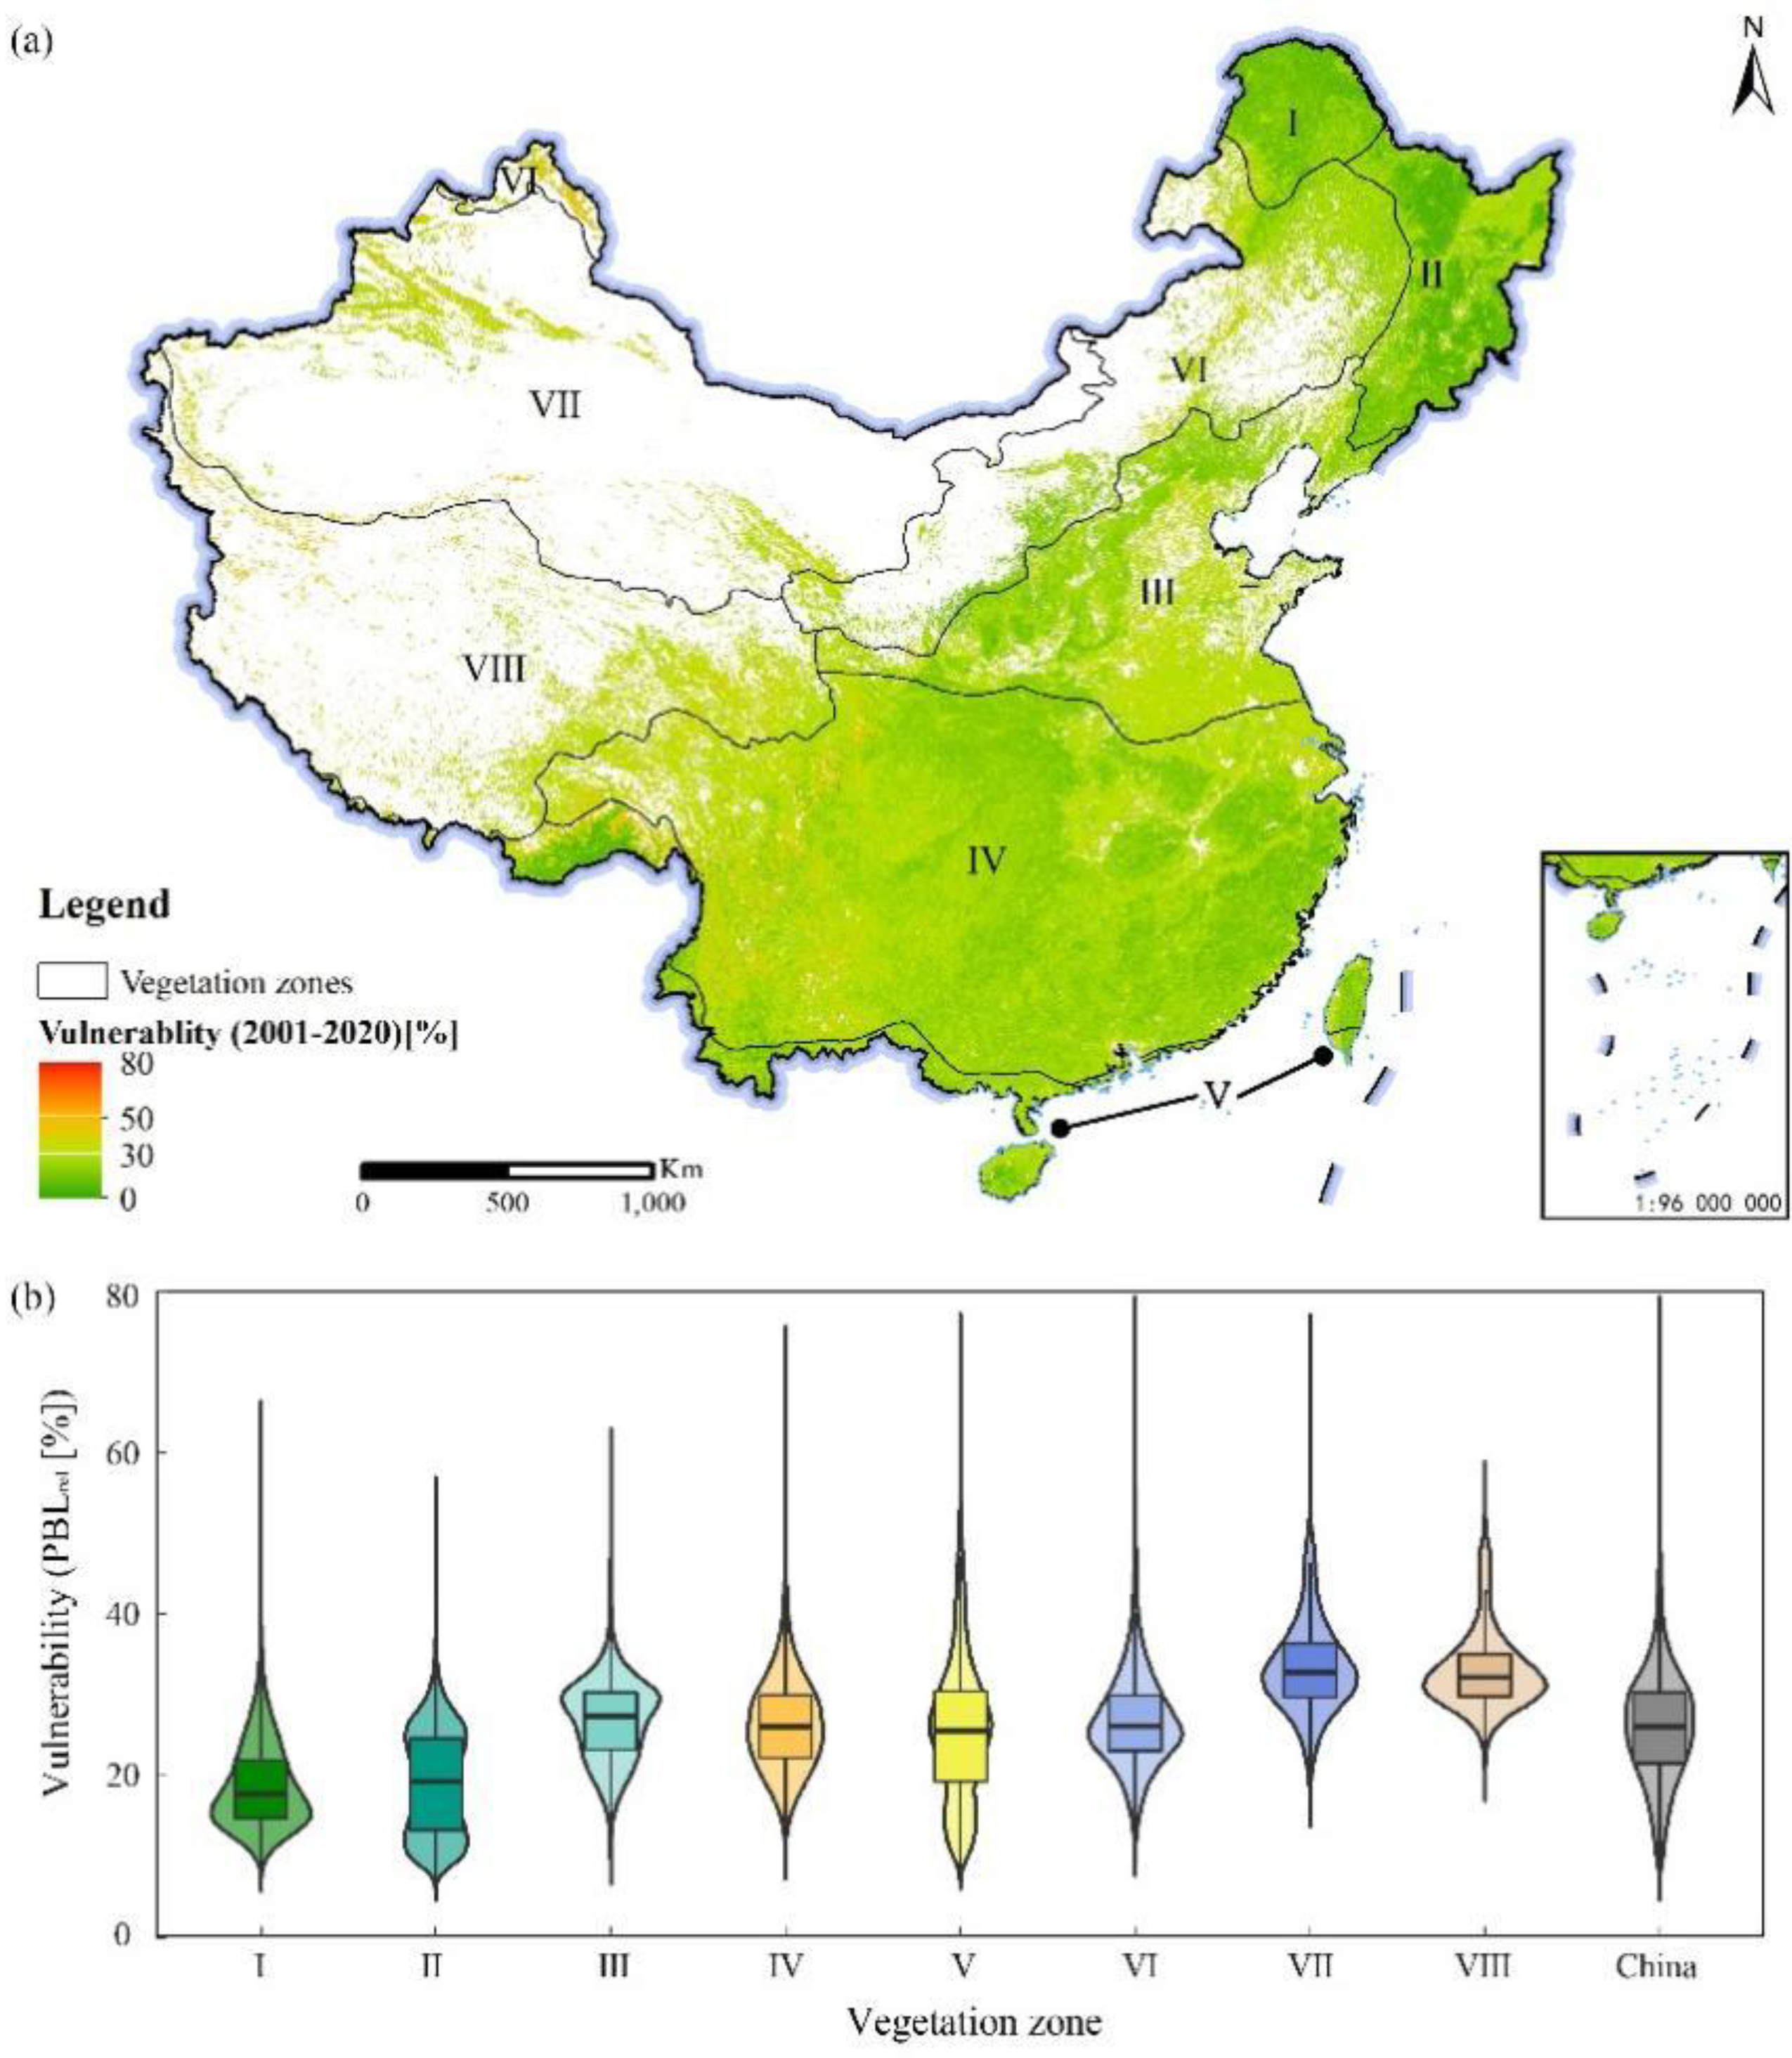
Figure 4 shows the average potential vulnerability of Chinese forests to fire disturbances from 2001 to 2020. The vulnerability to fires exhibited a potential relative AGB loss (PBLrel) of 26% (25.9–26%, 95% confidence interval). Considerable spatial variations in vulnerability emerged across China. Vulnerability to fire outbreaks generally occurred in dry and sparsely forested regions, with the PBLrel increasing from east to west and reaching as much as 80% (Figure 4a). Vulnerability to fires appeared to be high in the temperate grassland zone (VI), tropical monsoon rainforest and rainforest (V), temperate desert zone (VII) and subtropical evergreen broadleaf forest zone (IV), especially in the mountainous regions (such as the Kunlun and Tianshan Mountains, Qilian and Helan Mountains, Himalayas and Hengduan Mountains), with the median value of PBLrel exceeding 25% and reaching 75% locally. However, forests in the boreal and temperate coniferous forest zone (I) and temperate coniferous and broadleaf mixed forest zone (II) with cold and wet climates generally had lower values (Figure 4b).
Figure 5 shows PBLrel, PBLabs and the regional average AGB in the different vegetation zones. The lowest forest vulnerability to fire occurred in zones I and II, with values of 18.66% and 19.11%, respectively, and the mean AGB of these two regions was relatively high. However, they may not have been sufficiently disaster-prone environments (i.e., the annual rainfall in these areas was usually more than 600 mm, and the accumulated temperature was also low). The PBLabs values in these regions were not the highest, with values of approximately 0.14 and 0.21 Gt C/year. The vulnerability of VII and VIII was the highest, with values of 33.36% and 33.01%, respectively. Although the AGB in these places was low, because of the harsh climate conditions, their vulnerability was the highest, and the PBLabs was the lowest. The vulnerability of IV was also relatively high, which may be because the region provided sufficient fuel (the regional average AGB was the highest, at 39.79 mg C/hm2) and suitable climatic conditions for fire. In summary, climate and combustible conditions may be the main factors affecting fire vulnerability. As climate gradients such as precipitation and temperature become harsher, vulnerability to fire disturbance will increase.
4.2.2. Spatiotemporal Trend of Vulnerability
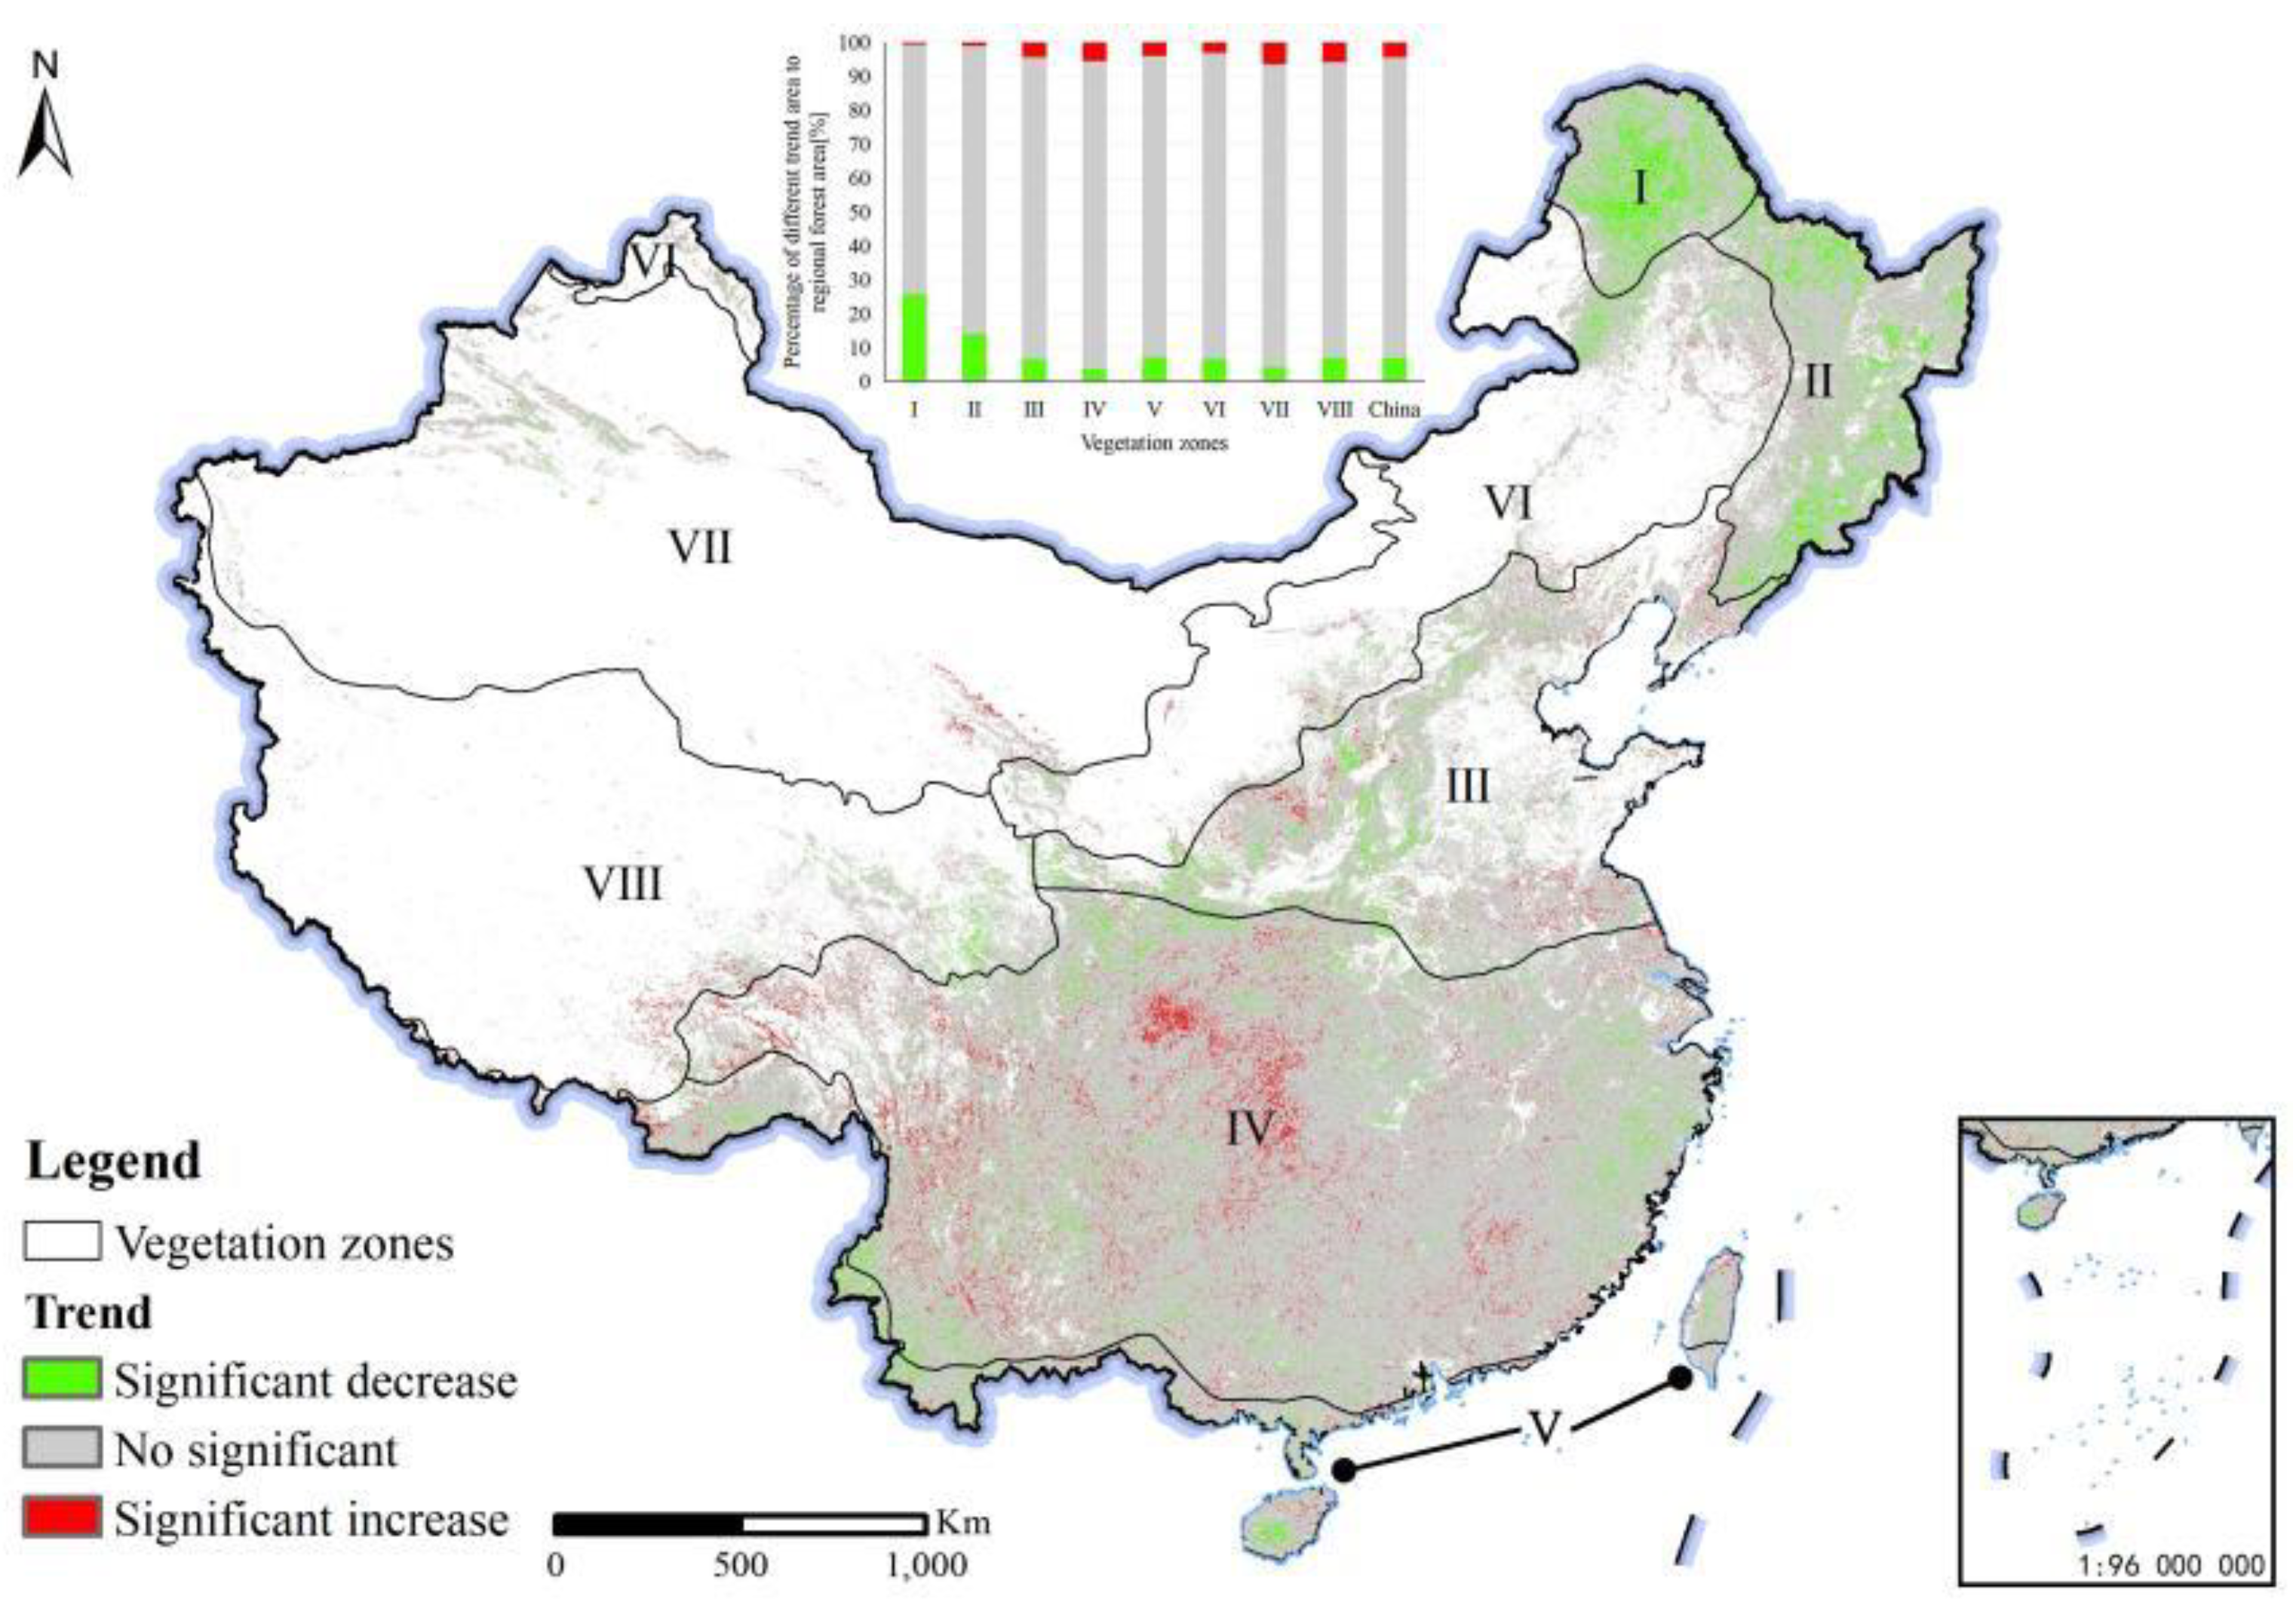
Figure 6 indicated the spatial distribution of the forest vulnerability trend from 2001 to 2020. In all, 89% of vegetated grids in China exhibited a nonsignificant trend. A significant decrease in forest vulnerability occurred in zone I and zone II (overall 7% of the forest vegetated grids), and a significant increase (4% of the forest vegetated grids) was mainly distributed in vegetation zone IV and zone VII.
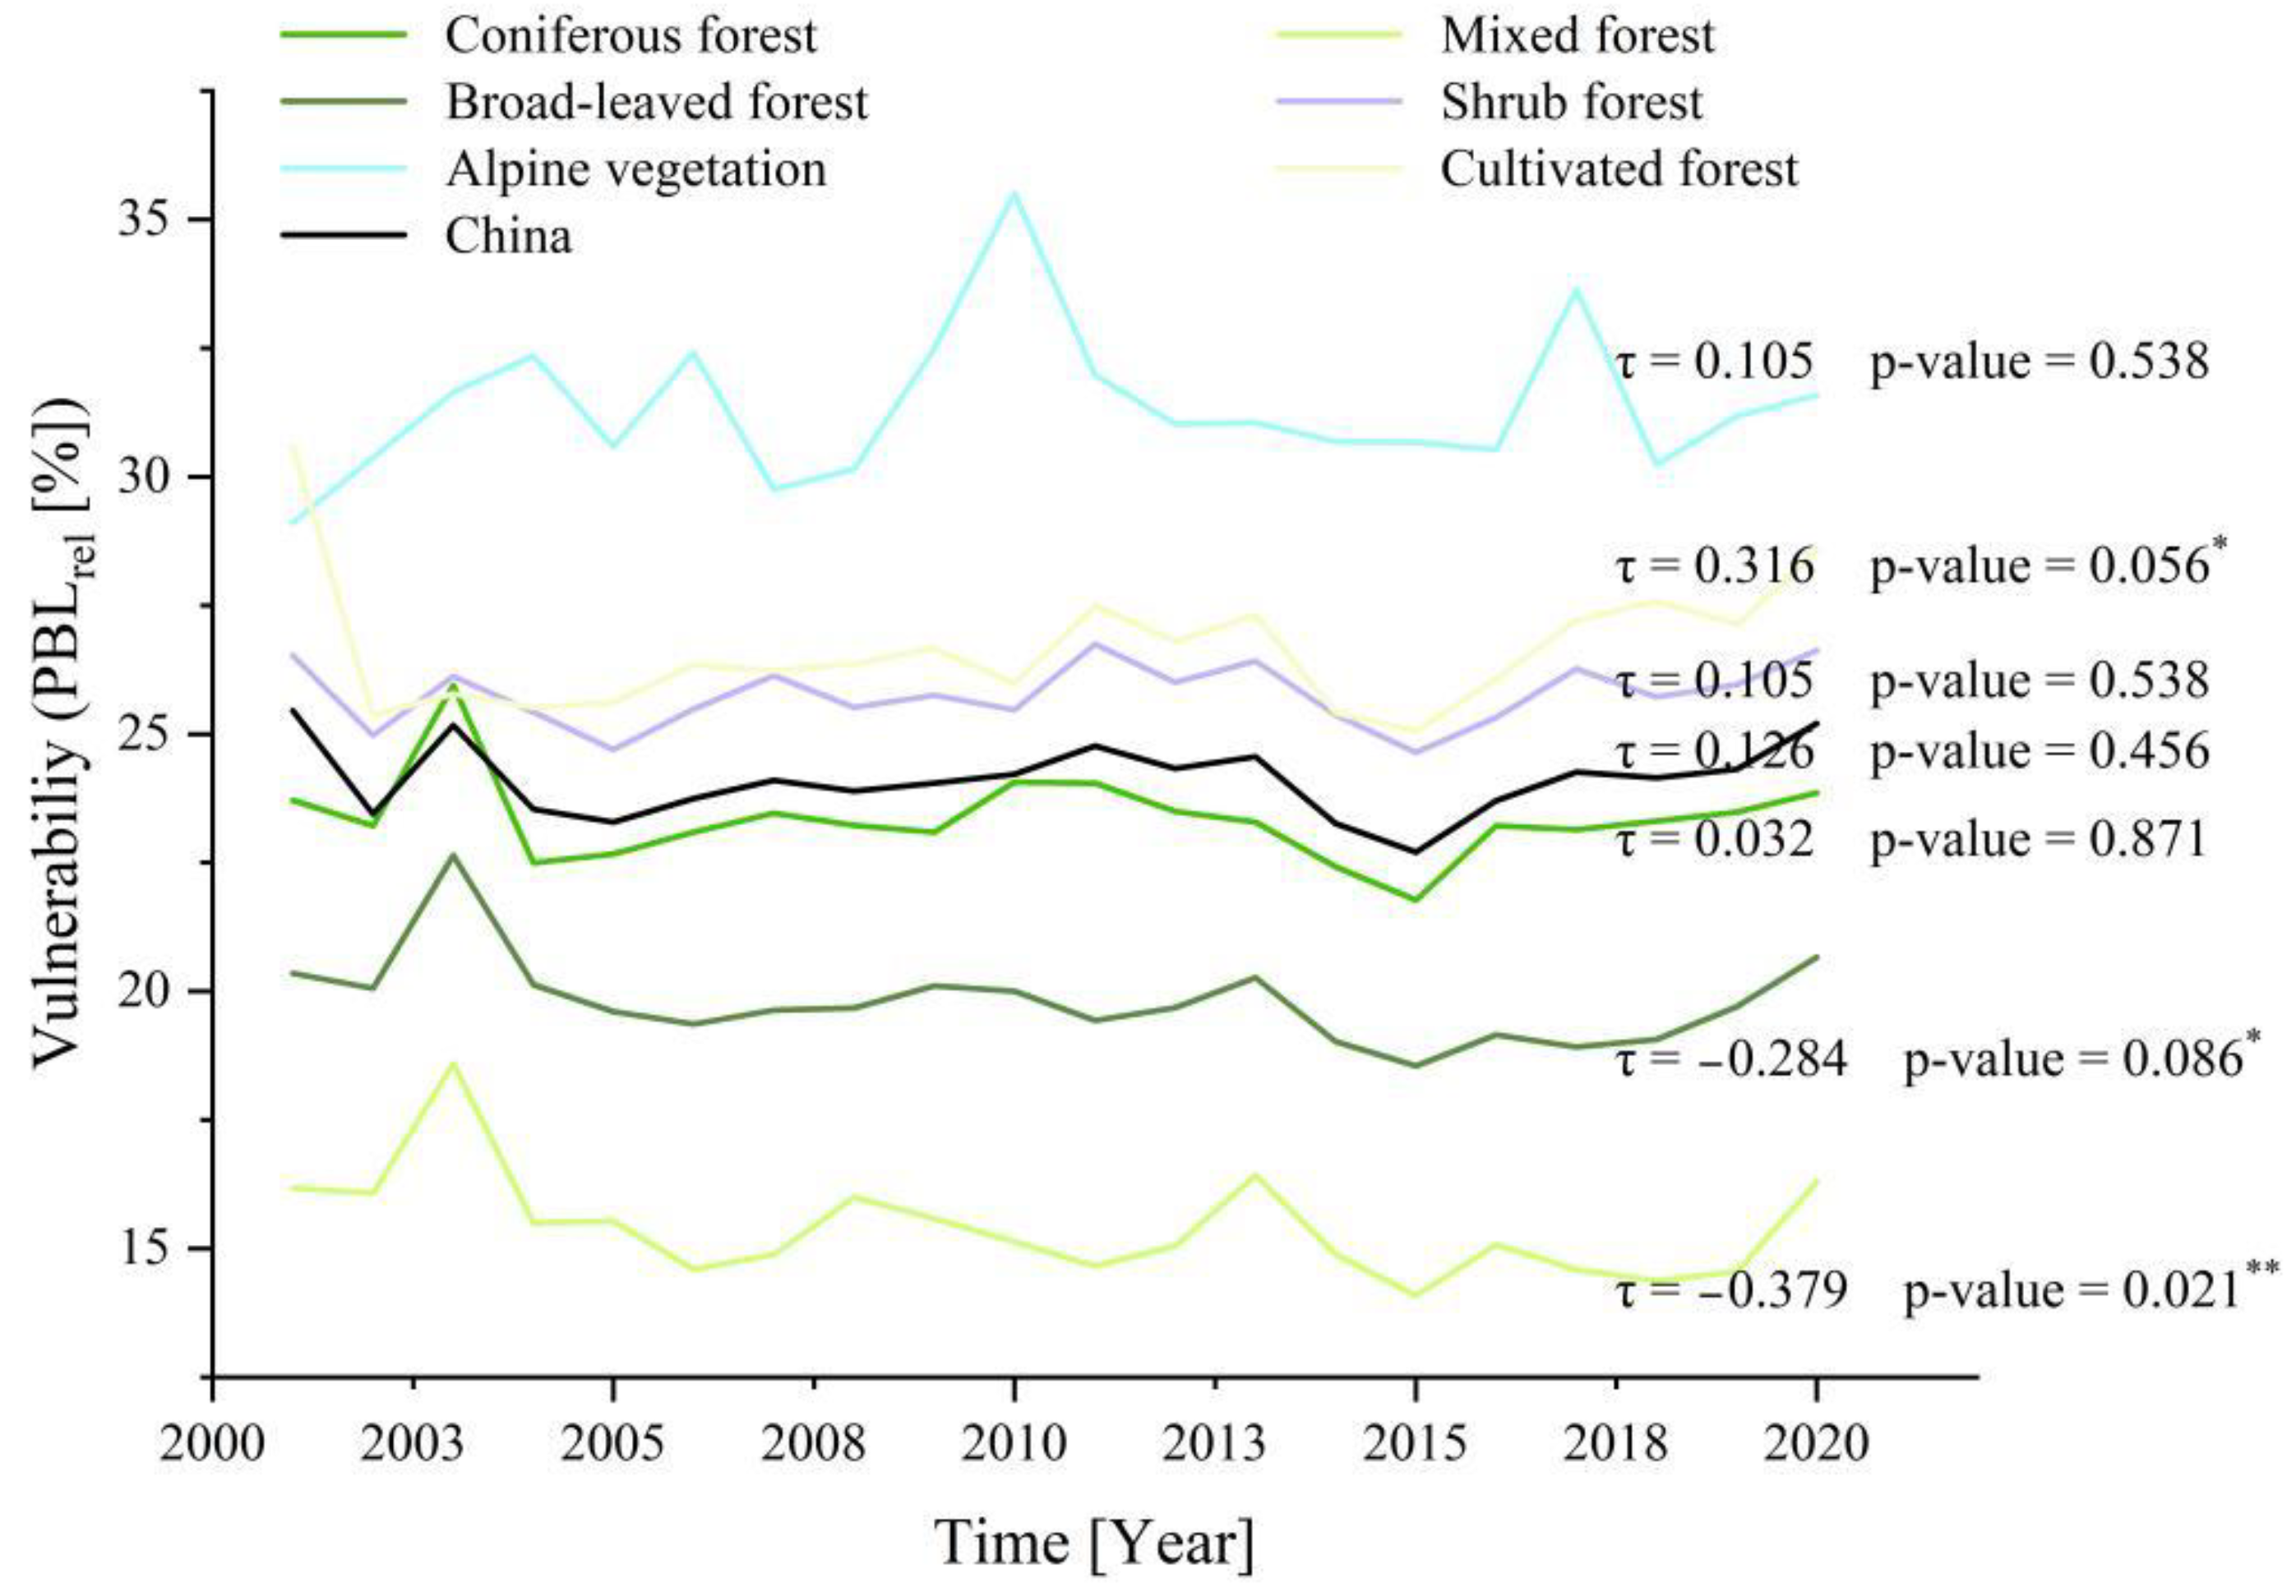
The temporal trends of forest vulnerability (PBLrel) to fire with different forest types from 2001 to 2020 are shown in Figure 7. Generally, alpine vegetation showed the highest mean vulnerability, followed by cultivated forests and shrub forests; in contrast, natural forests, especially mixed forests, had the lowest mean vulnerability. No significant temporal trend of forest fire vulnerability was found in terms of the mean vulnerability across China (τ = 0.126, p value = 0.656). In detail, only the cultivated forests increased significantly, with τ = 0.316 and p value = 0.056; mixed forests (τ = −0.379, p value = 0.021) and broad-leaved forests (τ = −0.284, p value = 0.086) showed obvious reductions in vulnerability to fire.
4.3. Key Drivers of Forest Fire Vulnerability
We quantified and ranked how individual explanatory variables affected forest fire vulnerability (Figure 8). The results showed that the forest features (e.g., AGB, AGBlag) influenced forest vulnerability the most, followed by the climate features and landscape features, with mean importance scores of 60.06, 4.83 and 3.20, respectively. Plant water stress indicated by low precipitation (Pcum) and the PDSI, and temperature stress indicated by the SRad, avg Tavg, and Tmax associated with very large fuel loads acted to further increase vulnerability. The HI, SI, EI and CV had the lowest importance scores, which was possibly due to the lower resistance and susceptibility to fire spread.
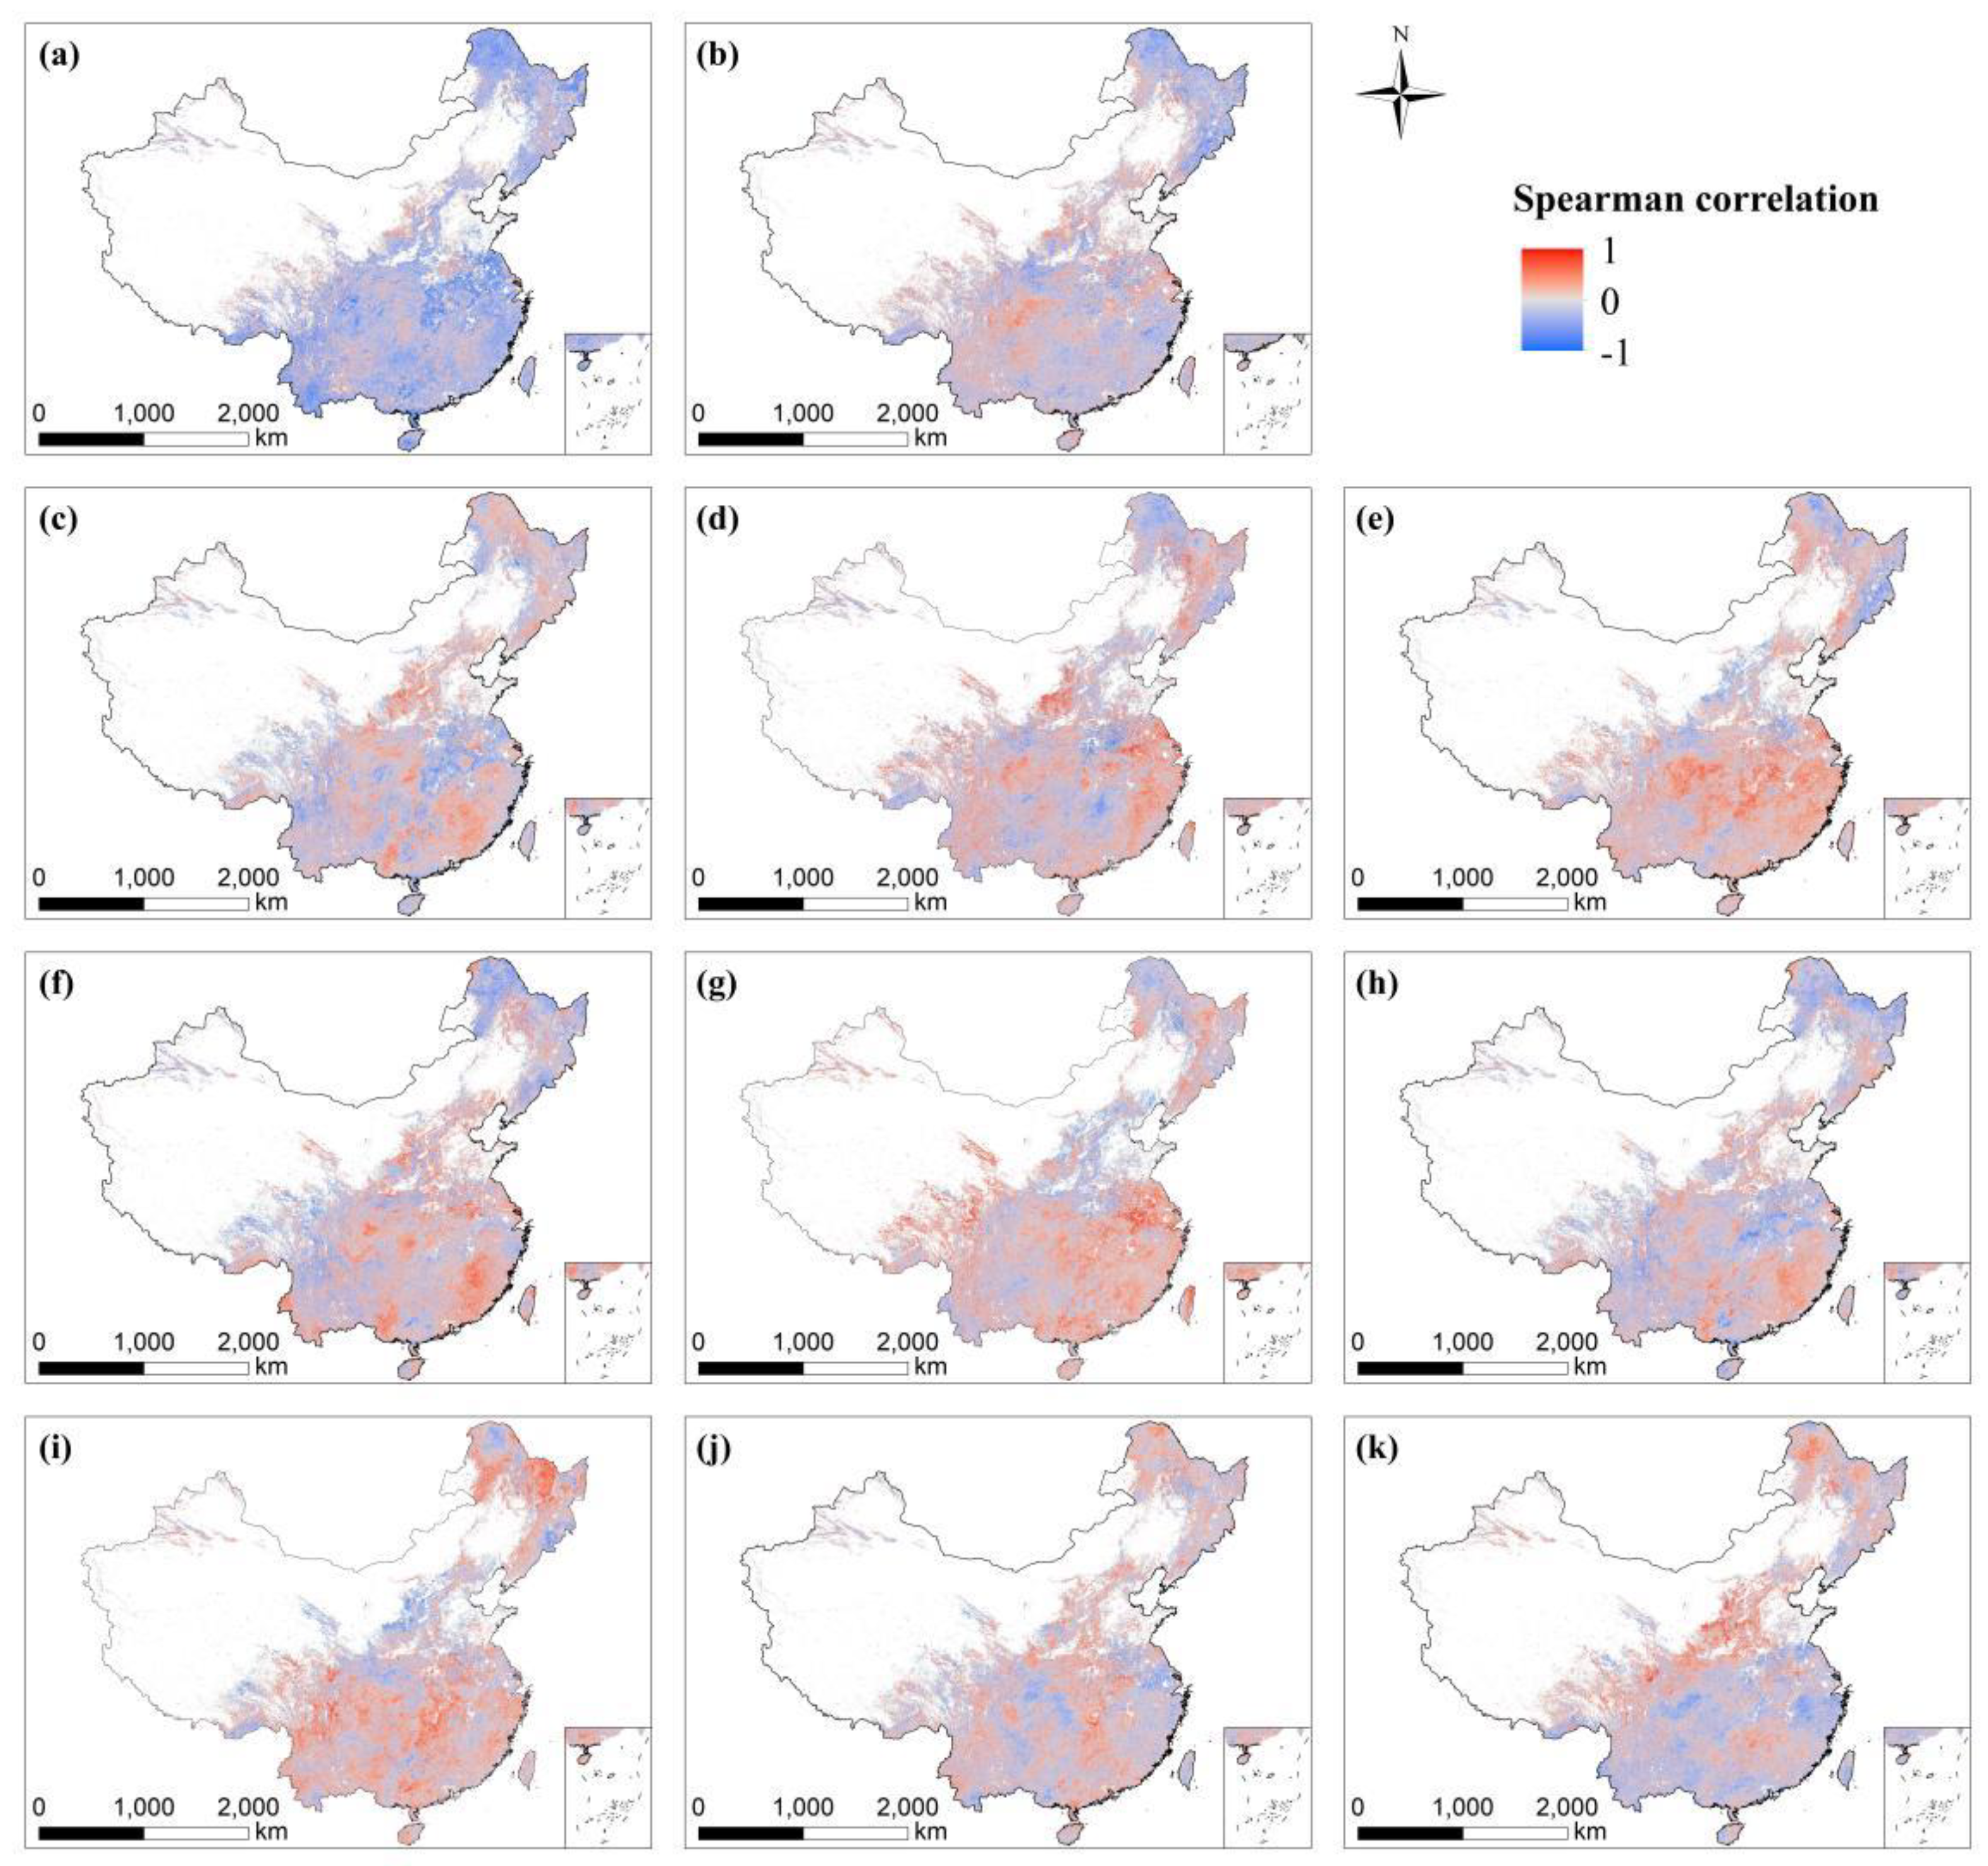
Correlations between several important features and forest vulnerability are shown in Figure 9. Generally, the AGB and LAI were negatively correlated with vulnerability, with mean Spearman’s coefficients of −0.24 and −0.07, respectively. In particular, a negative correlation occurred in regions with a high coverage of coniferous forest (e.g., Greater Khingan, Changbai Mountains). The PDSI (Figure 9h), Pcum (Figure 9c) and avg aPcum (Figure 9f) were negatively correlated with forest vulnerability, with mean correlations of −0.04, −0.03 and −0.01, respectively. The temperature factors Tavg (Figure 9d), Tmax (Figure 9e) avg aTavg (Figure 9g), and SRad (Figure 9i) with mean correlations of 0.02, 0.04, 0.05 and 0.05, respectively, were positively correlated with forest vulnerability.
5. Discussion
In this study, we investigated forest vulnerability to fire in China during 2001–2020, and multisource satellite products and explanatory variables were integrated into AutoML to acquire the most optimized model. Forest vulnerability to fire varied across China, and hotspot regions were concentrated in arid areas in western China, mountainous areas in southwestern China, and edges of vegetation zones. These results were consistent with the high fire frequency reported in previous studies in Tibet [67], northeast China’s Greater Khingan Range and the subtropical dry forest in southern Yunnan [68]. Concerning the forest vulnerability trend, few regions expressed significant reductions, especially in zones I and II of China, where the Three-North Shelterbelt [69,70] has been implemented to protect natural temperate forests. Additionally, decreased vulnerability indicated that forest susceptibility to fire improved due to strict forest protection policies, such as the complete prohibition of commercial logging of natural forests [71,72]. The forest area of zones I and II accounted for 6% of China’s forest area, but the regions with significantly reduced vulnerability accounted for 43% of China’s region.
Integrating all of the information regarding forest vulnerability, as we did in this study, has rarely been previously proposed at the national scale. The solution was a model with global representativeness, resistance to forest variability and environmental heterogeneity, and strengthened applicability and reliability. The bottom-up evaluation method is broadly used to estimate fire emissions [73,74], which are caused by burned area, fuel load, combustion and emission factors [67,75]. In this study, the potential affected AGB (PBLabs) was calculated by multiplying biomass by the carbon loss ratio (AGBLrel), while the fuel load, combustion and emissions were not determined. Therefore, the overestimation of AGB losses existed, which could lead to uncertainties in forest vulnerability evaluation. Quantifying the uncertainties from input data, model configuration, and other sources to optimize the model is necessary in future research.
Ecological projects, such as afforestation, returning farmland to forests and natural forest conservation, have provided substantial and long-lasting benefits in boosting the vegetation carbon sink of China’s terrestrial ecosystem [76,77]. Forest areas in China increased by 1.61 × 10⁴ km2 from 2000 to 2020 [78]. The forest vulnerability results among various forest types demonstrated that the forest vulnerability of plantations had a significant increasing trend, while the fire vulnerability of mixed forest and broad-leaved forest had a significant decreasing trend (Figure 6). Due to the differences in forest structure (e.g., forest age, forest size distribution, and canopy cover), plantations are more vulnerable to disasters [79,80]. Overall, our strategy revealed that forest vulnerability varied with forest structural characteristics and environmental conditions. In view of the expected persistence of future climate warming and the possible intensification of natural disturbances [14,81], forest ecosystem services may be challenged by these disturbances in the future. Our strategy can provide a potential way to understand the current vulnerability of forest carbon stocks and improve the ability of forests to resist disasters.
6. Conclusions
In this study, we proposed a new framework using AutoML to estimate forest vulnerability in China from 2001 to 2020. Multiple data were used to train the most optimized model and evaluate the estimations. The results showed that forest AGB had a vulnerability of 26%, corresponding to approximately 2.32 Gt C/year of forest AGB that could be affected by fire disturbances. The overall accuracy of the best vulnerability AutoML model expressed in terms of the R2 was approximately 63% of the correlation across the considered disturbances. The spatial pattern of forest vulnerability was strongly controlled by the interaction between forest features and climate. Hotspot regions for forest vulnerability were mainly located in the arid areas in western China, the mountainous areas in southwestern China, and at the edges of vegetation zones. No clear trend in overall forest vulnerability was found, except in boreal and temperate coniferous forest zones at high latitudes. Furthermore, the abnormal increase in temperature in the short term and water shortage significantly increased forest vulnerability to fire. Our study sheds light on the vulnerability of China’s forests to fire disturbances and the ongoing trends in response to changing climate conditions. The proposed methodology can provide new tools and insights for forest management.
Author Contributions
Conceptualization, H.R., L.Z. and M.Y.; Data curation, H.R.; Formal analysis, H.R. and M.Y.; Funding acquisition, L.Z. and M.Y.; Methodology, H.R., M.Y. and B.C.; Resources, H.R. and M.Y.; Software, H.R., B.C. and Z.Y.; Validation, Z.Y. and L.R.; Writing—original draft, H.R.; Writing—review and editing, L.Z., M.Y. and B.C. All authors have read and agreed to the published version of the manuscript.
Funding
This research was funded by the National Natural Science Foundation of China (grant numbers 41901364 and 42071305), and the Strategic Priority Research Program of the Chinese Academy of Sciences (grant number XDA19090132).
Data Availability Statement
The driven datasets used in this study are publicly available as referenced within the article. The generated vulnerability models are openly available in FigShare at https://figshare.com/s/226a8ada2734b643fbdb (accessed on 9 October 2022).
Acknowledgments
We thank all the scientists, software engineers, and administrators who contributed to the H2O community for providing such a great integrated platform of machine learning algorithms. We would like to thank the sharers or organizations of the public datasets used in this paper.
Conflicts of Interest
The authors declare no conflict of interest.
Appendix A. Explanatory Variables Extraction and Processing
- Explanatory variables extraction:
We collected 26 variables, including forest features, climate features and landscape features from multiple sources of satellites and reanalysis products. Table A1 shows the data sources of the explanatory variables used in the vulnerability models.

Table A1.
Data sources of the explanatory variables used in vulnerability models.
| Variables | Data Source |
|---|---|
| Forest features | |
| AGB | https://globbiomass.org/products/globalmapping/(2010) (accessed on 15 September 2021) and reconstruction of annual AGB time series |
| AGBlag | https://globbiomass.org/products/globalmapping/(2010) (accessed on 15 September 2021) and reconstruction of annual AGB time series |
| LAI | https://developers.google.com/earth-engine/datasets/catalog/NOAA_CDR_AVHRR_LAI_FAPAR_V5 (accessed on 17 September 2021) |
| FAPAR | https://doi.org/10.5067/MODIS/MCD15A3H.006 (accessed on 17 September 2021) |
| SLA | https://www.try-db.org/TryWeb/Home.php (accessed on 20 September 2021) |
| LDMC | https://www.try-db.org/TryWeb/Home.php (accessed on 20 September 2021) |
| LNC | https://www.try-db.org/TryWeb/Home.php (accessed on 20 September 2021) |
| LPC | https://www.try-db.org/TryWeb/Home.php (accessed on 20 September 2021) |
| Climate features | |
| Pcum | https://www.climatologylab.org/terraclimate (accessed on 14 September 2021) |
| Tavg | https://www.climatologylab.org/terraclimate (accessed on 14 September 2021) |
| Tmax | https://www.climatologylab.org/terraclimate (accessed on 14 September 2021) |
| SRad | https://www.climatologylab.org/terraclimate (accessed on 14 September 2021) |
| PDSI | https://www.climatologylab.org/terraclimate (accessed on 14 September 2021) |
| SM | https://www.climatologylab.org/terraclimate (accessed on 14 September 2021) |
| Pcum_long | Estimated |
| avg aPcum | Estimated |
| Tavg_long | Estimated |
| avg aTavg | Estimated |
| MI | Estimated |
| Landscape features | |
| CV | http://www.earthenv.org/texture (accessed on 2 October 2021) |
| EI | http://www.earthenv.org/texture (accessed on 2 October 2021) |
| SI | http://www.earthenv.org/texture (accessed on 2 October 2021) |
| HI | http://www.earthenv.org/texture (accessed on 2 October 2021) |
| Ele | https://www.usgs.gov/landresources/eros/coastal-changes-and-impacts/gmted2010 (accessed on 15 September 2021) |
| PD | http://ghsl.jrc.ec.europa.eu/ghs_pop.php (accessed on 22 September 2021) |
Forest features included vegetation parameters describing the forest state, productivity, and leaf traits, such as the AGB, leaf area index (LAI), fraction of absorbed photosynthetically active radiation (FPAR), leaf dry matter content (LDMC), leaf nitrogen content per leaf dry mass (LNC), leaf phosphorus content per leaf dry mass (LPC) and specific leaf area (SLA) [50,82].
To characterize the climate conditions, we first collected a series of climatic variables from the TerraClimate dataset. Data on the annual cumulated precipitation (Pcum), annual average temperature (Tavg), annual maximum temperature (Tmax), annual values of downward surface shortwave radiation (SRad), wind speed at 10 m (WS), Palmer drought severity index (PDSI) and soil moisture (SM) at a 0.5° spatial resolution for the period of 1958 to 2020 were used. Additionally, the long-term mean precipitation (Pcum_long) was quantified as the average of the annual cumulated precipitation (average temperature) for 1958–2020. Short-term average anomalies in cumulated precipitation (avg aPcum) were computed as the average value of the annual cumulative precipitation minus the long-term mean precipitation over the 6-year time window [t-5, t], where t is the year of the fire disturbance occurrence. The long-term mean temperature (Tavg_long) and short-term average anomaly in average temperature (avg aTavg) were quantified in a similar way to Pcum_long and avg aPcum. Furthermore, the moisture index (MI) was quantified as the minimum of the seasonal MIs in a year, which were derived as (seasonal cumulated precipitation)/(seasonal maximum temperature + 30) according to the modified version of the De Martonne index [83].
Landscape features included population density, geomorphological parameters and spatial variability of landscape patterns, such as the coefficient of variation (CV), evenness index (EI), Shannon index (SI) and homogeneity index (HI). Population density was retrieved from The Gridded Population of World Version 4 (GPWv4) for the years 2000, 2005, 2010, 2015 and 2020. Assuming that the population density in the upper and lower years of a given year remained unchanged, we obtained the population density data for all years from 2000 to 2020. The CV, EI, SI and HI were metrics provided by Global Habitat Heterogeneity Metrics Version 1 at a 1 km spatial resolution. Such spatial diversity metrics quantified the spatial heterogeneity of landscape patterns based on the textural features of enhanced vegetation index imagery acquired by the Moderate Resolution Imaging Spectroradiometer (MODIS) [84]. Elevation described key geomorphic features and was derived from the Global Multiresolution Terrain Elevation Data (GMTED2010) provided at a 250 m spatial resolution.
- Dimensional reduction and nonlinear processing of explanatory variables:
The VIF (variance inflation factor) score was introduced to quantify the multicollinearity among the explanatory variables. The results showed that the VIFs of the FPAR, Tavg and Tavg_long were greater than 10 (Figure A1). Thus, we removed these 3 variables and finally got 23 explanatory variables for vulnerability modeling.
Figure A1.
Multicollinearity (VIF) among explanatory variables.
References
- Sturrock, R.N.; Frankel, S.J.; Brown, A.V.; Hennon, P.E.; Kliejunas, J.T.; Lewis, K.J.; Worrall, J.J.; Woods, A.J. Climate Change and Forest Diseases. Plant Pathol. 2011, 60, 133–149. [Google Scholar] [CrossRef]
- Malhi, Y.; Franklin, J.; Seddon, N.; Solan, M.; Turner, M.G.; Field, C.B.; Knowlton, N. Climate Change and Ecosystems: Threats, Opportunities and Solutions. Philos. Trans. R. Soc. B Biol. Sci. 2020, 375, 20190104. [Google Scholar] [CrossRef] [PubMed] [Green Version]
- Hassan, R.; Scholes, R.; Ash, N.; Condition, M.; Group, T. Ecosystems and Human Well-Being: Current State and Trends; Island Press: Washington, DC, USA, 2005. [Google Scholar]
- FAO. Global Forest Resources Assessment 2020; FAO: Rome, Italy, 2020; ISBN 978-92-5-132581-0. [Google Scholar]
- Pellegrini, A.F.A.; Refsland, T.; Averill, C.; Terrer, C.; Staver, A.C.; Brockway, D.G.; Caprio, A.; Clatterbuck, W.; Coetsee, C.; Haywood, J.D.; et al. Decadal Changes in Fire Frequencies Shift Tree Communities and Functional Traits. Nat. Ecol. Evol. 2021, 5, 504–512. [Google Scholar] [CrossRef]
- Zhao, B.; Zhuang, Q.; Shurpali, N.; Köster, K.; Berninger, F.; Pumpanen, J. North American Boreal Forests Are a Large Carbon Source Due to Wildfires from 1986 to 2016. Sci. Rep. 2021, 11, 7723. [Google Scholar] [CrossRef]
- Kitzberger, T.; Tiribelli, F.; Barberá, I.; Gowda, J.H.; Morales, J.M.; Zalazar, L.; Paritsis, J. Projections of Fire Probability and Ecosystem Vulnerability under 21st Century Climate across a Trans-Andean Productivity Gradient in Patagonia. Sci. Total Environ. 2022, 839, 156303. [Google Scholar] [CrossRef] [PubMed]
- Forzieri, G.; Girardello, M.; Ceccherini, G.; Spinoni, J.; Feyen, L.; Hartmann, H.; Beck, P.S.A.; Camps-Valls, G.; Chirici, G.; Mauri, A.; et al. Emergent Vulnerability to Climate-Driven Disturbances in European Forests. Nat. Commun. 2021, 12, 1081. [Google Scholar] [CrossRef]
- Battipaglia, G.; Rigling, A.; De Micco, V. Editorial: Multiscale Approach to Assess Forest Vulnerability. Front. Plant Sci. 2020, 11, 744. [Google Scholar] [CrossRef] [PubMed]
- Luo, H.; Wei, A.; Zhang, C. A comprehensive review of forest ecosystem vulnerability assessment research. Subtrop. Agric. Res. 2017, 13, 66–72. [Google Scholar]
- Meybeck, A.; Rose, A.; Gitz, V. FAO Framework Methodology for Climate Change Vulnerability Assessments of Forests and Forest Dependent People: A Framework Methodology; FAO Forestry Papers; FAO: Rome, Italy, 2019; ISBN 978-92-5-131981-9. [Google Scholar]
- Li, K.; Chen, Y. Analysis of Vulnerability of Forest in China Responsed to Global Climate Change. Acta Geogr. Sin. 1996, 51, 40–49. [Google Scholar]
- Dale, V.H.; Joyce, L.A.; McNulty, S.; Neilson, R.P.; Ayres, M.P.; Flannigan, M.D.; Hanson, P.J.; Irland, L.C.; Lugo, A.E.; Peterson, C.J.; et al. Climate Change and Forest Disturbances: Climate Change Can Affect Forests by Altering the Frequency, Intensity, Duration, and Timing of Fire, Drought, Introduced Species, Insect and Pathogen Outbreaks, Hurricanes, Windstorms, Ice Storms, or Landslides. BioScience 2001, 51, 723–734. [Google Scholar] [CrossRef] [Green Version]
- Seidl, R.; Thom, D.; Kautz, M.; Martin-Benito, D.; Peltoniemi, M.; Vacchiano, G.; Wild, J.; Ascoli, D.; Petr, M.; Honkaniemi, J.; et al. Forest Disturbances under Climate Change. Nat. Clim. Chang. 2017, 7, 395–402. [Google Scholar] [CrossRef] [PubMed] [Green Version]
- Viljur, M.-L.; Abella, S.R.; Adámek, M.; Alencar, J.B.R.; Barber, N.A.; Beudert, B.; Burkle, L.A.; Cagnolo, L.; Campos, B.R.; Chao, A.; et al. The Effect of Natural Disturbances on Forest Biodiversity: An Ecological Synthesis. Biol. Rev. 2022, 97, 1930–1947. [Google Scholar] [CrossRef] [PubMed]
- Lecina-Diaz, J.; Martínez-Vilalta, J.; Alvarez, A.; Banqué, M.; Birkmann, J.; Feldmeyer, D.; Vayreda, J.; Retana, J. Characterizing Forest Vulnerability and Risk to Climate-Change Hazards. Front. Ecol. Environ. 2021, 19, 126–133. [Google Scholar] [CrossRef]
- Shit, P.K.; Pourghasemi, H.R.; Adhikary, P.P.; Bhunia, G.S.; Sati, V.P. (Eds.) Forest Resources Resilience and Conflicts; Elsevier: Amsterdam, The Netherlands, 2021; ISBN 978-0-12-822931-6. [Google Scholar]
- Abatzoglou, J.T.; Williams, A.P. Impact of Anthropogenic Climate Change on Wildfire across Western US Forests. Proc. Natl. Acad. Sci. USA 2016, 113, 11770–11775. [Google Scholar] [CrossRef] [PubMed] [Green Version]
- Canadell, J.G.; Meyer, C.P.M.; Cook, G.D.; Dowdy, A.; Briggs, P.R.; Knauer, J.; Pepler, A.; Haverd, V. Multi-Decadal Increase of Forest Burned Area in Australia Is Linked to Climate Change. Nat. Commun. 2021, 12, 6921. [Google Scholar] [CrossRef] [PubMed]
- Li, W.; Xu, Q.; Yi, J.; Liu, J. Predictive Model of Spatial Scale of Forest Fire Driving Factors: A Case Study of Yunnan Province, China. Sci. Rep. 2022, 12, 19029. [Google Scholar] [CrossRef]
- Liu, H.; Xiong, K.; Yu, Y.; Li, T.; Qing, Y.; Wang, Z.; Zhang, S. A Review of Forest Ecosystem Vulnerability and Resilience: Implications for the Rocky Desertification Control. Sustainability 2021, 13, 11849. [Google Scholar] [CrossRef]
- Amalina, P.; Prasetyo, L.B.; Rushayati, S.B. Forest Fire Vulnerability Mapping in Way Kambas National Park. Procedia Environ. Sci. 2016, 33, 239–252. [Google Scholar] [CrossRef] [Green Version]
- Buotte, P.C.; Levis, S.; Law, B.E.; Hudiburg, T.W.; Rupp, D.E.; Kent, J.J. Near-Future Forest Vulnerability to Drought and Fire Varies across the Western United States. Glob. Chang. Biol. 2019, 25, 290–303. [Google Scholar] [CrossRef] [PubMed] [Green Version]
- Li, J.; Xu, D.; Management, T.; University, S.N. Evaluation on Exploitation Potential of Forest Health Tourism Based on Ahp and Fuzzy Synthetic Evalution—A Case Study of Liaodong Mountain Area. Chin. J. Agric. Resour. Reg. Plan. 2018, 39, 135–142. [Google Scholar]
- Giglio, E. Landscape Ecological Method to Study Agricultural Vegetation: Some Examples from the Po Valley. Ann. Bot. 2006, 6, 95–110. [Google Scholar]
- Delgado, A.; Vidal, J.; Castro, J.; Felix, J.; Saenz, J. Assessment of Surface Water Quality on the Upper Watershed of Huallaga River, in Peru, Using Grey Systems and Shannon Entropy. Int. J. Adv. Comput. Sci. Appl. 2020, 11, 437–444. [Google Scholar] [CrossRef]
- Xenarios, S.; Nemes, A.; Sarker, G.W.; Sekhar, N.U. Assessing Vulnerability to Climate Change: Are Communities in Flood-Prone Areas in Bangladesh More Vulnerable than Those in Drought-Prone Areas? Water Resour. Rural Dev. 2016, 7, 1–19. [Google Scholar] [CrossRef]
- Abu El-Magd, S.A.; Maged, A.; Farhat, H.I. Hybrid-Based Bayesian Algorithm and Hydrologic Indices for Flash Flood Vulnerability Assessment in Coastal Regions: Machine Learning, Risk Prediction, and Environmental Impact. Environ. Sci. Pollut. Res. 2022, 29, 57345–57356. [Google Scholar] [CrossRef] [PubMed]
- Hutter, F.; Kotthoff, L.; Vanschoren, J. (Eds.) Automated Machine Learning: Methods, Systems, Challenges; Springer Nature: Cham, Switzerland, 2019. [Google Scholar]
- LeDell, E.; Poirier, S. H2O AutoML: Scalable automatic machine learning. In Proceedings of the 7th ICML Workshop on Automated Machine Learning, Vienna, Austria, 17–18 July 2020; p. 16. [Google Scholar]
- National Forestry and Grassland Administration. China Forestry and Grassland Statistical Yearbook; China Forestry Publishing House: Beijing, China, 2019.
- Luan, T.; Wang, Y.; Zhang, X. Statistical Analysis of Forest Fire Accidents in China from 2008 to 2018. Saf. Secur. 2020, 41, 7. [Google Scholar]
- Wang, M.; Shu, L. Responses and Variations of Forest Fires in China under Changing Climate; Science Press: Beijing, China, 2015. [Google Scholar]
- Fang, L.; Yang, J.; Zu, J.; Li, G.; Zhang, J. Quantifying Influences and Relative Importance of Fire Weather, Topography, and Vegetation on Fire Size and Fire Severity in a Chinese Boreal Forest Landscape. For. Ecol. Manag. 2015, 356, 2–12. [Google Scholar] [CrossRef]
- Ying, L.; Han, J.; Du, Y.; Shen, Z. Forest Fire Characteristics in China: Spatial Patterns and Determinants with Thresholds. For. Ecol. Manag. 2018, 424, 345–354. [Google Scholar] [CrossRef]
- Zhao, F.; Liu, Y. Atmospheric Circulation Patterns Associated with Wildfires in the Monsoon Regions of China. Geophys. Res. Lett. 2019, 46, 4873–4882. [Google Scholar] [CrossRef] [Green Version]
- White, J.C.; Coops, N.C.; Wulder, M.A.; Vastaranta, M.; Hilker, T.; Tompalski, P. Remote Sensing Technologies for Enhancing Forest Inventories: A Review. Can. J. Remote Sens. 2016, 42, 619–641. [Google Scholar] [CrossRef] [Green Version]
- Francini, S.; McRoberts, R.E.; D’Amico, G.; Coops, N.C.; Hermosilla, T.; White, J.C.; Wulder, M.A.; Marchetti, M.; Mugnozza, G.S.; Chirici, G. An Open Science and Open Data Approach for the Statistically Robust Estimation of Forest Disturbance Areas. Int. J. Appl. Earth Obs. Geoinf. 2022, 106, 102663. [Google Scholar] [CrossRef]
- Babaeian, E.; Paheding, S.; Siddique, N.; Devabhaktuni, V.K.; Tuller, M. Estimation of Root Zone Soil Moisture from Ground and Remotely Sensed Soil Information with Multisensor Data Fusion and Automated Machine Learning. Remote Sens. Environ. 2021, 260, 112434. [Google Scholar] [CrossRef]
- Pérez-Porras, F.-J.; Triviño-Tarradas, P.; Cima-Rodríguez, C.; Meroño-de-Larriva, J.-E.; García-Ferrer, A.; Mesas-Carrascosa, F.-J. Machine Learning Methods and Synthetic Data Generation to Predict Large Wildfires. Sensors 2021, 21, 3694. [Google Scholar] [CrossRef] [PubMed]
- Polsky, C.; Neff, R.; Yarnal, B. Building Comparable Global Change Vulnerability Assessments: The Vulnerability Scoping Diagram. Glob. Environ. Chang. 2007, 17, 472–485. [Google Scholar] [CrossRef]
- Thakur, S.; Negi, V.S.; Dhyani, R.; Satish, K.V.; Bhatt, I.D. Vulnerability Assessments of Mountain Forest Ecosystems: A Global Synthesis. Trees For. People 2021, 6, 100156. [Google Scholar] [CrossRef]
- Yin, Y.; Ma, D.; Wu, S. Climate Change Risk to Forests in China Associated with Warming. Sci. Rep. 2018, 8, 493. [Google Scholar] [CrossRef] [PubMed]
- Fang, J.; Shen, Z.; Tang, Z.; Wang, X.; Wang, Z.; Feng, J.; Liu, Y.; Qiao, X.; Wu, X.; Zheng, C. Forest Community Survey and the Structural Characteristics of Forests in China. Ecography 2012, 35, 1059–1071. [Google Scholar] [CrossRef]
- DiMiceli, C.; Carroll, M.; Sohlberg, R.; Kim, D.-H.; Kelly, M.; Townshend, J. MOD44B MODIS/Terra Vegetation Continuous Fields Yearly L3 Global 250 m SIN Grid V006 2017. Available online: https://www.fao.org/3/I8661EN/i8661en.pdf (accessed on 10 October 2022).
- Food and Agriculture Organization of the United Nations. Global Forest Resources Assessment 2020; Terms and Definitions: Rome, Italy, 2018. [Google Scholar]
- Sun, S. Concerning the Vegetation Chinese Regionalization Map as a Part of in the Natural Geographical Atlas of the People’s Republic of China. Acta Phytoecol. Sin. 1998, 22, 523–537. [Google Scholar]
- Hou, X. Vegetation Geography of China; Science Press: Beijing, China, 1988. [Google Scholar]
- Artés, T.; Oom, D.; de Rigo, D.; Durrant, T.H.; Maianti, P.; Libertà, G.; San-Miguel-Ayanz, J. A Global Wildfire Dataset for the Analysis of Fire Regimes and Fire Behaviour. Sci. Data 2019, 6, 296. [Google Scholar] [CrossRef] [Green Version]
- Santoro, M.; Cartus, O.; Carvalhais, N.; Rozendaal, D.M.A.; Avitabile, V.; Araza, A.; de Bruin, S.; Herold, M.; Quegan, S.; Rodríguez-Veiga, P.; et al. The Global Forest Above-Ground Biomass Pool for 2010 Estimated from High-Resolution Satellite Observations. Earth Syst. Sci. Data 2021, 13, 3927–3950. [Google Scholar] [CrossRef]
- James, G.; Witten, D.; Hastie, T.; Tibshirani, R. An introduction to statistical learning. In An Introduction to Statistical Learning, 8th ed.; James, G., Witten, D., Hastie, T., Tibshirani, R., Eds.; Springer Texts in Statistics; Springer: New York, NY, USA, 2017; ISBN 978-1-4614-7138-7. [Google Scholar]
- Thompson, C.G.; Kim, R.S.; Aloe, A.M.; Becker, B.J. Extracting the Variance Inflation Factor and Other Multicollinearity Diagnostics from Typical Regression Results. Basic Appl. Soc. Psychol. 2017, 39, 81–90. [Google Scholar] [CrossRef]
- Folli, G.S.; Nascimento, M.H.C.; de Paulo, E.H.; da Cunha, P.H.P.; Romão, W.; Filgueiras, P.R. Variable Selection in Support Vector Regression Using Angular Search Algorithm and Variance Inflation Factor. J. Chemom. 2020, 34, e3282. [Google Scholar] [CrossRef]
- Al-Sahaf, H.; Bi, Y.; Chen, Q.; Lensen, A.; Mei, Y.; Sun, Y.; Tran, B.; Xue, B.; Zhang, M. A Survey on Evolutionary Machine Learning. J. R. Soc. N. Z. 2019, 49, 205–228. [Google Scholar] [CrossRef]
- Karmaker, S.K.; Hassan, M.M.; Smith, M.J.; Xu, L.; Zhai, C.; Veeramachaneni, K. AutoML to Date and Beyond: Challenges and Opportunities. ACM Comput. Surv. 2021, 54, 1–36. [Google Scholar] [CrossRef]
- McCulloch, W.S.; Pitts, W. A Logical Calculus of the Ideas Immanent in Nervous Activity. Bull. Math. Biophys. 1943, 5, 115–133. [Google Scholar] [CrossRef]
- Cireşan, D.C.; Meier, U.; Gambardella, L.M.; Schmidhuber, J. Deep, Big, Simple Neural Nets for Handwritten Digit Recognition. Neural Comput. 2010, 22, 3207–3220. [Google Scholar] [CrossRef] [Green Version]
- Senn, S. A Conversation with John Nelder. Stat. Sci. 2003, 18, 118–131. [Google Scholar] [CrossRef]
- Kateri, M. Generalized linear models and extensions. In Contingency Table Analysis: Methods and Implementation Using R; Kateri, M., Ed.; Statistics for Industry and Technology; Springer: New York, NY, USA, 2014; pp. 125–152. ISBN 978-0-8176-4811-4. [Google Scholar]
- Mason, L.; Baxter, J.; Bartlett, P.; Frean, M. Boosting Algorithms as Gradient Descent. Adv. Neural Inf. Process. Syst. 1999, 12, 512–518. [Google Scholar]
- Piryonesi, S.M.; El-Diraby, T.E. Data Analytics in Asset Management: Cost-Effective Prediction of the Pavement Condition Index. J. Infrastruct. Syst. 2020, 26, 4019036. [Google Scholar] [CrossRef]
- Niculescu-Mizil, A.; Caruana, R. Predicting good probabilities with supervised learning. In Proceedings of the 22nd International Conference on Machine Learning—ICML ’05, Bonn, Germany, 7–11 August 2005; ACM Press: Bonn, Germany, 2005; pp. 625–632. [Google Scholar]
- Geurts, P.; Ernst, D.; Wehenkel, L. Extremely Randomized Trees. Mach. Learn. 2006, 63, 3–42. [Google Scholar] [CrossRef] [Green Version]
- Opitz, D.; Maclin, R. Popular Ensemble Methods: An Empirical Study. J. Artif. Intell. Res. 1999, 11, 169–198. [Google Scholar] [CrossRef]
- Fisher, A.; Rudin, C.; Dominici, F. All Models Are Wrong, but Many Are Useful: Learning a Variable’s Importance by Studying an Entire Class of Prediction Models Simultaneously. J. Mach. Learn. Res. 2019, 20, 1–81. [Google Scholar]
- Abdi, A.M.; Vrieling, A.; Yengoh, G.T.; Anyamba, A.; Seaquist, J.W.; Ummenhofer, C.C.; Ardö, J. The El Niño—La Niña Cycle and Recent Trends in Supply and Demand of Net Primary Productivity in African Drylands. Clim. Chang. 2016, 138, 111–125. [Google Scholar] [CrossRef] [Green Version]
- Wang, W.; Zhang, Q.; Luo, J.; Zhao, R.; Zhang, Y. Estimation of Forest Fire Emissions in Southwest China from 2013 to 2017. Atmosphere 2020, 11, 15. [Google Scholar] [CrossRef] [Green Version]
- Chen, A.; Tang, R.; Mao, J.; Yue, C.; Li, X.; Gao, M.; Shi, X.; Jin, M.; Ricciuto, D.; Rabin, S.; et al. Spatiotemporal Dynamics of Ecosystem Fires and Biomass Burning-Induced Carbon Emissions in China over the Past Two Decades. Geogr. Sustain. 2020, 1, 47–58. [Google Scholar] [CrossRef]
- Zhu, J.; Zhou, X.; Hu, J. Thoughts and views about the three north shelterbelt program. J. Nat. Resour. 2004, 19, 79–85. [Google Scholar] [CrossRef]
- Lu, F.; Hu, H.; Sun, W.; Zhu, J.; Liu, G.; Zhou, W.; Zhang, Q.; Shi, P.; Liu, X.; Wu, X.; et al. Effects of National Ecological Restoration Projects on Carbon Sequestration in China from 2001 to 2010. Proc. Natl. Acad. Sci. USA 2018, 115, 4039–4044. [Google Scholar] [CrossRef] [Green Version]
- Yu, D.; Zhou, L.; Zhou, W.; Ding, H.; Wang, Q.-W.; Wang, Y.; Wu, X.; Dai, L. Forest Management in Northeast China: History, Problems, and Challenges. Environ. Manag. 2011, 48, 1122–1135. [Google Scholar] [CrossRef]
- Fan, Q.; Wang, C.; Zhang, D.; Zang, S. Environmental Influences on Forest Fire Regime in the Greater Hinggan Mountains, Northeast China. Forests 2017, 8, 372. [Google Scholar] [CrossRef]
- Seiler, W.; Crutzen, P.J. Estimates of Gross and Net Fluxes of Carbon between the Biosphere and the Atmosphere from Biomass Burning. Clim. Chang. 1980, 2, 207–247. [Google Scholar] [CrossRef]
- Song, Y.; Liu, B.; Miao, W.; Chang, D.; Zhang, Y. Spatiotemporal Variation in Nonagricultural Open Fire Emissions in China from 2000 to 2007. Glob. Biogeochem. Cycles 2009, 23, 1–13. [Google Scholar] [CrossRef]
- Lü, A.; Tian, H.; Liu, M.; Liu, J.; Melillo, J.M. Spatial and Temporal Patterns of Carbon Emissions from Forest Fires in China from 1950 to 2000. J. Geophys. Res. Atmos. 2006, 111. [Google Scholar] [CrossRef] [Green Version]
- Chen, W.; Feng, Y.; Zhang, J.; Zhang, L. Response of Soil Lignin Stability to Nitrogen Addition and Precipitation Reduction in Broad-Leaved Korean Pine Forest. CJE 2019, 38, 99–106. [Google Scholar]
- Piao, S.; Wang, X.; Park, T.; Chen, C. Characteristics, Drivers and Feedbacks of Global Greening. Nat. Rev. Earth Environ. 2020, 1, 14–27. [Google Scholar] [CrossRef] [Green Version]
- Liu, Y.; Lu, C.; Fu, B.-J.; Yu, B. Terrestrial Ecosystem Classification and Its Spatiotemporal Changes in China during Last 20 Years. Acta Ecol. Sin. 2021, 41, 3975–3987. [Google Scholar] [CrossRef]
- Satendra, K.A. Forest Fire Disaster Management; National Institute of Disaster Management, Ministry of Home Affairs (NIDM): New Delhi, India, 2014; ISBN 978-93-82571-09-4.
- Morimoto, J.; Nakagawa, K.; Takano, K.T.; Aiba, M.; Oguro, M.; Furukawa, Y.; Mishima, Y.; Ogawa, K.; Ito, R.; Takemi, T.; et al. Comparison of Vulnerability to Catastrophic Wind between Abies Plantation Forests and Natural Mixed Forests in Northern Japan. Forestry 2019, 92, 436–443. [Google Scholar] [CrossRef]
- Masson-Delmotte, V.; Zhai, P.; Pörtner, H.-O.; Roberts, D.; Skea, J. Global Warming of 1.5 °C. An IPCC Special Report on the Impacts of Global Warming of 1.5 °C above Pre-Industrial Levels and Related Global Greenhouse Gas Emission Pathways, in the Context of Strengthening the Global Response to the Threat of Climate Change, Sustainable Development, and Efforts to Eradicate Poverty. Available online: https://www.ipcc.ch/sr15/ (accessed on 13 January 2022).
- Moreno-Martínez, Á.; Camps-Valls, G.; Kattge, J.; Robinson, N.; Reichstein, M.; van Bodegom, P.; Kramer, K.; Cornelissen, J.H.C.; Reich, P.; Bahn, M.; et al. A Methodology to Derive Global Maps of Leaf Traits Using Remote Sensing and Climate Data. Remote Sens. Environ. 2018, 218, 69–88. [Google Scholar] [CrossRef] [Green Version]
- De Martonne, E. Une Nouvelle Fonction Climatologique: L’Indice d’Aridité; Impr. Gauthier-Villars: Paris, France, 1926. [Google Scholar]
- Tuanmu, M.-N.; Jetz, W. A Global, Remote Sensing-Based Characterization of Terrestrial Habitat Heterogeneity for Biodiversity and Ecosystem Modelling. Glob. Ecol. Biogeogr. 2015, 24, 1329–1339. [Google Scholar] [CrossRef]
Figure 1.
Forest and vegetation zones in China in 2020. (I: Cold-temperate needleleaf forest zone; II: temperate coniferous and broadleaf mixed forests zone; III: warm-temperate deciduous broadleaf forests zone; IV: subtropical evergreen broadleaf forests zone; V: tropical monsoon rainforest and rainforest zone; VI: temperate grasslands zone; VII: temperate desert zone; and VIII: Qinghai-Tibetan Plateau alpine vegetation zone).

Figure 2.
Methodology scheme and workflow.
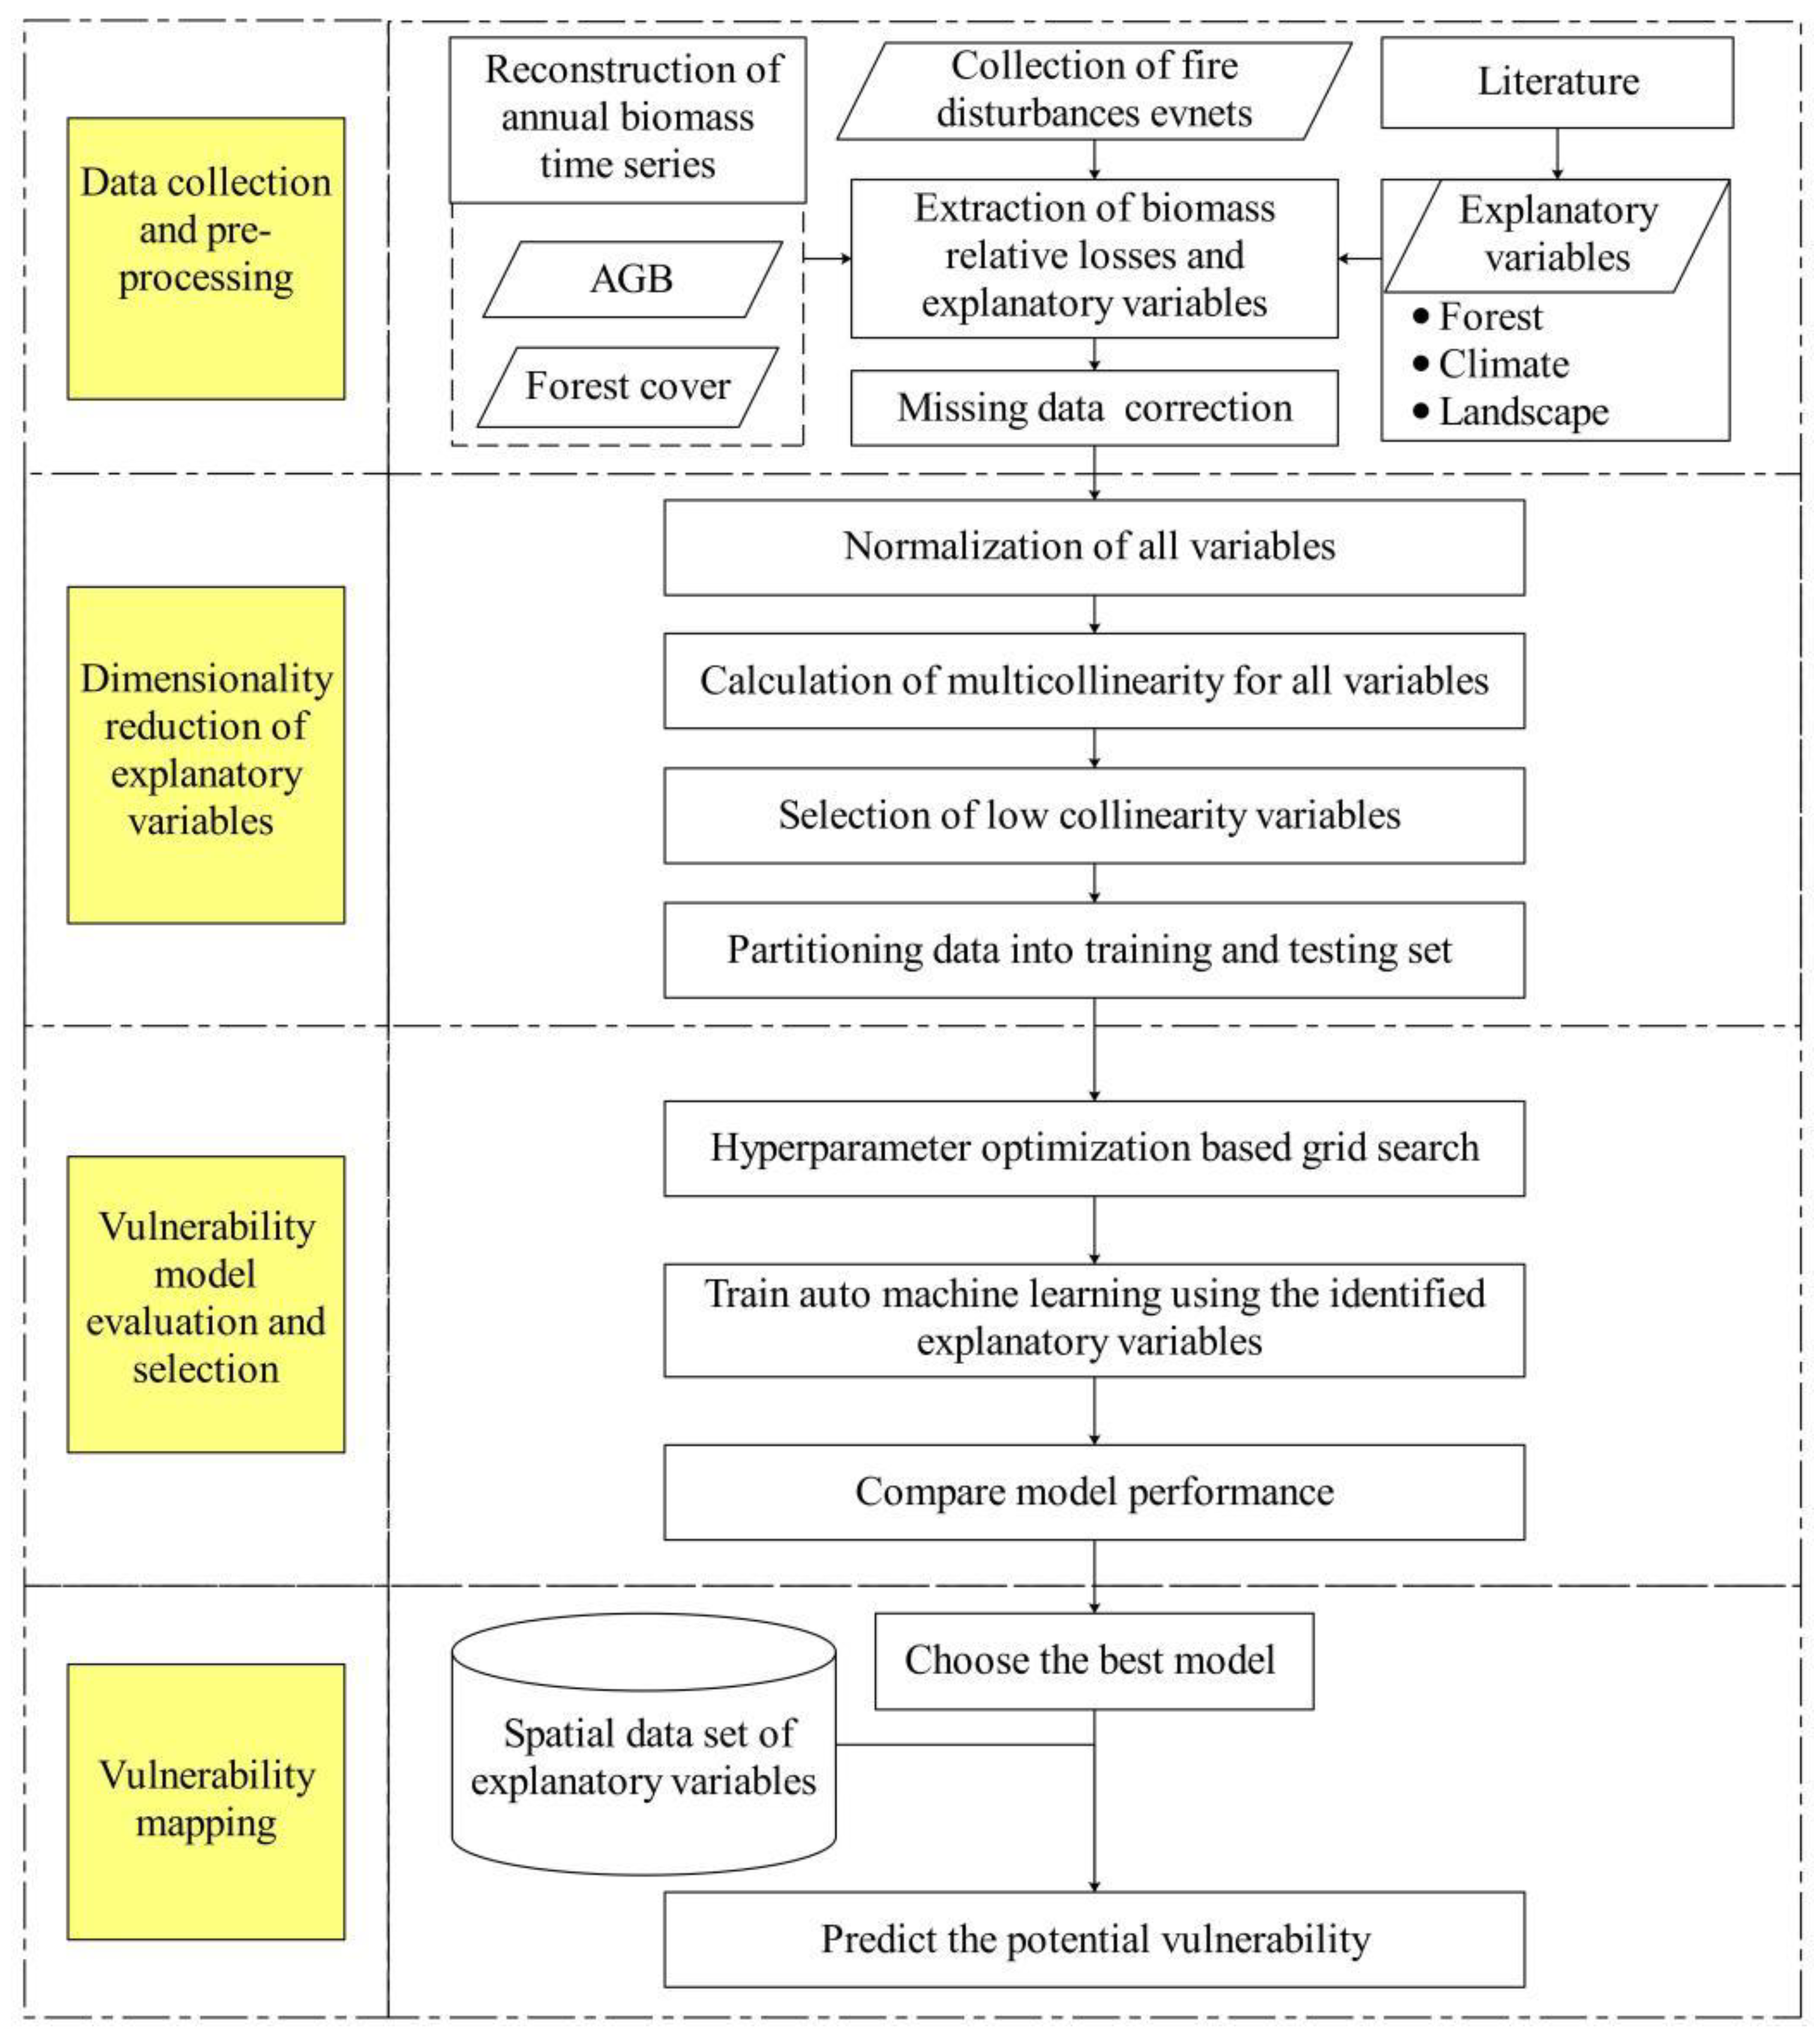
Figure 3.
Error scatter plot of the optimal model (Model ID: StackedEnsemble_AllModels in Table 2) simulation AGBLrel and observed AGBrel in the test set.
Figure 3.
Error scatter plot of the optimal model (Model ID: StackedEnsemble_AllModels in Table 2) simulation AGBLrel and observed AGBrel in the test set.
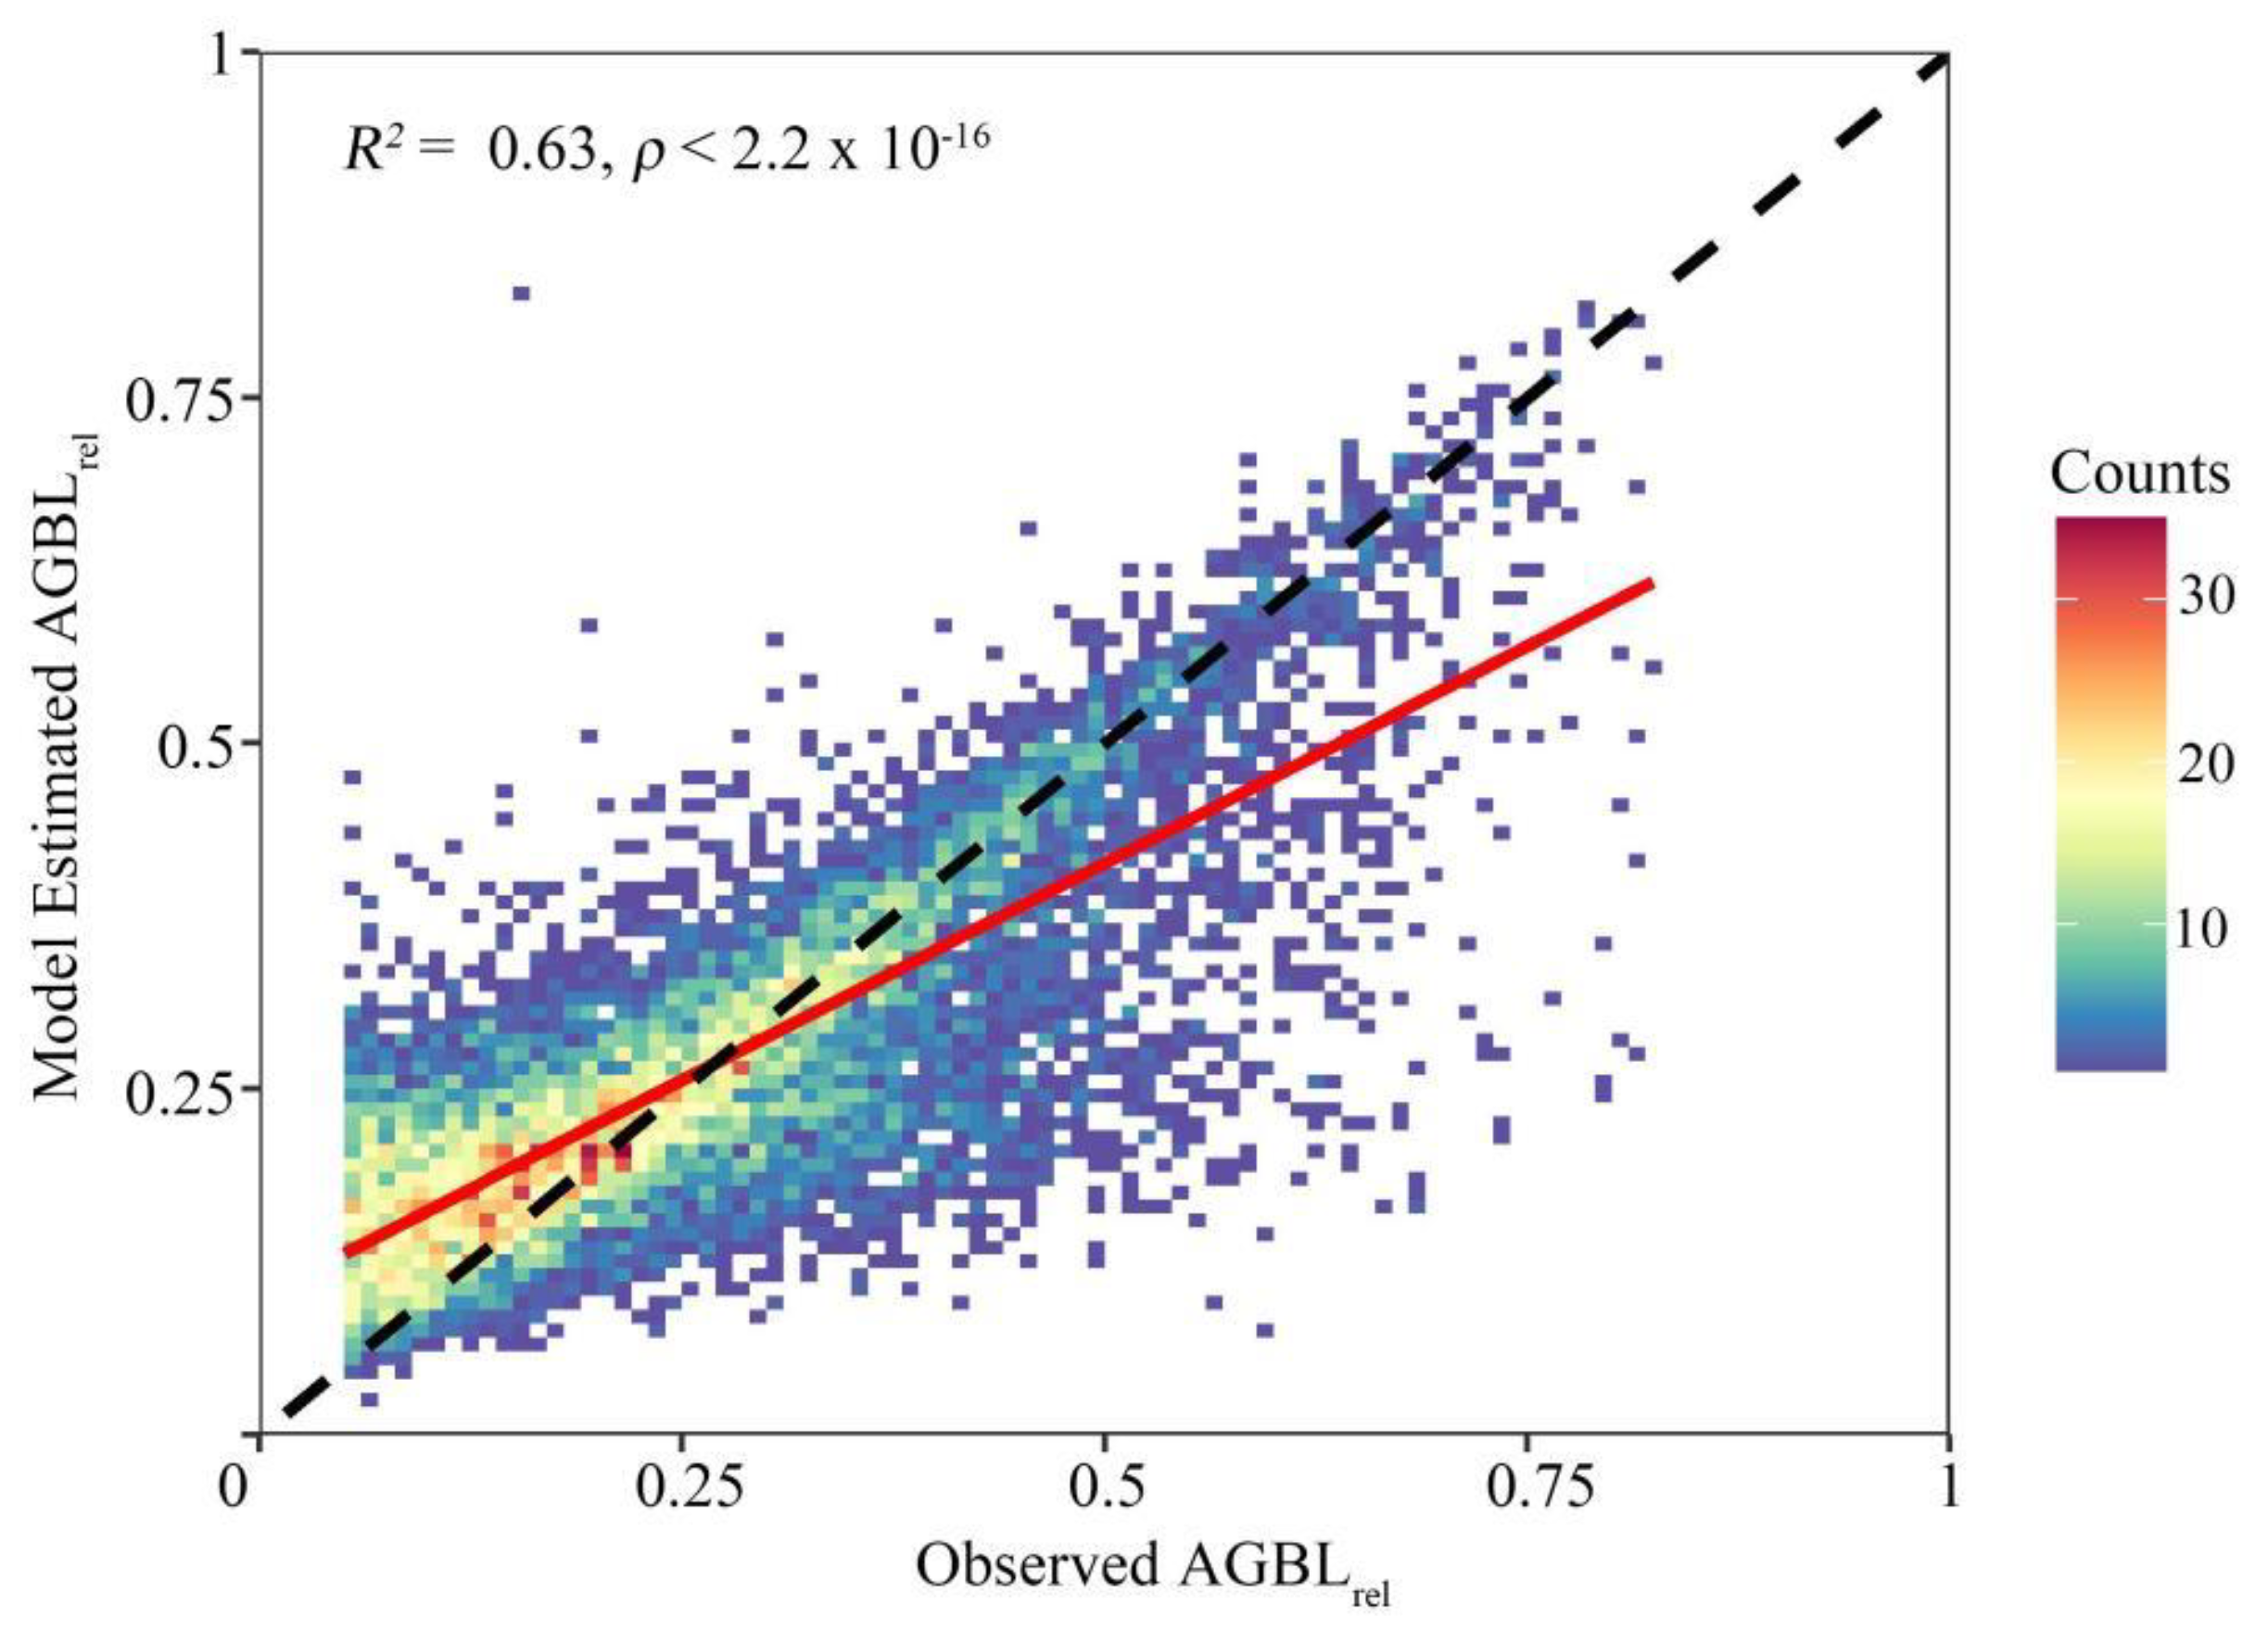
Figure 4.
The average potential vulnerability of Chinese forests to fire disturbances from 2001 to 2020. (a) Spatial map of the average potential vulnerability. (b) Violin and box plots of average potential vulnerability within each vegetation zone. For each box plot, the centerline indicates the median value, the box limits indicate the upper and lower quartiles, and the whisker length is 1.5x the interquartile range.

Figure 5.
Bar plots of the potential relative AGB loss (PBLrel), the potential absolute AGB loss (PBLabs) and the regional average AGB in different vegetation zones.
Figure 5.
Bar plots of the potential relative AGB loss (PBLrel), the potential absolute AGB loss (PBLabs) and the regional average AGB in different vegetation zones.
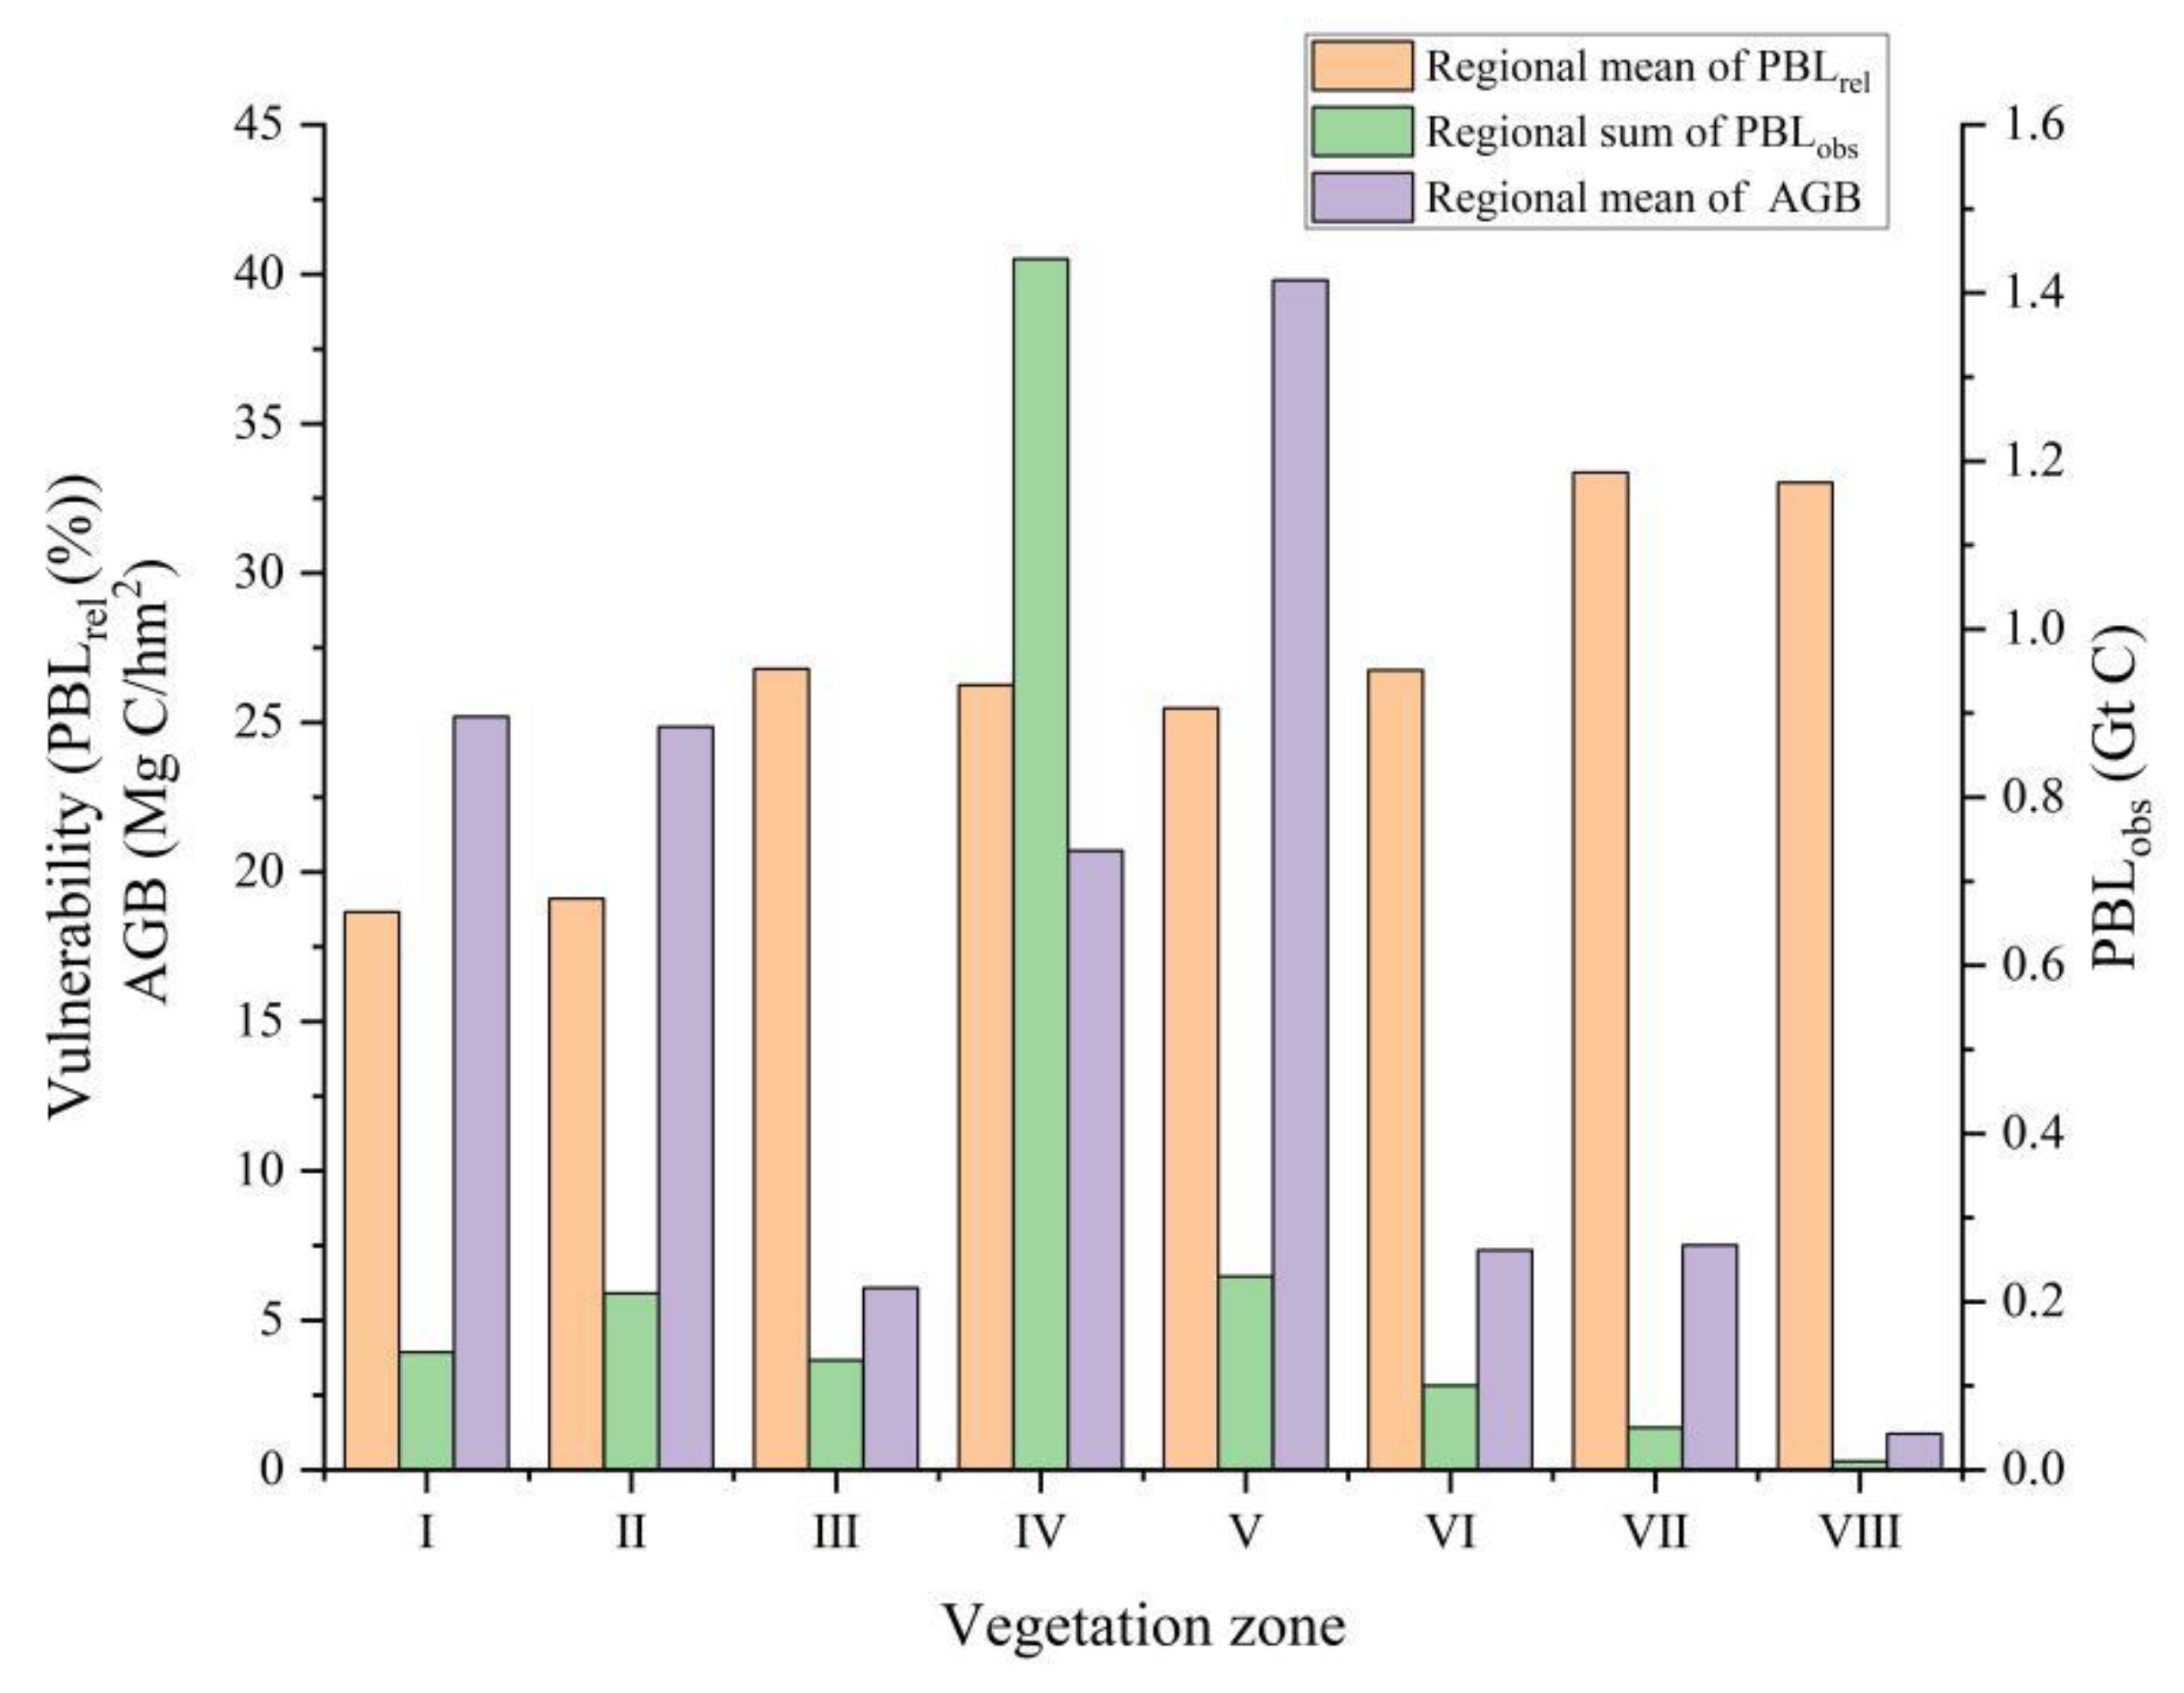
Figure 6.
Spatial distribution of the results of the Mann–Kendall time trend test for forest vulnerability to fire disturbance (PBLrel).
Figure 6.
Spatial distribution of the results of the Mann–Kendall time trend test for forest vulnerability to fire disturbance (PBLrel).

Figure 7.
The time series of forest vulnerability to fire disturbance (PBLrel) of the main forest types from 2001 to 2020 (* and ** indicate p < 0.1 and p < 0.05, respectively).
Figure 7.
The time series of forest vulnerability to fire disturbance (PBLrel) of the main forest types from 2001 to 2020 (* and ** indicate p < 0.1 and p < 0.05, respectively).

Figure 8.
Variable importance scores for the optimal vulnerability model. Green, blue and orange dotted lines represent the mean importance scores of categories for forest features, climate features and landscape features, respectively.
Figure 8.
Variable importance scores for the optimal vulnerability model. Green, blue and orange dotted lines represent the mean importance scores of categories for forest features, climate features and landscape features, respectively.
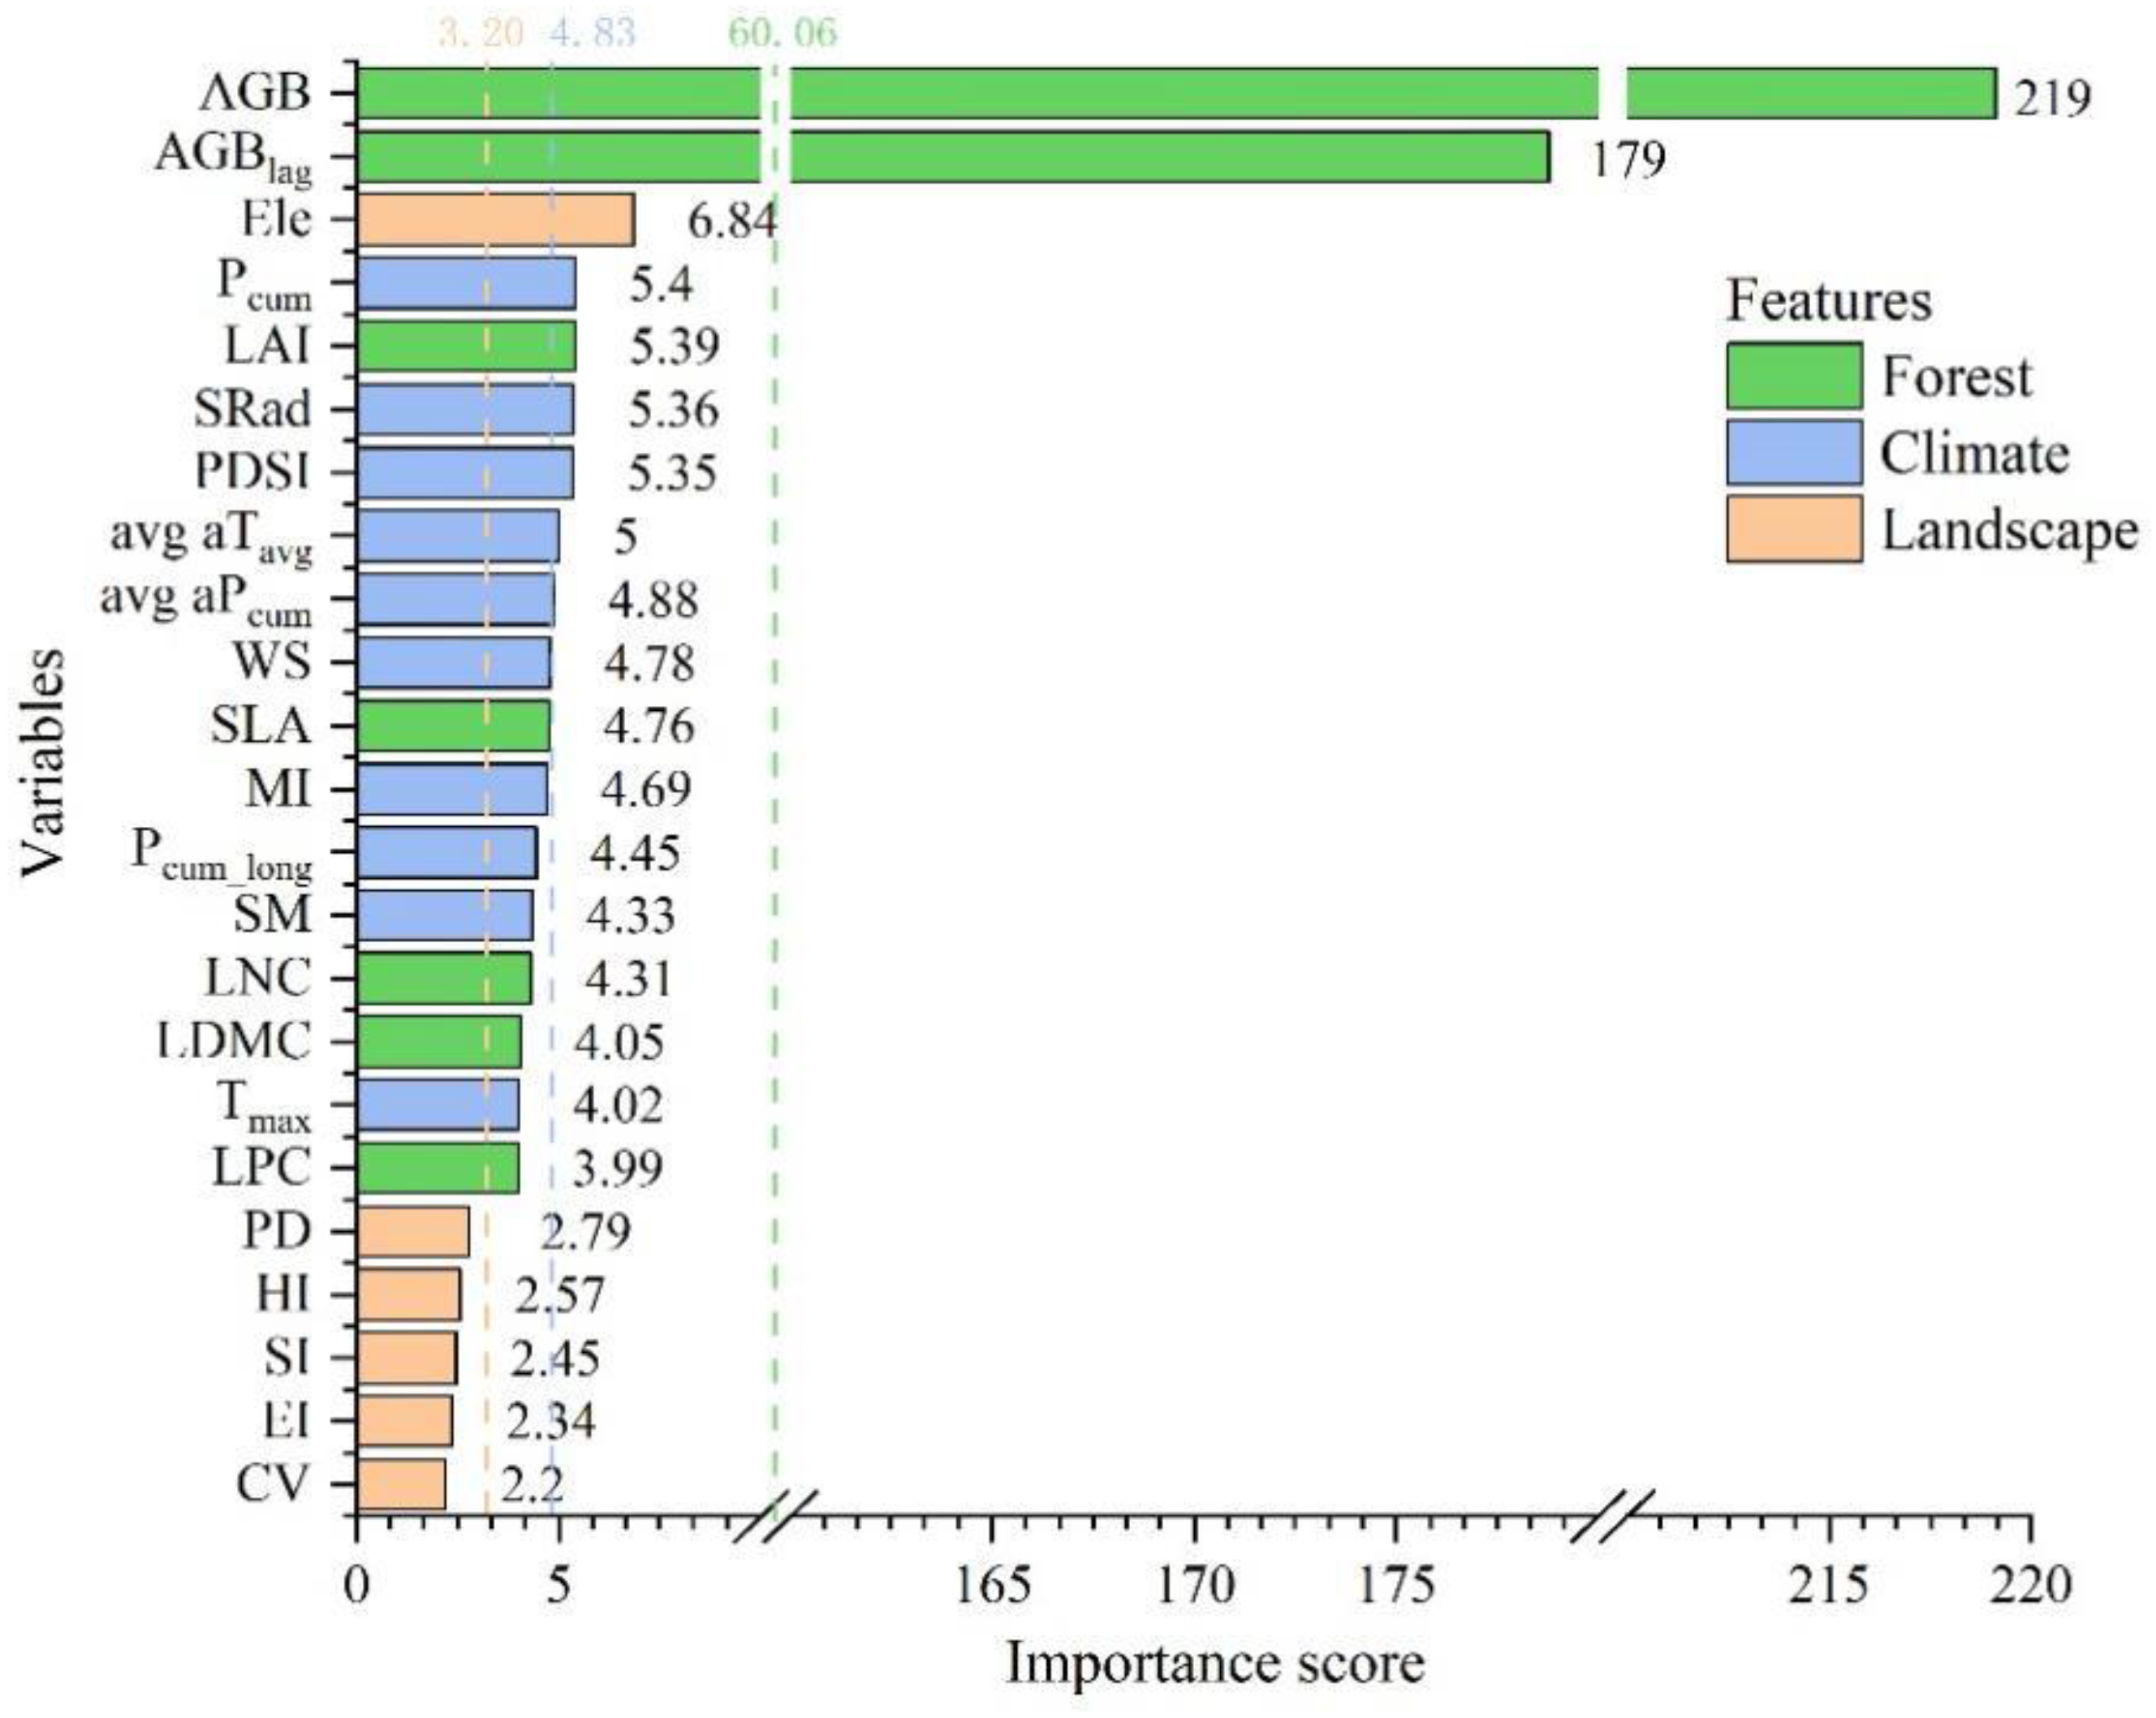
Figure 9.
Spatial correlations between forest vulnerability and (a) AGB, (b) LAI, (c) Pcum, (d) Tavg, (e) Tmax, (f) avg aPcum, (g) avg aTavg, (h) PDSI, (i) SRad, (j) WS, and (k) MI during 2001–2020.
Figure 9.
Spatial correlations between forest vulnerability and (a) AGB, (b) LAI, (c) Pcum, (d) Tavg, (e) Tmax, (f) avg aPcum, (g) avg aTavg, (h) PDSI, (i) SRad, (j) WS, and (k) MI during 2001–2020.

Table 1.
Explanatory variables used in vulnerability models.
| Category | Explanatory Variables | Abbreviation | Temporal Resolution |
|---|---|---|---|
| Forest features | Aboveground biomass | AGB | Yearly |
| one-year-lagged aboveground biomass | AGBlag | Yearly | |
| Leaf area index | LAI | Yearly | |
| Fraction of absorbed photosynthetically active radiation | FAPAR | Yearly | |
| Specific leaf area | SLA | Static | |
| Leaf dry matter content | LDMC | Static | |
| Leaf nitrogen content per leaf dry mass | LNC | Static | |
| Leaf phosphorus content per leaf dry mass | LPC | Static | |
| Climate features | Annual cumulated precipitation | Pcum | Yearly |
| Annual average temperature | Tavg | Yearly | |
| Annual maximum temperature | Tmax | Yearly | |
| Annual values of downward surface Shortwave radiation | SRad | Yearly | |
| Palmer drought severity index | PDSI | Yearly | |
| Soil moisture | SM | Yearly | |
| Long-term mean precipitation | Pcum_long | Static | |
| Short-term average anomaly in cumulated precipitation | avg aPcum | Yearly | |
| Long-term mean temperature | Tavg_long | Static | |
| Short-term average anomaly in average temperature | avg aTavg | Yearly | |
| Moisture index | MI | Yearly | |
| Landscape features | Coefficient of variation | CV | Static |
| Evenness index | EI | Static | |
| Shannon Index | SI | Static | |
| Homogeneity index | HI | Static | |
| Elevation | Ele | Static | |
| Population density | PD | Yearly |
Table 2.
The statistical error results of the vulnerability models of PBLrel and AGBrel in the training set (root mean squared error (RMSE), mean square error (MSE), mean absolute error (MAE) and root mean squared logarithmic error (RMSLE)).
Table 2.
The statistical error results of the vulnerability models of PBLrel and AGBrel in the training set (root mean squared error (RMSE), mean square error (MSE), mean absolute error (MAE) and root mean squared logarithmic error (RMSLE)).
| Number | Model ID | RMSE | MSE | MAE | RMSLE |
|---|---|---|---|---|---|
| 1 | StackedEnsemble_AllModels | 0.095 | 0.009 | 0.067 | 0.074 |
| 2 | StackedEnsemble_BestOfFamily | 0.097 | 0.009 | 0.069 | 0.075 |
| 3 | GBM_4_AutoML | 0.098 | 0.010 | 0.069 | 0.076 |
| 4 | GBM_3_AutoML | 0.098 | 0.010 | 0.070 | 0.076 |
| 5 | GBM_grid__1_AutoML_model_1 | 0.099 | 0.010 | 0.070 | 0.077 |
| 6 | GBM_2_AutoML | 0.099 | 0.010 | 0.070 | 0.077 |
| 7 | GBM_1_AutoML | 0.100 | 0.010 | 0.071 | 0.077 |
| 8 | GBM_grid__1_AutoML_model_4 | 0.100 | 0.010 | 0.071 | 0.077 |
| 9 | GBM_5 | 0.101 | 0.010 | 0.072 | 0.078 |
| 10 | GBM_grid__1_AutoML_model_8 | 0.102 | 0.010 | 0.075 | 0.079 |
| 11 | GBM_grid__1_AutoML_model_10 | 0.104 | 0.011 | 0.076 | 0.080 |
| 12 | GBM_grid__1_AutoML_model_7 | 0.104 | 0.011 | 0.076 | 0.080 |
| 13 | GBM_grid__1_AutoML_model_3 | 0.104 | 0.011 | 0.076 | 0.080 |
| 14 | GBM_grid__1_AutoML_model_6 | 0.104 | 0.011 | 0.076 | 0.081 |
| 15 | GBM_grid__1_AutoML_model_11 | 0.105 | 0.011 | 0.078 | 0.081 |
| 16 | DRF_1 | 0.106 | 0.011 | 0.080 | 0.082 |
| 17 | XRT_1 | 0.106 | 0.011 | 0.080 | 0.082 |
| 18 | GBM_grid__1_AutoML_model_9 | 0.108 | 0.012 | 0.082 | 0.084 |
| 19 | GBM_grid__1_AutoML_model_5 | 0.108 | 0.012 | 0.082 | 0.084 |
| 20 | GLM_1 | 0.139 | 0.019 | 0.110 | 0.107 |
| 21 | DeepLearning_1_AutoML | 0.149 | 0.022 | 0.108 | 0.116 |
| 22 | DeepLearning_grid__1 | 0.153 | 0.024 | 0.118 | 0.119 |
| 23 | DeepLearning_grid__2 | 0.175 | 0.031 | 0.128 | 0.133 |
| 24 | DeepLearning_grid__3 | 0.201 | 0.040 | 0.165 | 0.154 |
Publisher’s Note: MDPI stays neutral with regard to jurisdictional claims in published maps and institutional affiliations. |
© 2022 by the authors. Licensee MDPI, Basel, Switzerland. This article is an open access article distributed under the terms and conditions of the Creative Commons Attribution (CC BY) license (https://creativecommons.org/licenses/by/4.0/).
Share and Cite
MDPI and ACS Style
Ren, H.; Zhang, L.; Yan, M.; Chen, B.; Yang, Z.; Ruan, L. Spatiotemporal Assessment of Forest Fire Vulnerability in China Using Automated Machine Learning. Remote Sens. 2022, 14, 5965. https://doi.org/10.3390/rs14235965
AMA Style
Ren H, Zhang L, Yan M, Chen B, Yang Z, Ruan L. Spatiotemporal Assessment of Forest Fire Vulnerability in China Using Automated Machine Learning. Remote Sensing. 2022; 14(23):5965. https://doi.org/10.3390/rs14235965
Chicago/Turabian StyleRen, Hongge, Li Zhang, Min Yan, Bowei Chen, Zhenyu Yang, and Linlin Ruan. 2022. "Spatiotemporal Assessment of Forest Fire Vulnerability in China Using Automated Machine Learning" Remote Sensing 14, no. 23: 5965. https://doi.org/10.3390/rs14235965
Note that from the first issue of 2016, this journal uses article numbers instead of page numbers. See further details here.