
Spatiotemporal Variations in Satellite-Derived Vegetation Phenological Parameters in Northeast China


1
College of Life Sciences and Technology, Inner Mongolia Normal University, Hohhot 010022, China
2
Key Laboratory of Biodiversity Conservation and Sustainable Utilization for College and University of Inner Mongolia Autonomous Region, Hohhot 010022, China
3
Institute of Applied Ecology, Chinese Academy of Sciences, Shenyang 110016, China
*
Author to whom correspondence should be addressed.
Remote Sens. 2022, 14(3), 705; https://doi.org/10.3390/rs14030705
Submission received: 26 December 2021
/
Revised: 27 January 2022
/
Accepted: 29 January 2022
/
Published: 2 February 2022
(This article belongs to the Special Issue Remote Sensing in Applied Ecology)
Abstract
:Vegetation phenology does not only serve as a key index of terrestrial ecosystem response to worldwide climate change but also has a major influence on plant productivity and the carbon cycle. In the current research, the change of vegetation phenological parameters was studied and the impact exerted by climate change on phenological phases in northeast China for 1982–2014 was explored using the latest edition of the Global Inventory Modeling and Mapping Studies Normalized Difference Vegetation Index (GIMMS NDVI3g) dataset. The results showed that the start of the growing season (SOS) slightly advanced, the end of the growing season (EOS) showed a significant delay, and the length of the growing season (LOS) exhibited a significant prolonging at the regional scale. At the different vegetation types scale, there existed diverse responses of vegetation phenological phases to climate change for forest, grassland, and cultivated land. Significant decreasing trends in the SOS occupied 19.1% of the entire research area, whereas pixels with significantly increasing trends in the SOS accounted for 13.1%. The EOS was delayed in most of the study region (approximately 72.1%). As the result of the variations of SOS and EOS, the LOS was obviously enhanced (p < 0.05) in 29.7% of the research area. According to the correlation of vegetation phenology with climate factors, the SOS had a significant negative relationship with the average temperature in springtime, while the EOS was notably negatively connected to summer total precipitation at the regional scale. At the pixel scale, the correlation of phenological parameters with climate variables showed strong spatial heterogeneities. This study contributes to the comprehension of the responses of vegetation phenology to climate change.
1. Introduction
Phenology is crucial for quantifying the variations of vegetation phenological shifts, comprehending how climate change affects terrestrial ecosystems, and assessing the terrestrial vegetation productivity and carbon budget at both the regional and global scales [1,2,3,4,5,6,7,8,9,10].
Many previous studies have used traditional field observation approaches to analyse the interannual variability of vegetation phenology and determine the correlation of phenological shifts and climate change at the species scale [1,11]. Though in situ ground records are accurate, they are restricted by the number of observation stations and it is not possible to acquire continuous and large-scale vegetation phenological information [12]. In contrast, remote sensing is a powerful method of providing data related to large-scale phenological events and has been frequently employed in recent years [6]. Many researchers have employed remote sensing Normalized Difference Vegetation Index (NDVI) data for monitoring vegetation phenology, mainly derived from platforms such as the Advanced Very High Resolution Radiometer (AVHRR) [13], Moderate Resolution Imaging Spectroradiometer (MODIS) [14], Satellite Pour l’Observation de la Terre (SPOT) [15], and Pathfinder AVHRR Land (PAL) [16,17,18]. The latest edition of the Global Inventory Modeling and Mapping Studies (GIMMS) NDVI3g dataset, based on the AVHRR onboard the National Oceanic and Atmospheric Administration (NOAA) polar-orbiting satellites, has been released and the dataset contains satellite image records for more than three decades (1981–2015). The dataset has been commonly adopted for exploring vegetation phenology responses to climate change, suggesting that a long-term dataset obtained from a single satellite sensor is important in monitoring and characterising vegetation phenological trends at regional, continental, and global scales [2,11]. Vegetation phenological parameters, commonly containing SOS, EOS, and LOS, are mainly extracted based on the examination of four approaches: thresholds, maximum change ratio of the NDVI data, backward-looking moving average, and curve fitting methods [8,15,19]. The threshold method is simple and effective, but the selection of the threshold is controlled by human subjective influence. The maximum change ratio, also known as the derivative method, refers to the calculation of the maximum and minimum values of the first derivative of the NDVI time series data curve within a year, and the corresponding dates are regarded as SOS and EOS. Reed et al. [20] proposed a backward-looking moving average, they calculated the average NDVI value in the moving window, obtained a time-varying moving average curve, and then identified the intersection of the moving average curve and the original change curve. The selection of the size of the moving window is the key to determine the parameters of vegetation phenology, which verities among different vegetation types. The curve fitting methods commonly include Logistic function, Gaussian function, and Harmonic function. The Logistic fuction was early used in researches on the extraction of vegetation phenological parameters, and the results extracted by this method have good consistency with data of the phenology observation sites [21,22]. There are similar results among different methods when exploring SOS dynamics [2,6,19], while EOS based on the logistic approach took place earlier than the EOS based on other extraction methods [6,19]. The double logistic method was applied in previous studies of phenological shifts in mid- and high-latitude areas in the Northern Hemisphere [19].
Due to increasing temperature, earlier SOS, delayed EOS, and prolonged LOS have been shown in mid- and high-latitude areas in the Northern Hemisphere. For instance, Myneni et al. [23] investigated the vegetation phenological parameters of the Northern Hemisphere, finding the advance of SOS by 8 days and delay of EOS by 4 days, resulting in a LOS prolonged by 12 days during the period of 1982–1991. Tucker et al. [13] extended the satellite work by Myneni et al. [23] to 1999 and found that variations in the SOS was −5.6, +3.9, and −1.7 days in the higher Northern Hemisphere for 1982–1991, 1991–1992, and 1992–1999, respectively. Zhu et al. [24] studied the mid- and high-latitude areas of North America and also pointed out the delay of EOS by 0.551 days year−1 and the extension of LOS by 0.683 days year−1 during 1982 and 2006. Jeganathan et al. [25] studied the phenological parameters over the >45° N zone by using GIMMS NDVI3g data, concluding the advance of SOS by 0.58 days year−1 and the delay of EOS by 0.64 days year−1. Zhao et al. [26] analysed the spatiotemporal variations and features about vegetation phenological shifts above 40° N in the Northern Hemisphere and claimed the advance of SOS by 2.2 days decade−1 and the slight delay of EOS during the initial 21 years (1982–2002), accompanied by the delay of SOS (3.2 days decade−1, p < 0.05), and the advance of EOS (4.5 days decade−1, p < 0.05) in the following 11 years (2003–2013). Examination of the literature cited above reveals that variability in vegetation phenological shifts indeed occurred over the past few decades, but the magnitudes of vegetation phenological shifts were variable and uncertain among the different studies, including earlier or later SOS, advanced or delayed EOS, and shorter or longer LOS among different study periods.
Previous research has also shown that different vegetation biomes have different trends of phenological shifts. Wu & Liu [27] detected the spatial and temporal variations in China’s spring phenology of six temperate biomes during 1982–2006 and found that earlier spring phenology mainly occurred in temperate deciduous forests, temperate steppe, and Tibetan alpine vegetation and delayed greening was found in temperate hemi-boreal forests, temperate mixed forests, as well as temperate desert. Yang et al. [28] examined the spatiotemporal patterns of the vegetation EOS for China’s temperate vegetation ecosystems and suggested that the interannual variations in EOS showed a delaying trend in most ecosystems, containing deciduous broadleaf forests, deciduous needle-leaf forests, shrublands, and temperate grasslands, expect for the desert and alpine grasslands. Because cultivated vegetation phenology was subject to anthropogenic activities (e.g. planting, irrigation, fertilisation, and harvest), cultivated land was not considered in most previous studies. However, detection of vegetation’s phenological changes in cultivated land is essential for the exploration of terrestrial vegetation responses to climate change.
Northeast China, located at the mid- and high-latitude areas, shows high sensitivity to climate change and is experiencing particularly strong temperature increases [29,30]. Moreover, there are abundant resources of farming, forestry, and husbandry. This region exerts a significant influence on the national forestry and agricultural production. Former researches have revealed that variations of vegetation phenological parameters have occurred in northeast China [6,15,19,29,31]; however, there are still several limitations and uncertainties related to previous studies in this region. For example, Li et al. [29] studied the cropland phenological parameter responses to the variations of agricultural thermal conditions based on the SPOT NDVI data. However, they did not consider natural vegetation, including forest and grassland. Zhao et al. [31] detected the variations of vegetation phenological events by using GIMMS NDVI3g at different regions of interest and studied the internal correlations between phenology and climate variables (temperature and precipitation) but lacked an analysis of different vegetation types. Yu et al. [19] analysed the spatial characteristics of the vegetation phenological parameters and the trends of change in different vegetation types but lacked a correlation analysis on vegetation and climate factors.
This study adopted the GIMMS NDVI3g dataset for extracting the vegetation phenological parameters, identified the change trends in vegetation phenology and studied the correlation of vegetation phenology with climate factors (temperature, precipitation, and insolation) at regional, pixel, and different vegetation types scales in northeast China from 1982 to 2014. The current work aimed to (1) quantify the trends of vegetation phenological parameters of the entire region and various vegetation types, and at the pixel scale and (2) detect the correlation of vegetation phenological parameters with climate factors. The study on vegetation phenology in this region can provide further evidence for climate change and contribute to comprehending the process between terrestrial vegetation and climate change.
2. Data and Methods
The chart of study workflow is shown in Figure 1. We collected a GIMMS NDVI3g dataset of vegetation index, meteorological factors including temperature, precipitation, and insolation, vegetation type data, and phenological observation data during the period of 1982–2014 in northeast China. In order to achieve consistency between vegetation index and climate factors, we pre-processed the dates. We used a Savitzky–Golay filtering method to smooth and reconstruct the NDVI time series. Then, we conducted double logistic fitting on the extraction of phenological parameters. The phenological records as validation data were compared to the findings of the current work. Finally, we quantified the trends of vegetation phenological parameters and detected the correlation of vegetation phenological parameters with climate factors.
2.1. Study Area
Northeast China (38°42′N–53°35′N, 115°32′E–135°09′E), covering Heilongjiang, Jilin, Liaoning, and eastern Inner Mongolia Autonomous Regions (i.e., Hulun Buir, Tongliao, Chifeng, and Khingan), locates in the eastern margin of the Eurasian continent and includes an entire area of approximately 1.24 × 10⁶ km2 (Figure 2). This area has a representative temperate and monsoon continental climate, with the winter season being long, dry, and cold and the summer season being short, humid, and mild. The average annual temperature ranges between −1.1 °C in the north and 4.4 °C in the south, and the annual total precipitation ranges between <200 mm in the west and 400–700 mm [32] in the east. Surrounded by mountains, the study area includes the northwestern part of Great Khingan Mountains, the northeastern part of Lesser Khingan Mountains, the southeastern part of Changbai Mountains, and the southern part of Liaodong Hills. Plains, such as Sanjiang Plain, Songnen Plain, and Liaohe Plain, are situated at the northeastern corner and the central and southwestern parts. In addition, the western tip of the research area is enclosed by the Hulun Buir Plateau. The co-existence of forest, cultivated land, and grassland shows a heterogeneous and fragmented pattern, making northeast China exceptionally sensitive to climate change.
2.2. Data Sources
The GIMMS NDVI3g dataset was from AVHRR on NOAA’s polar-orbiting satellites, generally regarded as a biophysical parameter that can suggest vegetation “greenness” [1]. The latest NDVI dataset in a consistent long-term series (1982–2014) with the spatial resolution of 8 km × 8 km and a bi-weekly temporal resolution were acquired based on the GIMMS group, which has been modified for solar geometry, orbital drift, calibration, clouds, heavy aerosols, and other impacts unrelated to vegetation change [6,8]. The NDVI long-term dataset was downloaded from https://ecocast.arc.nasa.gov/data/pub/gimms/, accessed on 17 January 2018.
The vegetation type data came from the Institute of Geography at the Chinese Academy of Sciences, which were digitised from the 1:1,000,000 vegetation map of China [33]. Vegetation in this study mainly consisted of forest, cultivated land, and grassland (Figure 2). Image pixels including surface water, urban, and swamp were excluded from the NDVI dataset.
The climate datasets including daily temperature, precipitation, and insolation during the period of 1982–2014 were gathered at the China Meteorological Data Service Center (http://data.cma.cn/, accessed on 20 December 2017). The study area includes 104 meteorological stations and all meteorological data were verified and examined. The current work assessed the average temperature, total precipitation, and mean insolation of every season: spring (May–March), summer (June–August), autumn (September–November), as well as winter (December–February (next year)). To achieve consistency with the GIMMS NDVI3g dataset, the climate data were added and rasterised to a spatial resolution of 8 km × 8 km with the Kriging method in ArcGIS 10 (Environmental Systems Research Institute, Inc., Redlands, CA, USA).
The phenological observation data were provided by the Chinese Phenological Observation Network (http://www.geodata.cn/, accessed on 20 January 2018). There are eight typical phenological stations in northeast China: Jiamusi, Mudanjiang, Nenjiang, Dedu, Haerbin, Changchun, Shenyang, and Gaizhou. The representative plants at each station were chosen in accordance with the principles of dominant species, length of monitoring period, and completeness of records from 1982–2008. We analysed the phenological records of the eight ground phenological observation sites in northeast China, for 1982–2008, and the results of the phenological records as validation data were compared to the findings of the current work.
A description of the datasets applied in our study is shown in Table 1.
To remove errors produced by clouds, atmosphere, ice and snow contamination, and surface bidirectional reflectance [5,34], we employed a Savitzky–Golay filtering method on the bi-weekly NDVI dataset for smoothing and reconstructing the NDVI time series [35,36]. Furthermore, we conducted double logistic fitting on the extraction of phenological parameters (SOS, EOS, and LOS) [37]. The Logistic fuction was early used in researches on the extraction of vegetation phenological parameters, and the results extracted by this method have good consistency with data of the phenology observation sites [21,22]. Moreover, this method was applied in previous studies of phenological shifts in the mid- and high-latitude areas in the Northern Hemisphere [19]. In the current research, first, we used the Double Logistic function shown in Equation (1) to fit the filtered NDVI time series, then derived the function, and defined the point with the largest NDVI change rate as SOS. We defined the EOS as the first date after maximum NDVI as the NDVI reduced to 80% of the maximum value (i.e., 0.8 × [NDVImin + NDVIdiff]). The difference between the EOS and the SOS was regarded as the LOS [3].
where NDVImin represents the minimum value of the annual NDVI; NDVIdiff denotes the difference of the maximum and minimum values of the annual NDVI; ri indicates the maximum increase rate of NDVI; and SOG and EOG were theoretical SOS and EOS, respectively.
2.3. Statistical Analysis
We first identified linear trends with the ordinary least squares regression approach to extract vegetation phenological parameters for the whole research area (Equations (2) and (3)).
where y is the vegetation phenological parameter, t means year, and and represent the average values of y and t, separately. The slope (a) denotes the trend magnitude, b denotes the intercept, and ε signifies the residual error. The linear regression method was applied in further exploring the change in vegetation phenological parameters at the pixel scale (Equation (4)).
where is the trend of vegetation phenological parameter, n equals 33 (1982-2014), i represents the order of year from 1 to 33 during the research period, and VPPi suggests the vegetation phenological parameter of the ith year. The vegetation phenological parameters in 1982–2014 increase as > 0 and decrease as < 0.
During the research, Pearson’s correlation coefficient was measured to identify the correlations of vegetation phenological parameters with climate factors in northeast China. Coefficient values range from +1 to −1. A value of 0 suggests that there exists no correlation among variables. A negative coefficient shows that when one variable reduces, the other enhances. A positive coefficient implies the same direction of change of these two variables. Coefficients were calculated at spatial average value and the pixel scales (Equation (5)) [32].
where denotes the correlation coefficient of x and y; xi and represent the values of these two variables of the th year; and and refer to the average values of x and y in 1982–2014, respectively.
3. Results
The results showed that the SOS slightly advanced, the EOS showed a significant delay, and the LOS exhibited a significant prolonging at the regional scale. At the different vegetation types scale, there exited diverse responses of vegetation phenological phases to climate change for forest, grassland, and cultivated land. The SOS had a significant negative relationship with the average temperature in springtime, while the EOS was notably negatively connected to summer total precipitation. At the pixel scale, the correlation of phenological parameters with climate variables showed strong spatial heterogeneities.
3.1. Spatial Distribution of Vegetation Phenological Parameters
To identify the spatial distribution pattern for vegetation phenology of northeast China, this study identified the average values of vegetation phenological parameters in 1982–2014 (Figure 3). Overall, the spatial distribution for all three phenological parameters showed clear heterogeneity, and there was a substantial difference in spatial pattern between SOS, EOS, and LOS. First, the SOS occurrence during 1982–2014 widely changed between the 100th day of year (DOY) (approximately 10 April) and the 160th DOY (approximately 10 June) (Figure 3a). There was a relatively early SOS (between the 100th and 130th DOY) in the Great Khingan Mountains, Lesser Khingan Mountains, Liaodong Hills, and Changbai Mountains, which were mainly dominated by forest. The regions with late SOS (between the 140th and 160th DOY) were mostly situated in Sanjiang Plain, Songnen Plain, and Liaohe Plain, and they were main cropland areas of northeast China. Second, the spatial pattern of EOS showed a different distribution to SOS (Figure 3b). The EOS mostly occurred between the 245th DOY (approximately 5 September) and the 280th DOY (approximately 10 October) and presented an enhancing trend from north to south. The earliest vegetation senescence was situated in the Great Khingan Mountains and Lesser Khingan Mountains, and mainly occurred between the 245th and 255th DOY. The EOS in the plain regions (Sanjiang Plain, Songnen Plain, and Liaohe Plain) occurred a little later than the northern Mountains. The southern Mountains, which included the Liaodong Hills and Changbai Mountains, had the latest EOS, typically taking place by the end of September. Finally, as a result of SOS and EOS, the average LOS ranged in 100 - 160 days (Figure 3c). Compared with other areas of northeast China, the Liaodong Hills and Changbai Mountains had an earlier average SOS and later average EOS, thereby showing a longer LOS. Moreover, the plains areas had the shortest LOS.
3.2. Variations of Vegetation Phenological Parameters
3.2.1. Temporal Variations in Vegetation Phenological Parameters at the Regional Scale
Figure 4 reveals the long-term variations in the vegetation phenological parameters from 1982–2014. As seen in Figure 4a, the vegetation SOS advanced slightly by 0.03 days year−1 while statistically insignificant variation of the SOS was found through the whole study period. In contrast, the EOS of the total study area presented a strongly obvious delay of 0.10 days year−1 (p < 0.01) (Figure 4b). Therefore, in association with long-run variation of the SOS and the EOS, there existed an obvious increase in the LOS at the rate of 0.13 days year−1 (p < 0.05), indicating that northeast China experienced lengthening of growing season during 1982–2014 (Figure 4c).
3.2.2. Spatial Pattern of Change Trends in The Vegetation Phenological Parameters
The spatial pattern for the temporal linear change trends of the SOS, EOS, and LOS as well as the consistent 5% significance level from 1982–2014 were computed on the basis of the 33 years of multi-SOS, multi-EOS, and multi-LOS raster layers (Figure 5). There existed significant spatial heterogeneity at the pixel scale. The pixels showing decreasing trends (SOS_trend < 0) occupied 58.8% of the entire study area, implying that an earlier SOS occurred in more than 50% of the total area (Figure 5a). The percentages of SOS change trend magnitudes in the ranges of <−0.4, −0.4 to –0.2, and –0.2 to 0 were 4.7%, 21.3%, and 32.8%, respectively. Moreover, 19.1% of the pixels in the research region presented obvious (p < 0.05) advancement of the SOS with the main distribution in the Great Khingan Mountains, Lesser Khingan Mountains, and Liaodong Hills (Figure 5b). The pixels showing delaying of the SOS (SOS_trend > 0) occupied 41.2% of the study area, among which 13.1% presented statistical significance (p < 0.05) (Figure 5a,b). The trend of increasing of SOS suggests that the SOS was significantly (p < 0.05) delayed in the Plain regions (Sanjiang Plain, Songnen Plain, and Liaohe Plain). The EOS of most parts in the study region (approximately 72.1%) exhibited delay, with 28% of the pixels indicating significant postponement (p < 0.05) (Figure 5c,d). The pixels that presented a delayed EOS trend were located at most parts in the study region, excluding the Liaohe Plain and the Hulun Buir Plateau. The EOS was particularly strongly delayed in the Lesser Khingan Mountains, the northeastern Songnen Plain, and southwestern areas of the Changbai Mountains. Due to the variations of SOS and EOS, there were substantial changes in the LOS of northeast China (Figure 5e,f). The LOS increased in 68.1% of the total study area and 29.7% significantly increased (p < 0.05). The increasing change in the LOS were mostly larger than 0.2 days year−1, i.e., the LOS was prolonged by more than 6.6 days during 1982–2014 in the Great Khingan Mountains, Lesser Khingan Mountains, southern areas of Liaohe Plain, and Liaodong Hills. In addition, there were some regions with a shorter growing season that were found in some scattered regions in the Songnen Plain, Sanjiang Plain, and Liaohe Plain. Overall, the change trends in the SOS had a relationship with vegetation types (i.e., pixels with significantly earlier SOS were mostly found in forest areas and pixels with significantly delayed SOS were mostly distributed in cultivated areas and some grassland areas). The EOS was delayed in most regions of northeast China. As shown for the SOS and the EOS, pixels with prolonged LOS were mostly located in forest areas.
3.3. Relationships between Vegetation Phenological Parameters and Climate Variables
3.3.1. Relationships between Vegetation Phenological Parameters and Climate Variables at the Regional Scale
In order to detect the variability of vegetation phenological parameters related to climate factors, we analysed the relationships between the SOS or the EOS and the 15 climate factors (previous autumn mean temperature, previous winter mean temperature, spring mean temperature, summer mean temperature, autumn mean temperature, previous autumn total precipitation, previous winter total precipitation, spring total precipitation, summer total precipitation, autumn total precipitation, previous autumn mean insolation, previous winter mean insolation, spring mean insolation, summer mean insolation, and autumn mean insolation). As shown in Table 2, the correlation coefficient of SOS with spring mean temperature remained stronger than the correlation coefficient of SOS with other climate factors across the whole study area (r = −0.59, p < 0.01), suggesting that there existed an obvious negative relation between SOS and spring mean temperature. The advancement of the SOS was attributed to a warmer spring temperature. EOS and summer total precipitation were obviously negatively correlated (r = −0.34, p < 0.05). These analyses confirm that summer total precipitation was the leading factor affecting the EOS in northeast China.
3.3.2. Relationships between Vegetation Phenological Parameters and Climate Variables at the Pixel Scale
To deeply evaluate the impacts of climate variables on the vegetation phenological parameters of northeast China, the research computed the correlation coefficients between SOS and EOS with 15 climate factors during 1982–2014 for all pixels (Figure 6 and Figure 7). The percentages of the obvious significant (p < 0.05) correlation between vegetation phenological parameters and climate factors are presented in Table 3. There were no strong effects of previous autumn temperature, previous autumn total precipitation, and previous autumn insolation on the vegetation SOS (Figure 6a,d,g, and Table 3). SOS and previous winter mean temperature were significantly positively correlated, being mainly located in central Songliao Plain (Songnen Plain and Liaohe Plain) (approximately 6.10%) (Figure 6b, Table 3). Figure 6c showed that the SOS in the Great Khingan Mountains, Lesser Khingan Mountains, Changbai Mountains, and Liaodong Hills were significantly and negatively related to spring mean temperature in 47.42% of the whole research area. However, the SOS in the Hulun Buir Plateau, central Songliao Plain were positively related to spring temperature, occupying 19.04% of the entire study area (Table 3). The research indicated the spring mean temperature exerted a significant influence on the vegetation SOS, especially for forests. There existed a negative correlation between the SOS and the previous winter total precipitation in most parts of the study area (approximately 74.14%) (Figure 6e, Table 3). According to the spatial distribution concerning the correlation between SOS and spring precipitation, there existed the obvious negative correlation in the Hulun Buir Plateau and the southwestern Songnen Plain and Liaohe Plain (Figure 6f). A positive correlation between the previous winter mean insolation was found in the Hulun Buir Plateau, central Songliao Plain, eastern and southwestern Changbai Mountains, and Liaodong Hills, accounting for 61.85% of the study area (Figure 6h, Table 3). There was a negative correlation in most areas of northeast China (approximately 81.24%) between the spring mean insolation and the SOS (Figure 6i, Table 3), indicating that increased insolation can advance the SOS in northeast China from 1982–2014. Overall, the SOS in most of the forest areas was controlled by the spring temperature and the SOS in the central Songliao Plain was governed by previous winter temperature and previous winter insolation (Figure S1).
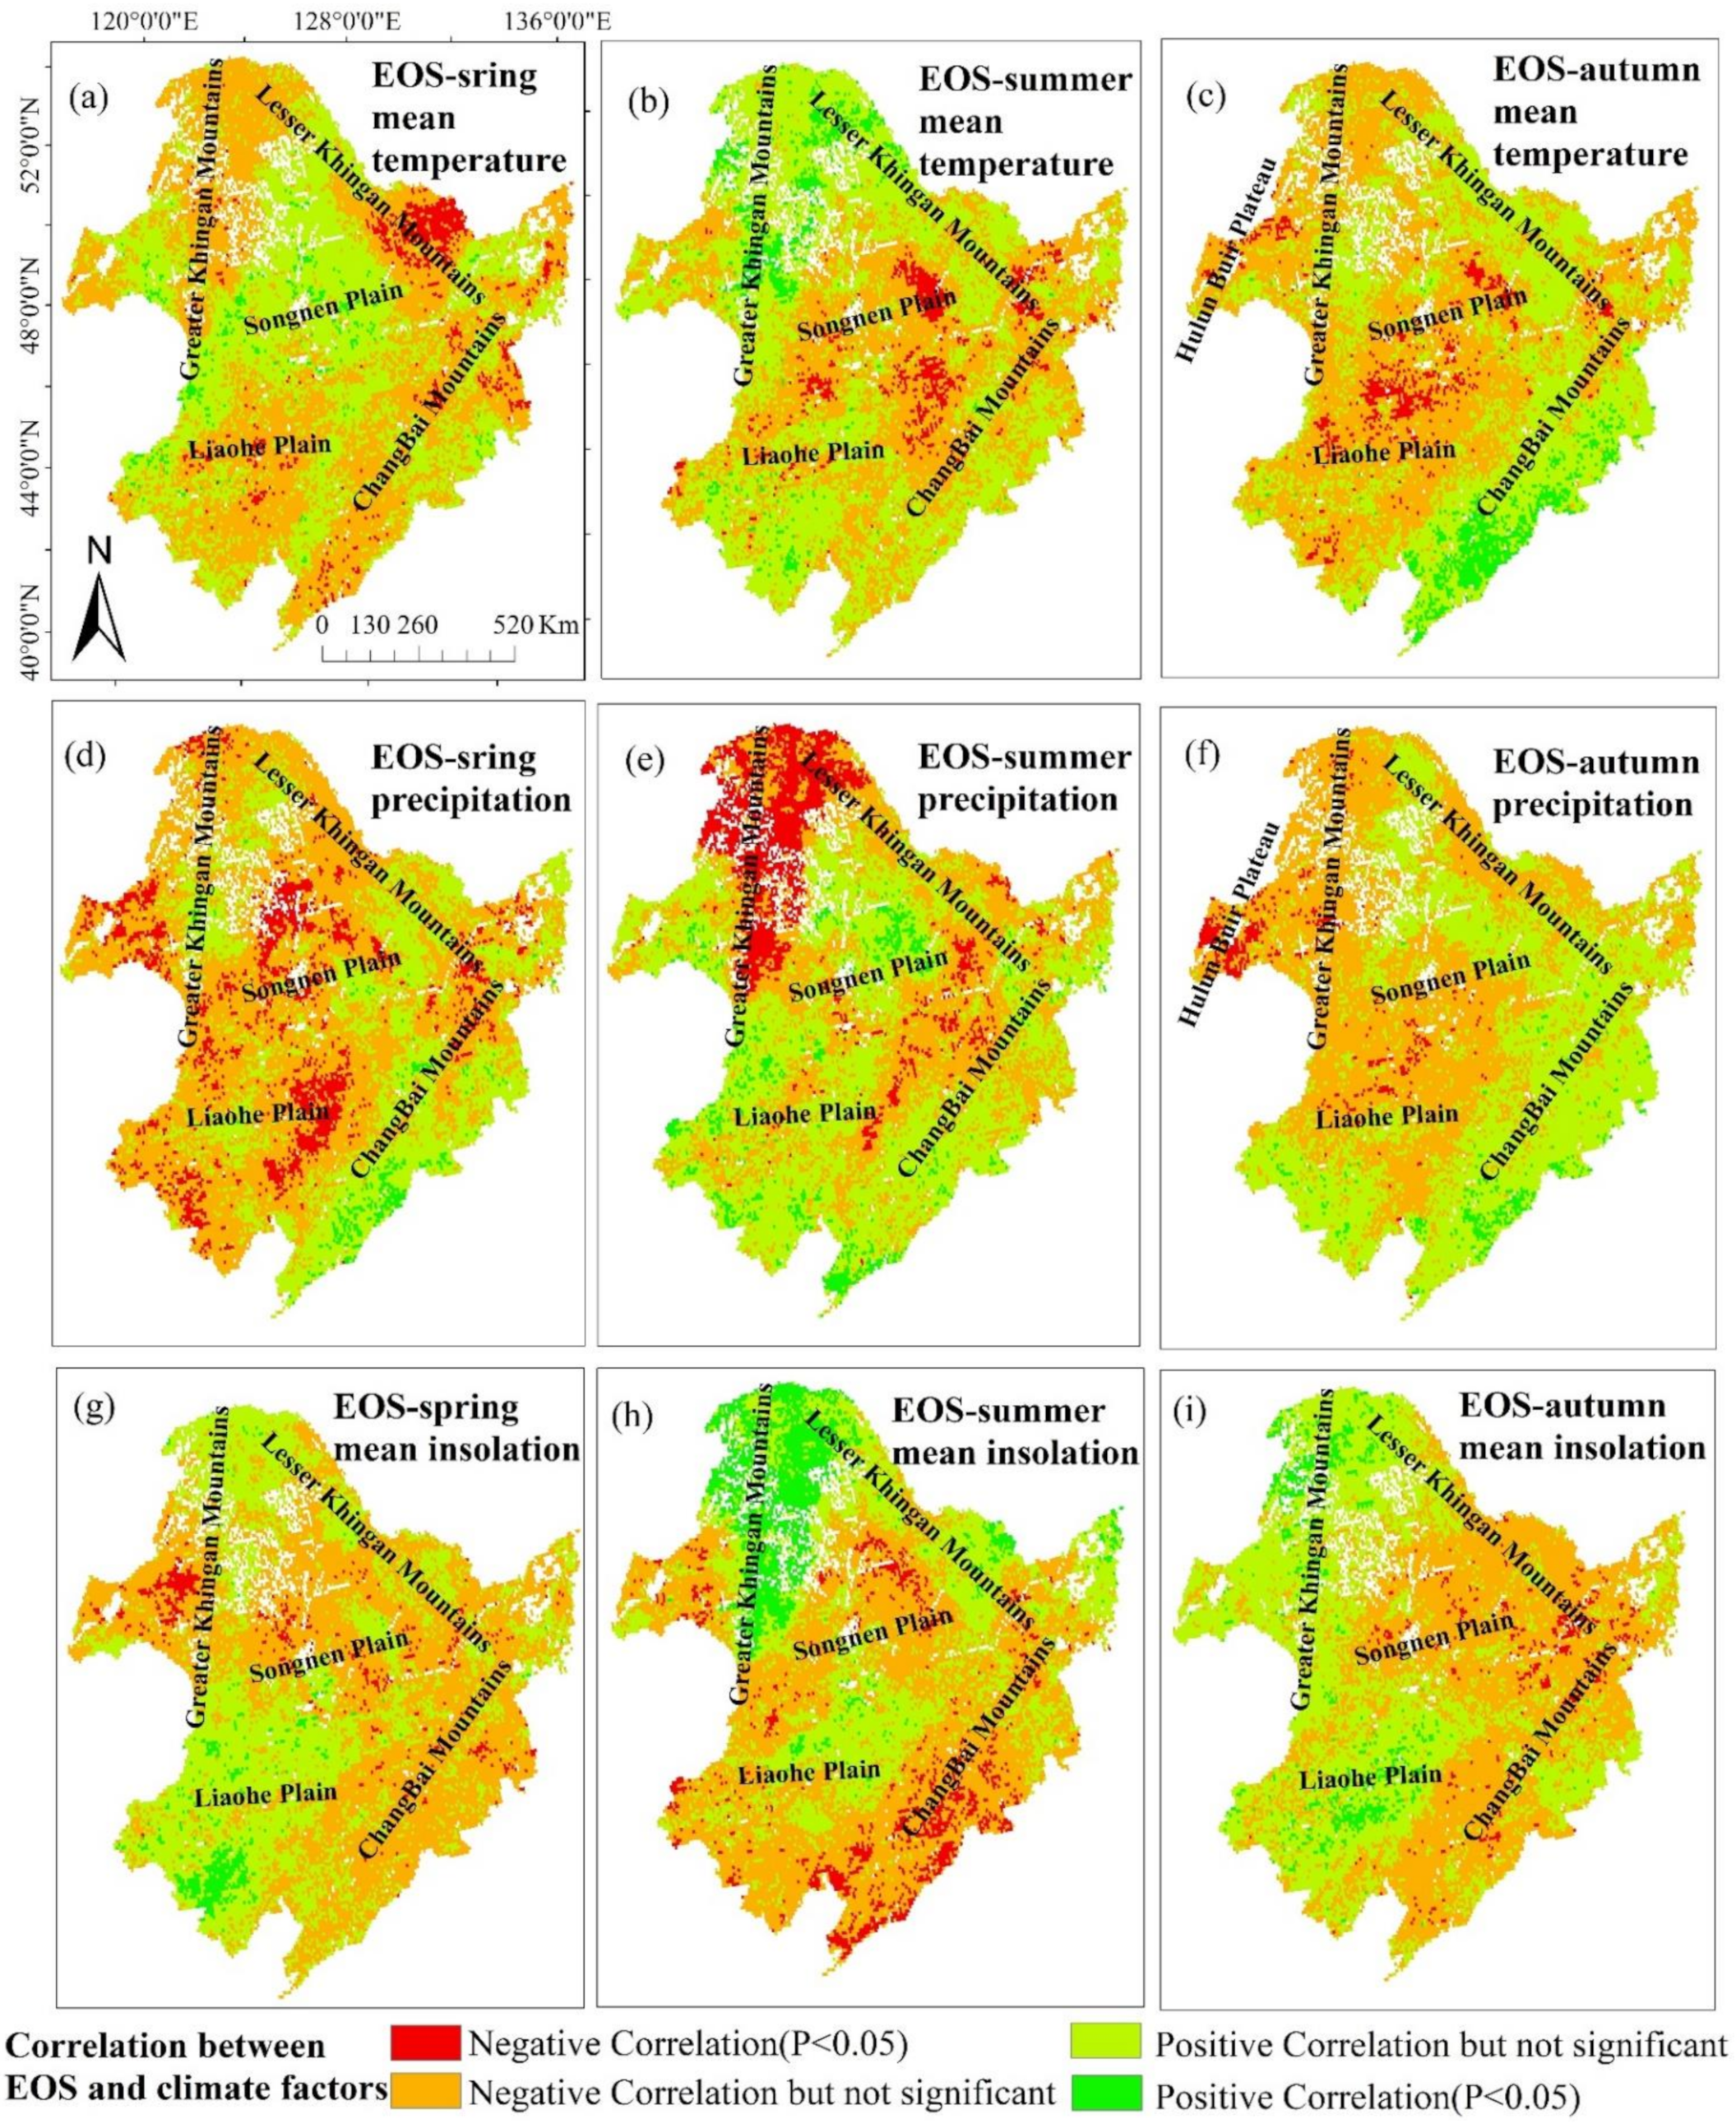
Figure 7 exhibits the spatial distribution of the correlation of vegetation EOS with climate factors. The EOS was weakly positively related to spring mean temperature, which was mainly observed in Sanjiang Plain, Songnen Plain, and the eastern Hulun Buir Plateau, while a significant negative correlation was seen from the southern Lesser Khingan Mountains (approximately 4.18% of the total study area) (Figure 7a, Table 3). As shown in Figure 7b, the EOS was significantly positively correlated to the summer temperature in the Great Khingan Mountains and the northern Lesser Khingan Mountains, which constituted approximately 4.18% of the total study area, suggesting that the increased summer temperature can lead to the delayed EOS in high-latitude forest (Table 3). However, there was an obvious negative correlation of EOS with summer temperature across some scattered regions in the Sanjiang Plain, eastern Songnen Plain, and northeastern Liaohe Plain, which are dominated by croplands (Figure 7b). There existed an obvious positive correlation of EOS with autumn mean temperature in some regions of the Changbai Mountains and Liaodong Hill, and a notably negative correlation in the central Songliao Plain (Figure 7c). EOS and spring total precipitation were strongly negatively correlated in some regions of the Hulun Buir Plateau and Sanjiang Plain, Songnen Plain, and Liaohe Plain, accounting for 10.18% of the entire study area (Figure 7d, Table 3). The spatial distribution of correlation of EOS with summer precipitation (Figure 7e) revealed an obvious negative correlation of EOS in the Great Khingan Mountains and the northern Lesser Khingan Mountains with summer precipitation, indicating that the delayed EOS in these areas could be attributed to the decreased summer precipitation. In contrast, EOS and summer precipitation of the Hulun Buir Plateau, the northern Songnen Plain, the southwestern Liaohe Plain, the southern Sanjiang Plain, the southwestern Changbai Mountains, and Liaodong Hill were positively correlated. In these areas, the EOS was delayed because of the increased summer precipitation. In the steppe-dominated regions of the Hulun Buir Plateau, there existed an obvious negative correlation between EOS and autumn precipitation (Figure 7f). The spatial pattern of correlation of EOS with summer mean sunshine duration demonstrated that the EOS of northern forest areas (Great Khingan Mountains and northern and southern Lesser Khingan Mountains), the central Songliao Plain, and the eastern Sanjiang Plain, were mostly positively related to the summer insolation, especially in the Great Khingan Mountains, the northern and southern Lesser Khingan Mountains with a significant correlation at the 5% level and that the EOS in the other regions was negatively related to summer mean insolation (Figure 7h). Overall, the EOS in northern forest (Great Khingan Mountains) was dominated by summer precipitation and summer insolation, the EOS in southern forest (Changbai Mountains and Liaodong Hills) was governed by autumn temperature, the EOS in the Hulun Buir Plateau dominated by grassland was related to autumn precipitation, and the EOS in cultivated land was governed by various factors including summer temperature, autumn temperature, spring precipitation, and autumn insolation, indicating that the factors driving EOS in cultivated land were complex (Figure S2).
3.4. Phenological Parameters of Different Vegetation Types
3.4.1. Temporal Variations in Phenological Parameters within Different Vegetation Types
The trends of change in phenological parameters within different vegetation types can be found in Table 4. The SOS for the forest and the grassland showed a non-significant advancing trend, whereas there existed a weak delaying trend for cultivated land. In contrast to SOS, the EOS showed delaying trend for all three vegetation types. The EOS for forest was significantly (p < 0.01) delayed at a rate of 0.16 days year−1. For cultivated land, the EOS showed a significant (p < 0.05) delaying trend with a rate of 0.08 days year−1. The change trend of the EOS was lowest for grassland, with 0.02 days year−1 delay. The earlier SOS and the later EOS help enhance the LOS in forest as well as grassland. In terms of forest, there existed a significant (p < 0.05) prolonging in the LOS at a rate of 0.22 days year−1. The LOS for cultivated land showed a non-significant increase at a rate of 0.09 days year−1, which was related to the later EOS. In general, the lengthened LOS in northeast China from 1982–2014 was attributed to the later EOS for the forest and the cultivated land, whereas the extension of LOS for grassland was mainly caused by the earlier SOS.
In addition, to further explore the trends of changes in SOS, EOS, and LOS in diverse vegetation types, we calculated the number of pixels showing changes at significance levels at 5% (Table 5, Table 6 and Table 7). As shown in Table 5, there were significantly more pixels showing a significant decrease in the SOS than those showing significant increase for the forest and the grassland, indicating that many pixels showed significantly earlier SOS in the forest and the grassland areas. However, the number of the pixels presenting the obvious reduction in the SOS for the cultivated land was significantly less than the number of pixels denoting significant increase, suggesting that many pixels showed significantly later SOS in the cultivated areas. The number of pixels presenting obvious increase in the EOS for the forest was much higher than the pixels showing significant decrease (Table 6). In addition, the number of pixels denoting an obvious increase in the EOS for the cultivated land was obviously higher when compared with the number pixels showing a significant decrease. In contrast, the number of pixels denoting an obvious increase in the EOS was slightly higher than the number of pixels denoting an obvious increase in grassland areas. As the combined change trends in SOS and EOS, the number of pixels presenting the obvious increase in the LOS for forest was significantly higher than the number showing a significant increase, indicating that many pixels exhibited significantly lengthened LOS in the forest areas (Table 7). Similarly, the number of pixels of obvious increase in the LOS for the grassland area was notably higher than the counts of pixels showing a significant decrease. However, there existed no notable difference in the LOS for the cultivated area between the numbers of pixels showing significant increase and significant decrease, indicating that there was no significant change in the LOS for the cultivation area in northeast China for 1982–2014.
3.4.2. Relationships between Vegetation Phenological Parameters and Climate Variables within Different Vegetation Types
To further analyse the variability of vegetation phenological parameters (SOS and EOS) related to climate variables, the research computed the correlation coefficients between SOS and EOS and climate factors in different vegetation types (Table 8 and Table 9). Table 8 shows the correlation coefficients between SOS and nine climate factors of the forest, the cultivated land, and the grassland. For the forest areas, the correlation coefficients between SOS and spring mean temperature (r = −0.7, p < 0.01) were stronger than the coefficients between SOS and the other variables, proving that the spring temperature was the leading factor of SOS and warmer spring temperature, which caused an earlier SOS to the forest. In the cultivated areas, significant negative correlations were found between SOS and spring mean temperature and spring mean insolation. It acknowledges spring precipitation and insolation as key drivers which can influence greening of cultivated land and low rainfall and insolation in the spring may lead to a later SOS. In grassland areas, there existed an obvious negative correlation of SOS with spring mean insolation. Table 9 presents the correlation coefficients between EOS and climate factors in different vegetation types. EOS and summer total precipitation were significantly negatively correlated (r = −0.35, p < 0.05), suggesting that low rainfall in the summer would lead to later EOS in the forest areas. In the cultivation areas, EOS was insignificantly correlated with climate variables. Nevertheless, there existed several weak correlations between EOS and summer mean temperature, between EOS and spring and summer total precipitation, and between EOS and autumn mean insolation. For the grassland areas, we observed a notable negative correlation between the EOS and the autumn total precipitation, implying that high rainfall in the autumn may cause the EOS to advance.
4. Discussion
4.1. Variations in Vegetation Phenological Parameters over the Last 33 Years
It is important to note that there are many approaches to extracting the vegetation phenological parameters from a variety of long-term NDVI datasets, but there is not yet a universal method [38]. Therefore, the results vary between studies, which can be attributed to using different NDVI dataset sources and different extraction methods. The results of our study illustrated that most SOS dates ranged in the 100th–160th DOY, which was in consistence with numerous former researches. Zhao et al. [31] concluded that the average SOS in northeast China firstly happened between the 110th and 150th DOY. In addition, Tang et al. [2] showed that the SOS dates in the Great Khingan Mountain area of northeast China were widely distributed from the 90th to 150th DOY. In our study, the EOS mostly occurred between the 245th and the 280th DOY and showed an increasing trend from north to south. The latest EOS took place in southern Mountains, containing the Liaodong Hills and Changbai Mountains. The Liaodong Hills and Changbai Mountains, which are strongly affected by monsoons, are situated at comparatively low latitudes, which possess more suitable hydrothermal situations than other areas, and thereby the EOS in these regions arrived later [31]. The results of Liu et al. [6] illustrated an EOS between the 250th and 290th DOY in northeast China by employing a double logistic method which employed the same method as our study. Because of the similar SOS but earlier EOS, the LOS in our research was lower than the results in Yu et al. [19]. As shown by Liu et al. [6], the EOS based on the double logistic approach took place earlier than the EOS based on other extraction methods. Moreover, we analysed the phenological records of the eight ground phenological observation sites in northeast China, for 1982–2008, and discovered that the SOS mostly took place between the 105th and 150th DOY and the EOS was mainly between the 250th and 290th DOY. The results of the phenological records were in line with the findings of the current work, implying that the vegetation parameters extracted by using the double logistic method in our study were reliable.
Earlier SOS, delayed EOS, and prolonged LOS have been investigated in many previous studies. On a hemispheric scale, Julien and Sobrino [39] revealed advancement in SOS with a rate of 0.38 days per year and postponement in EOS by 0.45 days year−1 during 1981–2003. Stockli and Vidale [40] found that there was an earlier SOS by 0.54 days year−1 and a prolonged LOS by 0.96 days year−1 in Europe during 1982–2001. In temperate China, the advance in SOS was 0.79 days year−1. Meanwhile, the delay in EOS was 0.37 days year−1 during the period from 1982–1999. However, the SOS presented a slow advancing trend with the study period being extended. For example, Jeong et al. [1] showed the advance in SOS by 0.29 days year−1 during the initial research period in 1982–1999, but the advance of the SOS subsequently slowed, at a rate of 0.02 days year−1 in the later period (2000–2008). Moreover, Zhao et al. [31] revealed that the average SOS failed to present a notable advancing trend (0.04 days year−1) over northeast China during 1982–2013. Although the magnitudes of phenological parameters were slightly different, the results of our study revealed that advanced SOS, postponed EOS, and prolonged LOS were consistent with some previous literature. The differences between the results may be attributed to different study periods, different study areas, different extraction methods, and the application of different datasets.
Different vegetation types had different phenological shifts [26,27,28]. Some previous studies mainly focused on the average regional-scale trends, ignoring the spatial heterogeneity among diversity of vegetation types. The current work not only analysed the change of vegetation phenological parameters at the regional scale but also demonstrated changes in vegetation phenological parameters in three main vegetation types of northeast China. According to Figure 5 and Table 4, we found the advance in SOS and delay in EOS, and the LOS was obviously prolonged in most forest and grassland areas of northeast China, whereas the SOS was mainly delayed in cultivated regions. Table 5, Table 6 and Table 7 indicate that the number of pixels of cultivated land with a significantly delayed SOS was much higher than those for forest and grass, and the number of pixels of forest with significantly delayed EOS and prolonged LOS was much higher than that for cultivated land, indicating that the change of the LOS in forest areas was more positive than that in cultivated land under the background of climate change. This may be related to the geographical situations for the reason that the forests in northeast China are located in relatively humid regions [41] and the forests belong to natural vegetation, thereby requiring no artificial governance and interference from humans. In addition, Shrestha et al. [42] proved that a notable earlier SOS occurred in the forest area. Zhao et al. [31] noticed the delay of SOS in cultivated land during the period of 1982–2013. Our results are in line with these previous studies.
4.2. Relationships between Vegetation Phenological Parameters and Climate Factors
In studies of vegetation phenology, variations are mostly attributed to climate variables, including temperature and precipitation, while the impacts of light situations on phenological shifts, such as light intensity and photoperiod, are generally ignored [6]. In general, solar radiation is investigated as the main parameter of light influencing vegetation at the regional scale. Furthermore, several former researches have indicated that there exists the time lag between vegetation growth and climate factors [11,43]. Therefore, when detecting the correlations between the vegetation phenological parameters and climate variables, we not only calculated the correlations between phenological parameters and temperature, precipitation, and insolation in the same season (spring and autumn), but also computed that in the previous season. Many studies have shown that a warmer spring enables an earlier SOS and longer LOS in mid- and high-latitude areas in the Northern Hemisphere [2]. The obtained results were in line with the former findings. This could be found that there existed an obvious negative association of SOS with spring mean temperature, indicating that warmer spring temperature would lead to an earlier SOS, especially in forest areas of northeast China. Warm temperatures in spring will speed up the accumulation of heat and advance the resumption of active growth [44,45]. Recent studies have shown that warmer winter temperatures possibly postpone the accomplishment of chilling demands and slow the dormancy breaking process, and thus lead to a later SOS [46]. However, an insignificant negative correlation of SOS with winter mean temperature was detected at the regional scale in our study. Obvious positive correlations between SOS and winter mean temperature and between SOS and winter mean insolation were found in southwestern Songnen Plain and northern Liaohe Plain, whereas the SOS was delayed, indicating that increasing winter temperature and insolation in these areas caused a delay in SOS and the importance of winter temperature and insolation in determining vegetation greening in the coming year. In addition, an obvious negative correlation of SOS with spring total precipitation was observed in Hulun Buir Plateau, suggesting that spring precipitation significantly controlled vegetation growth in the next year, especially in the semi-arid areas. Precipitation was considered a leading factor influencing the process of greening and duration of vegetation of arid and semi-arid regions [47]. Compared with the negative association between the SOS and temperature, EOS and summer mean temperature were positively correlated. Vegetation leaf senescence is mostly regulated by cumulative cold temperatures below the threshold temperature [48], thus increased summer temperature can lead to delayed EOS. EOS and summer total precipitation were significantly negatively correlated across the study area, especially in the Great Khingan Mountains. Since northeast China is located at a high latitude and features cool temperatures, increased precipitation in summer could lead to an enhancement in cloud cover, reduced solar radiation and soil temperature, as well as stopped water absorption of the root system from near-frozen soil [49]. Furthermore, we found that there existed an obvious positive correlation of EOS with summer insolation distributed in the northern forests in northeast China, suggesting that an increased insolation in summer will lead to a delay in EOS. Through analyzing the correlations of EOS with climate factors, the dormancy of vegetation was in significant association with temperature, precipitation, as well as insolation in the previous season.
4.3. Uncertainties
Our results revealed the positive response of LOS in forest to climate change, while the LOS in cultivated land showed a steady change trend. Phenological events for forest were mainly controlled by climate factors, whereas phenological shifts in cultivated land rigorously influenced by human activities were influenced by both climate change, and planting, crop type, irrigation, fertilisation, and harvest [11]. The LOS duration strongly affects the interannual variations of plant growth and also profoundly impacts the vegetation gross and net primary production (NPP) and the net carbon dioxide uptake [38,50,51]. Piao et al. [52] revealed the strong correlation of changes in growing season with those in NPP. The NPP is a major factor in adjusting carbon uptake in terrestrial ecosystems, and alterations in growing season of vegetation can exert a substantial role in the variability in atmospheric carbon magnitude and content [53]. The prolonged LOS of forest in northeast China may lead to increases in NPP and enhance the carbon uptake capacity of territorial ecosystems. A shorter LOS was found in the Sanjiang Plain and most areas of the Liaohe Plain dominated by cultivated land and grassland, indicating a reduction in the risk of environmental damage, such as cold damage and hailstones in these regions. However, the production of cropland was related to LOS, so we will further study the effects of changes in the LOS on the production of cropland in future. Moreover, we only analysed the impacts of climate factors (including temperature, precipitation, and insolation) on the vegetation phenological parameters, and ignored other variables such as the effects of latitude, the changes in land use and land cover, and the variations in atmospheric CO2 concentrations, thus these factors will be taken into consideration in future researches.
5. Conclusions
In the current work, we analysed the variations and characteristics of vegetation phenological parameters of northeast China during 1982–2014 at three scales and checked the associations between phenological parameters and climate factors. The main conclusions were:
- The SOS exhibited a slight advancing trend, and the EOS showed an obvious delaying trend. Meanwhile, the LOS presented an obvious prolonging trend at the regional scale.
- At the different vegetation types scale, the SOS for the forest and the grass showed non-significant advancing trends, while there was a weak delay for the cultivated land. The EOS exhibited delaying trends for forest, cultivated land, and grassland. The opposite change trends in the earlier SOS and the later EOS enhanced LOS in forest and grassland. The LOS for cultivated land showed a non-significant increasing trend.
- The pixels showing significant earlier trends in the SOS accounted for 19.1% of the whole research area with the leading distribution in the Great Khingan Mountains, Lesser Khingan Mountains, and Liaodong Hills, while the pixels that showed significant delayed trends in the SOS accounted for 13.1% and were mostly found in the plains. The EOS exhibited a delaying trend in most of the study region (approximately 72.1%) except for the Liaohe Plain and the Hulun Buir Plateau. Due to the changes in SOS and EOS, there were clear changes in the LOS of northeast China. The LOS in 29.7% of the whole study area exhibited obvious prolonged trends.
- According to the correlation of vegetation phenology with climate factors, the SOS had an obviously negative correlation with spring mean temperature and the EOS was obviously negatively connected to summer total precipitation at the regional scale. For the forest areas, the warmer spring temperature may result in an earlier SOS. In the cultivated areas, the precipitation and insolation in spring were the main drivers of SOS. In the grassland areas, there existed an obvious negative correlation between the SOS and the spring mean insolation. A significant negative correlation was observed between the EOS and the summer total precipitation, suggesting that low rainfall in summer would lead to a later EOS in the forest areas. For the grassland areas, high rainfall in autumn may cause an advancing of the EOS. At the pixel scale, the relationships between the phenological parameters and climate variables showed strong spatial heterogeneities. In addition, the SOS was dominated by the spring temperature in most forest areas. The EOS in northern forests was dominated by summer precipitation and summer insolation, whereas the EOS in southern forests was governed by autumn temperature. The EOS in the Hulun Buir Plateau, which is dominated by grassland, was related to autumn precipitation, and the EOS in cultivated land was governed by various factors including summer temperature, autumn temperature, spring precipitation, and autumn insolation.
Our results further our understanding of the decadal changes in vegetation phenology in the mid- and high-latitude regions of Northern Hemisphere and provide a good reference for detecting the regional vegetation ecosystem responses to climate change. Moreover, the obtained results suggested the impacts of scale on studying vegetation phenology; i.e., different results of changes in phenology were attributed to the examination of different scales. The responses of diverse vegetation types to climate change were variable, particularly between natural vegetation and vegetation that is governed by human activities. There was a lag effect between the vegetation phenology and climate factors. Scale, vegetation type, and the effect of lag should be completely considered in future phenological research.
Supplementary Materials
The following are available online at https://www.mdpi.com/article/10.3390/rs14030705/s1, Figure S1: Maximum correlation between the start of the growing season (SOS) and climate variables in northeast China during 1982–2014, Figure S2: Maximum correlation between the end of the growing season (EOS) and climate variables in northeast China during 1982–2014.
Author Contributions
J.G.: substantial contributions toward the processing, analysis and interpretation of data, plus manuscript preparation and final approval of the version for publication; Y.H.: funding acquisition. All authors have read and agreed to the published version of the manuscript.
Funding
This work was financially supported by the National Basis Research Program of China (2013CBA01807), the National Natural Science Foundation of China (32160262), the Natural Science Foundation of Inner Mongolia Autonomous Region (2020BS03043), and PhD. Fund of Inner Mongolia Normal University (2018YJRC016).
Acknowledgments
We would like to thank the Jian Yang for guiding of ideas of the manuscript and Jiaxing Zu for the help in explaining the methods. We would also like to thank our reviewers and editors for the comments.
Conflicts of Interest
The authors declare no conflict of interest.
References
- Jeong, S.J.; Ho, C.H.; Gim, H.J.; Brown, M.E. Phenology shifts at start vs. End of growing season in temperate vegetation over the northern hemisphere for the period 1982–2008. Glob. Chang. Biol. 2011, 17, 2385–2399. [Google Scholar] [CrossRef]
- Tang, H.; Li, Z.W.; Zhu, Z.L.; Chen, B.R.; Zhang, B.H.; Xin, X.P. Variability and climate change trend in vegetation phenology of recent decades in the greater khingan mountain area, northeastern China. Remote Sens. 2015, 7, 11914. [Google Scholar] [CrossRef] [Green Version]
- Zu, J.X.; Yang, J. Temporal variation of vegetation phenology in northeastern China. Acta Ecol. Sin. 2016, 36, 2015–2023. (In Chinese) [Google Scholar] [CrossRef]
- Peñuelas, J.; Filella, I. Responses to a warming world. Science 2001, 294, 793–795. [Google Scholar] [CrossRef] [PubMed]
- Zhou, L.; Tucker, C.J.; Kaufmann, R.K.; Slayback, D.; Shabanov, N.V.; Myneni, R.B. Variations in northern vegetation activity inferred from satellite data of vegetation index during 1981 to 1999. J. Geophys. Res. Atmos. 2001, 106, 20069–20083. [Google Scholar] [CrossRef]
- Liu, Q.; Fu, Y.S.H.; Zeng, Z.Z.; Huang, M.T.; Li, X.R.; Piao, S.L. Temperature, precipitation, and insolation effects on autumn vegetation phenology in temperate China. Glob. Change Biol. 2016, 22, 644–655. [Google Scholar] [CrossRef] [PubMed]
- Richardson, A.D.; Keenan, T.F.; Migliavacca, M.; Ryu, Y.; Sonnentag, O.; Toomey, M. Climate change, phenology, and phenological control of vegetation feedbacks to the climate system. Agric. For. Meteorol. 2013, 169, 156–173. [Google Scholar] [CrossRef]
- Wang, S.Y.; Yang, B.J.; Yang, Q.C.; Lu, L.L.; Wang, X.Y.; Peng, Y.Y. Temporal trends and spatial variability of vegetation phenology over the northern hemisphere during 1982–2012. PLoS ONE 2016, 11, e0157134. [Google Scholar] [CrossRef]
- Wu, C.; Gonsamo, A.; Gough, C.M.; Chen, J.M.; Xu, S. Modeling growing season phenology in north american forests using seasonal mean vegetation indices from modis. Remote Sens. Environ. 2014, 147, 79–88. [Google Scholar] [CrossRef]
- Suzuki, R.; Nomaki, T.; Yasunari, T. West–east contrast of phenology and climate in northern asia revealed using a remotely sensed vegetation index. Int. J. Biometeorol. 2003, 47, 126–138. [Google Scholar] [CrossRef]
- Piao, S.L.; Fang, J.Y.; Zhou, L.M.; Ciais, P.; Zhu, B. Variations in satellite-derived phenology in China′s temperate vegetation. Glob. Change Biol. 2006, 12, 672–685. [Google Scholar] [CrossRef]
- Garrity, S.R.; Bohrer, G.; Maurer, K.D.; Mueller, K.L.; Vogel, C.S.; Curtis, P.S. A comparison of multiple phenology data sources for estimating seasonal transitions in deciduous forest carbon exchange. Agric. For. Meteorol. 2011, 151, 1741–1752. [Google Scholar] [CrossRef]
- Tucker, C.J.; Slayback, D.A.; Pinzon, J.E.; Los, S.O.; Myneni, R.B.; Taylor, M.G. Higher northern latitude normalized difference vegetation index and growing season trends from 1982 to 1999. Int. J. Biometeorol. 2001, 45, 184–190. [Google Scholar] [CrossRef] [PubMed]
- Zhang, X.; Friedl, M.A.; Schaaf, C.B.; Strahler, A.H.; Hodges, J.C.F.; Gao, F.; Reed, B.C.; Huete, A. Monitoring vegetation phenology using modis. Remote Sens. Environ. 2003, 84, 471–475. [Google Scholar] [CrossRef]
- Wu, C.Y.; Hou, X.H.; Peng, D.L.; Gonsamo, A.; Xu, S.G. Land surface phenology of China′s temperate ecosystems over 1999–2013: Spatial–temporal patterns, interaction effects, covariation with climate and implications for productivity. Agric. For. Meteorol. 2016, 216, 177–187. [Google Scholar] [CrossRef]
- Chen, X.Q.; Hu, B.; Yu, R. Spatial and temporal variation of phenological growing season and climate change impacts in temperate eastern China. Glob. Chang. Biol. 2005, 11, 1118–1130. [Google Scholar] [CrossRef]
- De Beurs, K.M.; Henebry, G.M. Land surface phenology and temperature variation in the international geosphere–biosphere program high-latitude transects. Glob. Chang. Biol. 2005, 11, 779–790. [Google Scholar] [CrossRef]
- Jeong, S.J.; Ho, C.H.; Jeong, J.H. Increase in vegetation greenness and decrease in springtime warming over East Asia. Geophys. Res. Lett. 2009, 36, L02710. [Google Scholar] [CrossRef]
- Yu, L.X.; Liu, T.X.; Bu, K.; Yan, F.Q.; Yang, J.C.; Chang, L.P.; Zhang, S.W. Monitoring the long term vegetation phenology change in northeast China from 1982 to 2015. Sci. Rep. 2017, 7, 14770. [Google Scholar] [CrossRef] [Green Version]
- Reed, B.C.; Brown, J.F.; VanderZee, D.; Loveland, T.R.; Merchant, J.W.; Ohlen, D.O. Measuring Phenological Variability from Satellite Imagery. J. Veg. Sci. 1994, 5, 703–714. [Google Scholar] [CrossRef]
- Fisher, J.I.; Mustard, J.F.; Vadeboncoeur, M.A. Green leaf phenology at Landsat resolution: Scaling from the field to the satellite. Remote Sens. Environ. 2006, 100, 265–279. [Google Scholar] [CrossRef]
- Fisher, J.I.; Mustard, J.F. Cross-Scalar Satellite Phenology from Ground, Landsat, and MODIS Data. Remote Sens. Environ. 2007, 100, 261–273. [Google Scholar] [CrossRef]
- Myneni, R.B.; Keeling, C.D.; Tucker, C.J.; Asrar, G.; Nemani, R.R. Increased plant growth in the northern high latitudes from 1981 to 1991. Nature 1997, 386, 698. [Google Scholar] [CrossRef]
- Zhu, W.Q.; Tian, H.Q.; Xu, X.F.; Pan, Y.Z.; Chen, G.S.; Lin, W.P. Extension of the growing season due to delayed autumn over mid and high latitudes in north america during 1982–2006. Glob. Ecol. Biogeogr. 2012, 21, 260–271. [Google Scholar] [CrossRef]
- Jeganathan, C.; Dash, J.; Atkinson, P.M. Remotely sensed trends in the phenology of northern high latitude terrestrial vegetation, controlling for land cover change and vegetation type. Remote Sens. Environ. 2014, 143, 154–170. [Google Scholar] [CrossRef]
- Zhao, J.J.; Zhang, H.Y.; Zhang, Z.X.; Guo, X.Y.; Li, X.D.; Chen, C. Spatial and temporal changes in vegetation phenology at middle and high latitudes of the northern hemisphere over the past three decades. Remote Sens. 2015, 7, 10973. [Google Scholar] [CrossRef] [Green Version]
- Wu, X.C.; Liu, H.Y. Consistent shifts in spring vegetation green-up date across temperate biomes in China, 1982–2006. Glob. Chang. Biol. 2013, 19, 870–880. [Google Scholar] [CrossRef]
- Yang, Y.T.; Guan, H.D.; Shen, M.G.; Liang, W.; Jiang, L. Changes in autumn vegetation dormancy onset date and the climate controls across temperate ecosystems in China from 1982 to 2010. Glob. Chang. Biol. 2015, 21, 652–665. [Google Scholar] [CrossRef]
- Li, Z.G.; Tang, H.J.; Yang, P.; Wu, W.B.; Chen, Z.X.; Zhou, Q.B.; Zhang, L.; Zou, J.Q. Spatio-temporal responses of cropland phenophases to climate change in northeast China. J. Geogr. Sci. 2012, 22, 29–45. [Google Scholar] [CrossRef]
- Ren, G.Y.; Xu, M.Z.; Chu, Z.Y.; Guo, J.; Li, Q.X.; Liu, X.; Wang, Y. Change of surface air temperature in China during 1951–2004. Clim. Environ. Res. 2005, 10, 717–727. (In Chinese) [Google Scholar] [CrossRef]
- Zhao, J.J.; Wang, Y.Y.; Zhang, Z.X.; Zhang, H.Y.; Guo, X.Y.; Yu, S.; Du, W.L.; Huang, F. The variations of land surface phenology in northeast China and its responses to climate change from 1982 to 2013. Remote Sens. 2016, 8, 400. [Google Scholar] [CrossRef] [Green Version]
- Guo, J.T.; Hu, Y.M.; Xiong, Z.P.; Yan, X.L.; Li, C.L.; Bu, R.C. Variations in growing-season ndvi and its response to permafrost degradation in northeast China. Sustainability 2017, 9, 551. [Google Scholar] [CrossRef] [Green Version]
- Wei, Z.; Jin, H.J.; Zhang, J.M.; Yu, S.P.; Han, X.J.; Ji, Y.J.; He, R.X.; Chang, X.L. Prediction of permafrost changes in northeastern China under a changing climate. Sci. China Earth Sci. 2011, 54, 924–935. [Google Scholar] [CrossRef]
- Tucker, C.J.; Pinzon, J.E.; Brown, M.E.; Slayback, D.A.; Pak, E.W.; Mahoney, R.; Vermote, E.F.; El Saleous, N. An extended avhrr 8-km ndvi dataset compatible with modis and spot vegetation ndvi data. Int. J. Remote Sens. 2005, 26, 4485–4498. [Google Scholar] [CrossRef]
- Broich, M.; Huete, A.; Paget, M.; Ma, X.L.; Tulbure, M.; Coupe, N.R.; Evans, B.; Beringer, J.; Devadas, R.; Davies, K. A spatially explicit land surface phenology data product for science, monitoring and natural resources management applications. Environ. Model. Softw. 2015, 64, 191–204. [Google Scholar] [CrossRef]
- Chen, J.; Jönsson, P.; Tamura, M.; Gu, Z.H.; Matsushita, B.; Eklundh, L. A simple method for reconstructing a high-quality ndvi time-series data set based on the savitzky–golay filter. Remote Sens. Environ. 2004, 91, 332–344. [Google Scholar] [CrossRef]
- Butt, B.; Turner, M.D.; Singh, A.; Brottem, L. Use of modis ndvi to evaluate changing latitudinal gradients of rangeland phenology in sudano-sahelian west africa. Remote Sens. Environ. 2011, 115, 3367–3376. [Google Scholar] [CrossRef]
- White, M.A.; Running, S.W.; Thornton, P.E. The impact of growing-season length variability on carbon assimilation and evapotranspiration over 88 years in the eastern us deciduous forest. Int. J. Biometeorol. 1999, 42, 139–145. [Google Scholar] [CrossRef]
- Julien, Y.; Sobrino, J.A. Global land surface phenology trends from gimms database. Int. J. Remote Sens. 2009, 30, 3495–3513. [Google Scholar] [CrossRef] [Green Version]
- Stöckli, R.; Vidale, P.L. European plant phenology and climate as seen in a 20-year avhrr land-surface parameter dataset. Int. J. Remote Sens. 2004, 25, 3303–3330. [Google Scholar] [CrossRef]
- Yu, L.X.; Zhang, S.W.; Tang, J.M.; Liu, T.X.; Bu, K.; Yan, F.Q.; Yang, C.B.; Yang, J.C. The effect of deforestation on the regional temperature in northeastern China. Theo. Appl. Climatol. 2015, 120, 761–771. [Google Scholar] [CrossRef]
- Shrestha, U.B.; Gautam, S.; Bawa, K.S. Widespread climate change in the himalayas and associated changes in local ecosystems. PLoS ONE 2012, 7, e36741. [Google Scholar] [CrossRef] [PubMed] [Green Version]
- Piao, S.L.; Mohammat, A.; Fang, J.Y.; Cai, Q.; Feng, J.M. Ndvi-based increase in growth of temperate grasslands and its responses to climate changes in China. Glob. Environ. Change 2006, 16, 340–348. [Google Scholar] [CrossRef]
- Luedeling, E.; Zhang, M.H.; McGranahan, G.; Leslie, C. Validation of winter chill models using historic records of walnut phenology. Agric. For. Meteorol. 2009, 149, 1854–1864. [Google Scholar] [CrossRef]
- Richardson, E.A.; Seeley, S.D.; Walker, D.R. A model for estimating the completion of rest for ‘redhaven’ and ‘elberta’ peach trees. HortScience 1974, 9, 331–332. [Google Scholar]
- Yu, H.Y.; Luedeling, E.; Xu, J.C. Winter and spring warming result in delayed spring phenology on the tibetan plateau. Proc. Natl. Acad. Sci. USA 2010, 107, 22151. [Google Scholar] [CrossRef] [Green Version]
- Soudani, K.; Hmimina, G.; Delpierre, N.; Pontailler, J.Y.; Aubinet, M.; Bonal, D.; Caquet, B.; de Grandcourt, A.; Burban, B.; Flechard, C.; et al. Ground-based network of ndvi measurements for tracking temporal dynamics of canopy structure and vegetation phenology in different biomes. Remote Sens. Environ. 2012, 123, 234–245. [Google Scholar] [CrossRef]
- Richardson, A.D.; Bailey, A.S.; Denny, E.G.; Martin, C.W.; O′Keefe, J. Phenology of a northern hardwood forest canopy. Glob. Chang. Biol. 2006, 12, 1174–1188. [Google Scholar] [CrossRef] [Green Version]
- Zhou, Y.Z.; Jia, G.S. Precipitation as a control of vegetation phenology for temperate steppes in China. Atmos. Ocean. Sci. Lett. 2016, 9, 162–168. [Google Scholar] [CrossRef]
- Keeling, C.D.; Chin, J.F.S.; Whorf, T.P. Increased activity of northern vegetation inferred from atmospheric co2 measurements. Nature 1996, 382, 146. [Google Scholar] [CrossRef]
- Randerson, J.T.; Field, C.B.; Fung, I.Y.; Tans, P.P. Increases in early season ecosystem uptake explain recent changes in the seasonal cycle of atmospheric co2 at high northern latitudes. Geophys. Res. Lett. 1999, 26, 2765–2768. [Google Scholar] [CrossRef] [Green Version]
- Piao, S.L.; Friedlingstein, P.; Ciais, P.; Viovy, N.; Demarty, J. Growing season extension and its impact on terrestrial carbon cycle in the northern hemisphere over the past 2 decades. Glob. Biogeochem. Cycles 2007, 21, GB3018. [Google Scholar] [CrossRef]
- Nemani, R.; White, M.; Thornton, P.; Nishida, K.; Reddy, S.; Jenkins, J.; Running, S. Recent trends in hydrologic balance have enhanced the terrestrial carbon sink in the United States. Geophys. Res. Lett. 2002, 29, 106-1–106-4. [Google Scholar] [CrossRef] [Green Version]
Figure 1.
Flowchart of study.
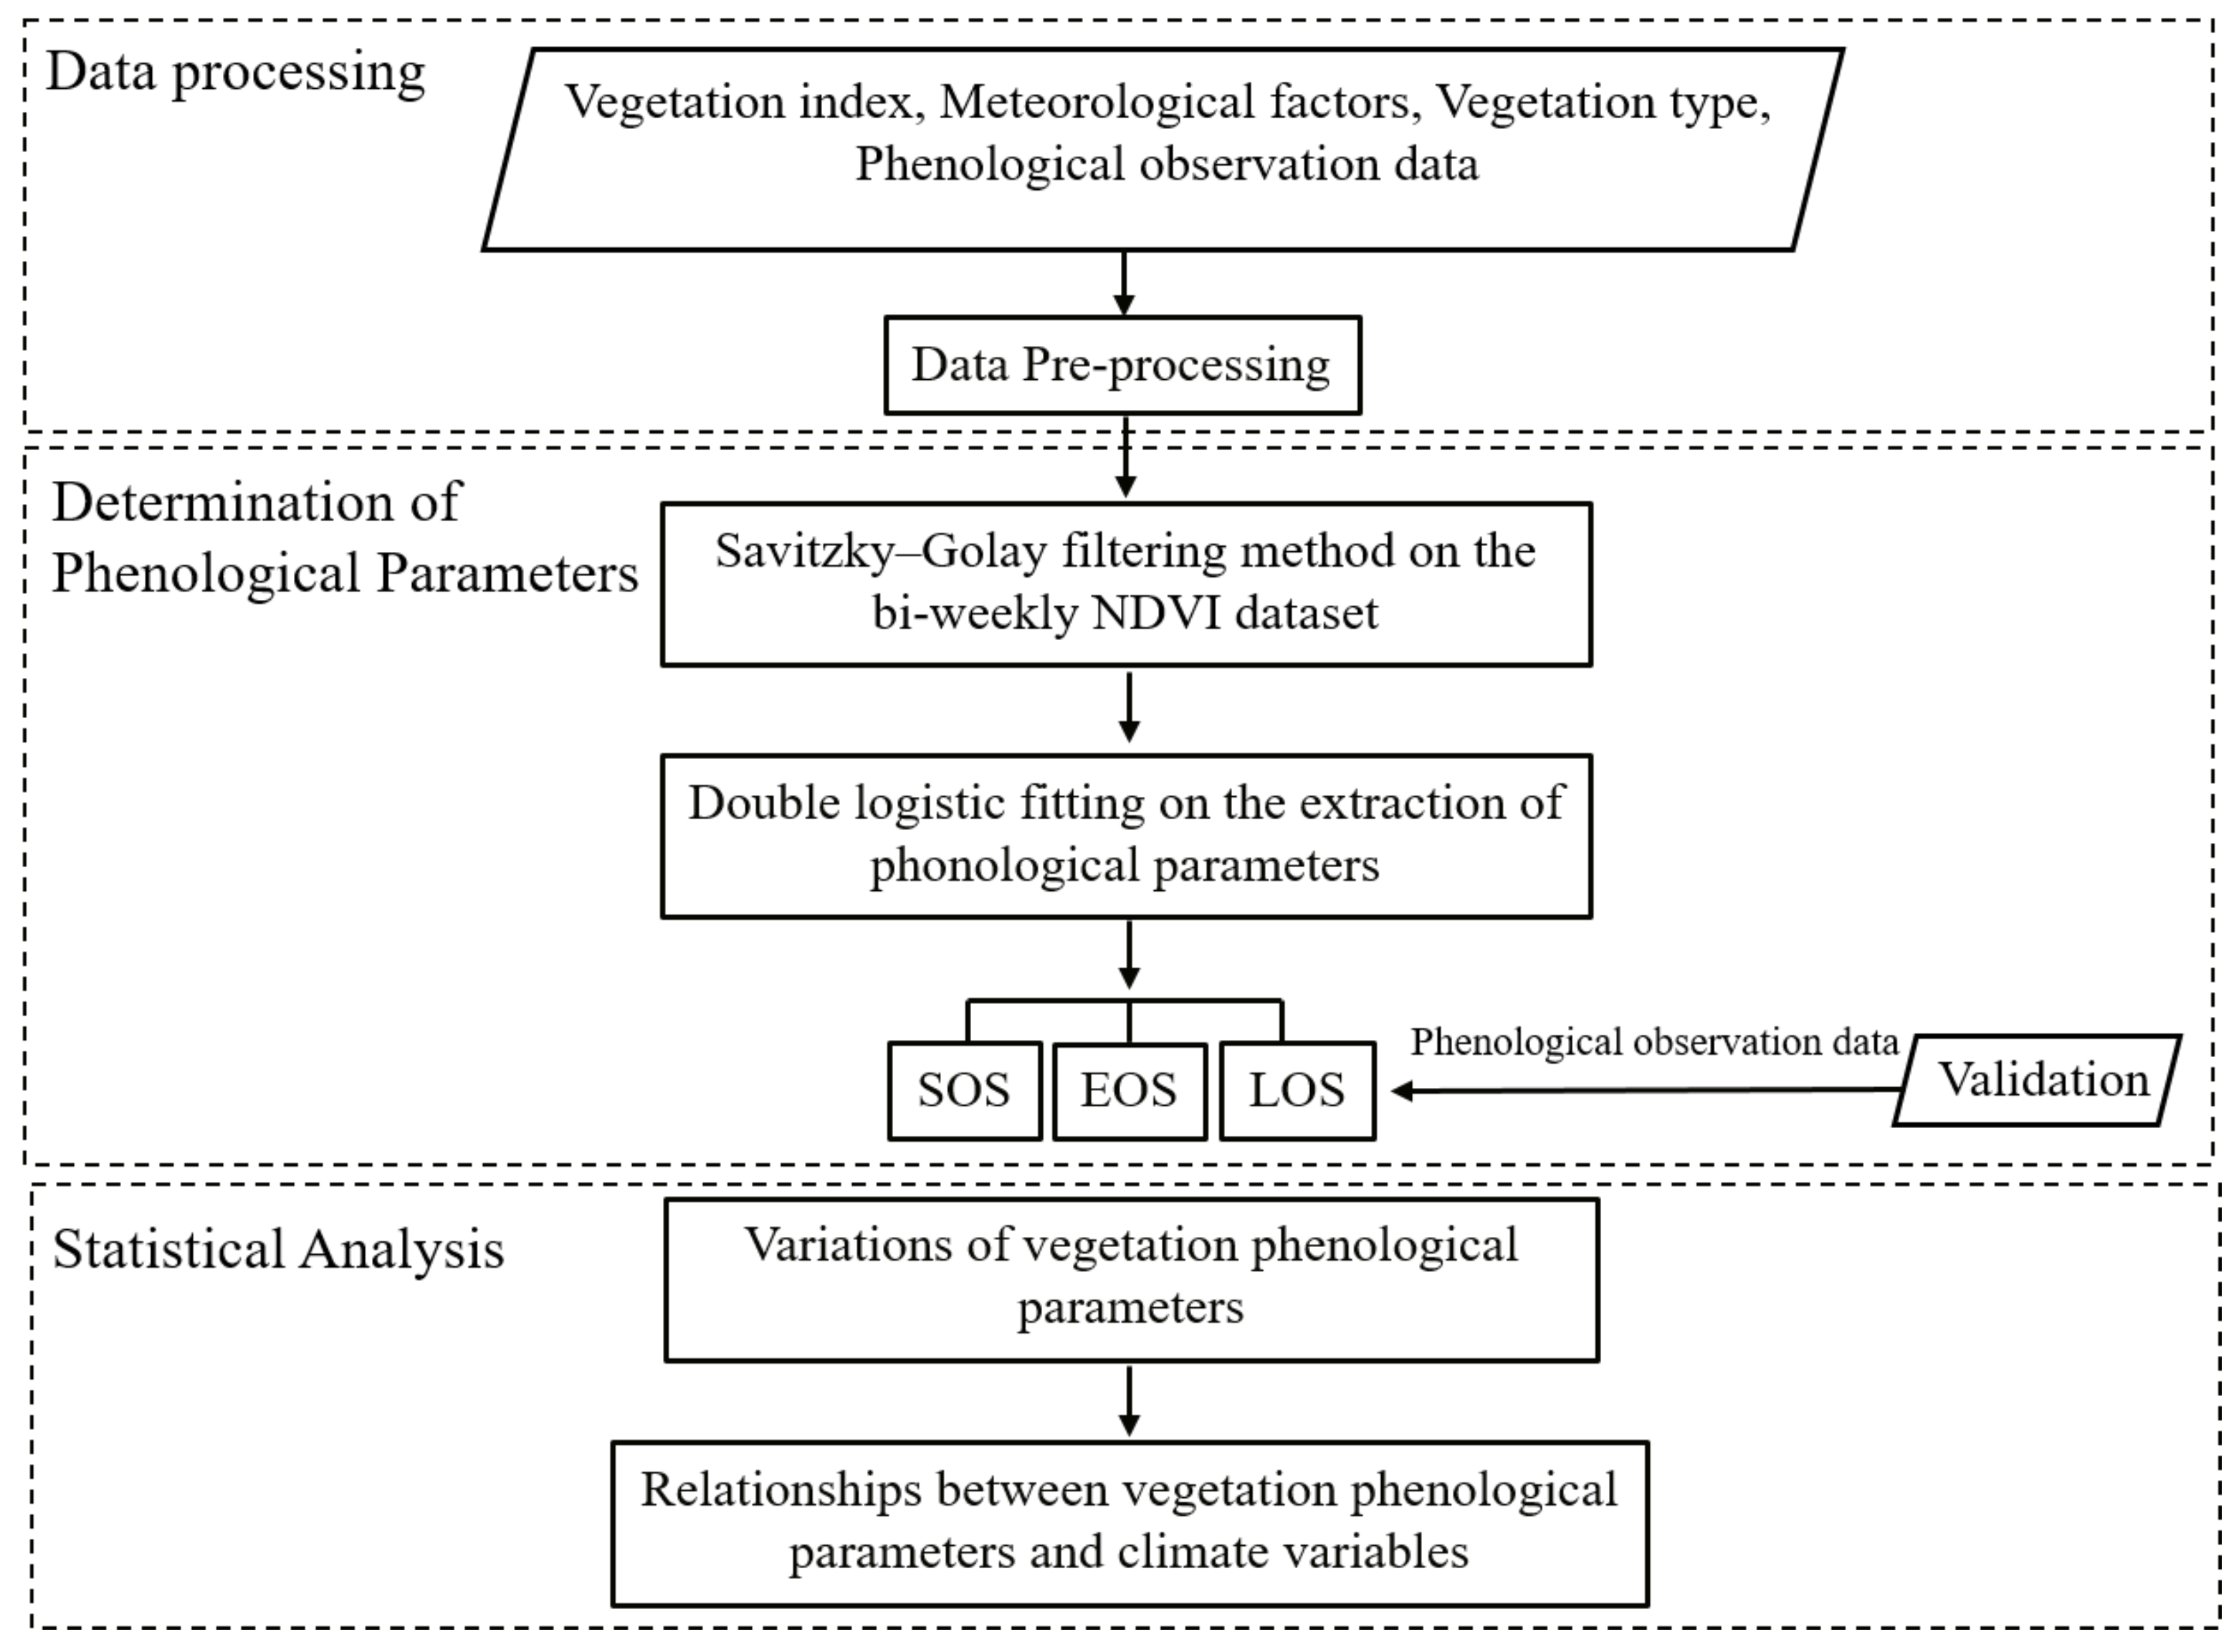
Figure 2.
Vegetation types in northeast China and locations of the eight phenological observation sites.
Figure 2.
Vegetation types in northeast China and locations of the eight phenological observation sites.

Figure 3.
Spatial distribution pattern for (a) average SOS, (b) average EOS, and (c) average LOS of northeast China during 1982–2014.
Figure 3.
Spatial distribution pattern for (a) average SOS, (b) average EOS, and (c) average LOS of northeast China during 1982–2014.
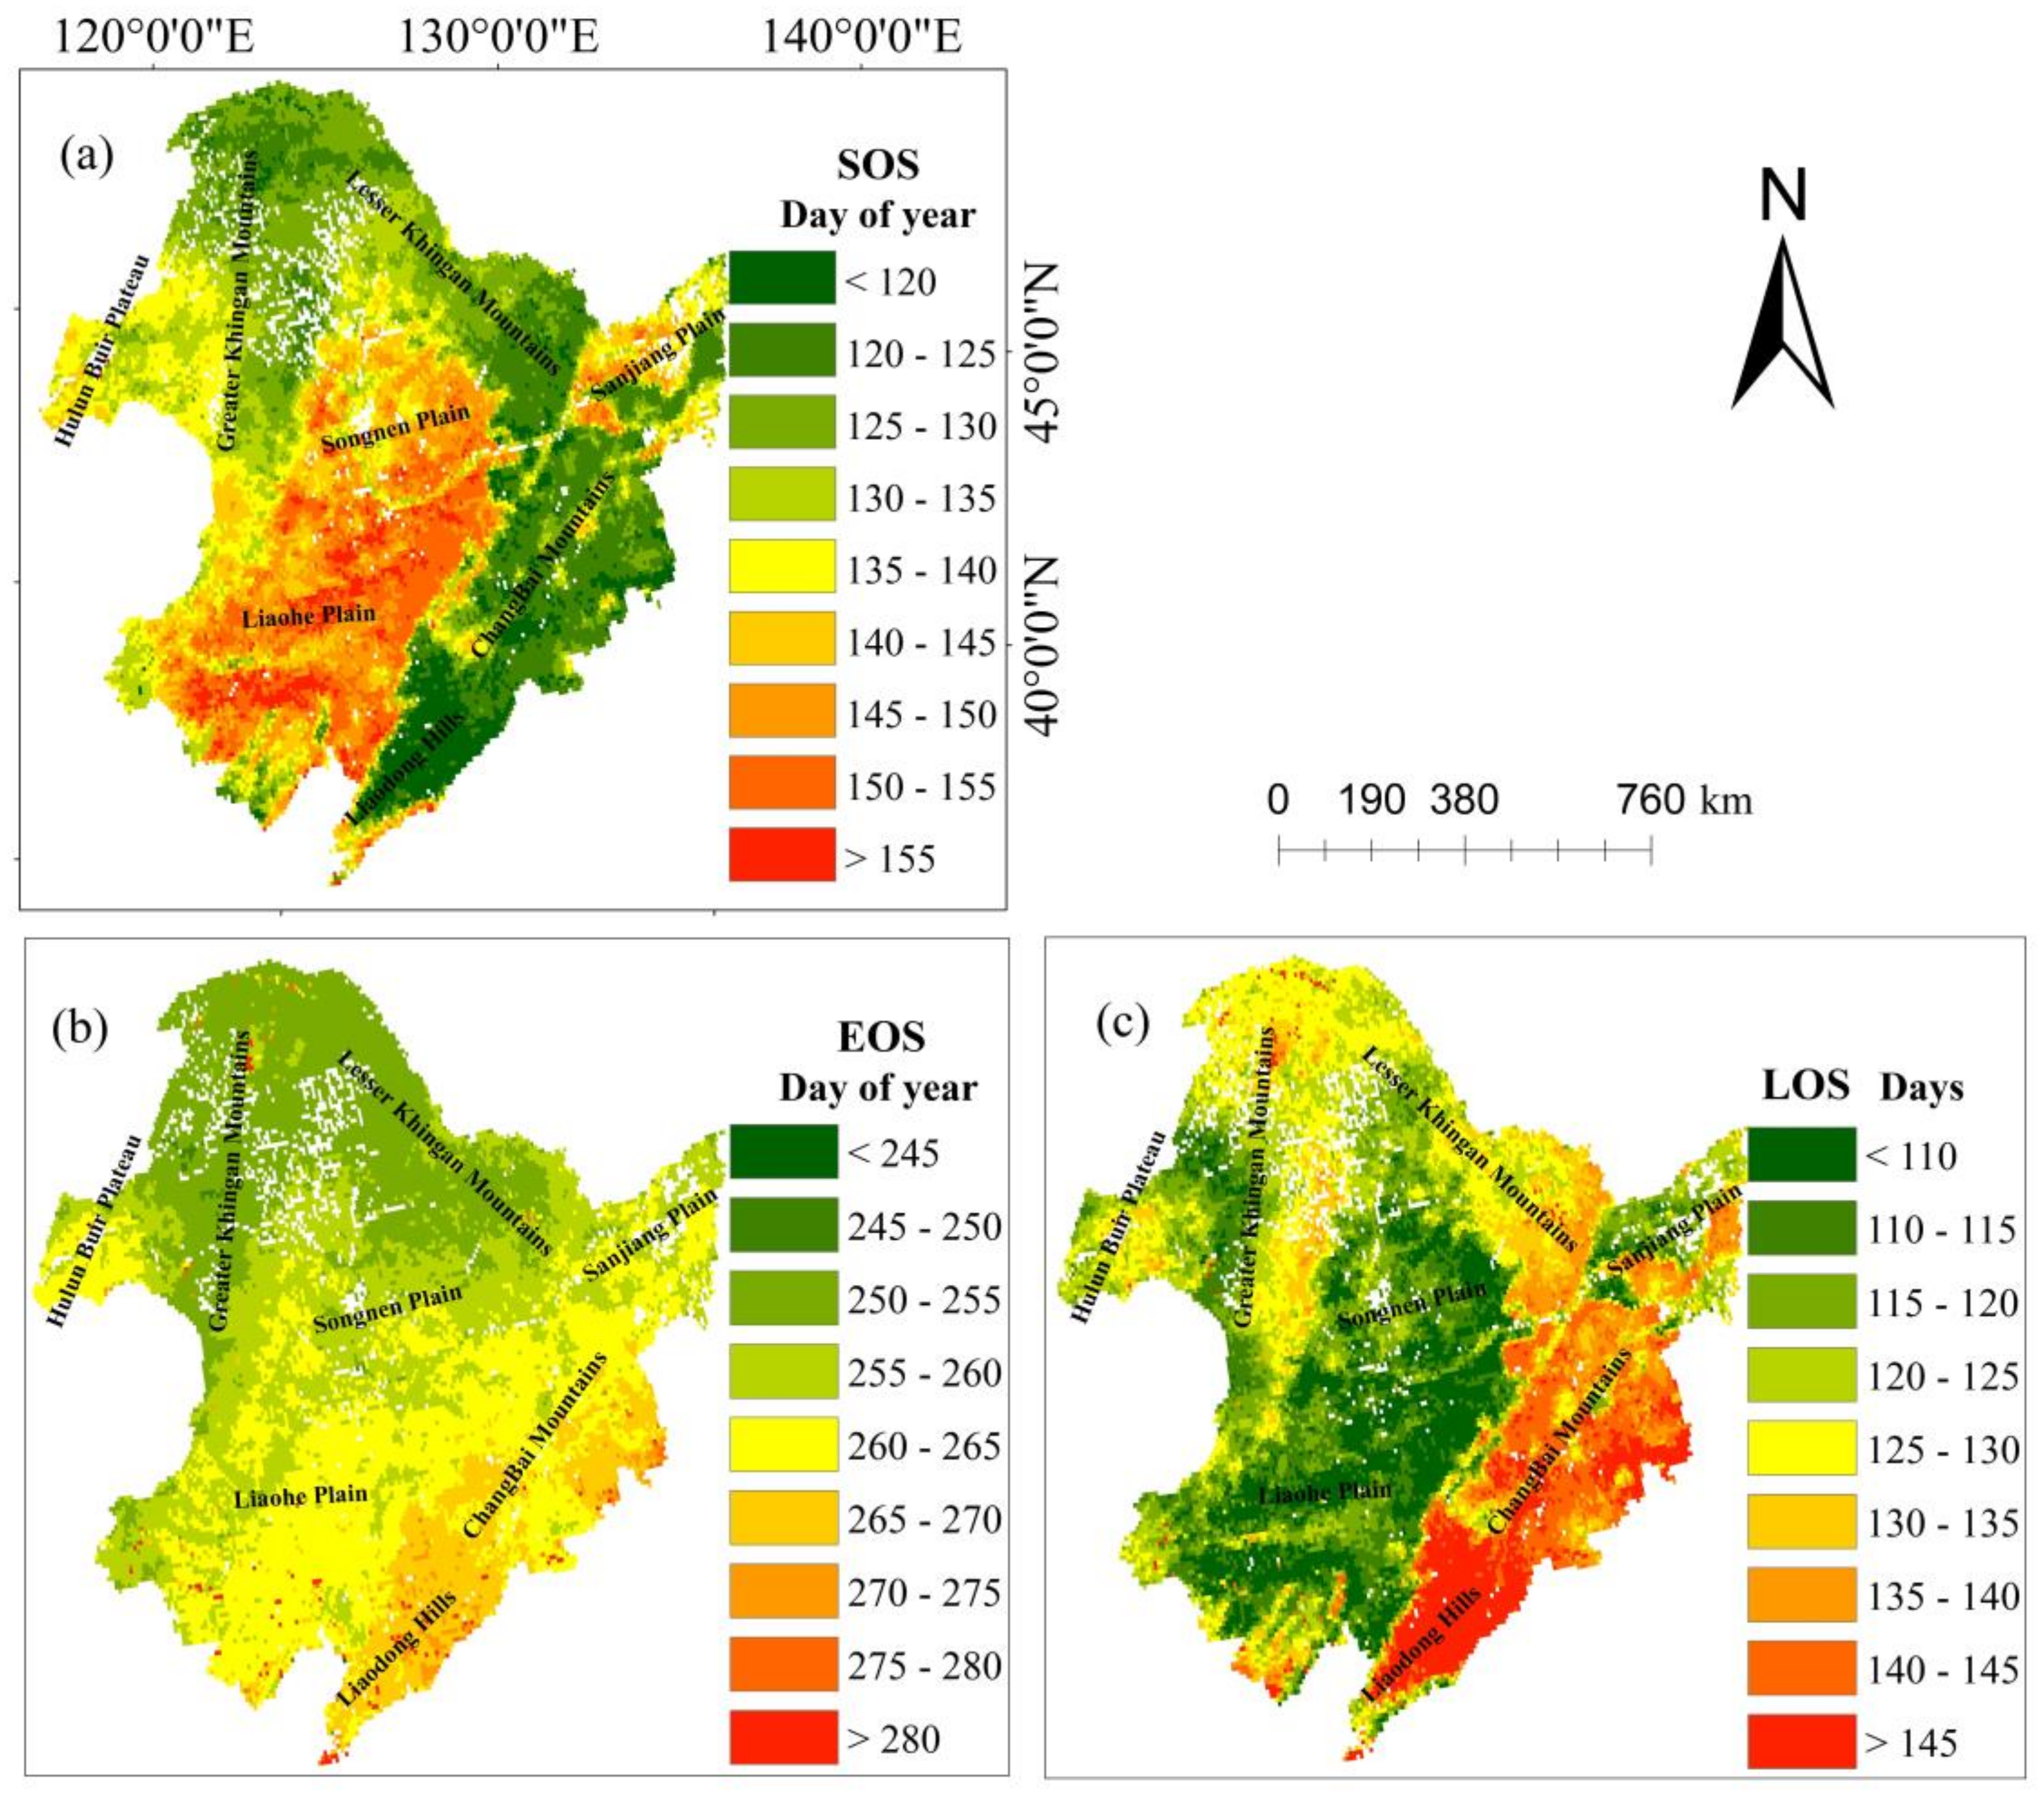
Figure 4.
Interannual variations in (a) SOS, (b) EOS, and (c) LOS in northeast China during 1982–2014.
Figure 4.
Interannual variations in (a) SOS, (b) EOS, and (c) LOS in northeast China during 1982–2014.
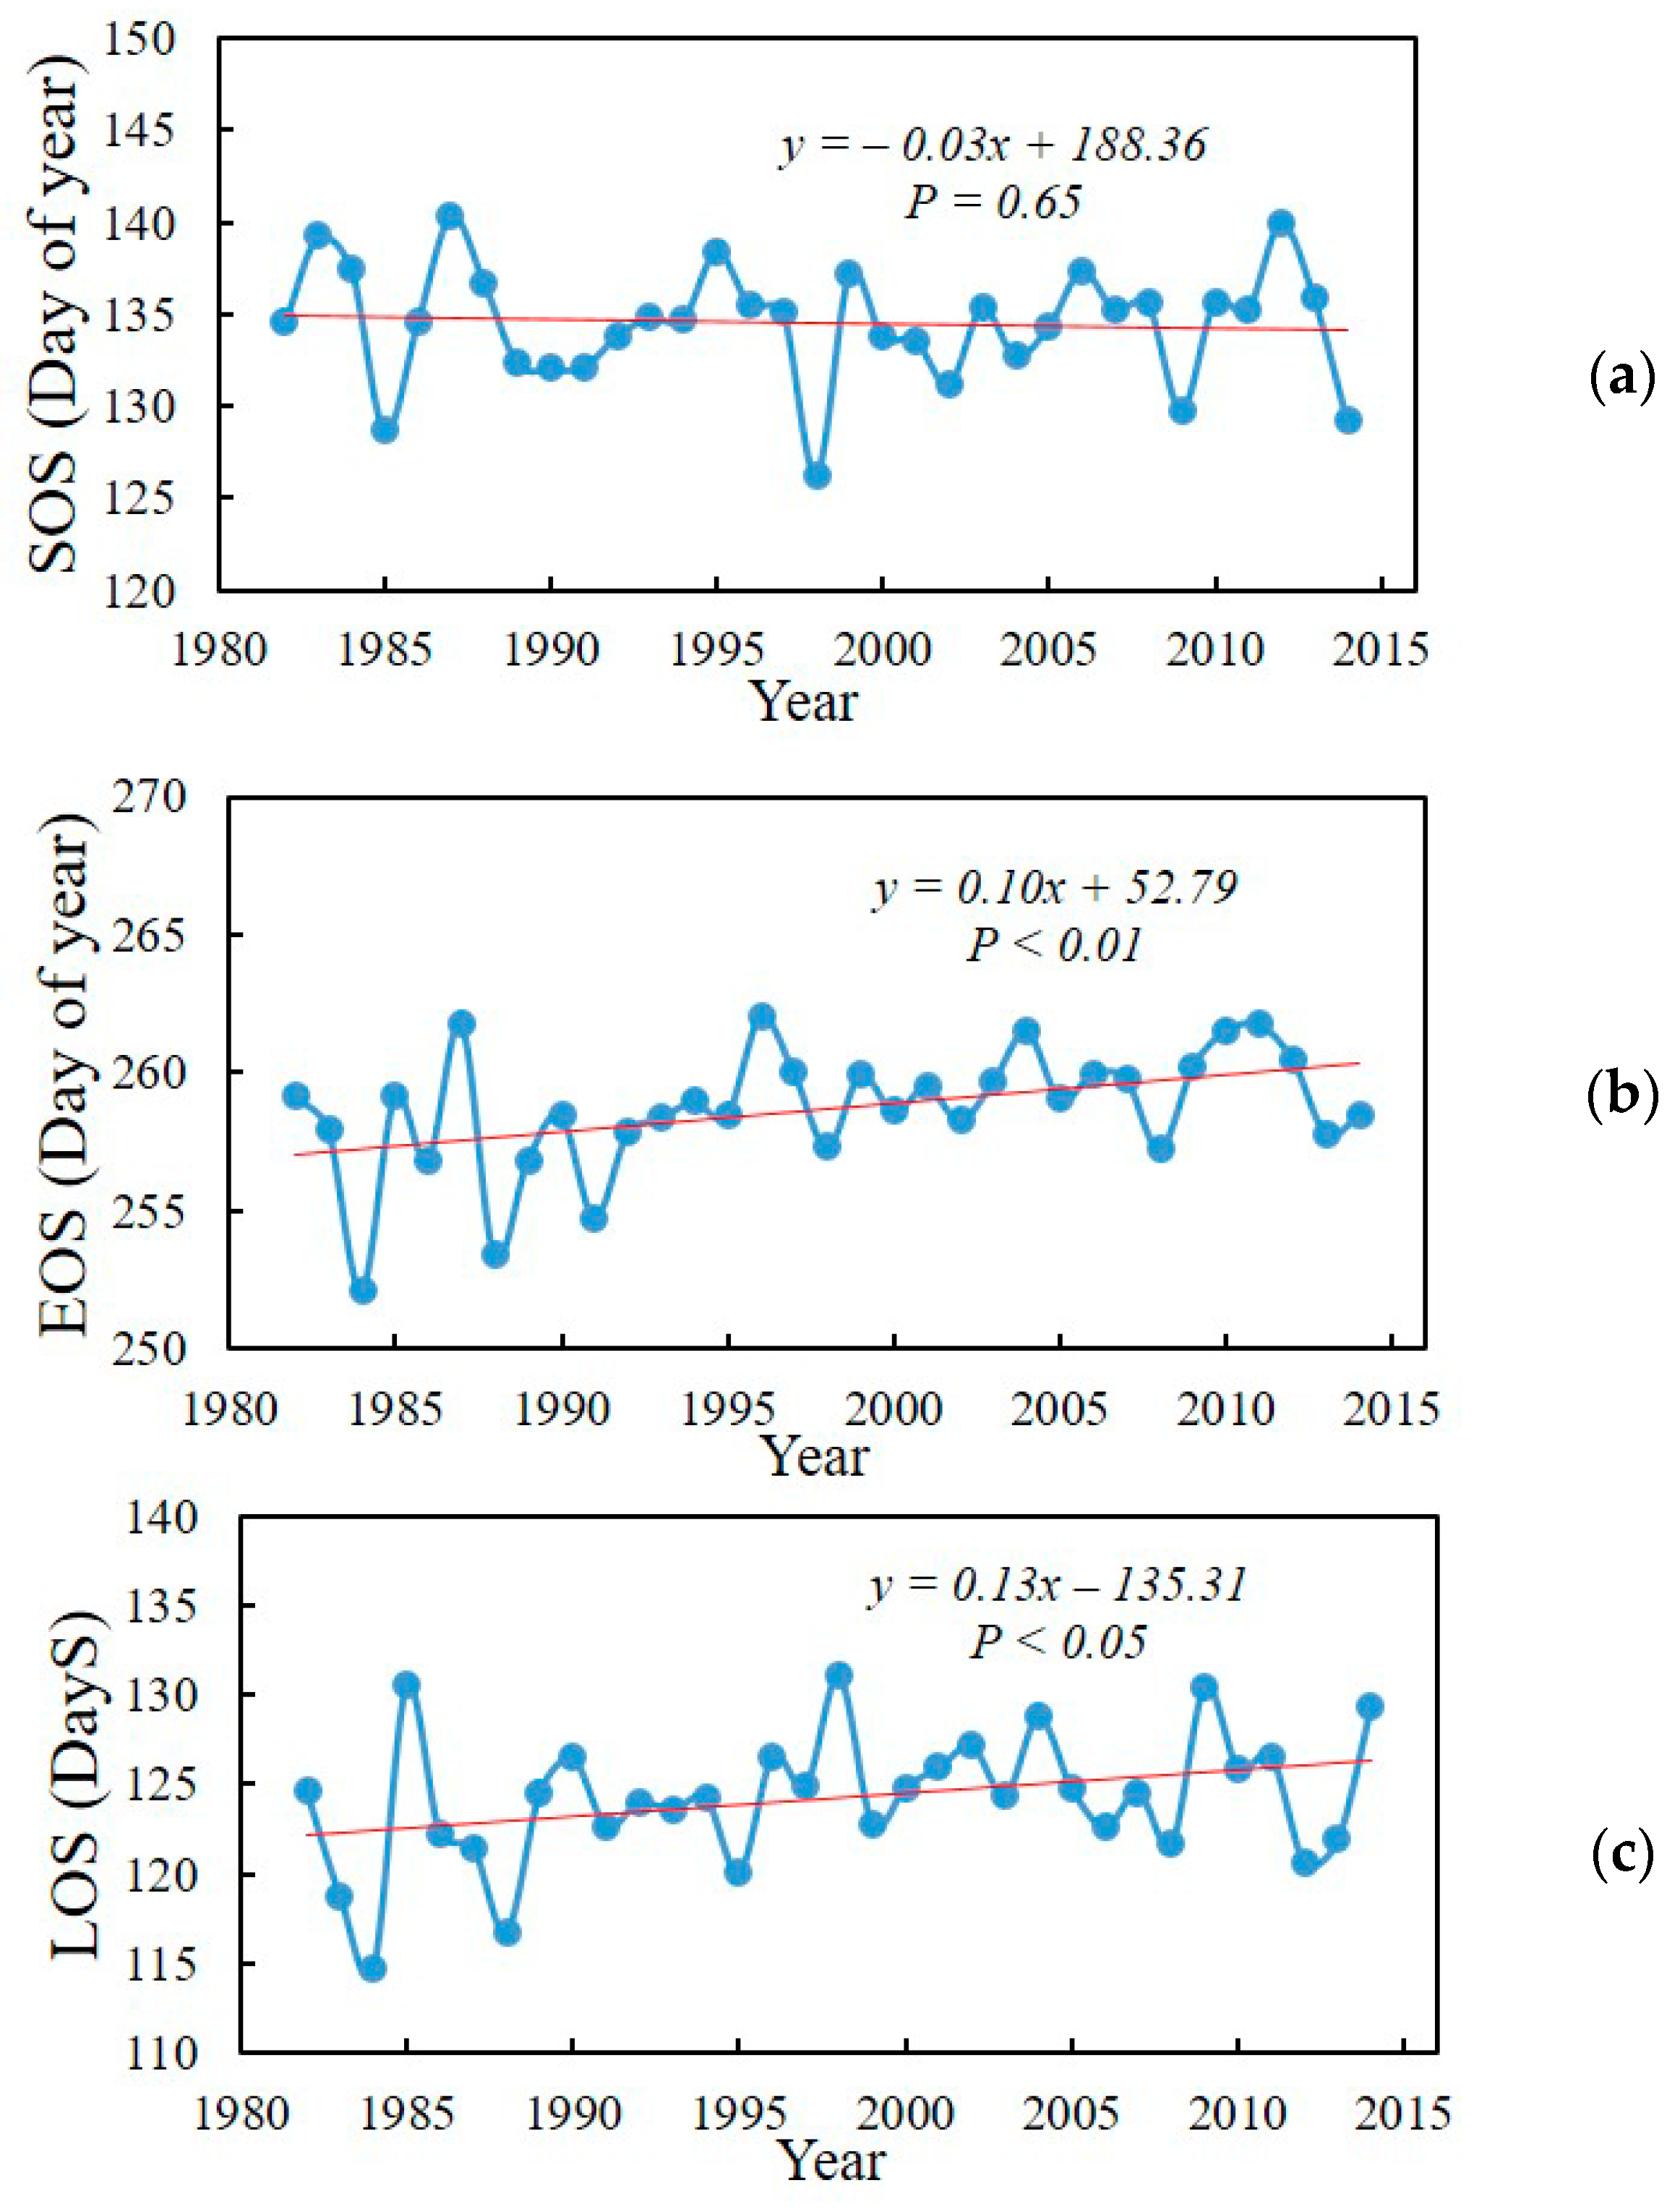
Figure 5.
Spatial distribution of the variations in the vegetation phenological parameters of northeast China during 1982–2014 and statistical test results at 5% significance level. (a,c,e) present changes in SOS, EOS, and LOS, respectively (days year−1). (b,d,f) present significant changes (5% significance level) in the start of the growing season (SOS), the end of the growing season (EOS), as well as the length of the growing season (LOS), separately.

Figure 6.
Correlation of SOS with climate variables of northeast China during 1982–2014. (a,b,c) present correlations of SOS with previous autumn mean temperature, previous winter mean temperature, and spring mean temperature, respectively. (d,e,f) present correlations of SOS with previous autumn total precipitation, previous winter total precipitation, and spring total precipitation, respectively. (g,h,i) present correlations of SOS with previous autumn mean insolation, previous winter mean insolation, and spring mean insolation, respectively.

Figure 7.
Correlation of EOS and climate variables of northeast China in 1982–2014. (a,b,c) present correlations between EOS and spring mean temperature, summer mean temperature, and autumn mean temperature, respectively. (d,e,f) present correlations between EOS and spring total precipitation, summer total precipitation, and autumn total precipitation, separately. (g,h,i) present correlations between EOS and spring mean insolation, summer mean insolation, and autumn mean insolation, respectively.

Table 1.
Determination of Phenological Parameters.
| Type | Variables | Dataset | Spatial Resolution | Source |
|---|---|---|---|---|
| Vegetation index (input data) | NDVI | GIMMS NDVI3g | 8 km | NASA |
| Meteorological factors (input data) | Temperature, precipitation, insolation | - | daily | China Meteorological Data Service |
| Vegetation type (input data) | Forest, grassland, cultivated land, other | 1:1,000,000 vegetation map of China | 1:1,000,000 | Institute of Geography at the Chinese Academy of Sciences |
| Phenological observation data (validation data) | Jiamusi, Mudanjiang, Nenjiang, Dedu, Haerbin, Changchun, Shenyang, and Gaizhou | - | - | Chinese Phenological Observation Network |
Table 2.
Correlation coefficients between vegetation phenological parameters and climate variables in the entire study area during 1982–2014.
Table 2.
Correlation coefficients between vegetation phenological parameters and climate variables in the entire study area during 1982–2014.
| Different Climate Factors | SOS | EOS |
|---|---|---|
| Previous autumn mean temperature | −0.09 | - |
| Previous winter mean temperature | −0.18 | - |
| Spring mean temperature | −0.59 ** | −0.03 |
| Summer mean temperature | - | 0.13 |
| Autumn mean temperature | - | 0.04 |
| Previous autumn total precipitation | 0.23 | - |
| Previous winter total precipitation | −0.20 | - |
| Spring total precipitation | 0.05 | 0.02 |
| Summer total precipitation | - | −0.34 * |
| Autumn total precipitation | - | −0.06 |
| Previous autumn mean insolation | 0.01 | - |
| Previous winter mean insolation | 0.16 | - |
| Spring mean insolation | −0.24 | −0.10 |
| Summer mean insolation | - | 0.23 |
| Autumn mean insolation | - | 0.01 |
* Correlation was significant at the 5% significance level (2-tailed). ** Correlation was significant at the 1% significance level (2-tailed).
Table 3.
Percentage of total study area under different types of correlation between vegetation phenological parameters and climate variables during 1982–2014 (5% significance level).
Table 3.
Percentage of total study area under different types of correlation between vegetation phenological parameters and climate variables during 1982–2014 (5% significance level).
| Correlation | SOS (%) | EOS (%) | |||||
|---|---|---|---|---|---|---|---|
| Previous Autumn | Previous Winter | Spring | Spring | Summer | Autumn | ||
| Temperature | Significant Negative Correlation | 2.51 | 6.10 | 47.42 | 4.18 | 4.18 | 3.88 |
| No Significant Negative Correlation | 55.53 | 57.20 | 33.54 | 50.63 | 40.22 | 51.27 | |
| No Significant Positive Correlation | 41.06 | 32.60 | 17.94 | 43.52 | 50.84 | 40.80 | |
| Significant Positive Correlation | 0.90 | 4.10 | 1.10 | 1.67 | 4.76 | 4.05 | |
| Precipitation | Significant Negative Correlation | 0.82 | 11.94 | 6.88 | 10.18 | 12.17 | 2.43 |
| No Significant Negative Correlation | 32.26 | 62.20 | 35.62 | 57.68 | 37.31 | 50.56 | |
| No Significant Positive Correlation | 62.53 | 25.00 | 54.10 | 30.66 | 46.44 | 45.31 | |
| Significant Positive Correlation | 4.39 | 0.86 | 3.40 | 1.48 | 4.08 | 1.70 | |
| Insolation | Significant Negative Correlation | 1.14 | 0.44 | 10.54 | 2.53 | 5.98 | 2.00 |
| No Significant Negative Correlation | 56.35 | 37.70 | 70.70 | 52.66 | 48.46 | 46.79 | |
| No Significant Positive Correlation | 40.73 | 55.48 | 18.56 | 42.39 | 34.18 | 46.96 | |
| Significant Positive Correlation | 1.78 | 6.37 | 0.20 | 2.42 | 11.38 | 4.25 | |
Table 4.
Trends of change in vegetation phenological parameters in three vegetation types of northeast China for 1982–2014.
Table 4.
Trends of change in vegetation phenological parameters in three vegetation types of northeast China for 1982–2014.
| Different Vegetation Types | SOS | EOS | LOS |
|---|---|---|---|
| Forest | –0.06 | 0.16 ** | 0.22 * |
| Cultivated land | 0.06 | 0.08 * | 0.02 |
| Grassland | –0.07 | 0.02 | 0.09 |
* Correlation was significant at the 5% significance level (2-tailed). ** Correlation was significant at the 1% significance level (2-tailed).
Table 5.
Pixel numbers containing different trends in SOS of three vegetation types in northeast China for 1982–2014 (5% significance level).
Table 5.
Pixel numbers containing different trends in SOS of three vegetation types in northeast China for 1982–2014 (5% significance level).
| Vegetation Types | Significant Decrease | No Significant Decrease | No Significant Increase | Significant Increase |
|---|---|---|---|---|
| Forest | 1804 | 4142 | 2411 | 514 |
| Cultivated land | 665 | 1731 | 2101 | 1395 |
| Grassland | 1322 | 1938 | 999 | 661 |
Table 6.
Pixel numbers containing different trends in EOS of three vegetation types of northeast China for 1982–2014 (5% significance level).
Table 6.
Pixel numbers containing different trends in EOS of three vegetation types of northeast China for 1982–2014 (5% significance level).
| Vegetation Types | Significant Decrease | No Significant Decrease | No Significant Increase | Significant Increase |
|---|---|---|---|---|
| Forest | 137 | 953 | 4572 | 3198 |
| Cultivated land | 498 | 1442 | 2450 | 1497 |
| Grassland | 526 | 1924 | 1655 | 799 |
Table 7.
Pixel numbers containing different trends in LOS of three vegetation types of northeast China for 1982–2014 (5% significance level).
Table 7.
Pixel numbers containing different trends in LOS of three vegetation types of northeast China for 1982–2014 (5% significance level).
| Vegetation Types | Significant Decrease | No Significant Decrease | No Significant Increase | Significant Increase |
|---|---|---|---|---|
| Forest | 371 | 1318 | 3690 | 3481 |
| Cultivated land | 963 | 1870 | 1994 | 1059 |
| Grassland | 544 | 1206 | 1864 | 1290 |
Table 8.
Correlation coefficients between SOS and climate factors in different vegetation types of northeast China in 1982–2014.
Table 8.
Correlation coefficients between SOS and climate factors in different vegetation types of northeast China in 1982–2014.
| Climate Factors | Vegetation Types | ||
|---|---|---|---|
| Forest | Cultivated Land | Grassland | |
| Previous autumn mean temperature | −0.02 | −0.04 | −0.23 |
| Previous winter mean temperature | -0.28 | −0.05 | 0.03 |
| Spring mean temperature | −0.70 ** | −0.36 * | −0.24 |
| Previous autumn total precipitation | 0.28 | 0.09 | 0.12 |
| Previous winter total precipitation | −0.18 | −0.11 | −0.30 |
| Spring total precipitation | 0.12 | 0.11 | −0.16 |
| Previous autumn mean insolation | −0.04 | −0.01 | 0.13 |
| Previous winter mean insolation | 0.04 | 0.25 | 0.23 |
| Spring mean insolation | −0.12 | −0.36 * | −0.36 * |
* Correlation was significant at the 5% significance level (2-tailed). ** Correlation was significant at the 1% significance level (2-tailed).
Table 9.
Correlation coefficients between the EOS and climate factors in different vegetation types of northeast China in 1982–2014.
Table 9.
Correlation coefficients between the EOS and climate factors in different vegetation types of northeast China in 1982–2014.
| Climate Factors | Vegetation Types | ||
|---|---|---|---|
| Forest | Cultivated Land | Grassland | |
| Spring mean temperature | −0.15 | 0.10 | 0.10 |
| Summer mean temperature | 0.21 | −0.15 | 0.15 |
| Autumn mean temperature | 0.16 | −0.05 | −0.17 |
| Spring total precipitation | 0.13 | −0.15 | −0.12 |
| Summer total precipitation | −0.35 * | −0.15 | −0.14 |
| Autumn total precipitation | 0.05 | −0.02 | −0.34 * |
| Spring mean insolation | −0.01 | −0.09 | −0.19 |
| Summer mean insolation | 0.32 | −0.05 | 0.18 |
| Autumn mean insolation | −0.01 | −0.23 | 0.16 |
* Correlation was significant at the 5% significance level (2-tailed).
Publisher’s Note: MDPI stays neutral with regard to jurisdictional claims in published maps and institutional affiliations. |
© 2022 by the authors. Licensee MDPI, Basel, Switzerland. This article is an open access article distributed under the terms and conditions of the Creative Commons Attribution (CC BY) license (https://creativecommons.org/licenses/by/4.0/).
Share and Cite
MDPI and ACS Style
Guo, J.; Hu, Y. Spatiotemporal Variations in Satellite-Derived Vegetation Phenological Parameters in Northeast China. Remote Sens. 2022, 14, 705. https://doi.org/10.3390/rs14030705
AMA Style
Guo J, Hu Y. Spatiotemporal Variations in Satellite-Derived Vegetation Phenological Parameters in Northeast China. Remote Sensing. 2022; 14(3):705. https://doi.org/10.3390/rs14030705
Chicago/Turabian StyleGuo, Jinting, and Yuanman Hu. 2022. "Spatiotemporal Variations in Satellite-Derived Vegetation Phenological Parameters in Northeast China" Remote Sensing 14, no. 3: 705. https://doi.org/10.3390/rs14030705
Note that from the first issue of 2016, this journal uses article numbers instead of page numbers. See further details here.