
UAV-Based Remote Sensing for Managing Alaskan Native Heritage Landscapes in the Yukon-Kuskokwim Delta

 , ,
, ,
Abstract
:1. Introduction
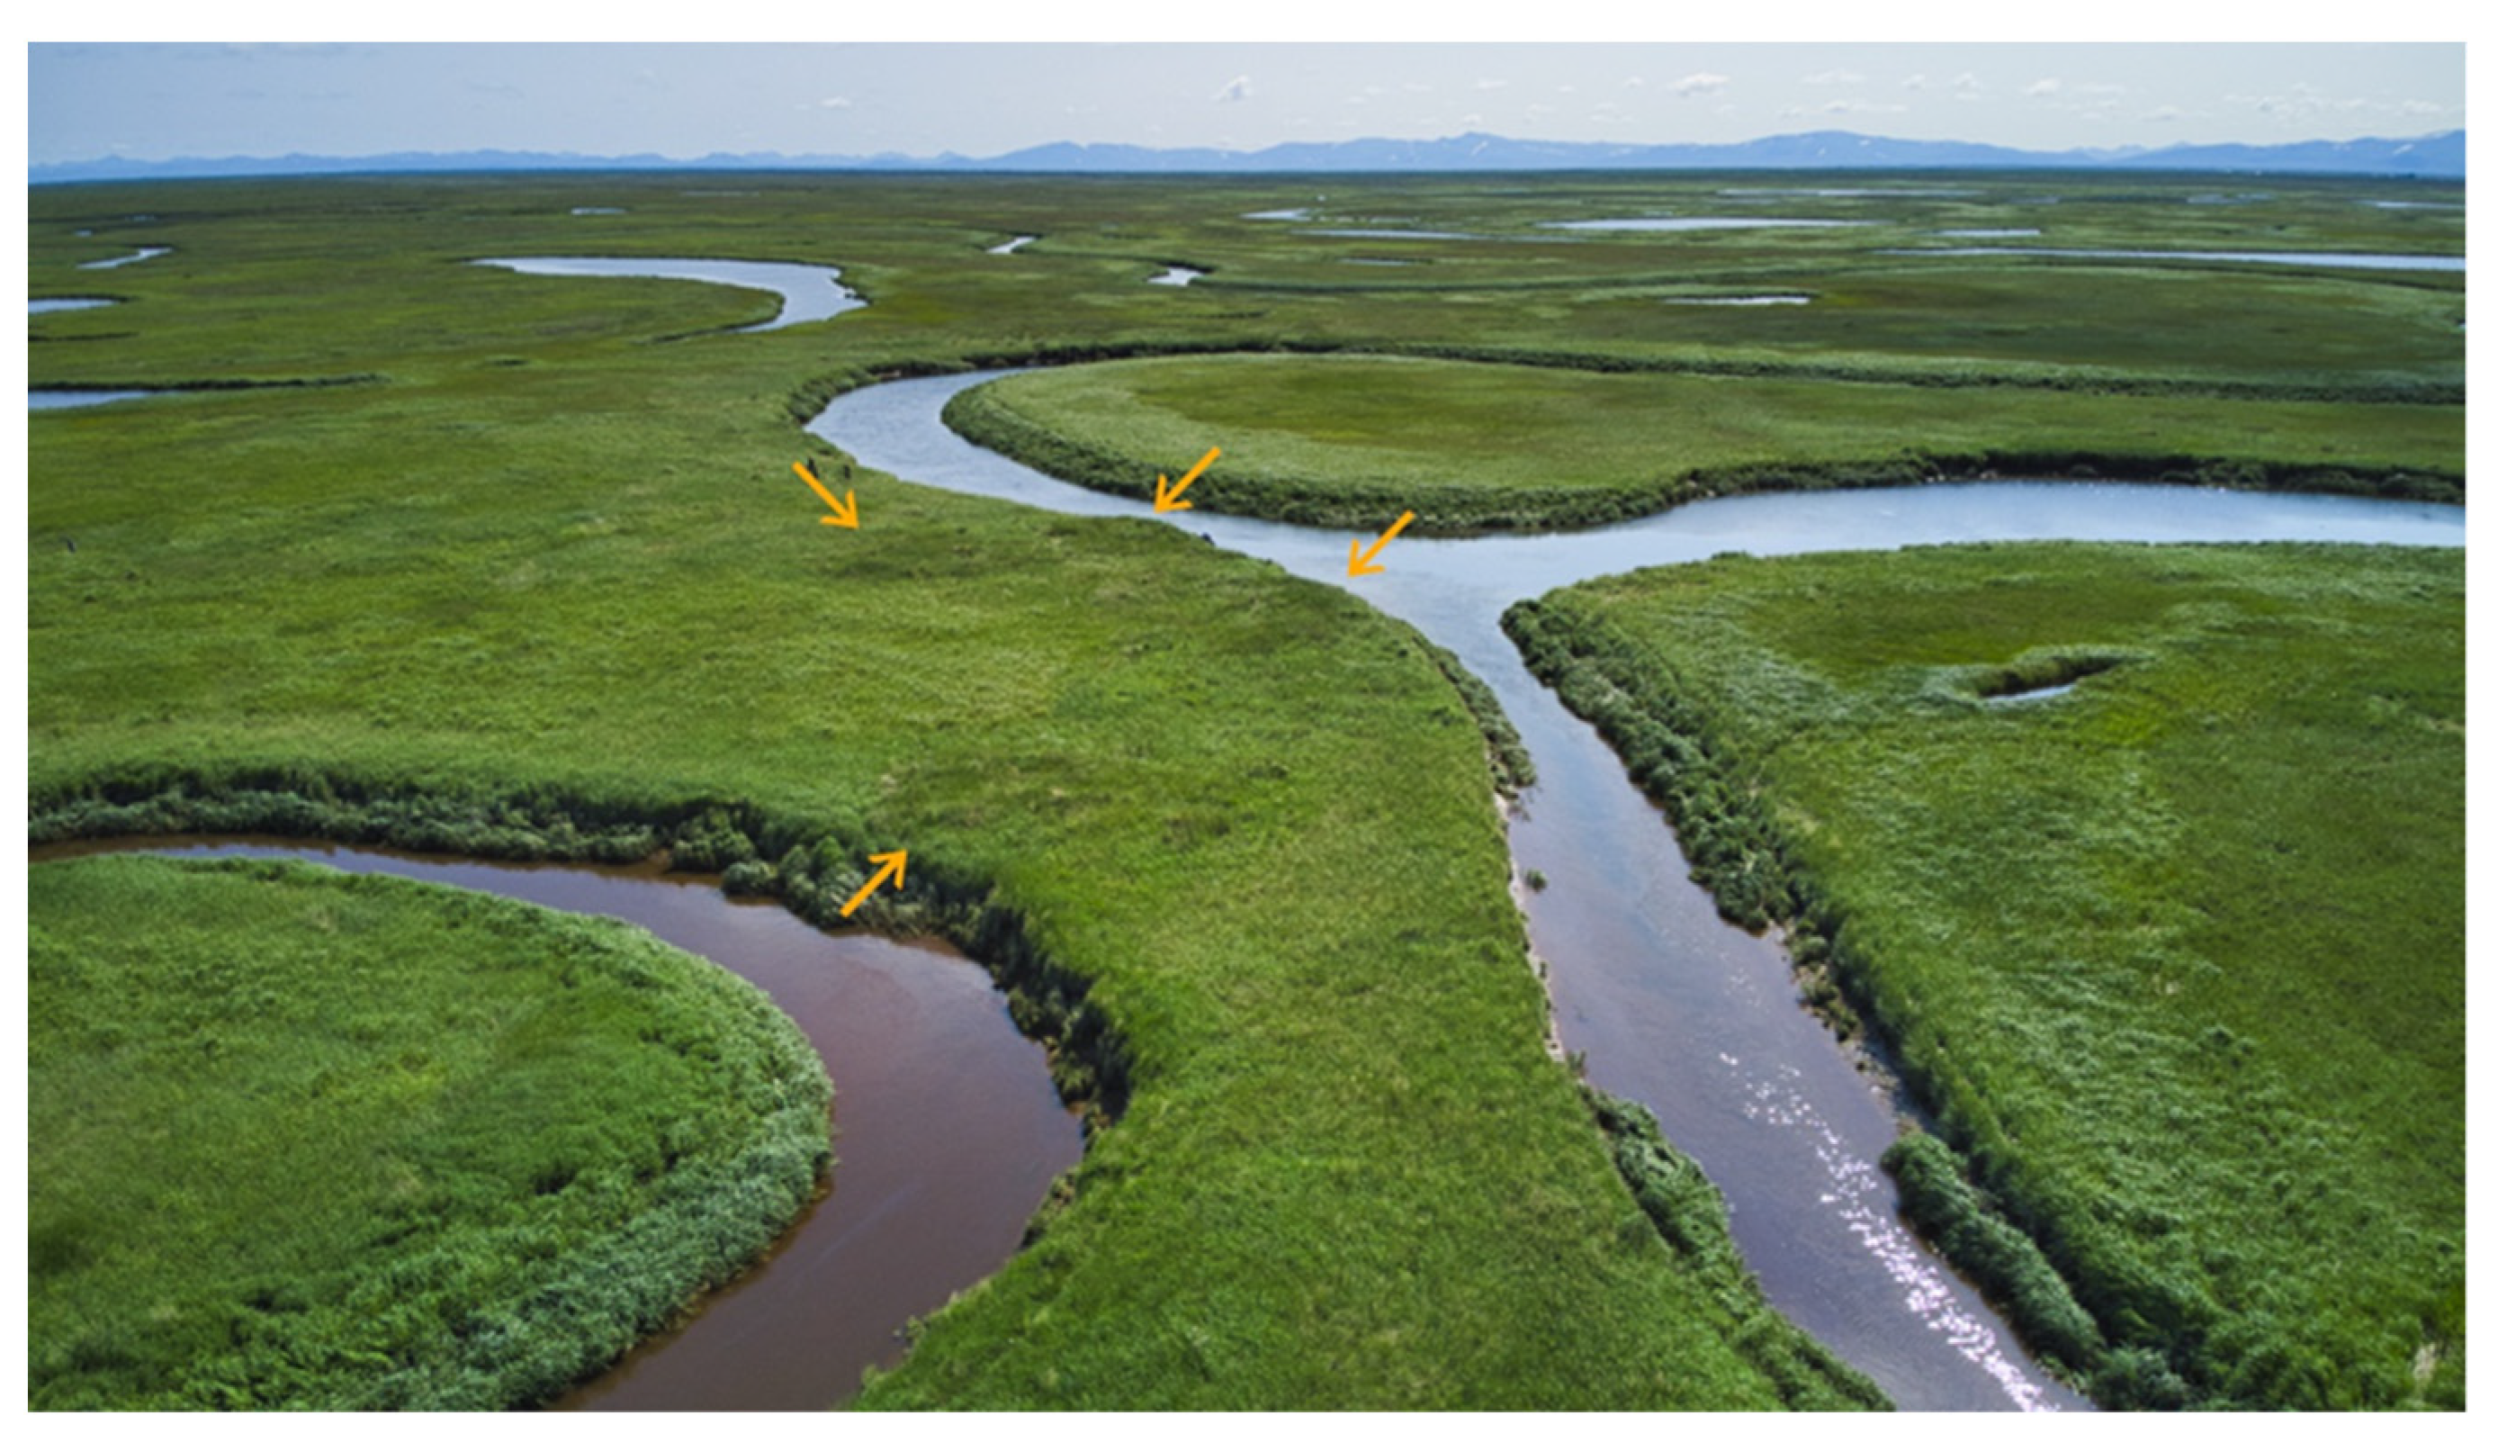
1.1. Landscapes in Flux and Heritage at Risk
1.2. Remote Sensing Strategies in the Y-K Delta: Satellites vs. Drones
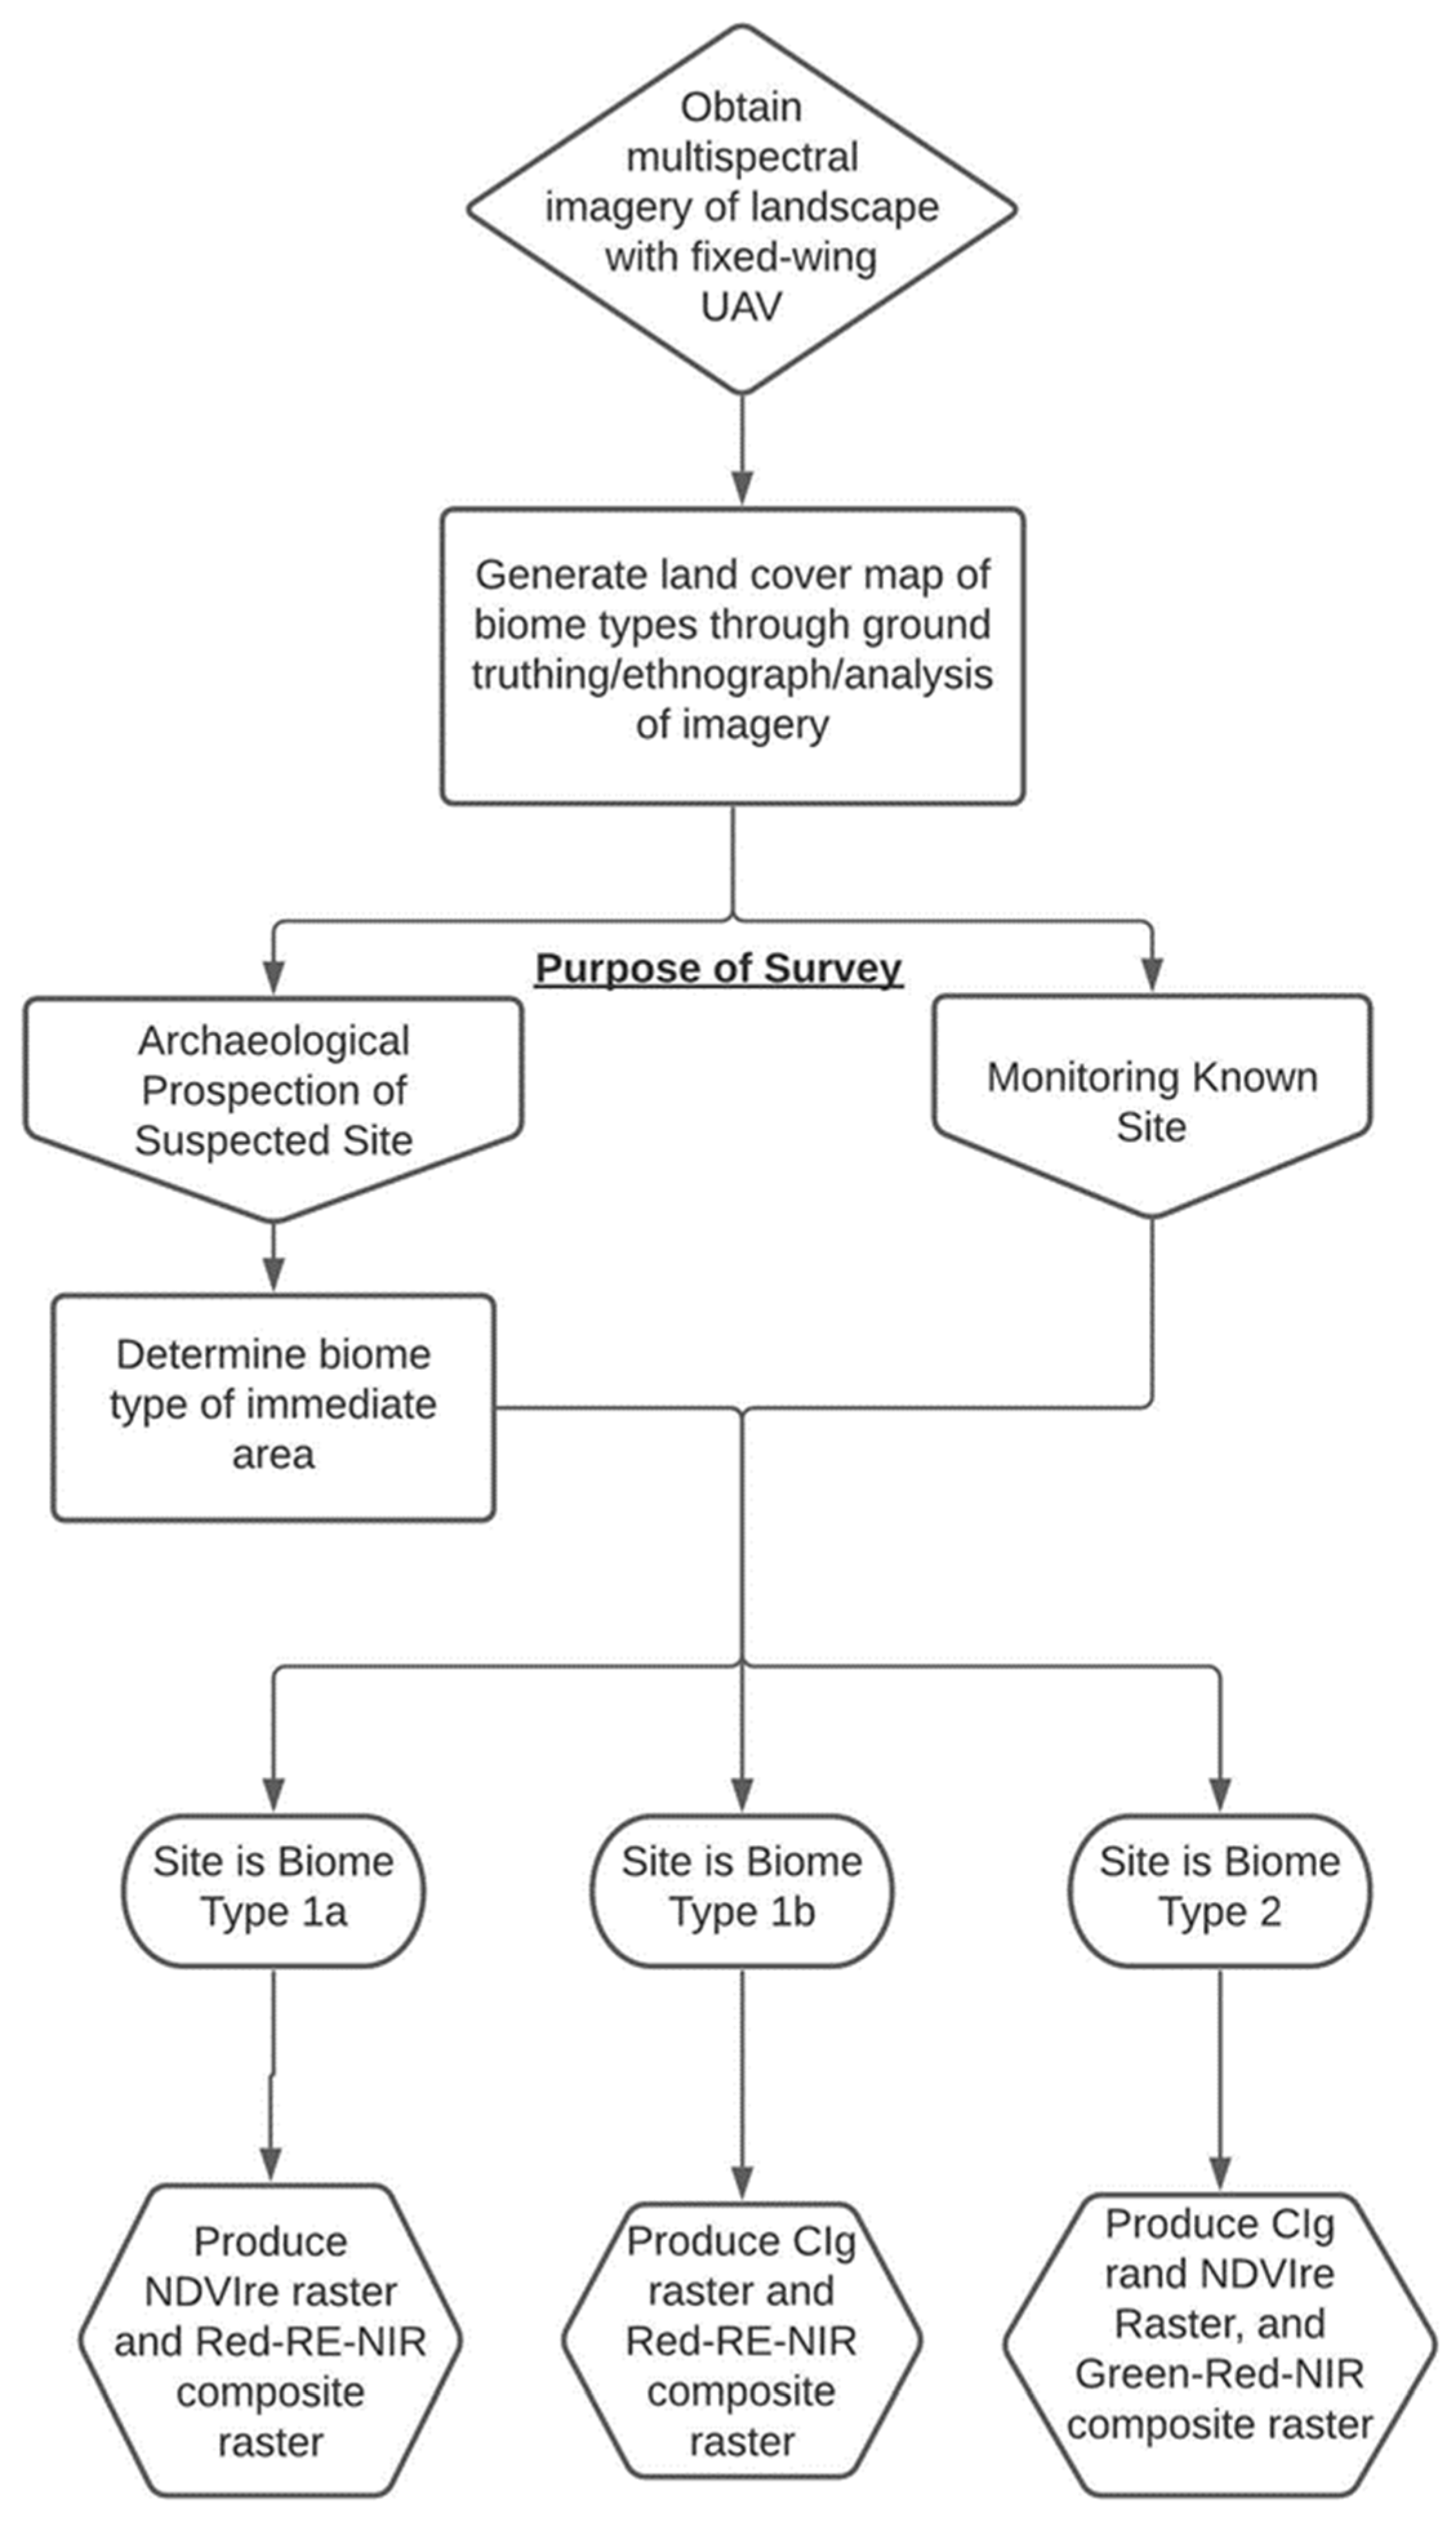
2. Materials and Methods
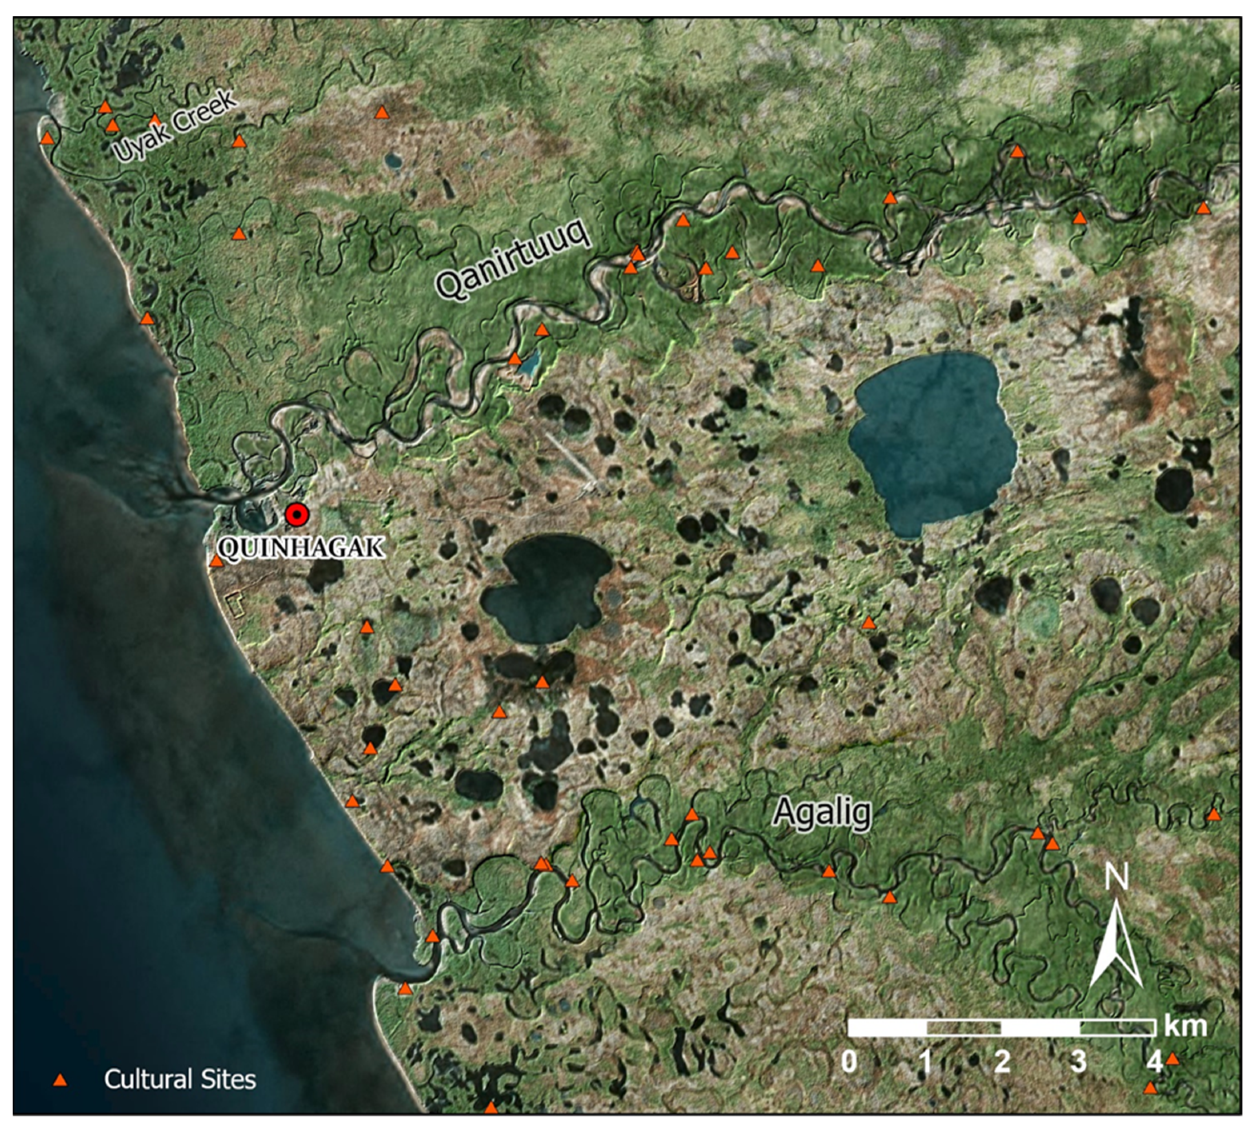
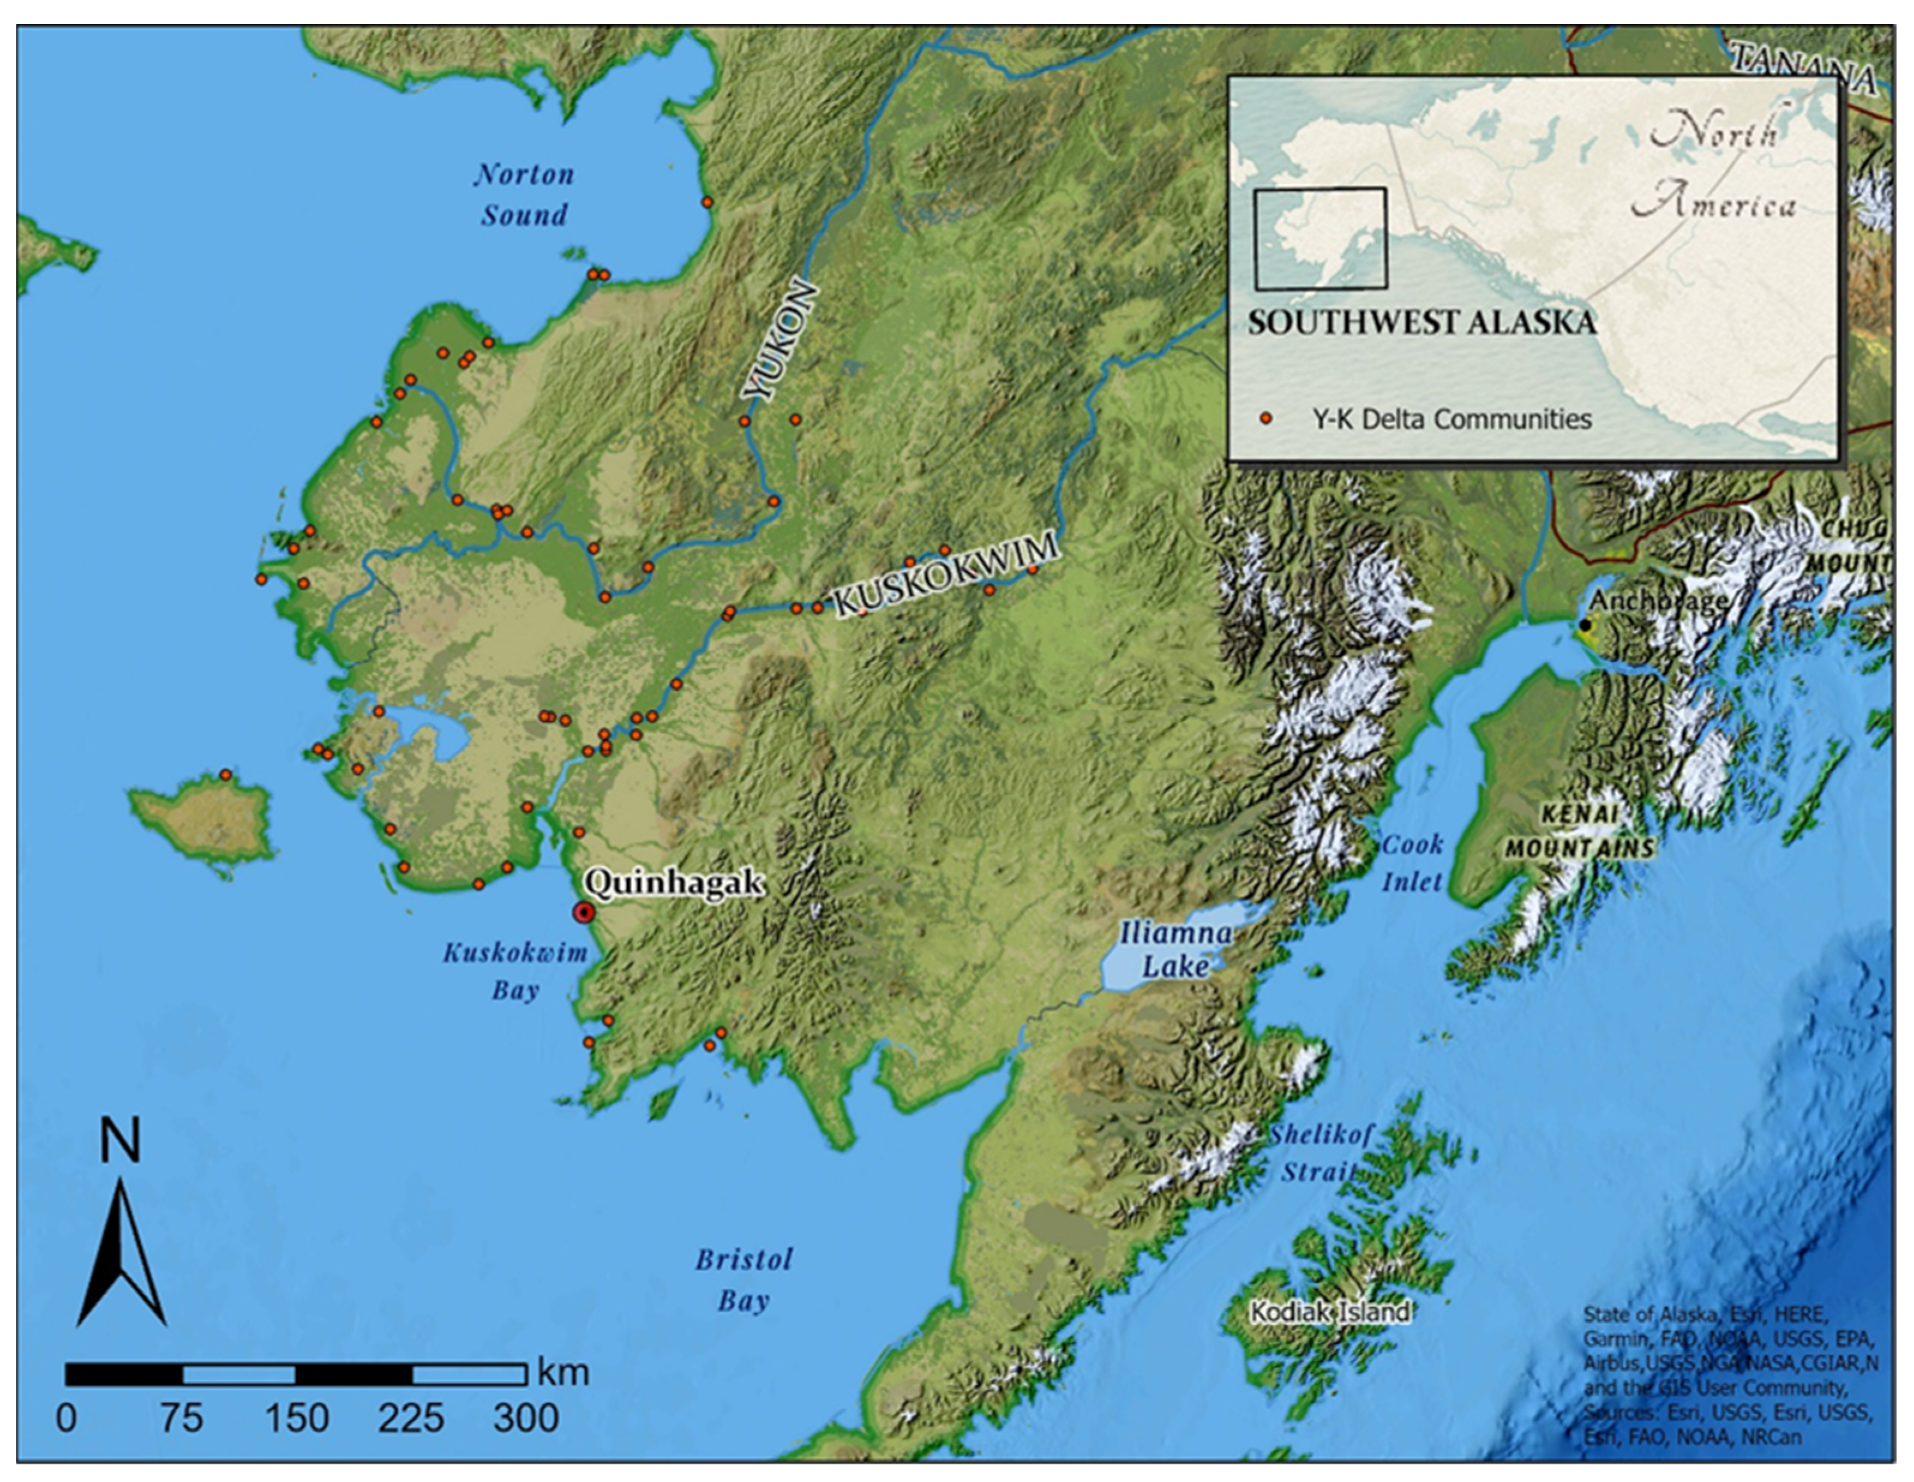
2.1. Data and Study Area: Quinhagak, AK
2.2. Study Sites Selection
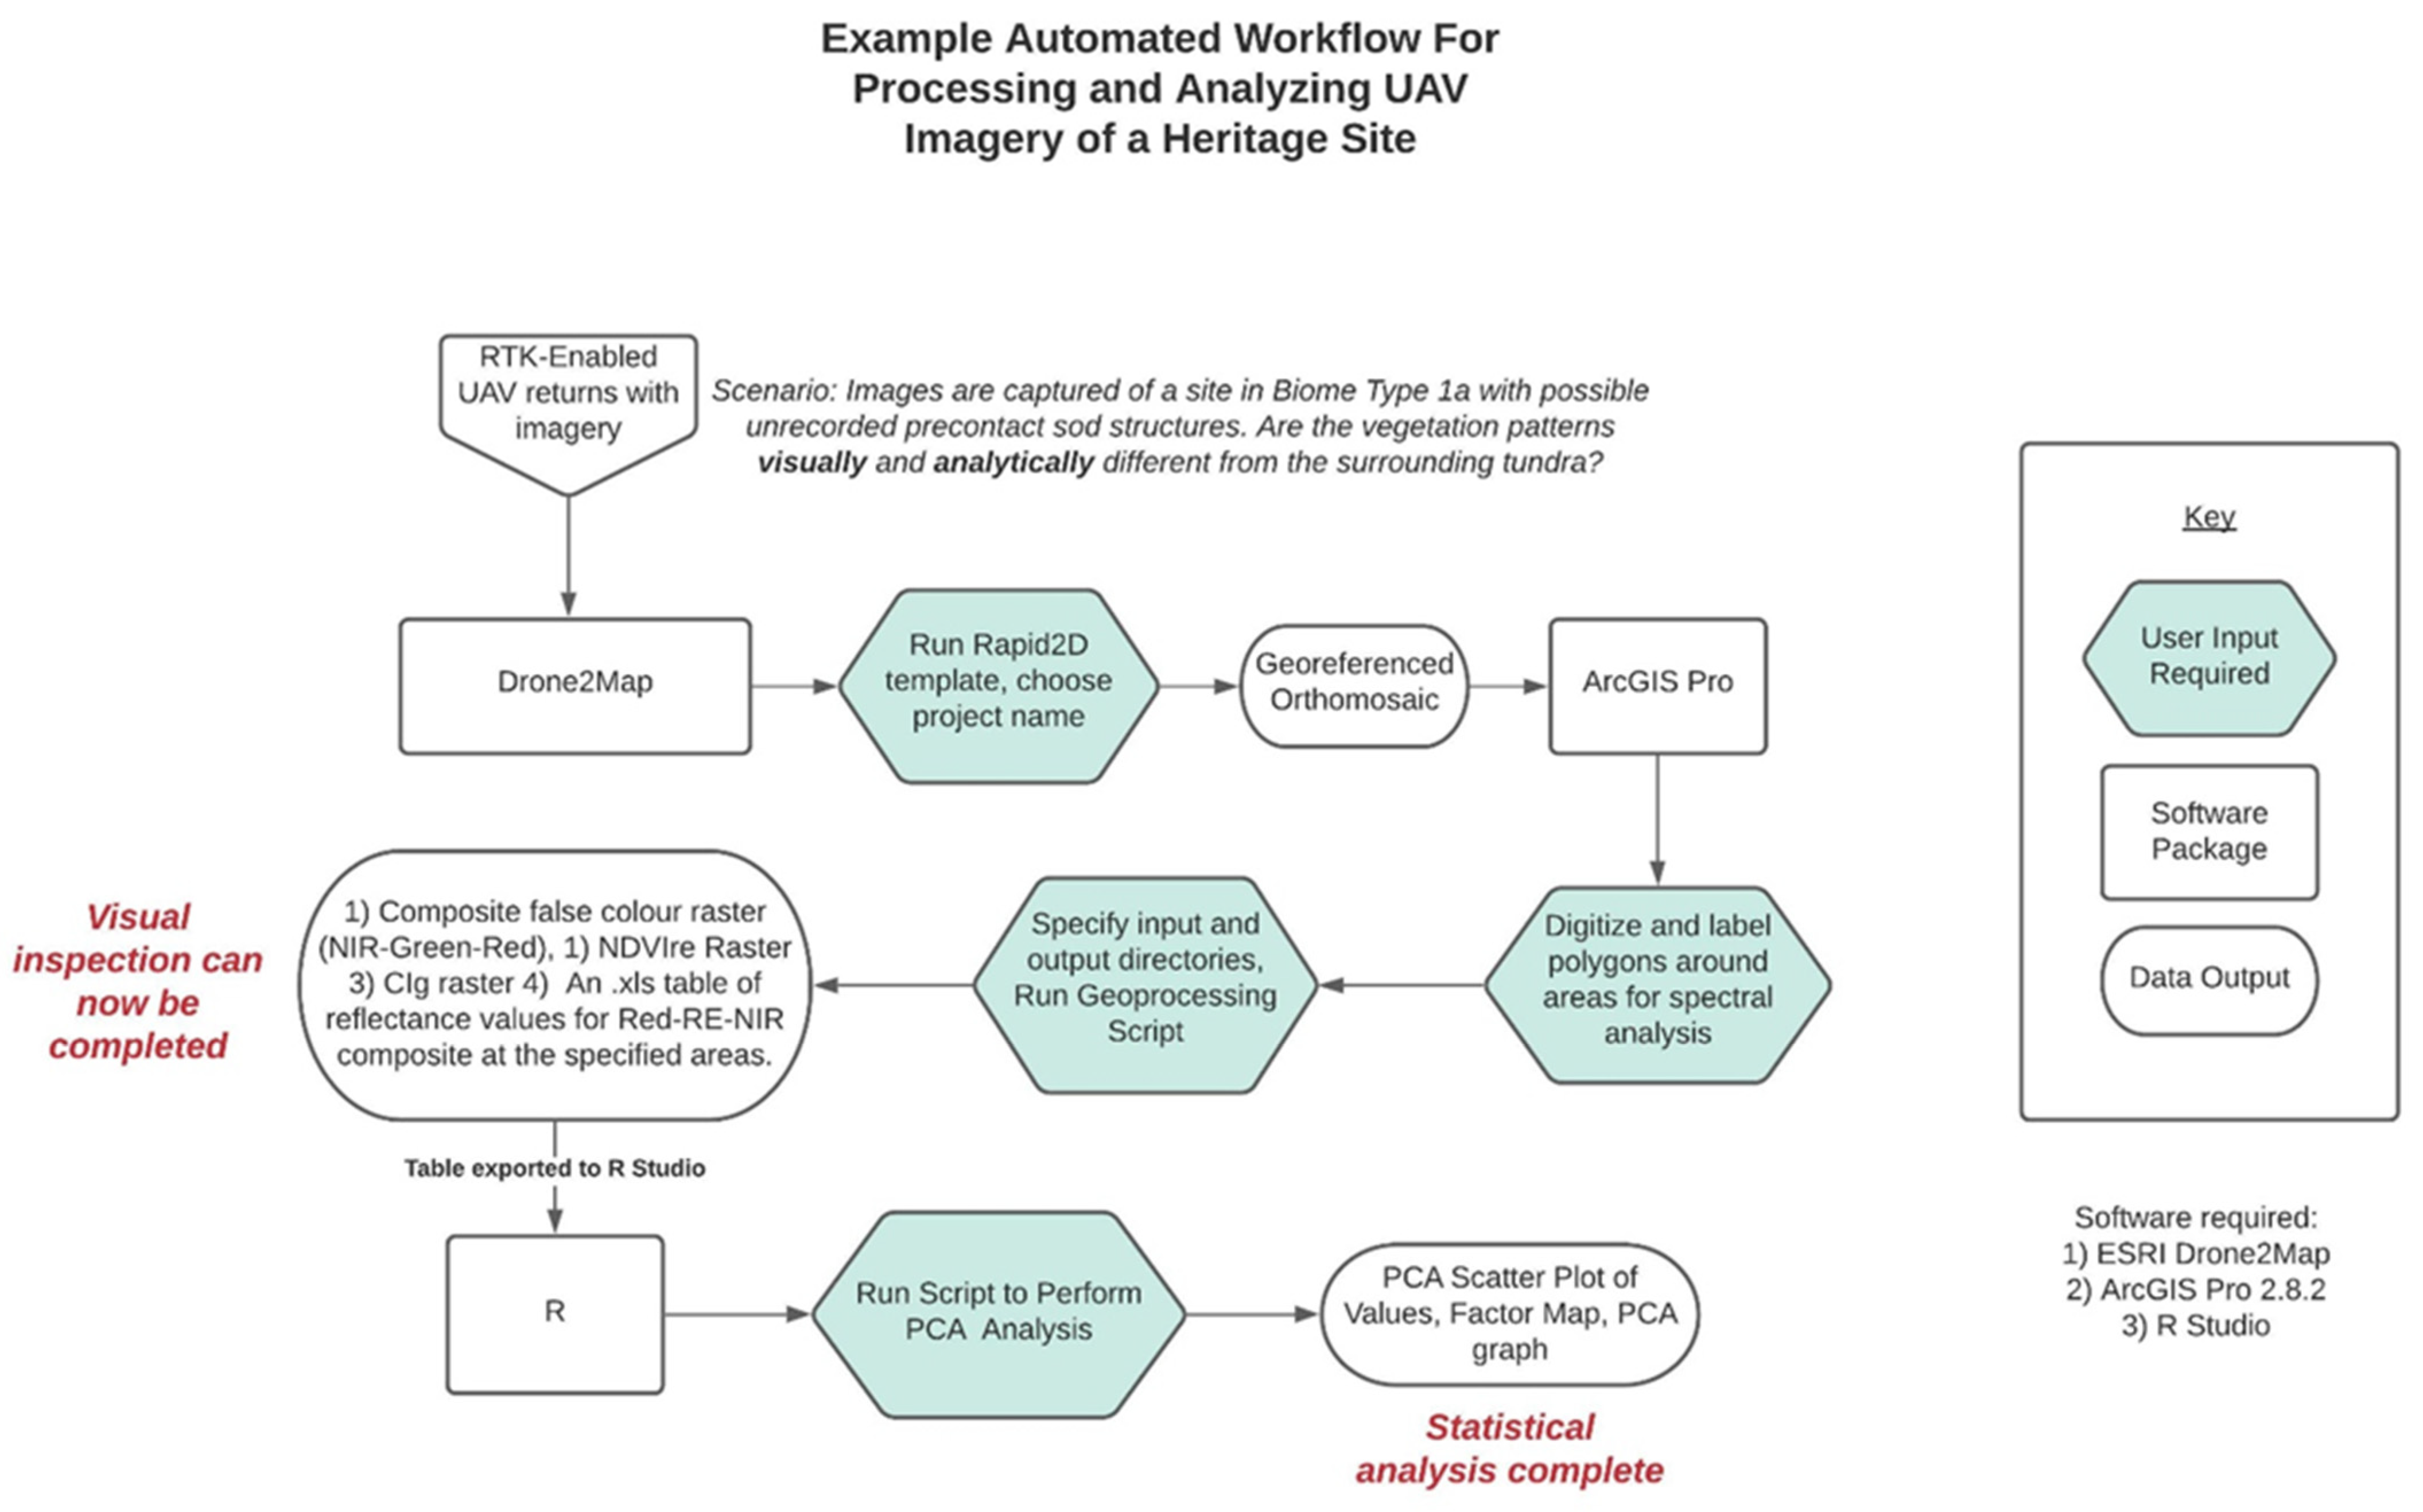
2.3. Image Capture: Equipment, Software, and Procedures
2.4. Ethnobotanical and Archaeological Ground Surveys
2.5. Data Processing and Spectral Analysis
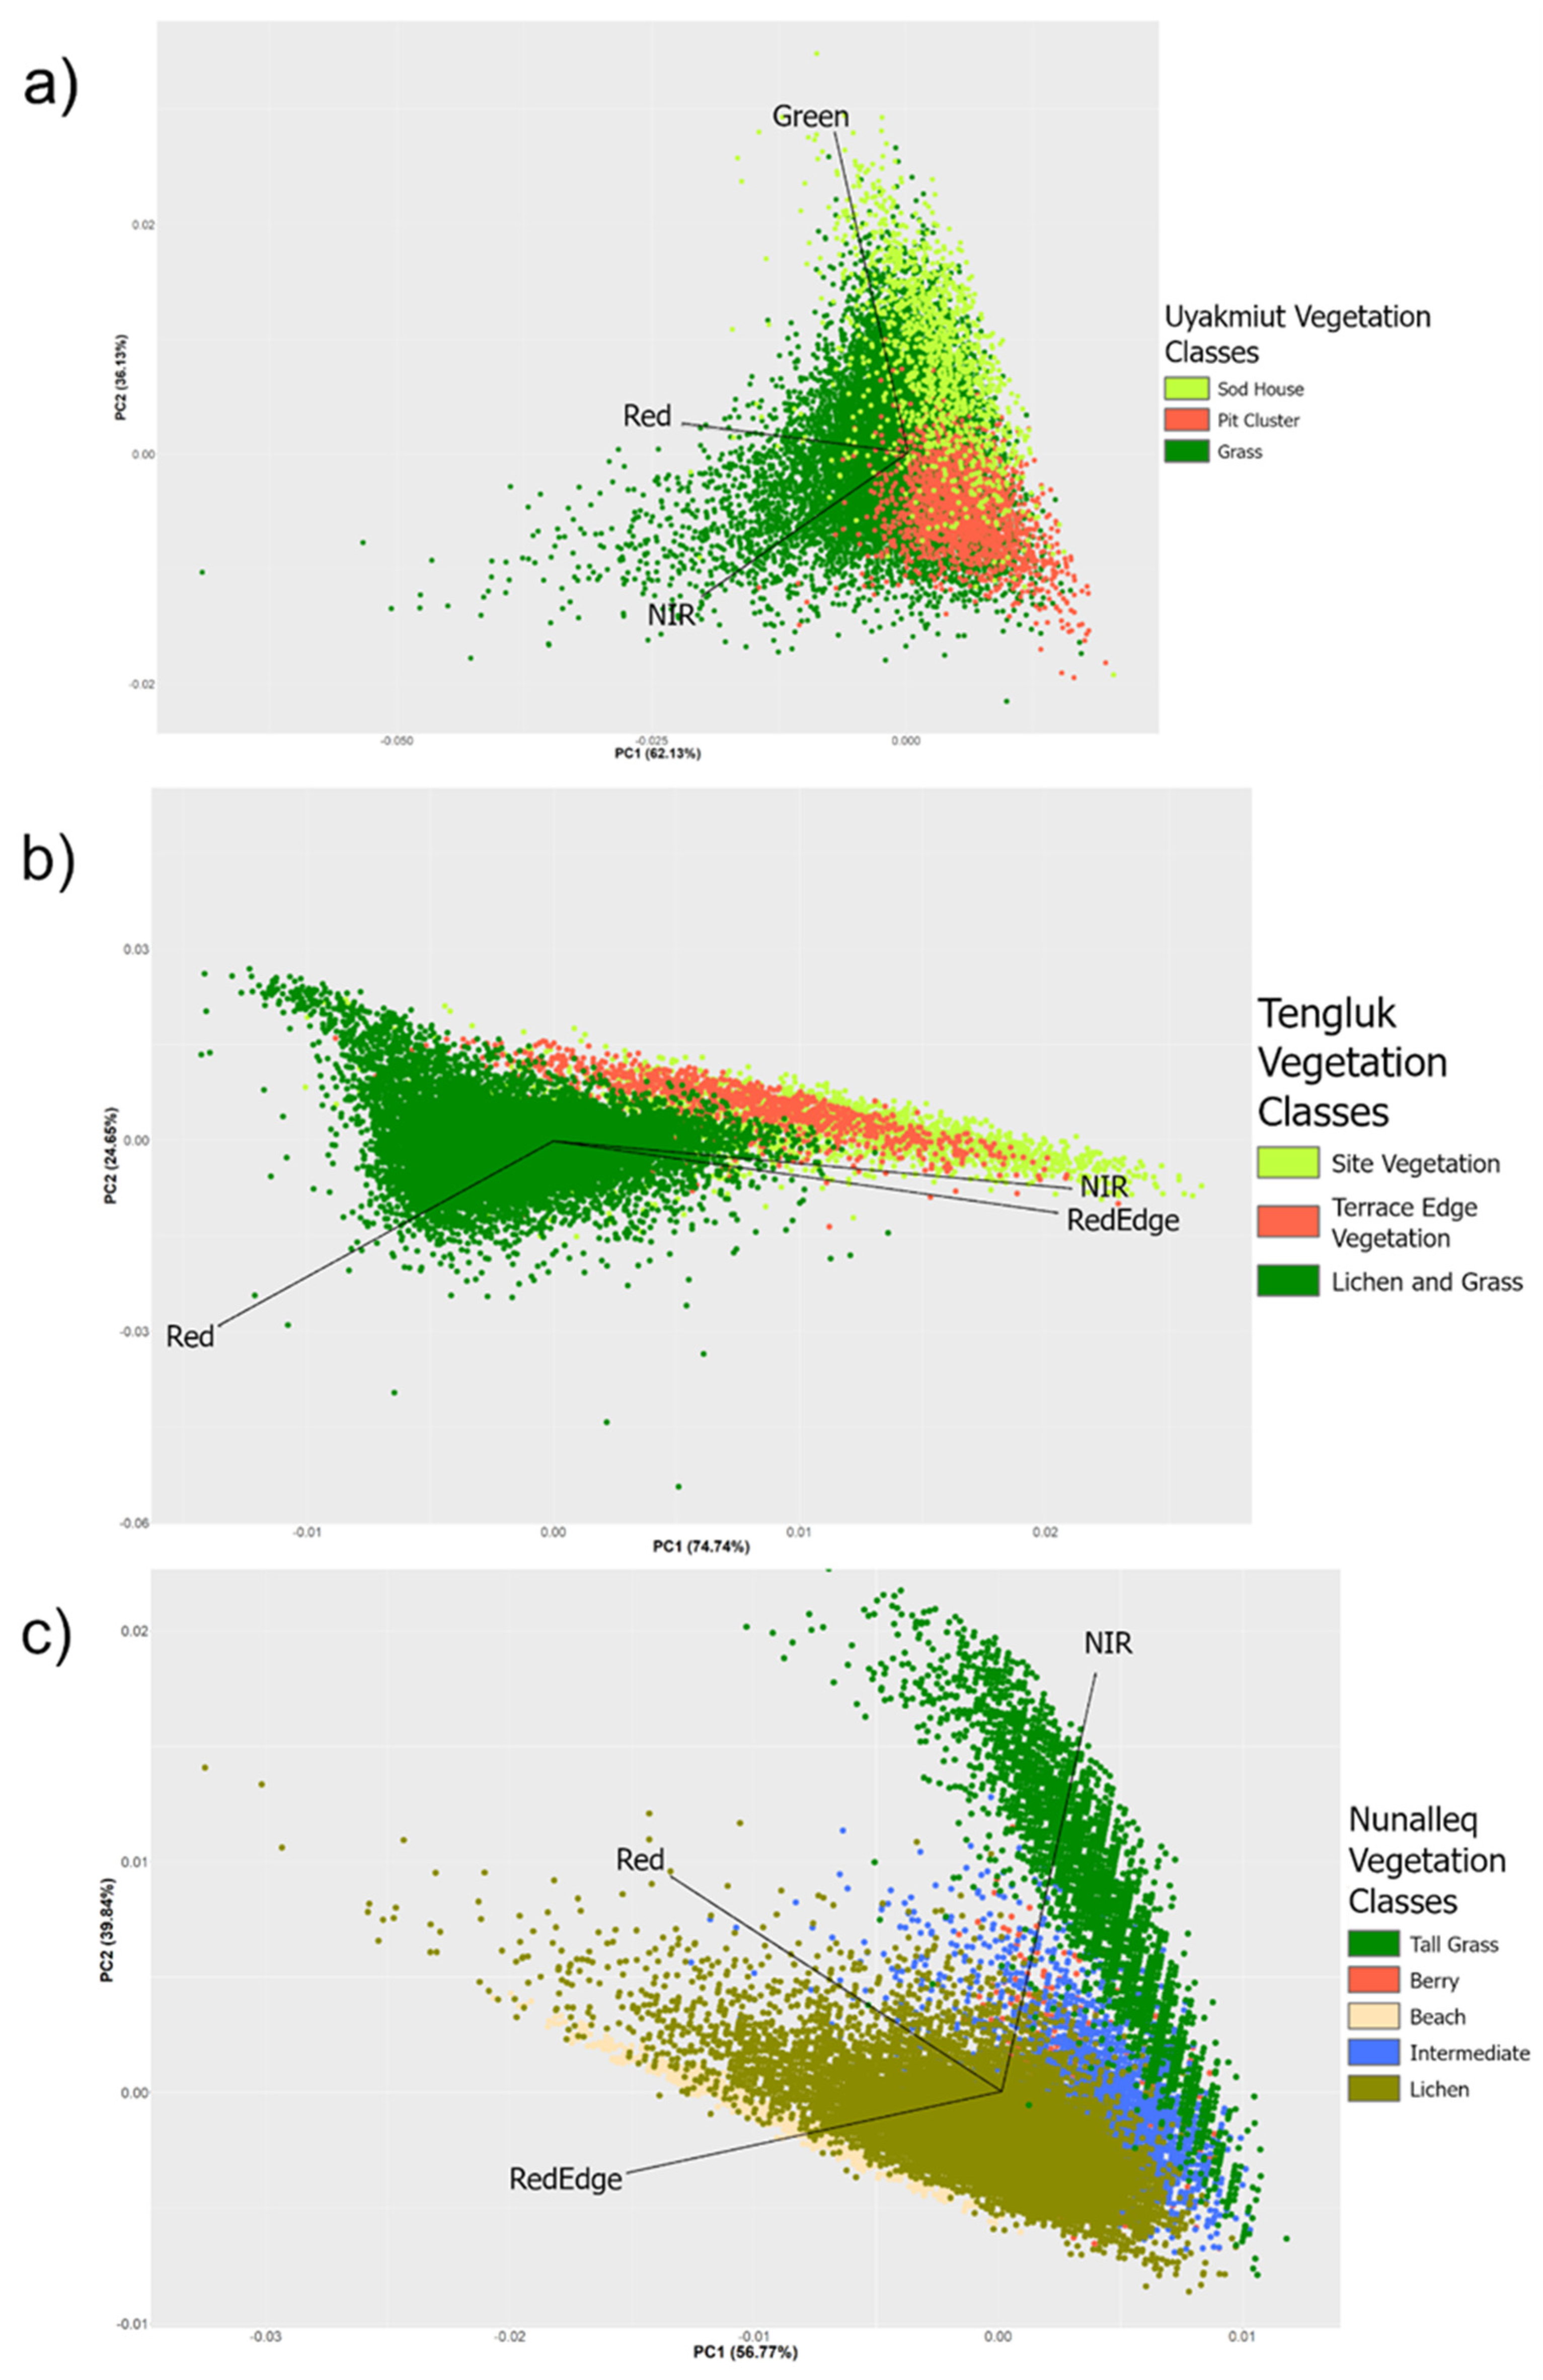
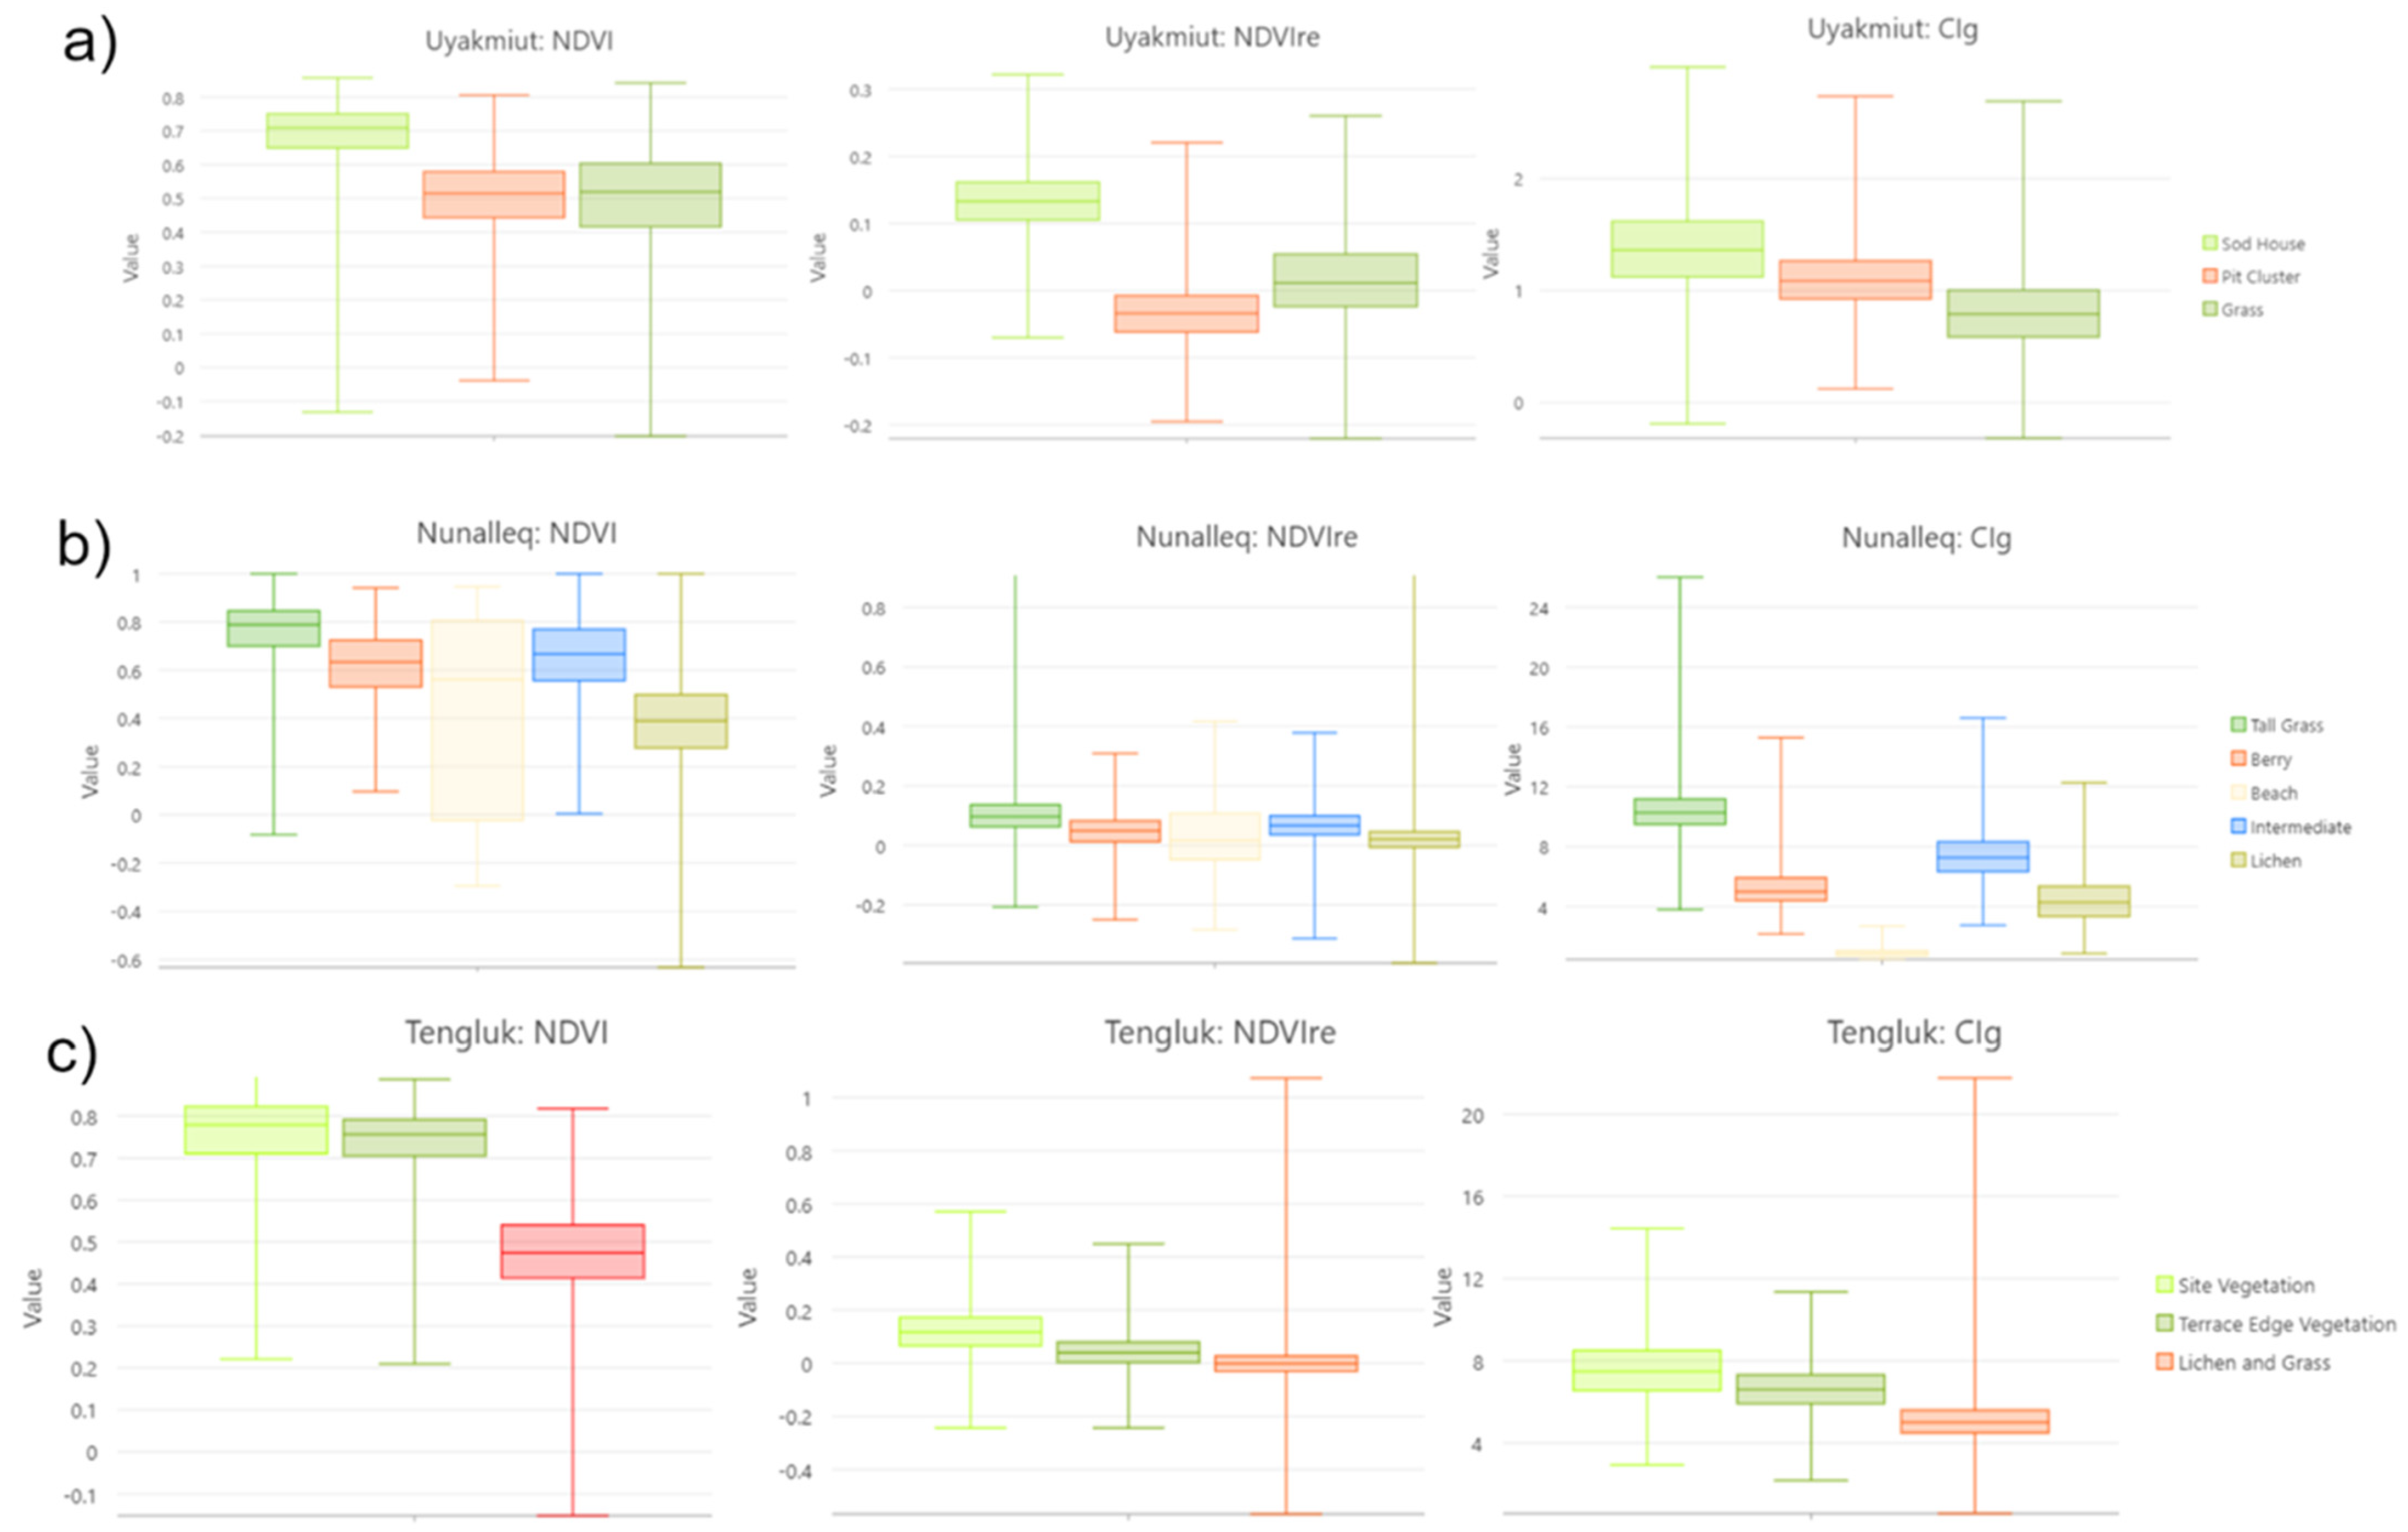
3. Results
3.1. Tengluk (Type 1a Biomes)
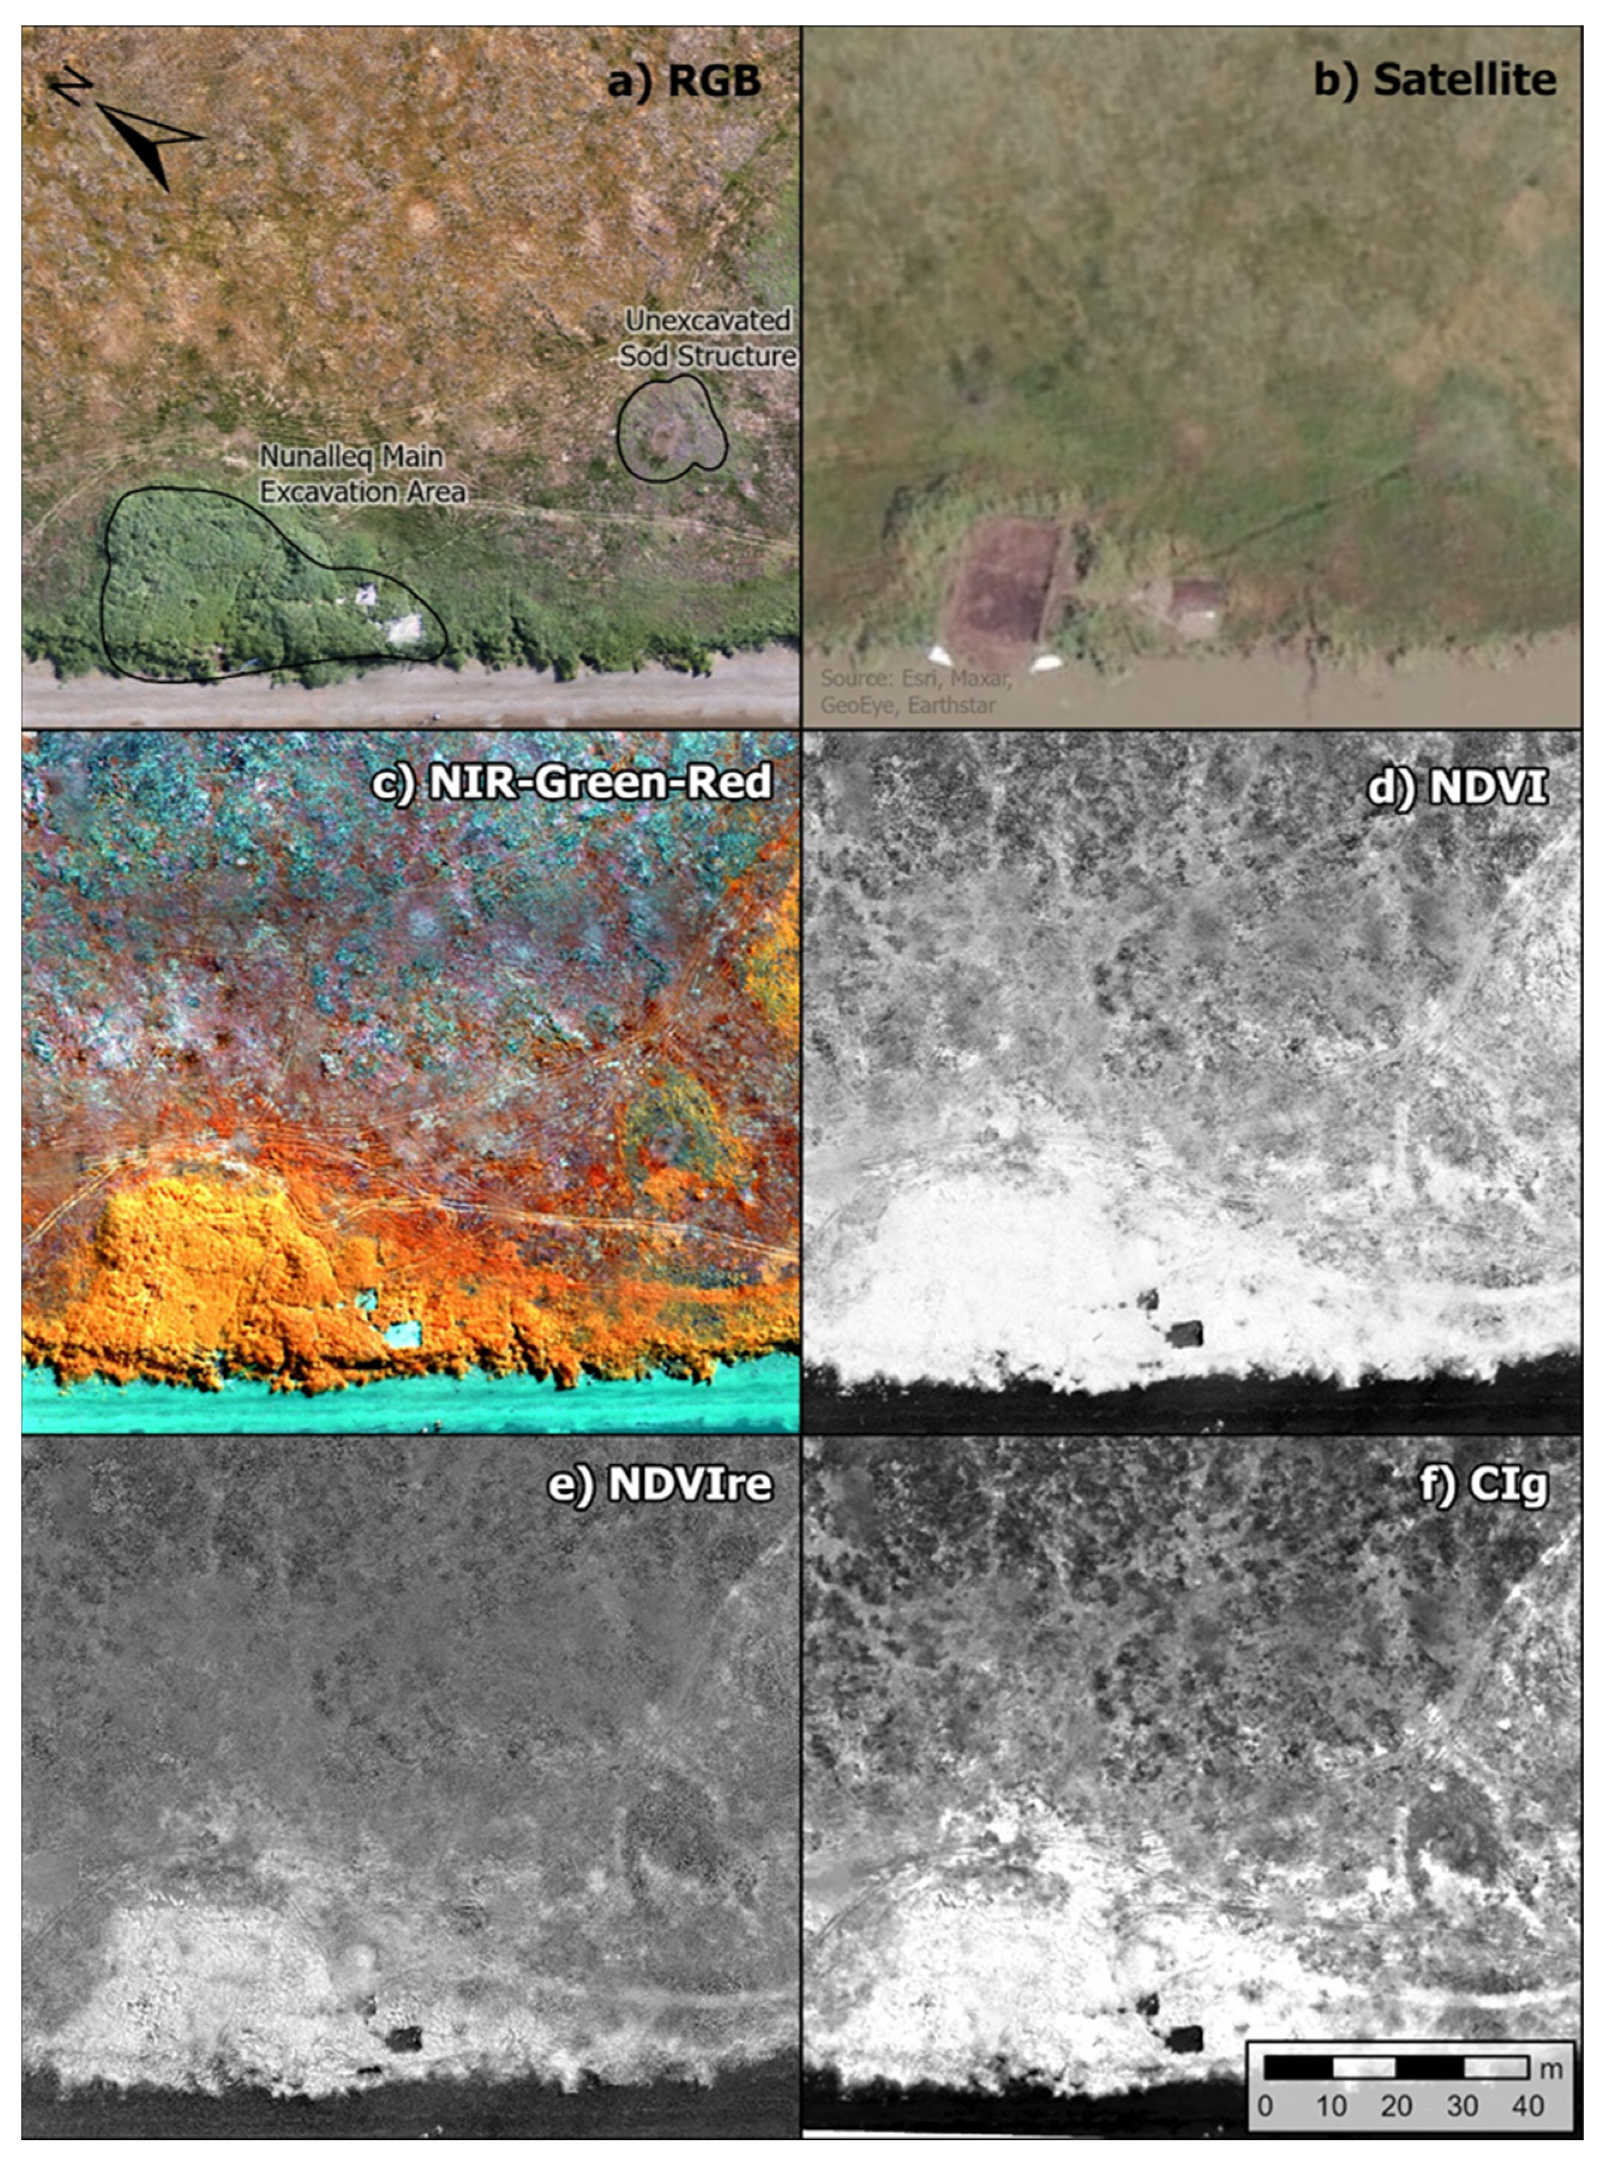
3.2. Nunalleq (Type 1b Biomes)
3.3. Uyakmiut (Type 2 Biomes)
4. Discussion
4.1. Summary of Results
4.2. Deploying UAV-Mounted Sensors for Surveying Cultural Landscapes
4.3. The Role of Ethnobotany for Augmenting UAV-Based Studies and Monitoring
5. Conclusions: Automating UAV Data Processing to Build Capacity and Fostering Data Sovereignty
Author Contributions
Funding
Institutional Review Board Statement
Informed Consent Statement
Data Availability Statement
Acknowledgments
Conflicts of Interest
References
- Jorgenson, M.T.; Frost, G.V.; Dissing, D. Drivers of Landscape Changes in Coastal Ecosystems on the Yukon-Kuskokwim Delta, Alaska. Remote Sens. 2018, 10, 1280. [Google Scholar] [CrossRef] [Green Version]
- Rearden, A.; Fienup-Riordan, A. Erinaput Unguvaniartut: So Our Voices Will Live: Quinhagak History and Oral Traditions; Alaska Native Language Center: Fairbanks, AK, USA, 2013; ISBN 978-0-615-86633-8. [Google Scholar]
- Fienup-Riordan, A.; Rearden, A.; Knecht, M. Irr’inarqellriit/Amazing Things: Quinhagak Elders Reflect on Their Past. Alsk. J. Anthropol. 2015, 13, 37–70. [Google Scholar]
- Cochran, P.; Huntington, O.H.; Pungowiyi, C.; Tom, S.; Chapin, F.S., III; Huntington, H.P.; Maynard, N.G.; Trainor, S.F. Indigenous Frameworks for Observing and Responding to Climate Change in Alaska. Clim. Chang. 2013, 120, 557–567. [Google Scholar] [CrossRef]
- Britton, K.; Hillerdal, C. Archaeologies of Climate Change: Perceptions and Prospects. Études Inuit Stud. 2019, 43, 265–287. [Google Scholar] [CrossRef]
- Hollesen, J.; Callanan, M.; Dawson, T.; Fenger-Nielsen, R.; Friesen, T.M.; Jensen, A.M.; Markham, A.; Martens, V.V.; Pitulko, V.V.; Rockman, M. Climate change and the deteriorating archaeological and environmental archives of the Arctic. Antiquity 2018, 92, 573–586. [Google Scholar] [CrossRef]
- Terenzi, J.; Jorgenson, M.T.; Ely, C.R.; Giguère, N. Storm-Surge Flooding on the Yukon-Kuskokwim Delta, Alaska. Arctic 2014, 67, 360–374. [Google Scholar] [CrossRef]
- Bronen, R. Forced Migration of Alaskan Indigenous Communities Due to Climate Change. In Environment, Forced Migration and Social Vulnerability; Afifi, T., Jäger, J., Eds.; Springer: Berlin/Heidelberg, Germany, 2010; pp. 87–98. ISBN 978-3-642-12416-7. [Google Scholar]
- Fienup-Riordan, A. The Way We Genuinely Live; University of Washington Press: Seattle, WA, USA, 2007; ISBN 978-0-295-98669-2. [Google Scholar]
- Hillerdal, C.; Knecht, R.; Jones, W. Nunalleq: Archaeology, Climate Change, and Community Engagement in a Yup’ik Village. Arct. Anthropol. 2019, 56, 4–17. [Google Scholar] [CrossRef]
- Knecht, R.; Jones, W. “The Old Village”: Yup’ik Precontact Archaeology and Community-Based Research at the Nunalleq Site, Quinhagak, Alaska. Études Inuit Stud. 2019, 43, 25–52. [Google Scholar] [CrossRef]
- Steffian, A.; Leist, M.; Haakanson, S.; Saltonstall, P. Kal’unek/From Karluk: Kodiak Alutiiq History and the Archaeology of the Karluk One Village Site; Illustrated Edition; University of Alaska Press: Fairbanks, AK, USA, 2015; ISBN 978-1-60223-244-0. [Google Scholar]
- Fienup-Riordan, A. (Ed.) Qaluyaarmiuni Nunamtenek Qanemciput/Our Nelson Island Stories: Meanings of Place on the Bering Sea Coast; Illustrated Edition; University of Washington Press: Bethel, NY, USA, 2011; ISBN 978-0-295-99135-1. [Google Scholar]
- Herman-Mercer, N.M.; Matkin, E.; Laituri, M.J.; Toohey, R.C.; Massey, M.; Elder, K.; Schuster, P.F.; Mutter, E.A. Changing Times, Changing Stories: Generational Differences in Climate Change Perspectives from Four Remote Indigenous Communities in Subarctic Alaska. Ecol. Soc. 2016, 21, 28. [Google Scholar] [CrossRef] [Green Version]
- Smith, J.; Gleason, S. “Knowledge Is Like Food”: Qanruyutet on Change and Subsistence from John Smith. Text Perform. Q. 2021, 41, 37–60. [Google Scholar] [CrossRef]
- Khorram, S.; Koch, F.H.; van der Wiele, C.F.; Nelson, S.A.C. Remote Sensing; Springer Briefs in Space Development; Springer: New York, NY, USA, 2012; ISBN 978-1-4614-3102-2. [Google Scholar]
- Keeney, J.; Hickey, R. Using Satellite Image Analysis for Locating Prehistoric Archaeological Sites in Alaska’s Central Brooks Range. J. Archaeol. Sci. Rep. 2015, 3, 80–89. [Google Scholar] [CrossRef] [Green Version]
- Linares Matás, G.J.; Lim, J.S. Monumental Funerary Landscapes of Dhar Tagant (South-Eastern Mauritania): Towards Ethical Satellite Remote Sensing in the West African Sahel. Archaeol. Prospect. 2021, 28, 357–378. [Google Scholar] [CrossRef]
- Davis, D.S.; Andriankaja, V.; Carnat, T.L.; Chrisostome, Z.M.; Colombe, C.; Fenomanana, F.; Hubertine, L.; Justome, R.; Lahiniriko, F.; Léonce, H.; et al. Satellite-Based Remote Sensing Rapidly Reveals Extensive Record of Holocene Coastal Settlement on Madagascar. J. Archaeol. Sci. 2020, 115, 105097. [Google Scholar] [CrossRef]
- Lim, J.S.; Gleason, S.; Jones, W.; Church, W. Nuna Nalluyuituq (The Land Remembers): Remembering Landscapes and Refining Methodologies through Community-Based Remote Sensing in the Yukon-Kuskokwim Delta, Southwest Alaska. Archaeol. Prospect. 2021, 28, 339–355. [Google Scholar] [CrossRef]
- Fisher, M.; Fradley, M.; Flohr, P.; Rouhani, B.; Simi, F. Ethical Considerations for Remote Sensing and Open Data in Relation to the Endangered Archaeology in the Middle East and North Africa Project. Archaeol. Prospect. 2021, 28, 279–292. [Google Scholar] [CrossRef]
- Beamish, A.; Raynolds, M.K.; Epstein, H.; Frost, G.V.; Macander, M.J.; Bergstedt, H.; Bartsch, A.; Kruse, S.; Miles, V.; Tanis, C.M.; et al. Recent Trends and Remaining Challenges for Optical Remote Sensing of Arctic Tundra Vegetation: A Review and Outlook. Remote Sens. Environ. 2020, 246, 111872. [Google Scholar] [CrossRef]
- Avtar, R.; Watanabe, T. Introduction. In Unmanned Aerial Vehicle: Applications in Agriculture and Environment; Avtar, R., Watanabe, T., Eds.; Springer: Cham, Switzerland, 2020; pp. 1–7. [Google Scholar]
- Harmsen, H.; Hollesen, J.; Madsen, C.K.; Albrechtsen, B.; Myrup, M.; Matthiesen, H. A Ticking Clock? Preservation and Management of Greenland’s Archaeological Heritage in the Twenty-First Century. Conserv. Manag. Archaeol. Sites 2018, 20, 175–198. [Google Scholar] [CrossRef]
- Fenger-Nielsen, R.; Hollesen, J.; Matthiesen, H.; Andersen, E.A.S.; Westergaard-Nielsen, A.; Harmsen, H.; Michelsen, A.; Elberling, B. Footprints from the Past: The Influence of Past Human Activities on Vegetation and Soil across Five Archaeological Sites in Greenland. Sci. Total Environ. 2019, 654, 895–905. [Google Scholar] [CrossRef]
- Walker, S. Low-Altitude Aerial Thermography for the Archaeological Investigation of Arctic Landscapes. J. Archaeol. Sci. 2020, 117, 105126. [Google Scholar] [CrossRef]
- Walsh, M.J.; Tejsner, P.; Carlson, D.F.; Vergeynst, L.; Kjeldsen, K.U.; Gründger, F.; Dai, H.; Thomsen, S.; Laursen, E. The VIMOA Project and Archaeological Heritage in the Nuussuaq Peninsula of North-West Greenland. Antiquity 2020, 94, E6. [Google Scholar] [CrossRef]
- Nicu, I.C.; Rubensdotter, L.; Stalsberg, K.; Nau, E. Coastal Erosion of Arctic Cultural Heritage in Danger: A Case Study from Svalbard, Norway. Water 2021, 13, 784. [Google Scholar] [CrossRef]
- Liu, J.; Chen, J.; Qin, Q.; You, H.; Han, X.; Zhou, G. Patch Pattern and Ecological Risk Assessment of Alpine Grassland in the Source Region of the Yellow River. Remote Sens. 2020, 12, 3460. [Google Scholar] [CrossRef]
- Lasaponara, R.; Masini, N. Detection of Archaeological Crop Marks by Using Satellite QuickBird Multispectral Imagery. J. Archaeol. Sci. 2007, 34, 214–221. [Google Scholar] [CrossRef]
- Boles, O.J.C.; Lane, P.J. The Green, Green Grass of Home: An Archaeo-Ecological Approach to Pastoralist Settlement in Central Kenya. Azania Archaeol. Res. Afr. 2016, 51, 507–530. [Google Scholar] [CrossRef] [Green Version]
- Lyons, N.; Ritchie, M. The Archaeology of Camas Production and Exchange on the Northwest Coast: With Evidence from a Sts’ailes (Chehalis) Village on the Harrison River, British Columbia. J. Ethnobiol. 2017, 37, 346–367. [Google Scholar] [CrossRef]
- O’Rourke, S.R.; Turner, J.J.; Ritchie, K. Key to the Past: Community Perceptions of Yup’ik Youth Interaction with Culturally Relevant Education Inspired by the Nunalleq Archaeology Project. J. Archaeol. Educ. 2018, 2, 1. [Google Scholar]
- Milek, K. Transdisciplinary Archaeology and the Future of Archaeological Practice: Citizen Science, Portable Science, Ethical Science. Nor. Archaeol. Rev. 2018, 51, 36–47. [Google Scholar] [CrossRef]
- Mossolova, A. Innovation and Healing in Contemporary Yup’ik Mask Making. Anthropologica 2020, 62, 365–379. [Google Scholar] [CrossRef]
- Linares Matás, G.J.; Lim, J.S. “This Is the Way”: Knowledge Networks and Toolkit Specialization in the Circumpolar Coastal Landscapes of Western Alaska and Tierra Del Fuego. J. Isl. Coast. Archaeol. 2021, 1–29. [Google Scholar] [CrossRef]
- Lim, J.S.; Matás, G.J.L. Using Open Spatial Data to Investigate the Importance of Salmon Streams in the Indigenous Cultural Landscapes of Southwest Alaska. SocArXiv 2021, 1–25. [Google Scholar] [CrossRef]
- Pleasant, J. Traditional Names and Places of Native Village of Kwinhagak; Native Village of Kwinhagak, Quinhagak IRA Council: Quinhagak, AK, USA, 1999. [Google Scholar]
- Hanson, D.K. Cultural Resource Management in Alaska. Alsk. J. Anthropol. 2007, 5, 1–16. [Google Scholar]
- Yugtun. Available online: https://www.yugtun.com/ (accessed on 28 December 2021).
- Fienup-Riordan, A. Yungcautnguuq Nunam Qainga Tamarmi/The Entire Surface of the Land Is Medicine: Edible and Medicinal Plants of Southwest Alaska; University of Alaska Press: Fairbanks, AK, USA, 2021; ISBN 978-1-60223-422-2. [Google Scholar]
- Tucker, C.J. Red and Photographic Infrared Linear Combinations for Monitoring Vegetation. Remote Sens. Environ. 1979, 8, 127–150. [Google Scholar] [CrossRef] [Green Version]
- Barnes, E.M.; Clarke, T.R.; Richards, S.E.; Colaizzi, P.D.; Haberland, J.; Kostrzewski, M.; Waller, P.; Choi, C.; Riley, E.; Thompson, T. Coincident Detection of Crop Water Stress, Nitrogen Status and Canopy Density Using Ground-Based Multispectral Data. In Proceedings of the 5th International Conference on Precision Agriculture and Other Resource Management, Bloomington, MN, USA, 16–19 July 2000. [Google Scholar]
- Muramatsu, K. Use of Chlorophyll Index-Green and the Red-Edge Chlorophyll Index to Derive an Algorithm for Estimating Gross Primary Production Capacity. In Proceedings of the Conference on Remote Sensing for Agriculture, Ecosystems, and Hydrology XXI, Strasbourg, France, 9–11 September 2019; SPIE: Bellingham, WA, USA, 2019; Volume 11149, pp. 54–61. [Google Scholar]
- Everitt, B.S.; Skrondal, A. The Cambridge Dictionary of Statistics, 4th ed.; Cambridge University Press: Cambridge, UK; New York, NY, USA, 2010; ISBN 978-0-521-76699-9. [Google Scholar]
- Lê, S.; Josse, J.; Husson, F. FactoMineR: An R Package for Multivariate Analysis. J. Stat. Softw. 2008, 25, 1–18. [Google Scholar] [CrossRef] [Green Version]
- Pearson, K. LIII. On Lines and Planes of Closest Fit to Systems of Points in Space. Lond. Edinb. Dublin Philos. Mag. J. Sci. 1901, 2, 559–572. [Google Scholar] [CrossRef] [Green Version]
- Hotelling, H. Analysis of a Complex of Statistical Variables into Principal Components. J. Educ. Psychol. 1933, 24, 417–441. [Google Scholar] [CrossRef]
- Tang, Y.; Horikoshi, M.; Li, W. Ggfortify: Unified Interface to Visualize Statistical Results of Popular R Packages. R J. 2016, 8, 474–485. [Google Scholar] [CrossRef] [Green Version]
- Fisher, R.A. The Precision of Discriminant Functions. Ann. Eugen. 1940, 10, 422–429. [Google Scholar] [CrossRef] [Green Version]
- McLachlan, G.J. Discriminant Analysis and Statistical Pattern Recognition; John Wiley & Sons: Hoboken, NJ, USA, 2005; ISBN 978-0-471-72528-2. [Google Scholar]
- Venables, W.N.; Ripley, B.D. Modern Applied Statistics with S-Plus; Springer Science & Bussines Media: Berlin/Heidelberg, Germany, 1999. [Google Scholar]
- Lane, P.J. Entangled Banks and the Domestication of East African Pastoralist Landscapes. In Archaeology of Entanglement; Routledge: Abingdon-on-Thames, UK, 2016; ISBN 978-1-315-43393-6. [Google Scholar]
- Chowdhery, A.; Chiang, M. Model Predictive Compression for Drone Video Analytics. In Proceedings of the 2018 IEEE International Conference on Sensing, Communication and Networking (SECON Workshops), Hong Kong, China, 11–13 June 2018; pp. 1–5. [Google Scholar]
- Ager, T.A.; Ager, L.P. Ethnobotany of the Eskimos of Nelson Island, Alaska. Arct. Anthropol. 1980, 17, 26–48. [Google Scholar]
- Parker, P.; King, T.F. Guidelines for Evaluating and Documenting Traditional Cultural Properties; U.S. Department of the Interior, National Park Service, Interagency Resources Division: Washington, DC, USA, 1990.
- Herman-Mercer, N.M.; Loehman, R.A.; Toohey, R.C.; Paniyak, C. Climate- and Disturbance-Driven Changes in Subsistence Berries in Coastal Alaska: Indigenous Knowledge to Inform Ecological Inference. Hum. Ecol. 2020, 48, 85–99. [Google Scholar] [CrossRef]
- Barnhardt, N.R. Creating a place for indigenous knowledge in education: The Alaska native knowledge network. In Place-Based Education in the Global Age; Routledge: Abingdon-on-Thames, UK, 2007; ISBN 978-1-315-76984-4. [Google Scholar]
- Charles, W. Qaneryaramta Egmiucia: Continuing Our Language. Anthropol. Educ. Q. 2005, 36, 107–111. [Google Scholar] [CrossRef]
- Harding, A.; Harper, B.; Stone, D.; O’Neill, C.; Berger, P.; Harris, S.; Donatuto, J. Conducting Research with Tribal Communities: Sovereignty, Ethics, and Data-Sharing Issues. Environ. Health Perspect. 2012, 120, 6–10. [Google Scholar] [CrossRef] [PubMed] [Green Version]
- Latulippe, N.; Klenk, N. Making Room and Moving over: Knowledge Co-Production, Indigenous Knowledge Sovereignty and the Politics of Global Environmental Change Decision-Making. Curr. Opin. Environ. Sustain. 2020, 42, 7–14. [Google Scholar] [CrossRef]


| Biome Type | Tundra Biome Description | Site Name | Site Description | Anomalous Vegetation Patterns |
|---|---|---|---|---|
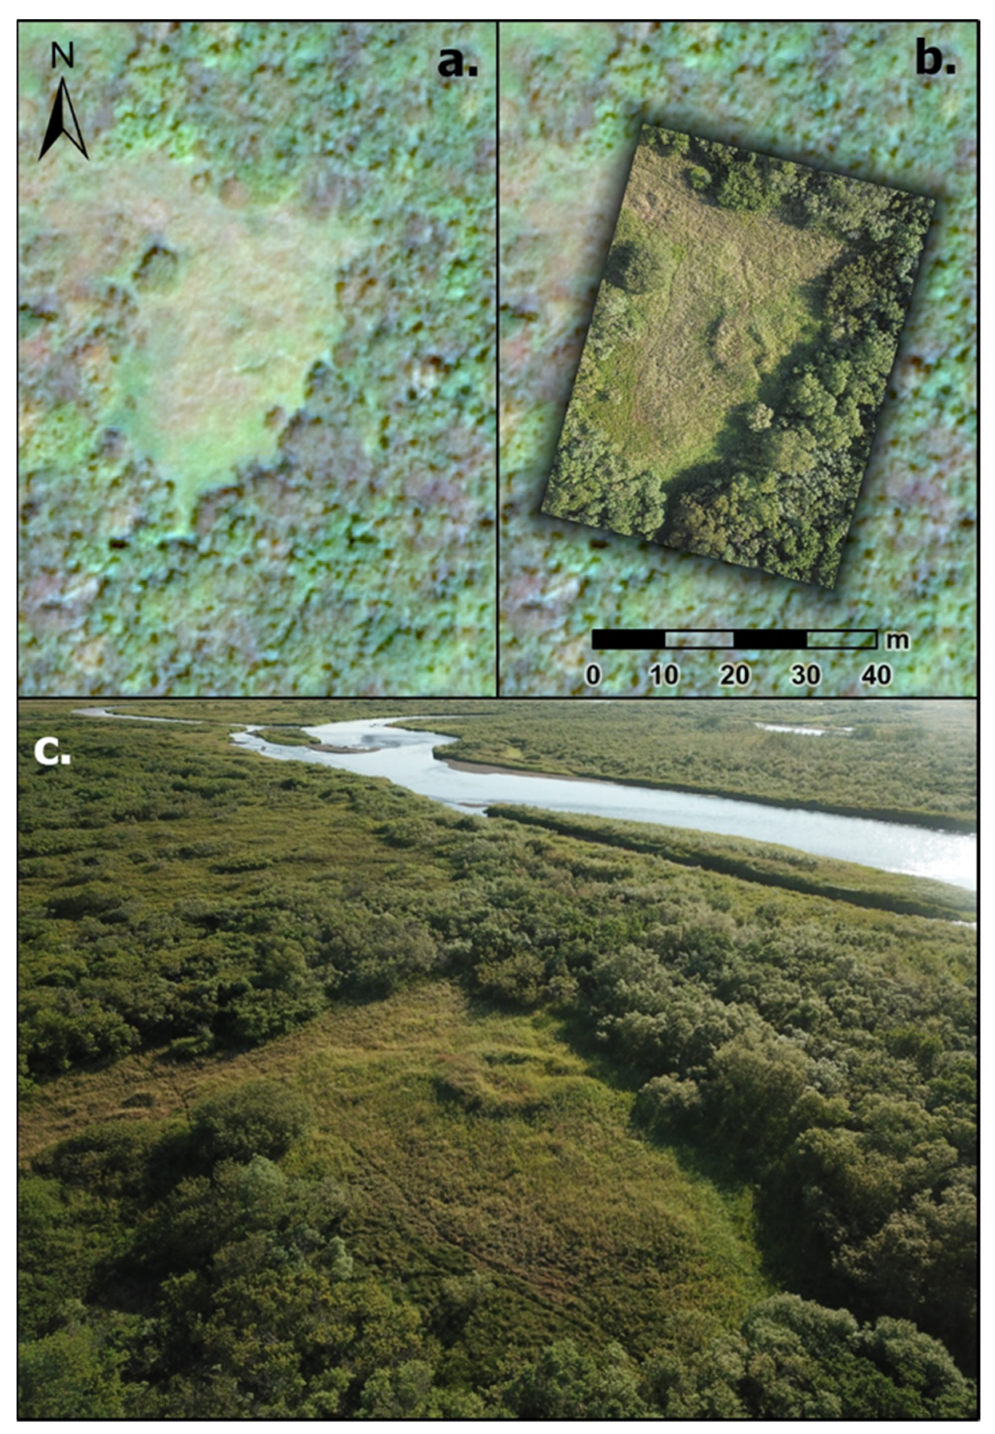
| 1a | Well-drained tundra at relatively high elevations. The dominant natural vegetation consists of equal parts lichen and grass. Surficial archaeological features display dense growth of forbs, especially cilqaaq (Fireweed, Chamerion angustifolium), a forb with purple flowers. 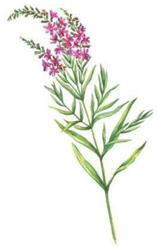 | Tengluk (GDN-268) * | Terrace of a former lake at the mouth of the Qanirtuuq with clusters of fish processing pits. It is known ethnographically as being the fish camp of the Carter family sometime in the mid-20th century ([38] Annie Cleveland pers comm. 16/7/2019) | Dense community of cilqaaq (Fireweed, Chamerion angustifolium) around the largest cluster of pits. |
| GDN-267 | A large sod house with two smaller sod structures. Typologically prehistoric Yup’ik artifacts were recovered from the sod house and a radiocarbon date on a worked antler tool is pending. It is probably broadly contemporary with the Nunalleq site. | Dense community of cilqaaq in the vicinity of the sod structures. | ||
| Agalig Grave | A 9 m long oval grave mound on a river terrace near the Agalig mouth of indeterminate age. Oral histories suggest it belongs to a man who did not listen to his Elders and was swept away by a strong current. His body was found entangled in branches upriver days later (Grace Annover pers. Comm. 2021) | Dense community of 70% unidentified forbs and 30% cilqaaq growing on the grave mound. | ||
| 1b | Very closely related to biome type 1a, but less well-drained. Lichen and grass are still dominant, but with an approximately 60/40 ratio. Very complex biome, with the highest variety of plant species. Surficial archaeological features are covered with lichen and dominated by salmonberry plants (Rubus chamaemorus)  | Nunalleq (GDN-247) * | A large prehistoric sod house complex that has been extensively excavated and damaged by erosion. A single large 15 m unexcavated sod house is present 30 m southeast from the main excavation trench. A test pit in the middle of this structure from 2017 shows a probable habitation context 1 m below the surface. A worked antler from here yields a radiocarbon date of 220 ± 30 cal. BP, making it contemporaneous with the terminal phase of the Nunalleq site. | Very dense tall grass community on the excavation trench of the main site. The walls of an unexcavated collapsed structure are now covered with lichen and dominated by salmonberry plants (Rubus chamaemorus). |
| Sam Carter’s Fish Camp | The former site of late Elder Sam Carter’s fish camp where he lived for most of the year, on a river terrace overlooking the Agalig. There was reportedly a single sod house there while he was still alive in the 1970s, but its exact location is unknown (John Smith pers. Comm. 2021). A subsurface grave on the terrace edge was observed eroding into the Agalig in 2017 by the author, but it is unclear if this grave belonged to Sam Carter or an ancestor. | Possible earthworks are potentially the remnants of two sod structures, now dominated by salmonberry plants. | ||
| 2 | Poorly drained, low-lying deltaic areas overwhelmingly dominated by graminoids. Surficial archaeological features are covered with grass that is noticeably taller and of a darker green-yellow hue than that of the surroundings. | Uyakmiut * | An apparent “Old Village” site with four sod houses at a creek north of Quinhagak. Artifacts, including lithics, have been eroding from the two houses at the creek bank for many years. Looter pits are present, corresponding to ethnographic accounts of looting [Church pers comm 2021]. An artifact eroding from the structure has been dated to Cal AD 1450 to 1640 [Knecht pers. Comm.] | On the structures themselves grows grass of a darker, more yellow hue that is much taller than the surrounding grass. |
| Agalig South Bank Site | At least three sod houses are present. One is eroding into the bay at the mouth of the Agalig. Protohistoric (ie. 19th century) artifacts have been recovered, like an ornate wooden spoon. The rate of erosion is rapid at this site. | On the structures themselves grows grass of a darker, yellower hue that is much taller than the surrounding grass. | ||
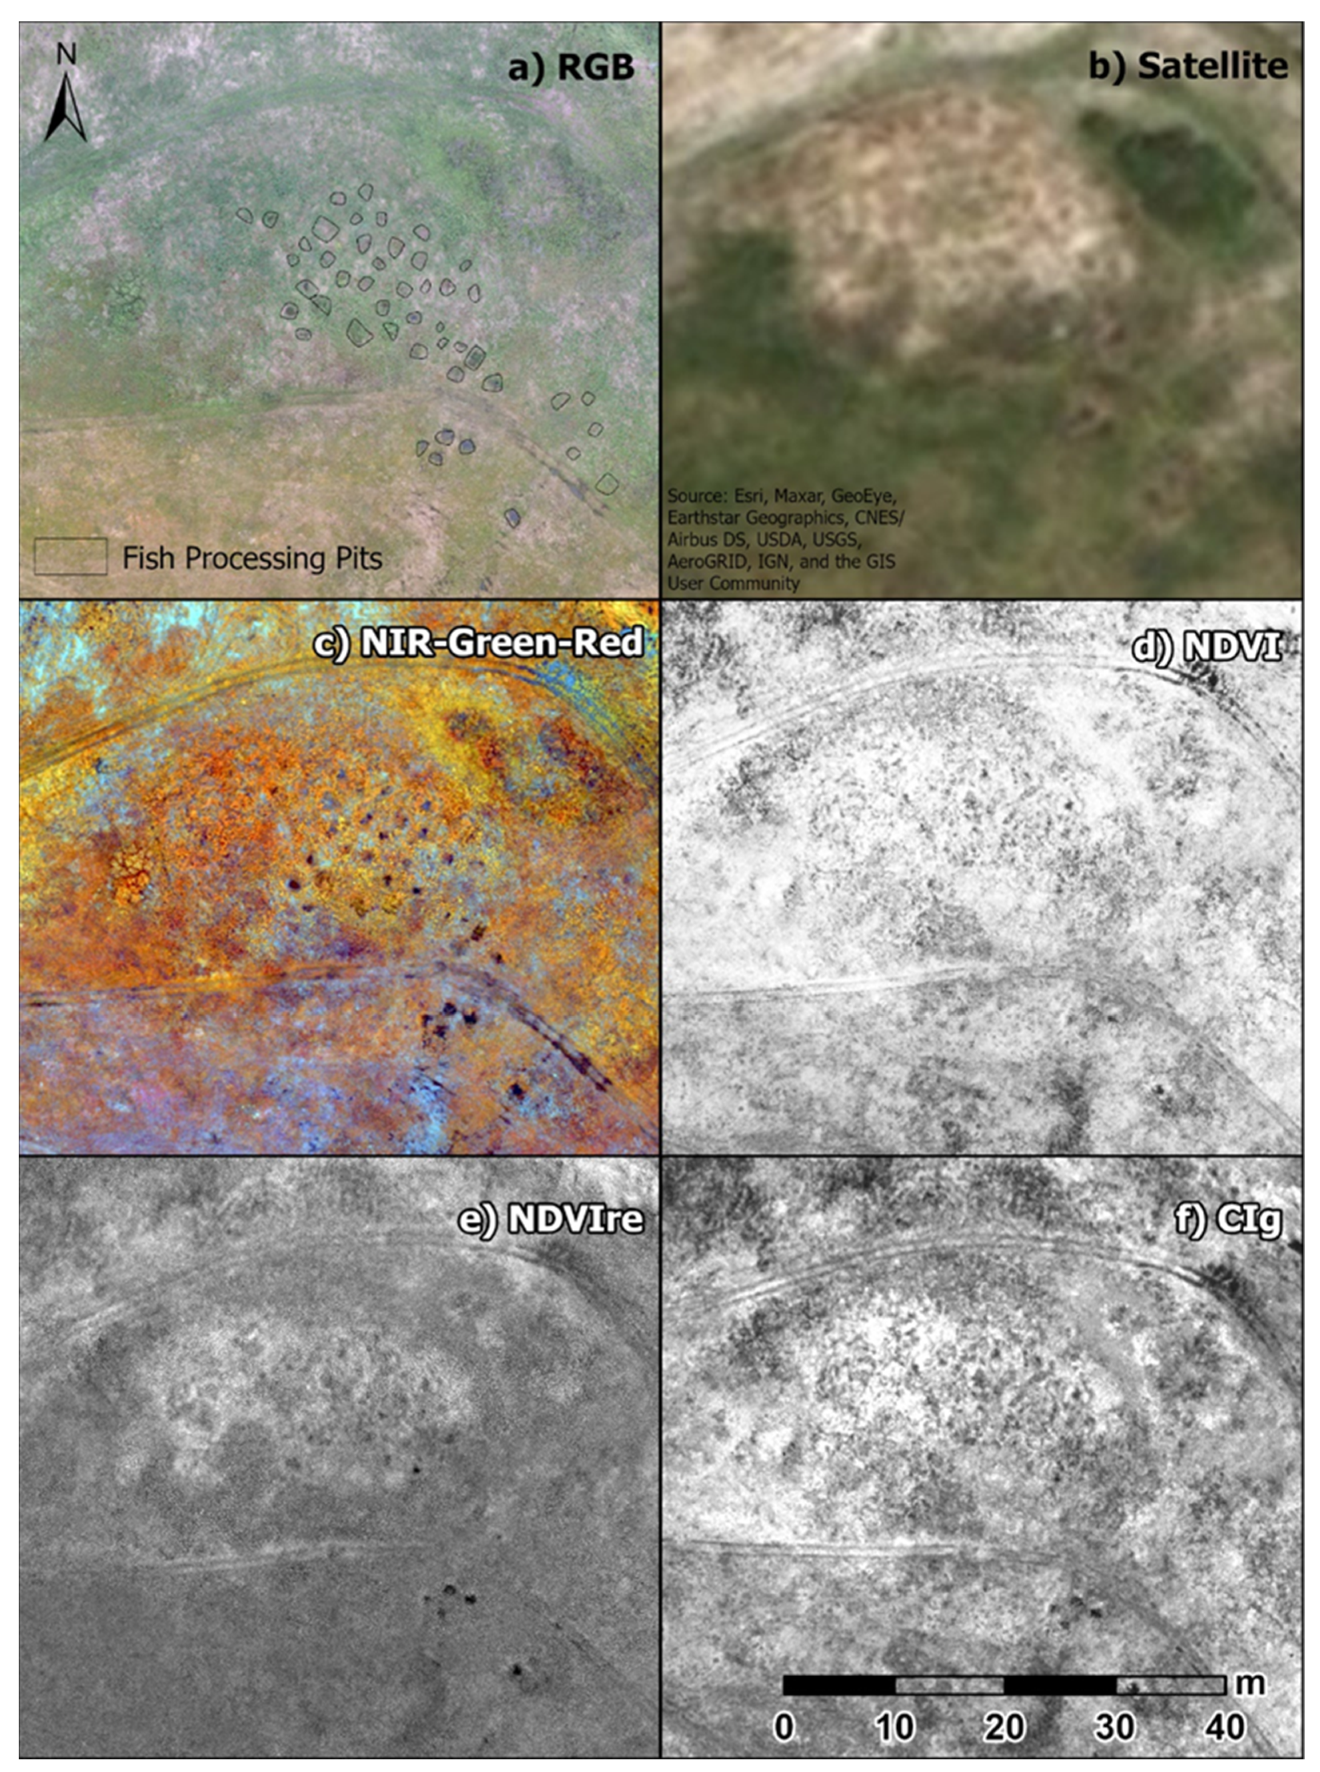
| Agaligamiut (GDN-010) | A historic Yup’ik settlement that was abandoned in the early 20th century. The site of the settlement is recorded in oral histories and a 1956 USGS map. No evidence of habitation structures is visible to investigators doing ground surveys. However, a cluster of fish processing pits is present. | Vegetation color differences are present at the location of the former settlement but are only visible through analysis of multispectral satellite imagery [20]. A cluster of probable fish processing pits grows grass of a darker, more green-yellow hue that is much taller than the surrounding grass. |
| Site | Monochrome G.S.D. | RGB G.S.D. | Area Surveyed |
|---|---|---|---|
| Nunalleq | 4.5 cm | 1.3 cm | 33,871.93 m2 |
| Tengluk | 4.4 cm | 1.2 cm | 48,022.77 m2 |
| Uyakmiut | 5.2 cm | 1.7 cm | 37,500.88 m2 |
| Vegetation Class | Description |
|---|---|
| Tall Grass | The site of the Nunalleq excavation trench and spoil heaps, which has not been excavated since 2018, is densely packed with tall tundra grass which is the dominant species present. Occasionally there are isolated pockets of edible plants, notably Ikiitut (wild celery, Angelica lucida), which can be peeled like domesticated celery and is traditionally eaten with seal oil. It also has medicinal properties as a pain relief agent and can be burned to ward off mosquitoes [41]. Rye grass of the genus Lolium was also present, a source of basket-weaving material for past and present Yupiit. This vegetation pattern is normally present at the edge of the erosion face of the bank with the beach, extending inland about 1.5–3 m, or along small creeks as they flow into the Bering Sea. However, only at the localized area of the Nunalleq site does the vegetation stretch 20 m inland. |
| Berry | A dense patch of atsalugpiat (salmonberry, Rubus chamaemorus) occurs on a bed of lichen on the top of an unexcavated sod house. Atsalugpiat is the most important subsistence berry for the Yupiit in Alaska, as an ingredient in akutaq (“Eskimo ice-cream”), and the leaves are reported to have healing qualities [41]. They bloom and ripen over a two-week window in late July. Infrequently, small patches of curat (blueberries, Vaccinium uliginosum) were also present. |
| Intermediate | Adjacent to Class 1 is an intermediary area. It is poorly drained but has a rich variety of edible and medicinal floral species, like occasional salmonberries, blackberries, and Ayuq (abrador tea, Rhododendron tomentosum) plants. The word Ayuq is derived from the verb post-base ayu-, which means “to spread”—this refers to its ability to “carry away” illness when consumed as a tea [41]. There is also an abundance of Melquruat (white cottongrass (Eriophorum scheuchzer) and Russet cottongrass (Eriophorum russeolum)) which may be boiled to form a poultice for the treatment of cuts and boils. They are also a traditional indicator species—an abundance of Melquruat can predict an abundance of salmonberry later in the summer. Patches of dried cottongrass throughout this area are signs of communal vole burrow complexes. These are often sources of yet another important subsistence resource, colloquially known as “mouse food”. Voles cache several different edible roots and tubers in their burrows, which are harvested by the Yupiit to supplement their diet. |
| Lichen | The normal inland vegetation for this biome type. It is poorly drained and consists roughly of 60% lichen and 40% grass. |
| Beach | A beach with fine grey-black silty sand. This area is sparsely vegetated with rare, isolated tufts of sedge grass. |
| Index Name | Formula | Description |
|---|---|---|
| Normalized Difference Vegetation Index (NDVI) [42] | The most established vegetation index; it is in use across a variety of disciplines and applications, such as archaeology, ecology, and agriculture. | |
| Red Edge NDVI (NDVIre) [43] | A variation of NDVI that uses the Red Edge band rather than Red for calculating vegetation vigor. It is used in agriculture for estimating crop health during the mid-late stages of its life cycle. | |
| Green Chlorophyll Index (Cig) [44] | An index used in agriculture to estimate chlorophyll content in leaves. |
| Uyakmiut | Class | Points sampled |
| Sod House | 1832 | |
| Pit Cluster | 2680 | |
| Grass | 19,149 | |
| Nunalleq | Tall Grass | 6251 |
| Berry | 1605 | |
| Beach | 5686 | |
| Intermediate | 5358 | |
| Lichen | 24,474 | |
| Tengluk | Site Vegetation | 3257 |
| Terrace Edge Vegetation | 1930 | |
| Lichen and Grass | 27,703 |
| Uyakmiut | Sod House | Pit Cluster | Grass | |||
| Sod House | 707 | 2 | 415 | |||
| Pit Cluster | 74 | 1969 | 314 | |||
| Grass | 1047 | 705 | 18,420 | |||
| Total | 1828 | 2676 | 19,149 | |||
| Balanced Accuracy | 0.68383 | 0.85865 | 0.7865 | |||
| Nunalleq | Tall Grass | Berry | Beach | Inter. | Lichen | |
| Tall Grass | 5288 | 65 | 0 | 231 | 11 | |
| Berry | 4 | 345 | 0 | 18 | 50 | |
| Beach | 0 | 0 | 5681 | 0 | 209 | |
| Intermediate | 955 | 463 | 0 | 3451 | 704 | |
| Lichen | 4 | 722 | 5 | 1645 | 21,500 | |
| Total | 6251 | 1595 | 5686 | 5345 | 22,474 | |
| Balanced Accuracy | 0.9186 | 0.607245 | 0.9966 | 0.79336 | 0.9154 | |
| Tengluk | Site Vegetation | Terrace Edge Vegetation | Lichen and Grass | |||
| Site Vegetation | 2496 | 172 | 14 | |||
| Terrace Edge Vegetation | 371 | 1309 | 228 | |||
| Lichen and Grass | 379 | 448 | 27,461 | |||
| Total | 3246 | 1929 | 27,703 | |||
| Balanced Accuracy | 0.97516 | 0.97998 | 0.9157 |
| Pairwise Comparisons of Vegetation Classes (Independent-Samples Kruskal-Wallis Test) across Vegetation Indices Tested | ||||||||||||||||
|---|---|---|---|---|---|---|---|---|---|---|---|---|---|---|---|---|
| NDVI | NDVIre | Cig | ||||||||||||||
| Sample 1–Sample 2 | Test Statistic | Std. Error | Std. Test Statistic | Sig. | Adj. Sig. a | Test Statistic | Std. Error | Std. Test Statistic | Sig. | Adj. Sig. a | Test Statistic | Std. Error | Std. Test Statistic | Sig. | Adj. Sig. a | |
| Nunalleq | Beach-Lichen | −14,698.572 | 177.302 | −82.901 | 0.000 | 0.000 | −13,360.581 | 177.302 | −75.355 | 0.000 | 0.000 | −15,002.918 | 177.285 | −84.626 | 0.000 | 0.000 |
| Beach-Berry | −23,974.871 | 338.418 | −70.844 | 0.000 | 0.000 | −15,431.148 | 338.418 | −45.598 | 0.000 | 0.000 | −19,920.298 | 338.385 | −58.869 | 0.000 | 0.000 | |
| Beach-Intermediate | −27,708.238 | 227.548 | −121.769 | 0.000 | 0.000 | −22,582.510 | 227.548 | −99.243 | 0.000 | 0.000 | −28,239.235 | 227.525 | −124.115 | 0.000 | 0.000 | |
| Beach-Tall Grass | −35,127.543 | 218.883 | −160.486 | 0.000 | 0.000 | −32,534.868 | 218.883 | −148.641 | 0.000 | 0.000 | −34,849.524 | 218.861 | −159.231 | 0.000 | 0.000 | |
| Lichen-Berry | 9276.298 | 309.493 | 29.973 | 0.000 | 0.000 | 2070.567 | 309.493 | 6.690 | 0.000 | 0.000 | 4917.381 | 309.462 | 15.890 | 0.000 | 0.000 | |
| Lichen-Intermediate | 13,009.665 | 181.760 | 71.576 | 0.000 | 0.000 | 9221.929 | 181.760 | 50.737 | 0.000 | 0.000 | 13,236.317 | 181.742 | 72.830 | 0.000 | 0.000 | |
| Lichen-Tall Grass | −20,428.971 | 170.788 | −119.616 | 0.000 | 0.000 | −19,174.287 | 170.788 | −112.270 | 0.000 | 0.000 | −19,846.606 | 170.771 | −116.218 | 0.000 | 0.000 | |
| Berry-Intermediate | −3733.367 | 340.775 | −10.956 | 0.000 | 0.000 | −7151.362 | 340.775 | −20.986 | 0.000 | 0.000 | −8318.937 | 340.741 | −24.414 | 0.000 | 0.000 | |
| Berry-Tall Grass | −11,152.672 | 335.051 | −33.286 | 0.000 | 0.000 | −17,103.720 | 335.051 | −51.048 | 0.000 | 0.000 | −14,929.226 | 335.018 | −44.562 | 0.000 | 0.000 | |
| Intermediate-Tall Grass | −7419.305 | 222.509 | −33.344 | 0.000 | 0.000 | −9952.358 | 222.509 | −44.728 | 0.000 | 0.000 | −6610.289 | 222.487 | −29.711 | 0.000 | 0.000 | |
| Tengluk | Lichen and Grass-Terrace Edge Vegetation | 15,427.289 | 223.579 | 69.002 | 0.000 | 0.000 | 7319.127 | 223.579 | 32.736 | 0.000 | 0.000 | 11,861.347 | 223.579 | 53.052 | 0.000 | 0.000 |
| Lichen and Grass-Site Vegetation | 15,454.333 | 176.143 | 87.737 | 0.000 | 0.000 | 13,865.990 | 176.143 | 78.720 | 0.000 | 0.000 | 14,137.207 | 176.143 | 80.260 | 0.000 | 0.000 | |
| Terrace Edge Vegetation-Site Vegetation | 27.044 | 272.957 | 0.099 | 0.921 | 1.000 | 6546.863 | 272.957 | 23.985 | 0.000 | 0.000 | 2275.860 | 272.957 | 8.338 | 0.000 | 0.000 | |
| Uyak | Pit Cluster-Grass | 201.584 | 183.657 | 1.098 | 0.272 | 1.000 | 6355.833 | 183.657 | 34.607 | 0.000 | 0.000 | −7891.004 | 183.657 | −42.966 | 0.000 | 0.000 |
| Pit Cluster-Sod House | −10,481.136 | 195.932 | −53.494 | 0.000 | 0.000 | −16,015.039 | 195.932 | −81.738 | 0.000 | 0.000 | −2360.870 | 195.932 | −12.049 | 0.000 | 0.000 | |
| Grass-Sod House | −10,279.551 | 113.749 | −90.370 | 0.000 | 0.000 | −9659.206 | 113.749 | −84.917 | 0.000 | 0.000 | −10,251.875 | 113.749 | −90.127 | 0.000 | 0.000 | |
| Biome | Best Vegetation Index for Visual Inspection | Best Vegetation Index for Spectral Analysis | Best Composite Raster Combination for Spectral Analysis |
|---|---|---|---|
| 1a | NDVIre | NDVIre | Red-RE-NIR |
| 1b | Cig | Cig | Red-RE-NIR |
| 2 | Cig | NDVIre | Green-Red-NIR |
Publisher’s Note: MDPI stays neutral with regard to jurisdictional claims in published maps and institutional affiliations. |
© 2022 by the authors. Licensee MDPI, Basel, Switzerland. This article is an open access article distributed under the terms and conditions of the Creative Commons Attribution (CC BY) license (https://creativecommons.org/licenses/by/4.0/).
Share and Cite
Lim, J.S.; Gleason, S.; Williams, M.; Linares Matás, G.J.; Marsden, D.; Jones, W. UAV-Based Remote Sensing for Managing Alaskan Native Heritage Landscapes in the Yukon-Kuskokwim Delta. Remote Sens. 2022, 14, 728. https://doi.org/10.3390/rs14030728
Lim JS, Gleason S, Williams M, Linares Matás GJ, Marsden D, Jones W. UAV-Based Remote Sensing for Managing Alaskan Native Heritage Landscapes in the Yukon-Kuskokwim Delta. Remote Sensing. 2022; 14(3):728. https://doi.org/10.3390/rs14030728
Chicago/Turabian StyleLim, Jonathan S., Sean Gleason, Meta Williams, Gonzalo J. Linares Matás, Daniel Marsden, and Warren Jones. 2022. "UAV-Based Remote Sensing for Managing Alaskan Native Heritage Landscapes in the Yukon-Kuskokwim Delta" Remote Sensing 14, no. 3: 728. https://doi.org/10.3390/rs14030728