
Fractional Fourier Transform-Based Tensor RX for Hyperspectral Anomaly Detection

1
College of Mechanical and Electrical Engineering, Daqing Normal University, Daqing 163712, China
2
School of Computer Science and Technology, Heilongjiang University, Harbin 150080, China
*
Author to whom correspondence should be addressed.
Remote Sens. 2022, 14(3), 797; https://doi.org/10.3390/rs14030797
Submission received: 30 December 2021
/
Revised: 3 February 2022
/
Accepted: 4 February 2022
/
Published: 8 February 2022
Abstract
:Anomaly targets in a hyperspectral image (HSI) are often multi-pixel, rather than single-pixel, objects. Therefore, algorithms using a test point vector may ignore the spatial characteristics of the test point. In addition, hyperspectral anomaly detection (AD) algorithms usually use original spectral signatures. In a fractional Fourier transform (FrFT), the signals in the fractional Fourier domain (FrFD) possess complementary characteristics of both the original reflectance spectrum and its Fourier transform. In this paper, a tensor RX (TRX) algorithm based on FrFT (FrFT-TRX) is proposed for hyperspectral AD. First, the fractional order of FrFT is selected by fractional Fourier entropy (FrFE) maximization. Then, the HSI is transformed into the FrFD by FrFT. Next, TRX is employed in the FrFD. Finally, according to the optimal spatial dimensions of the target and background tensors, the optimal AD result is achieved by adjusting the fractional order. TRX employs a test point tensor, making better use of the spatial characteristics of the test point. TRX in the FrFD exploits the complementary advantages of the intermediate domain to increase discrimination between the target and background. Six existing algorithms are used for comparison in order to verify the AD performance of the proposed FrFT-TRX over five real HSIs. The experimental results demonstrate the superiority of the proposed algorithm.
1. Introduction
A hyperspectral image (HSI) can be regarded as a 3D cube with two spatial dimensions and one spectral dimension. The spectral dimension comprises hundreds of contiguous spectral bands, and HSIs contain rich spectral information. Due to the characteristics of HSIs, they have increasingly been used for various applications, such as scene classification, spectral unmixing, target detection [1,2,3], and so on. In all of these applications, anomaly detection (AD), as a kind of target detection, does not require a priori information. As such, it can be used in a wide range of military and civil applications [4,5,6].
Many algorithms have been proposed for hyperspectral AD over the past two decades. One class of algorithms does not need to assume the distribution of the background data, including algorithms based on sparse representations. Background joint sparse representation (BJSR) [7] is an adaptive detector based on sparse representation that can automatically handle complicated background classes. The collaborative representation detector (CRD) [8] is based on the concept that background pixel points can be approximately represented by their spatial neighborhoods, while anomaly points cannot. Other AD algorithms based on sparse representations have been detailed in [9,10,11,12]. Another class of AD algorithms relies on particular statistical assumptions; these are considered traditional methods. A famous statistical model-based algorithm is the Reed–Xiaoli (RX) detector [13,14], which is based on and evolved from the principle of the generalized likelihood ratio test (GLRT). The RX detector assumes that each pixel follows a Gaussian distribution, and the target is determined by measuring the Mahalanobis distance between the test point and the background. Global RX (GRX) and local RX (LRX) are two versions of the RX detector [15,16], both of which estimate background statistics (i.e., mean and covariance matrices). In the GRX, the whole image is used for background statistics. In the LRX, sliding dual windows are used to obtain local background statistics. For the GRX or LRX, the detection performance depends on the estimation of the covariance matrix, and the computational complexity is usually high. To overcome this problem, Fowler and Du have proposed dimensionality reduction-based RX through random projections [17]. In the random projection domain, the Mahalanobis distance can also be used to effectively calculate the AD result, which is similar to the result in the original domain. In GRX and LRX, the detection result is calculated based on the test point vector; however, anomaly targets are usually multi-pixel objects, and using only the test point vector may reduce the detection accuracy. In [18], two adaptive detectors—one-step GLRT (1S-GLRT) and two-step GLRT (2S-GLRT)—have been proposed, based on the GLRT design criterion and its modified version. These two detectors can detect a multi-pixel anomaly target, without prior knowledge of a pattern, in the presence of Gaussian noise. In addition, hyperspectral data can be regarded as a 3D tensor. Similar to algorithms using low-rank sparse decomposition (e.g., LRaSMD) [19,20], some models based on tensors [21,22] use tensor decomposition to remove redundant information. The test point vector and its neighborhood vectors can form a test tensor block centered at the test point. Other tensor-based algorithms consider the spatial–spectral characteristics of HSIs simultaneously, which can reduce the false alarm rate. A tensor-based adaptive sub-space detector (TBASD), a tensor version of BJSR, has been developed based on the test tensor block. It explores spatial–spectral characteristics without breaking the spatial–spectral structure [23]. However, the computational complexity of algorithms based on tensors is relatively high. With the recent progress in deep learning (DL) theory, numerous feature extraction algorithms based on DL for HSI processing have been proposed [24,25,26,27]. Algorithms based on convolutional neural networks (CNNs) consider the spatial–spectral characteristics and, thus, generate effective models.
The above AD algorithms mainly operate in the original spectral domain. AD methods based on the transform domain comprise another research direction. Kernel Reed–Xiaoli (KRX) [28] is a classical transform domain method. It expands a linear non-Gaussian model in the low-dimensional original data space to a non-linear Gaussian domain in the higher-dimensional feature space. In addition, the fractional Fourier entropy (FrFE)-based RX (FrFE-RX) [29] algorithm processes signals in the fractional Fourier domain (FrFD). In the FrFD, which lies between the original reflectance spectrum and its Fourier transform, the data have complementary strengths through the use of space–frequency representations, and discrimination between anomalies and the background can be enhanced [29,30,31], thus improving the AD performance. An algorithm using a fractional Fourier transform (FrFT) and transferred CNN based on a tensor (FrFTTCNNT) [32] has been proposed for hyperspectral AD, which considers the spatial–spectral characteristics in the FrFD. However, the number of parameters to be adjusted in FrFTTCNNT is relatively large and the computational complexity is relatively high. In addition, the higher-dimensional dataset in FrFTTCNNT is dimensionally reduced before FrFT, which removes the redundancy of spectral bands but also results in the loss of information.
In this paper, the fractional Fourier transform-based tensor RX (FrFT-TRX) algorithm is proposed for hyperspectral AD. First, the original HSI is transformed into the FrFD by FrFT with FrFE maximization. Then, in the FrFD, TRX is used to detect anomaly targets. Finally, the optimal AD result is achieved by adjusting the spatial sizes of the target and background, as well as the fractional order of FrFT.
In summary, the main contributions of this paper can be summarized as follows:
- Through improved mining of the spatial characteristics of HSI, tensor RX (TRX)—an improved version of LRX—is proposed. TRX uses the test point tensor, instead of the test point vector.
- The proposed TRX is combined with FrFT, which can handle non-stationary noise better than the traditional Fourier transform (FT). In the FrFD, discrimination between anomalies and the background is enhanced.
- The optimal fractional order, p, of FrFT in the proposed FrFT-TRX does not correspond to FrFE maximization but is obtained by reverse adjustment. That is, p is first selected by FrFE maximization and TRX is employed in the FrFD. According to the optimal spatial dimensions of the target and background tensors, the optimal AD result is achieved by adjusting the p value, such that the optimal p is obtained.
2. Proposed Method
2.1. Fractional Fourier Transform for HSI
The FrFT transforms a signal into an intermediate domain [29]. For a hyperspectral dataset , where is the test point vector, and N and D stand for the number of sample points and spectral bands, respectively, this process can be formulated as follows:
where u and s are both indices, p is the fractional order of FrFT, and is represented as follows:
where n is an integer,
is the rotation angle, and is as follows:
In FrFT, equals when and equals the traditional FT of when . In most cases, as the value of p ranges between 0 and 1, contains information on both the reflectance spectrum and its Fourier domain. In [29], the optimal value of p was obtained by calculating FrFE, and the FrFE-RX algorithm obtained the optimal AD results. The influence of different values of p on the AD results of the proposed FrFT-TRX algorithm is discussed in the experimental section of this paper.
2.2. Tensor RX for HSI
Each test point vector and its neighborhood form a tensor block for a hyperspectral dataset. The test tensor , where is the window size of the test tensor and D is the number of spectral bands, can be expressed as
where is a matrix of the corresponding abundance coefficients, is the tensor of the anomaly target, and is the corresponding noise tensor, which can be regarded as being composed of noise vectors. The noise vector satisfies , , where R is an unknown covariance matrix, and .
For the homogeneous background tensor —centered at the test point vector, no anomaly exists. is assumed to be available; that is,
where is the background noise tensor. The noise vectors in are assumed to be independent and identically distributed (IID).
Equations (6) and (7) show the binary hypothesis test in tensor form.
As the noise vectors are IID, the joint probability density functions (PDFs) of and under and can be expressed as follows:
where and are:
As the and are unknown, an adaptive detector based on the generalized likelihood ratio test (GLRT) is employed and each unknown parameter is replaced by its maximum likelihood (ML) estimate [18].
Similar to the two-step GLRT in [18], the covariance matrix R is first assumed to be known and the GLRT detector based on the tensor can be written as follows:
where is the AD threshold, and and represent the PDFs of under and , respectively. Due to the independence of the vectors in , can be written as:
where
Furthermore, can be written as
The maximization of , with respect to , can be achieved at
where the corresponding maximum of is
Substituting Equations (15) and (17) into Equation (12) yields
where is the AD threshold. According to the Rayleigh–Ritz theorem [18,33], the following expression can be obtained:
Then, we replace R with
to obtain
This detector is a special case of 2S-GLRT [18] and can be regarded as a tensor RX (TRX) detector. In the TRX, the spatial sizes of the target and background are assumed to be rectangular.
2.3. FrFT-TRX for HSI
As shown in Figure 1, the proposed FrFT-TRX is based on FrFT and TRX. First, the fractional order of FrFT, p, is selected by FrFE maximization. Then, the test HSI is transformed into the FrFD by FrFT. Next, TRX is employed for hyperspectral AD in the FrFD. Finally, according to the optimal spatial dimensions of target and background tensors, the optimal AD result is achieved by adjusting the value of p. The detailed procedure of the proposed FrFT-TRX algorithm is shown in Algorithm 1.
| Algorithm 1: Proposed FrFT-TRX method. |
Input: HSI , fractional order of FrFT p, test tensor , and background tensor
|
3. Experimental Results
3.1. Datasets
Five real HSIs were used to evaluate the AD performance of the proposed FrFT-TRX algorithm. Figures 2a, 5a, 8a, 11a, and 14a show the 100th bands of the five experimental HSIs, while Figures 2b, 5b, 8b, 11b, and 14b show the corresponding ground-truth maps.
Table 1 lists some features of the five experimental HSIs. Data L, C, P, and T are from the ABU dataset (http://xudongkang.weebly.com/ accessed on 25 December 2021). Data S are part of the San Diego airport area data, which were captured over CA, USA and include 224 spectral bands from 370 nm to 2510 nm. After removing the noisy bands, 126 bands were used for the experiment. Data L, C, T, and S were captured by an airborne visible/infrared imaging spectrometer (AVIRIS), while Data P were captured by a reflective optics system imaging spectrometer (ROSIS-03) sensor.
3.2. Experiment
Six existing algorithms were used for comparison, in order to verify the effectiveness of the proposed FrFT-TRX algorithm: GRX and LRX, the benchmark AD algorithms; KRX, a classical transform domain method; FrFE-RX, a new RX algorithm in the FrFD; FrFE-LRX, the local algorithm version of FrFE-RX; and TRX, which is based on dimensionality reduction by principal component analysis (PCA-TRX). Two-dimensional diagrams of the detection results were used for subjective evaluation. The receiver operating characteristic (ROC) curve, area under the ROC curve (AUC), and separability graph were used for objective evaluation.
For fairness of comparison, the parameters of the comparison algorithms were set to the optimal values within a certain range. In our experiments, all windows were rectangular and the side length size is used to represent the window size. For GRX, there were no parameters that needed to be debugged. For LRX, the dual-window sizes (Win, Wout) were parameters that needed to be debugged. For KRX, kernel parameter c and the dual-window sizes (Win, Wout) have a great influence on the AD results. For FrFE-RX, the fractional order p was set based on FrFE. For FrFE-LRX, p was also based on FrFE and (Win, Wout) needed to be debugged. For PCA-TRX, the number of dimensions d after PCA and the spatial sizes (Wt, Wb) of the target and background tensor have important influences on the AD results. For FrFT-TRX, the fractional order p and the spatial sizes (Wt, Wb) of the target and background tensor all needed to be debugged. Table 2 shows the parameter settings for LRX, GRX, FrFE-RX, FrFE-LRX, PCA-TRX, and FrFT-TRX, with respect to the five experimental HSIs.
For data L, as shown in Figure 2, the AD results of the proposed FrFT-TRX algorithm were obviously better than those obtained by the comparison algorithms. The ROC curves and the corresponding AUC values are shown in Figure 3. Among the seven tested algorithms, the proposed FrFT-TRX algorithm had the best ROC curve and the largest AUC value. Figure 4 shows the separability graphs for data L, where the boxes in the separability graph indicate pixels without the highest and lowest 10% of the data in each category, and the maximum and minimum values are shown in the top and bottom rows, respectively. For data L, as shown in Figure 4, FrFT-TRX could better separate the target from the background than the six comparison algorithms, and its ability to compress the background was better than that of GRX, KRX, and FrFE-RX.
For data C, as shown in Figure 5i, the anomaly target detection performance of the proposed FrFT-TRX was the most obvious, compared to that of the other test algorithms. The ROC curves and the corresponding AUC values are shown in Figure 6. Among the seven tested algorithms, PCA-TRX and the proposed FrFT-TRX had the best ROC curves and largest AUC values. Figure 7 shows the separability graphs for data C. FrFT-TRX could better separate the target from the background, compared to the six existing algorithms, and its strength at compressing the background was also the best.
For data P, as shown in Figure 8g, the anomaly targets were more obvious in the results of the proposed algorithm than in those of the six comparison algorithms. The ROC curves and the corresponding AUC values are shown in Figure 9. Among all seven tested algorithms, the proposed FrFT-TRX algorithm had the best ROC curve and the largest AUC value. Figure 10 shows the separability graphs for data P. Among the seven test algorithms, FrFT-TRX could better separate the target from the background than GRX, KRX, FrFE-RX, and FrFE-LRX, and its strength in compressing the background was better than that of LRX. The ability to distinguish between the target and background, as well as the background compression ability, of the proposed FrFT-TRX algorithm were similar to those of the PCA-TRX algorithm.
For data T, the anomaly targets in Figure 11i are more apparent than those in Figure 11d,e,g,h. In addition, the anomaly targets in Figure 11c,f are very obvious, but some background points are also prominent, thereby increasing the false alarm rate. The ROC curves and the corresponding AUC values are shown in Figure 12. Among all seven tested algorithms, the proposed FrFT-TRX algorithm had the best ROC curve and the largest AUC value. Figure 13 shows the separability graphs for data T. The ability of FrFT-TRX to distinguish the background from the target was not as good as that of GRX and FrFE-RX, but its background compression ability was better than those algorithms. FrFT-TRX could also effectively distinguish the background from the target.
For data S, as shown in Figure 14i, the anomaly targets in the results of the proposed FrFT-TRX are more apparent than those in Figure 14c,d,f,g. In addition, the anomaly targets in Figure 14e,h are very obvious, but some background points are also prominent, thus increasing the false alarm rate. The ROC curves and the corresponding AUC values are shown in Figure 15. Among all seven tested algorithms, the proposed FrFT-TRX algorithm had the best ROC curve and the largest AUC value. Figure 16 shows the separability graphs for data S. The ability of FrFT-TRX to distinguish the background from targets was better than that of GRX, LRX, KRX, FrFE-RX, and FrFE-LRX, but not better than PCA-TRX; however, FrFT-TRX could better compress the background than PCA-TRX.
From the above detection results, we can see that the AD performance of the proposed FrFT-TRX algorithm was better than that of the six comparison algorithms. In FrFT-TRX, data processing is carried out in the FrFD, such that the inherent non-stationary noise in the HSI can be handled better and discrimination between the background and targets is enhanced. In addition, tensor RX makes use of the spatial–spectral characteristics of the HSI.
To evaluate the computational complexity of the proposed FrFT-TRX algorithm, we recorded the time taken by the test algorithms over the five experimental HSIs, as listed in Table 3. All experiments were conducted on a laptop with an Intel Core i7 CPU (central processing unit) and 16 GB of RAM (random-access memory). The algorithms were implemented using the MATLAB R2018b software. The time required was related to the selection of parameters, such as the window size. The time taken by the proposed FrFT-TRX can be considered acceptable.
3.3. Parameter Analysis
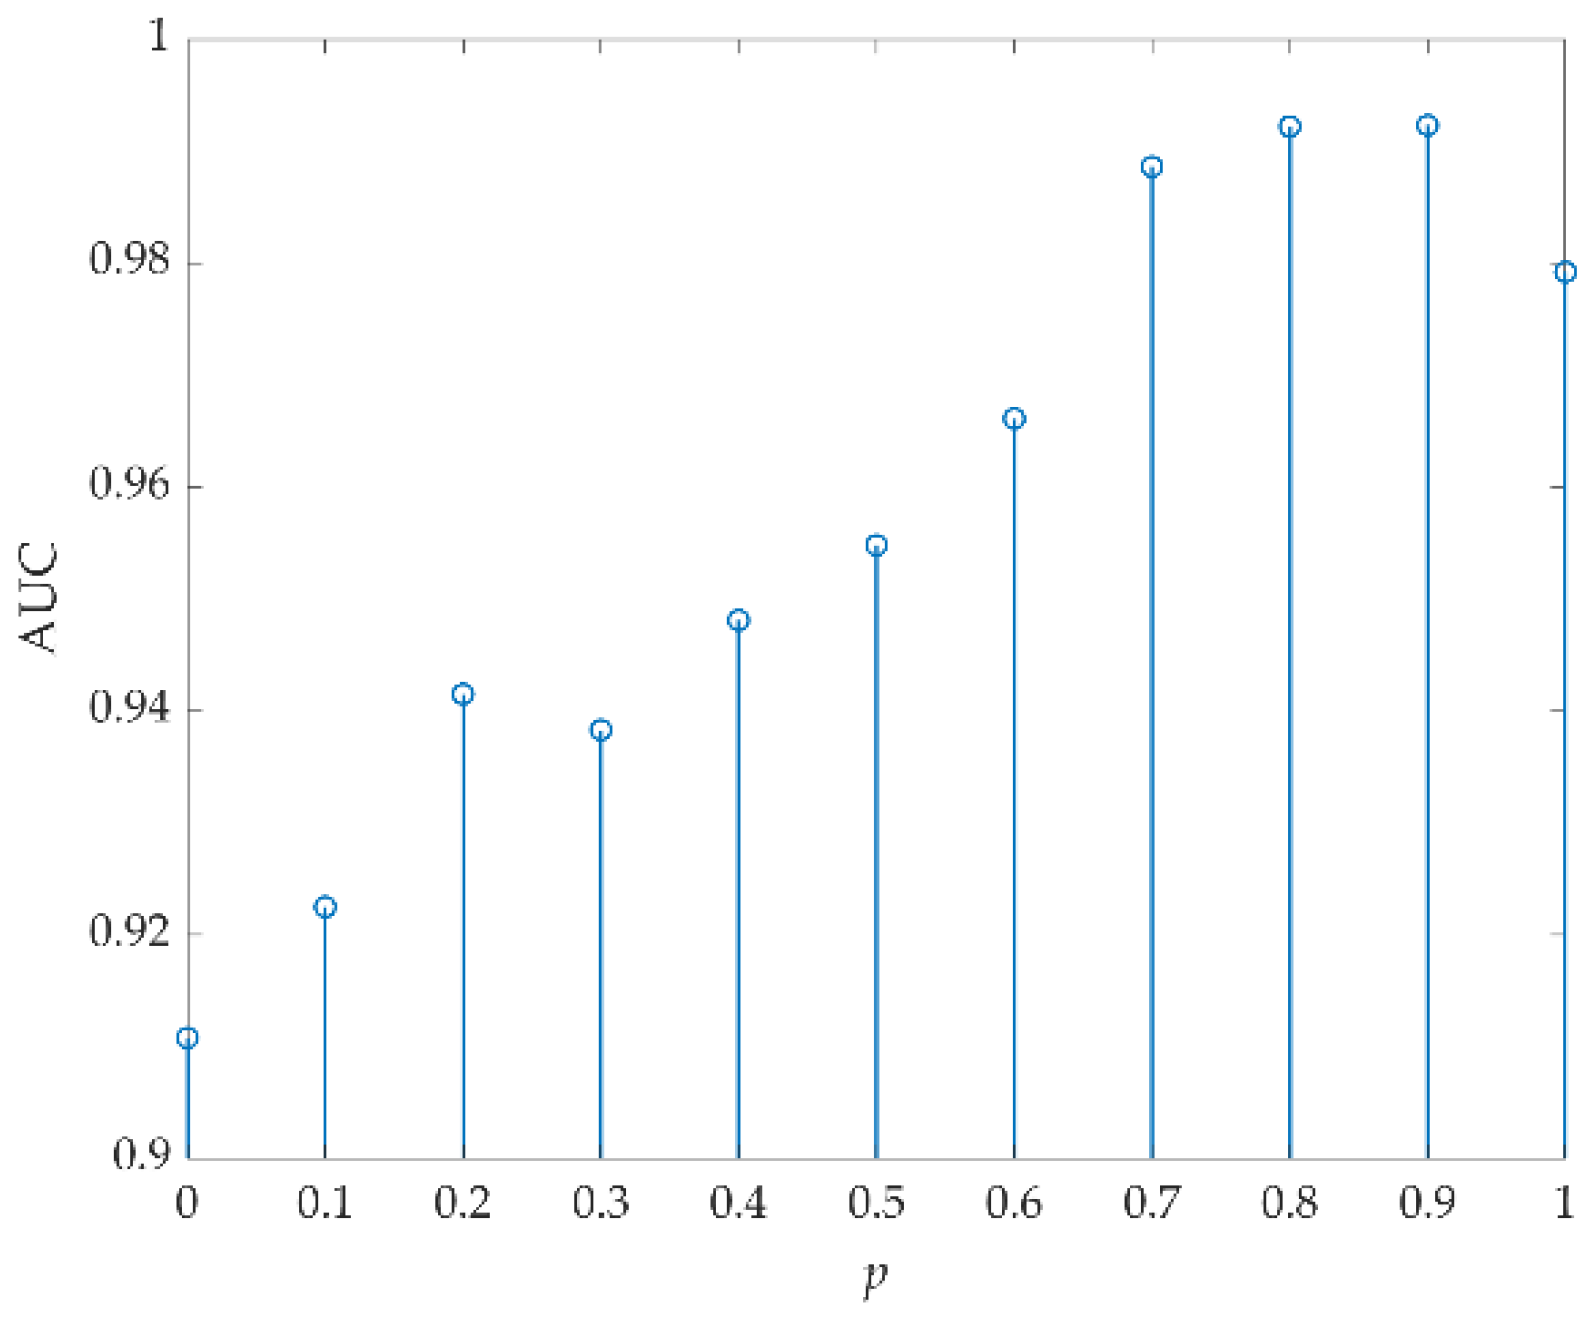
For the proposed FrFT-TRX, three parameters—the fractional order p and the spatial sizes (Wt, Wb) of the target and background tensors—have a significant influence on the detection results. For data L, p was first selected by FrFE maximization [29], where p = 0.2. The AUC values versus (Wt, Wb) are listed in Table 4, and the optimal value was 0.9493 when (Wt, Wb) were set to (9, 11). Then, (Wt, Wb) were set to (7, 9) and Figure 17 shows the AUC values versus p. The optimal AUC value was 0.9529 and the corresponding optimal p was 1.
For data C, p was first selected by FrFE maximization, where p = 1. The AUC values versus (Wt, Wb) are listed in Table 5, and the optimal value was 0.9997 when (Wt, Wb) were set to (3, 23). Then, (Wt, Wb) were set to (3, 23) and Figure 18 shows the AUC values versus p. The optimal AUC value was 0.9998 and the corresponding optimal p was 0.7 or 0.8.
For data P, p was first selected by FrFE maximization, where p = 1. The AUC values versus (Wt, Wb) are listed in Table 6, and the optimal value was 0.9960 when (Wt, Wb) were set to (3, 37). Then, (Wt, Wb) were set to (3, 37) and Figure 19 shows the AUC values versus p. The optimal AUC value was 0.9960 and the corresponding optimal p was 1.
For data T, p was first selected by FrFE maximization, where p = 1. The AUC values versus (Wt, Wb) are listed in Table 7, and the optimal value was 0.9935 when (Wt, Wb) were set to (7, 9). Then, (Wt, Wb) were set to (7, 9) and Figure 20 shows the AUC values versus p. The optimal AUC value was 0.9945 and the corresponding optimal p was 0.6.
For data S, p was first selected by FrFE maximization, where p = 0.9. The AUC values versus (Wt, Wb) are listed in Table 8, and the optimal value was 0.9923 when (Wt, Wb) were set to (3, 31). Then, (Wt, Wb) were set to (3, 31) and Figure 21 shows the AUC values versus p. The optimal AUC value was 0.9923 and the corresponding optimal p was 0.9.
In FrFE-RX, the optimal p was selected by FrFE maximization. As can be seen from the above analysis, the optimal p value of the proposed FrFT-TRX algorithm was not necessarily the p value corresponding to FrFE maximization. For data L, the p corresponding to FrFE maximization was 0.2, but the optimal p of the proposed FrFT-TRX was 1. For data C, the p corresponding to FrFE maximization was 1, but the optimal p of the proposed FrFT-TRX was 0.7 or 0.8. For data T, the p corresponding to FrFE maximization was 1, but the optimal p of the proposed FrFT-TRX was 0.6. This was because FrFE maximization uses the spectral information of HSI, while FrFT-TRX is based on the test point tensor, which considers the spatial–spectral information of the HSI.
4. Discussion
Anomaly targets in HSIs are usually small targets with low probability and are often multi-pixel, rather than single-pixel, objects. Existing RX-based algorithms mainly use a test point vector. To better mine the spatial characteristics of anomaly targets, an RX algorithm based on a test point tensor is proposed in this paper. In LRX, the size of the dual windows has a significant impact on the detection performance. Similarly, in TRX, the spatial dimensions of the test point tensors and background tensors are key parameters affecting the results. In this paper, TRX is used in the FrFD, such that the influence of the transformation domain is considered in the setting of the spatial dimensions of the test point tensors and background tensors. In FrFE-RX, the optimal fractional order of FrFT is selected by FrFE maximization. In the proposed FrFT-TRX, the fractional order of FrFT is first chosen by FrFE maximization and the test HSI is transformed into the FrFD by FrFT. Then, the TRX is employed for hyperspectral AD in the FrFD. Finally, according to the optimal spatial dimensions of the target and background tensors, the optimal AD result is achieved by adjusting the value of the fractional order.
As detailed in Section 3.3, for data L, the fractional order of FrFT selected by FrFE maximization was 0.2, but the optimal fractional order of FrFT for FrFT-TRX was 1 (see Figure 17). For data C, the fractional order of FrFT selected by FrFE maximization was 1, while the optimal fractional order of FrFT for FrFT-TRX was 0.7 or 0.8 (see Figure 18). For data T, the fractional order of FrFT selected by FrFE maximization was 1, but the optimal fractional order of FrFT for FrFT-TRX was 0.6 (see Figure 20). In FrFT-TRX, the AD results are influenced by the fractional order of FrFT and the spatial dimensions of the test point tensors and background tensors, such that the optimal fractional order cannot be selected by FrFE maximization. This is because FrFT is based on a test point vector and mainly uses spectral information, while TRX in the FrFD is based on a test point tensor. In addition to spectral information, it also uses spatial information, which restricts the selection of the optimal fractional order. In this paper, the optimal values of the above three parameters were determined experimentally. It can be seen, from the experimental results, that for data P and S, the optimal value of p was equal to that selected by FrFE maximization. The corresponding optimal (Wt, Wb) results for data P and S were (3, 37) and (3, 31), and Wt was a proximity vector relative to Wb. This is why the optimal value of p was not affected by the spatial dimensions of test point tensor Wt and was equal to the value selected by FrFE maximization.
To solve the problems discussed above, future work will be divided into two lines: First, a tensor-based FrFT transformation method must be designed, in order to better maintain the spatial characteristics in the transformation process. Second, determining how to adaptively select the optimal parameters will be key to improving the algorithm.
5. Conclusions
Anomaly targets are usually multi-pixel objects, and algorithms based on test point vectors hinder accurate anomaly detection. Data in the FrFD have complementary strengths, when compared to the original reflectance spectrum and its Fourier transform, such that discrimination between anomalies and the background can be enhanced. In this paper, tensor RX based on FrFT was proposed for hyperspectral AD. First, the original HSI was transformed into the FrFD by FrFT with FrFE maximization. In the FrFD, the complementary advantages of the intermediate domain were exploited in the data, which increased the discrimination between the target and background and improved the AD performance. Then, in the FrFD, TRX was used to detect anomaly targets. TRX employed a test point tensor and made better use of the spatial characteristics of the test point. Finally, the optimal AD result was achieved by adjusting the spatial sizes of the target and background as well as the fractional order of FrFT. The order was first selected by FrFE maximization, and its optimal value was inversely adjusted using the optimal values for the spatial dimensions of the test point and background tensors. FrFT was based on a test point vector and mainly used spectral information, while TRX in the FrFD was based on a test point tensor. The AD results were influenced not only by the fractional order of FrFT but also by the spatial dimensions of the test point and background tensors, such that the optimal fractional order could not be selected by FrFE maximization. The experimental results on five real HSIs indicated that the proposed FrFT-TRX algorithm was generally superior to the six algorithms of the same type considered in the comparison.
FrFT is based on a test point vector and mainly uses spectral information, while TRX in the FrFD is based on a test point tensor and makes use of the spatial–spectral characteristics of HSIs. To improve the proposed algorithm, we must determine how to preserve the spatial characteristics of HSIs in the process of FrFT. In addition, the optimal values of the three parameters in the proposed FrFT-TRX algorithm were determined experimentally in this work and, therefore, the adaptive selection of optimal parameters must be achieved in future work.
Author Contributions
Methodology, L.Z.; software, J.M.; validation, B.C. and F.L.; data curation, B.C.; writing—original draft preparation, L.Z. and J.M.; writing—review and editing, B.C. and F.L.; funding acquisition, L.Z. All authors have read and agreed to the published version of the manuscript.
Funding
This research was funded by the National Natural Science Foundation of China underGrant (61901082), Natural Science Foundation of Heilongjiang Province in China under Grant (LH2019F001).
Conflicts of Interest
The authors declare no conflict of interest.
References
- Plaza, A.; Benediktsson, J.A.; Boardman, J.W.; Brazile, J.; Bruzzone, L.; Camps-Valls, G.; Chanussot, J.; Fauvel, M.; Gamba, P.; Gualtieri, A.; et al. Recent Advances in Techniques for Hyperspectral Image Processing. Remote Sens. Environ. 2009, 113, S110–S122. [Google Scholar] [CrossRef]
- Heylen, R.; Parente, M.; Gader, P. A Review of Nonlinear Hyperspectral Unmixing Methods. IEEE J. Sel. Top. Appl. Earth Observ. Remote Sens. 2014, 7, 1844–1868. [Google Scholar] [CrossRef]
- Kang, X.; Li, S.; Fang, L.; Li, M.; Benediktsson, J.A. Extended Random Walker-based Classification of Hyperspectral Images. IEEE Trans. Geosci. Remote Sens. 2015, 53, 144–153. [Google Scholar] [CrossRef]
- Chang, C.-I.; Chiang, S.-S. Anomaly Detection and Classification for Hyperspectral Imagery. IEEE Trans. Geosci. Remote Sens. 2002, 40, 1314–1325. [Google Scholar] [CrossRef] [Green Version]
- Stein, D.W.J.; Beaven, S.G.; Hoff, L.E.; Winter, E.M.; Schaum, A.P.; Stocker, A.D. Anomaly Detection from Hyperspectral Imagery. IEEE Signal Process. Mag. 2002, 19, 58–69. [Google Scholar] [CrossRef] [Green Version]
- Manolakis, D.; Shaw, G.S. Detection Algorithms for Hyperspectral Imaging Applications. IEEE Signal Process. Mag. 2002, 19, 29–43. [Google Scholar] [CrossRef]
- Li, J.; Zhang, H.; Zhang, L.; Ma, L. Hyperspectral Anomaly Detection by the Use of Background Joint Sparse Representation. IEEE J. Sel. Top. Appl. Earth Obs. Remote Sens. 2015, 8, 2523–2533. [Google Scholar] [CrossRef]
- Li, W.; Du, Q. Collaborative Representation for Hyperspectral Anomaly Detection. IEEE Trans. Geosci. Remote Sens. 2015, 53, 1463–1474. [Google Scholar] [CrossRef]
- Ling, Q.; Guo, Y.; Lin, Z.; An, W. A Constrained Sparse Representation Model for Hyperspectral Anomaly Detection. IEEE Trans. Geosci. Remote Sens. 2019, 57, 2358–2371. [Google Scholar] [CrossRef]
- Yang, X.; Wu, Z.; Li, J.; Plaza, A.; Wei, Z. Anomaly Detection in Hyperspectral Images based on Low-rank and Sparse Representation. IEEE Trans. Geosci. Remote Sens. 2016, 54, 1990–2000. [Google Scholar] [CrossRef]
- Zhu, L.; Wen, G. Hyperspectral Anomaly Detection via Background Estimation and Adaptive Weighted Sparse Representation. Remote Sens. 2018, 10, 272. [Google Scholar] [CrossRef] [Green Version]
- Zhao, R.; Du, B.; Zhang, L. Hyperspectral Anomaly Detection via a Sparsity Score Estimation Framework. IEEE Trans. Geosci. Remote Sens. 2017, 55, 3208–3222. [Google Scholar] [CrossRef]
- Reed, I.S.; Yu, X. Adaptive Multiple-band CFAR Detection of an Optical Pattern with Unknown Spectral Distribution. IEEE Trans. Acoust. Speech Signal Process. 1990, 38, 1760–1770. [Google Scholar] [CrossRef]
- Yu, X.; Reed, I.S.; Stocker, A.D. Comparative Performance Analysis of Adaptive Multispectral Detectors. IEEE Trans. Signal Process. 1993, 41, 2639–2656. [Google Scholar] [CrossRef]
- Borghys, D.; Kåsen, I.; Achard, V.; Perneel, C. Comparative Evaluation of Hyperspectral Anomaly Detectors in Different Types of Background. In Proceedings of the SPIE Defense, Security, and Sensing, Baltimore, MD, USA, 23–27 April 2012; Volume 83902. [Google Scholar]
- Molero, J.M.; Garzon, E.M.; Garcia, I.; Plaza, A. Analysis and Optimizations of Global and Local Versions of the RX Algorithm for Anomaly Detection in Hyperspectral Data. IEEE J. Sel. Top. Appl. Earth Observ. Remote Sens. 2013, 6, 801–814. [Google Scholar] [CrossRef]
- Fowler, J.E.; Du, Q. Anomaly Detection and Reconstruction from Random Projections. IEEE Trans. Image Process. 2012, 21, 184–195. [Google Scholar] [CrossRef] [Green Version]
- Liu, J.; Hou, Z.; Li, W.; Tao, R.; Orlando, D.; Li, H. Multipixel Anomaly Detection with Unknown Patterns for Hyperspectral Imagery. IEEE Trans. Neural Netw. Learn. Syst. 2021. [Google Scholar] [CrossRef]
- Qu, Y.; Guo, R.; Wang, W.; Qi, H.; Ayhan, B.; Kwan, C.; Vance, S. Anomaly Detection in Hyperspectral Images through Spectral Unmixing and Low Rank Decomposition. In Proceedings of the International Geoscience and Remote Sensing Symposium (IGARSS), Beijing, China, 10–15 July 2016. [Google Scholar] [CrossRef]
- Song, S.; Yang, Y.; Zhou, H.; Chan, J. Hyperspectral Anomaly Detection via Graph Dictionary-Based Low Rank Decomposition with Texture Feature Extraction. Remote Sens. 2020, 12, 3966. [Google Scholar] [CrossRef]
- Li, S.; Wang, W.; Qi, H.; Ayhan, B.; Kwan, C.; Vance, S. Low-rank Tensor Decomposition based Anomaly Detection for Hyperspectral Imagery. In Proceedings of the IEEE International Conference on Image Processing, Quebec City, QC, Canada, 27–30 September 2015. INSPEC Accession Number: 15654639. [Google Scholar] [CrossRef]
- Zhang, X.; Wen, G.J.; Dai, W. A Tensor Decomposition-Based Anomaly Detection Algorithm for Hyperspectral Image. IEEE Trans. Geosci. Remote Sens. 2016, 54, 5801–5820. [Google Scholar] [CrossRef]
- Zhang, L.; Cheng, B.; Deng, Y. A Tensor-based Adaptive Subspace Detector for Hyperspectral Anomaly Detection. Int. J. Remote Sens. 2018, 39, 2366–2382. [Google Scholar] [CrossRef]
- Pan, B.; Shi, Z.; Xu, X. R-VCANet: A New Deep-Learning-Based Hyperspectral Image Classification Method. IEEE J. Sel. Top. Appl. Earth Obs. Remote Sens. 2018, 10, 1975–1986. [Google Scholar] [CrossRef]
- Li, W.; Wu, G.; Du, Q. Transferred Deep Learning for Anomaly Detection in Hyperspectral Imagery. IEEE Geosci. Remote Sens. Lett. 2017, 14, 597–601. [Google Scholar] [CrossRef]
- Hong, D.; Han, Z.; Yao, J.; Gao, L.; Zhang, B.; Plaza, A.; Chanussot, J. SpectralFormer: Rethinking Hyperspectral Image Classification with Transformers. IEEE Trans. Geosci. Remote Sens. 2021. [Google Scholar] [CrossRef]
- Hong, D.; Gao, L.; Yao, J.; Zhang, B.; Plaza, A.; Chanussot, J. Graph Convolutional Networks for Hyperspectral Image Classification. IEEE Trans. Geosci. Remote Sens. 2021, 59, 5966–5978. [Google Scholar] [CrossRef]
- Kwon, H.; Nasrabadi, N.M. Kernel RX-algorithm: A Nonlinear Anomaly Detector for Hyperspectral Imagery. IEEE Trans. Geosci. Remote Sens. 2005, 43, 388–397. [Google Scholar] [CrossRef]
- Tao, R.; Zhao, X.; Li, W.; Li, H.; Du, Q. Hyperspectral Anomaly Detection by Fractional Fourier Entropy. IEEE J. Sel. Top. Appl. Earth Observ. Remote Sens. 2019, 12, 4920–4929. [Google Scholar] [CrossRef]
- Candan, C.; Kutay, M.A.; Ozaktas, H. The Discrete Fractional Fourier Transform. IEEE Trans. Signal Process. 2000, 48, 1329–1337. [Google Scholar] [CrossRef] [Green Version]
- Chen, S.; Zhang, S.; Zhao, H.; Chen, Y. A New Chirp Scaling Algorithm for Highly Squinted Missile-borne SAR based on FrFT. IEEE J. Sel. Topics Appl. Earth Observ. Remote Sens. 2015, 8, 3977–3987. [Google Scholar] [CrossRef]
- Zhang, L.; Cheng, B. Fractional Fourier Transform and Transferred CNN based on Tensor for Hyperspectral Anomaly Detection. IEEE Geosci. Remote Sens. Lett. 2022, 19, 5505505. [Google Scholar] [CrossRef]
- Horn, R.A.; Johnson, C.R. Matrix Analysis; Cambridge University Press: Cambridge, UK, 1985; p. 176. [Google Scholar]
Figure 1.
Diagram of the proposed FrFT-TRX algorithm.
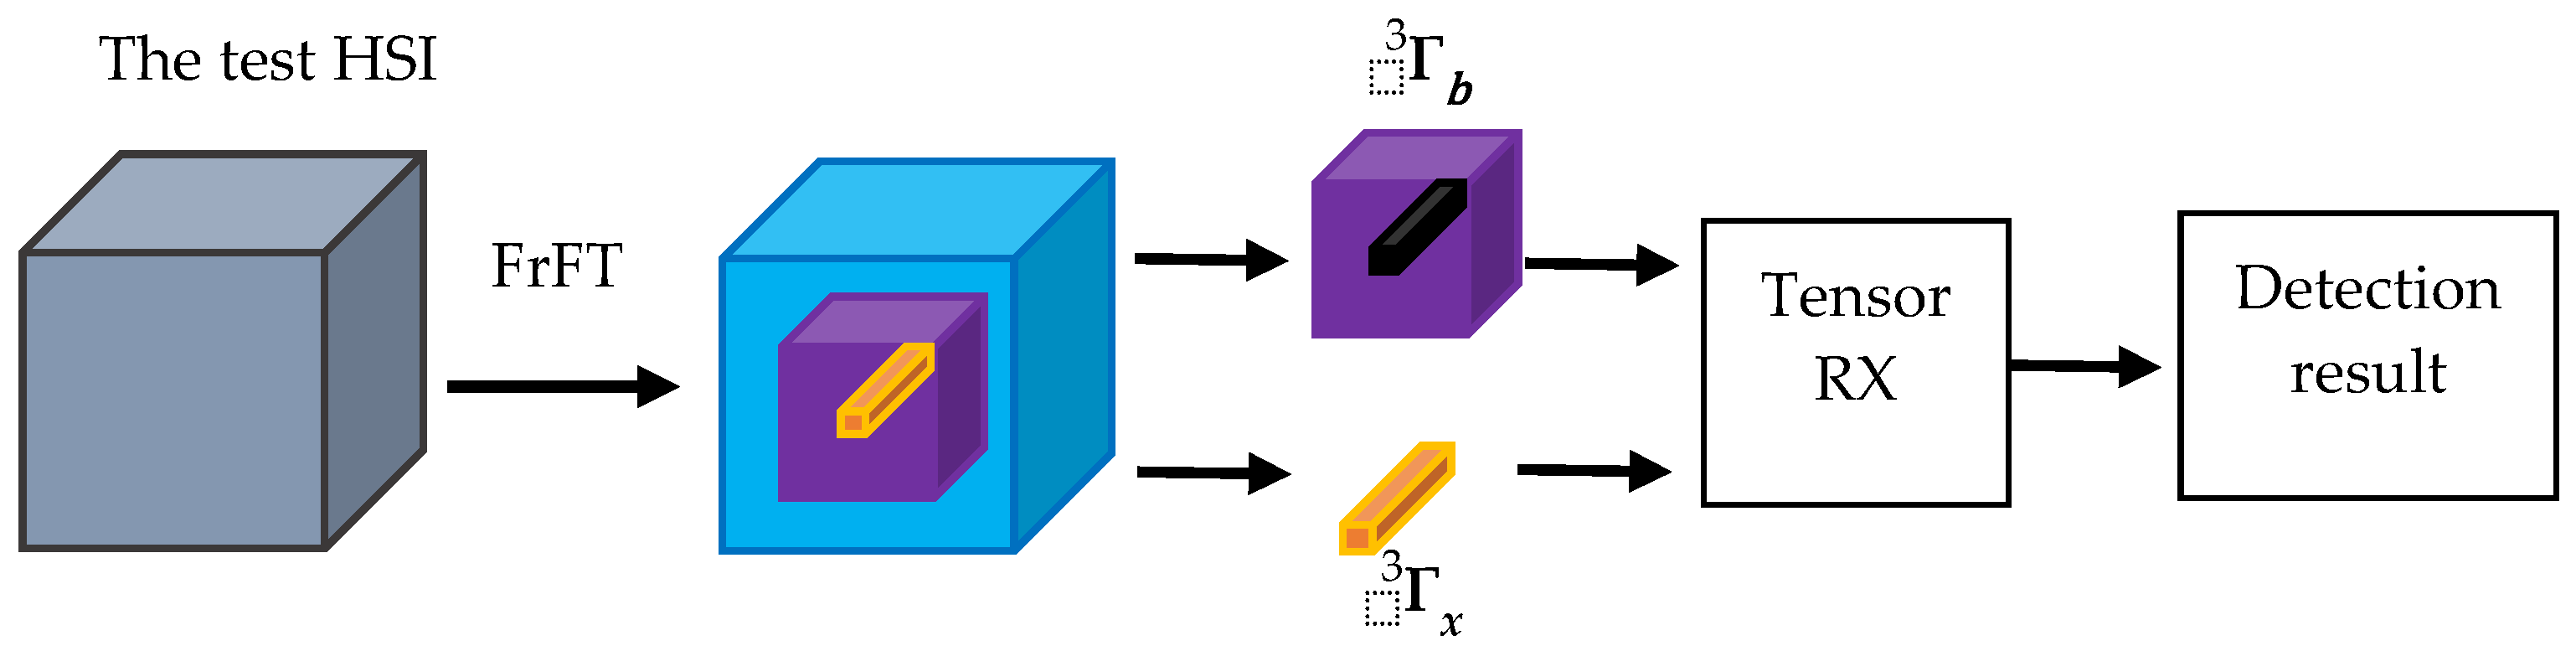
Figure 2.
Data L and two-dimensional diagrams of detection results: (a) 100th band of data L; (b) Ground-truth map; (c) GRX; (d) LRX; (e) KRX; (f) FrFE-RX; (g) FrFE-LRX; (h) PCA-TRX; and (i) FrFT-TRX.
Figure 2.
Data L and two-dimensional diagrams of detection results: (a) 100th band of data L; (b) Ground-truth map; (c) GRX; (d) LRX; (e) KRX; (f) FrFE-RX; (g) FrFE-LRX; (h) PCA-TRX; and (i) FrFT-TRX.
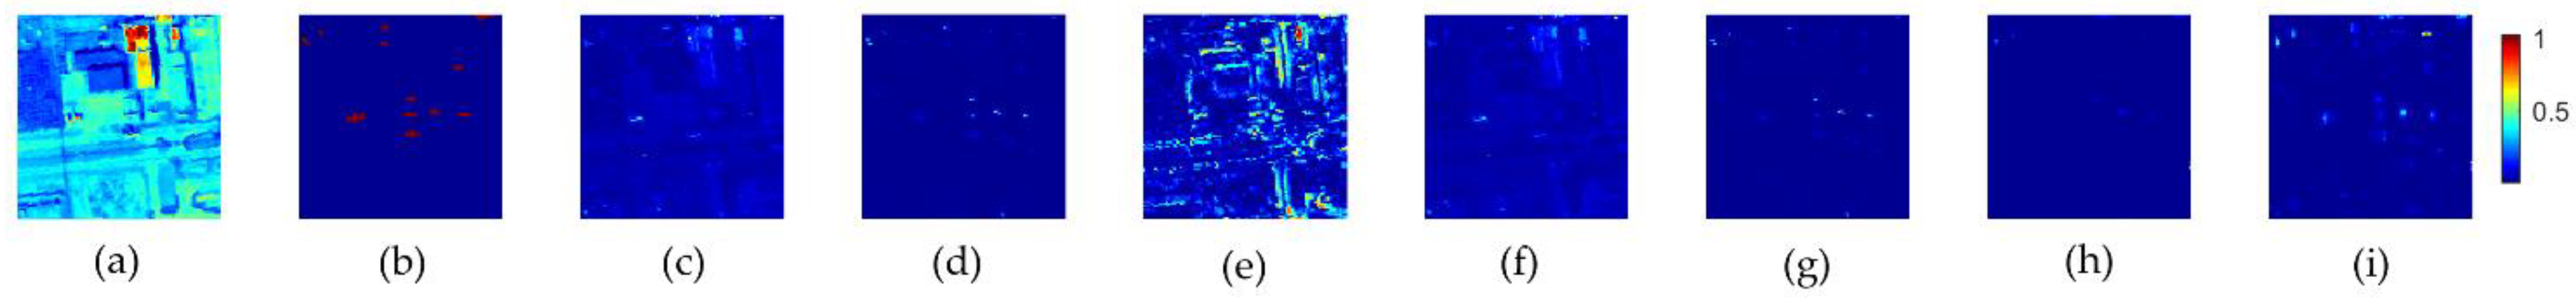
Figure 3.
ROC curves and AUC values for data L.

Figure 4.
Separability graphs for data L.
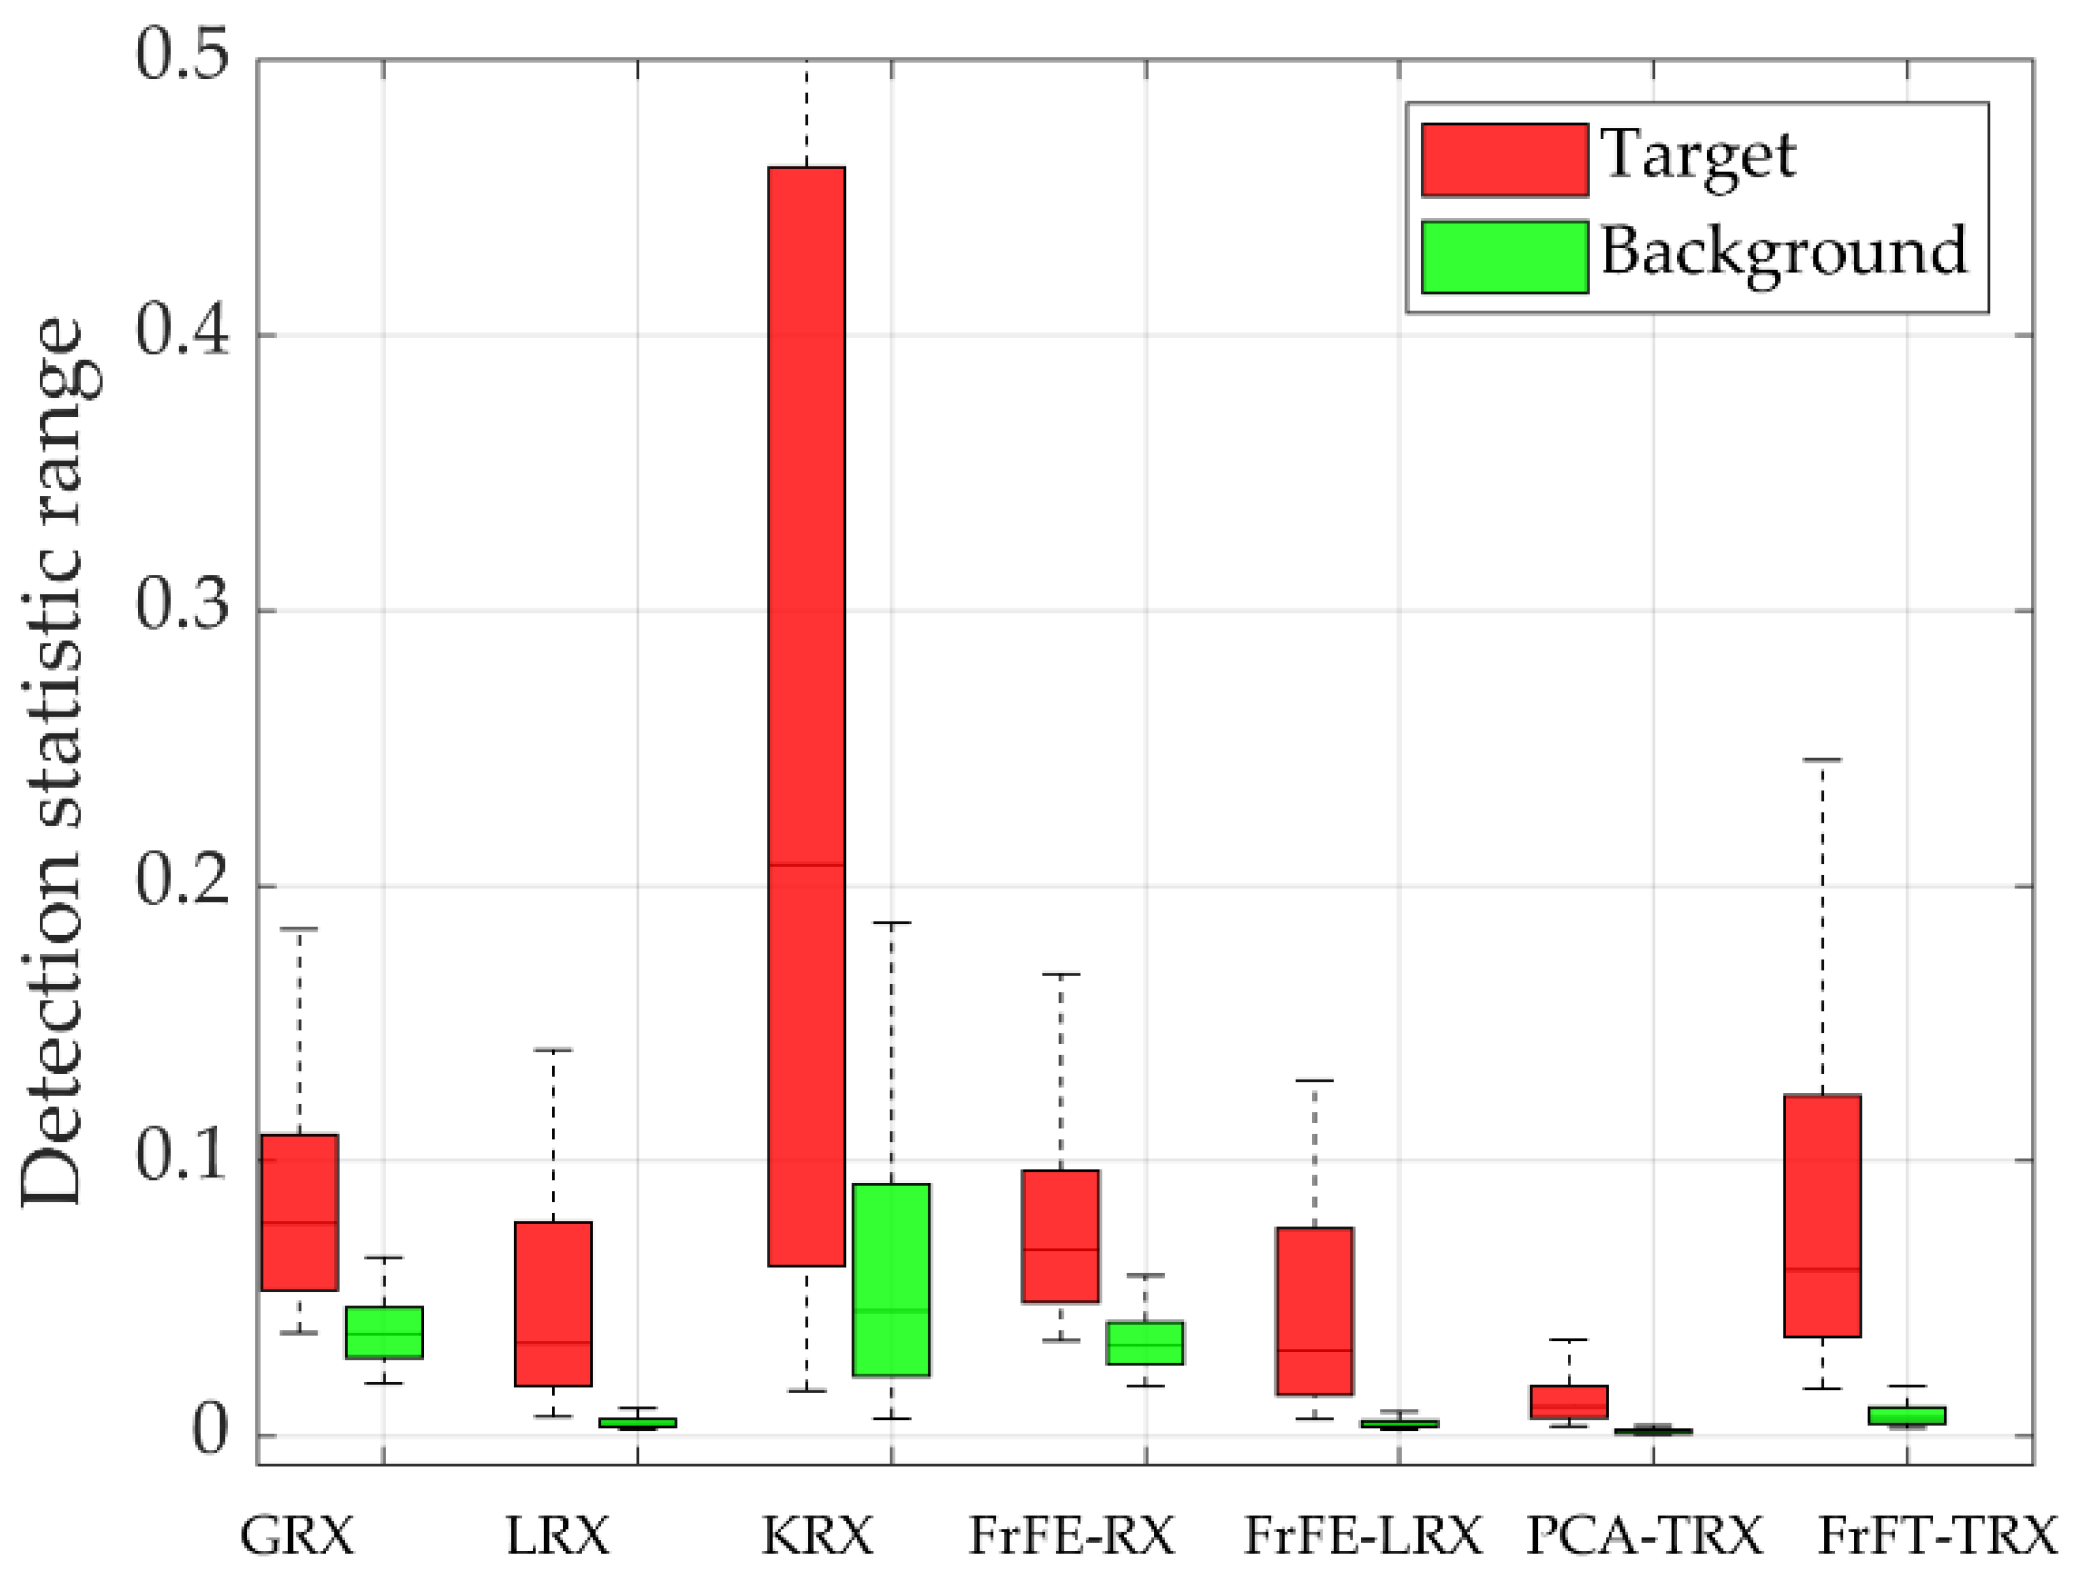
Figure 5.
Data C and two-dimensional diagrams of detection results: (a) 100th band of data C; (b) Ground-truth map; (c) GRX; (d) LRX; (e) KRX; (f) FrFE-RX; (g) FrFE-LRX; (h) PCA-TRX; and (i) FrFT-TRX.
Figure 5.
Data C and two-dimensional diagrams of detection results: (a) 100th band of data C; (b) Ground-truth map; (c) GRX; (d) LRX; (e) KRX; (f) FrFE-RX; (g) FrFE-LRX; (h) PCA-TRX; and (i) FrFT-TRX.

Figure 6.
ROC curves and AUC values for data C.

Figure 7.
Separability graphs for data C.
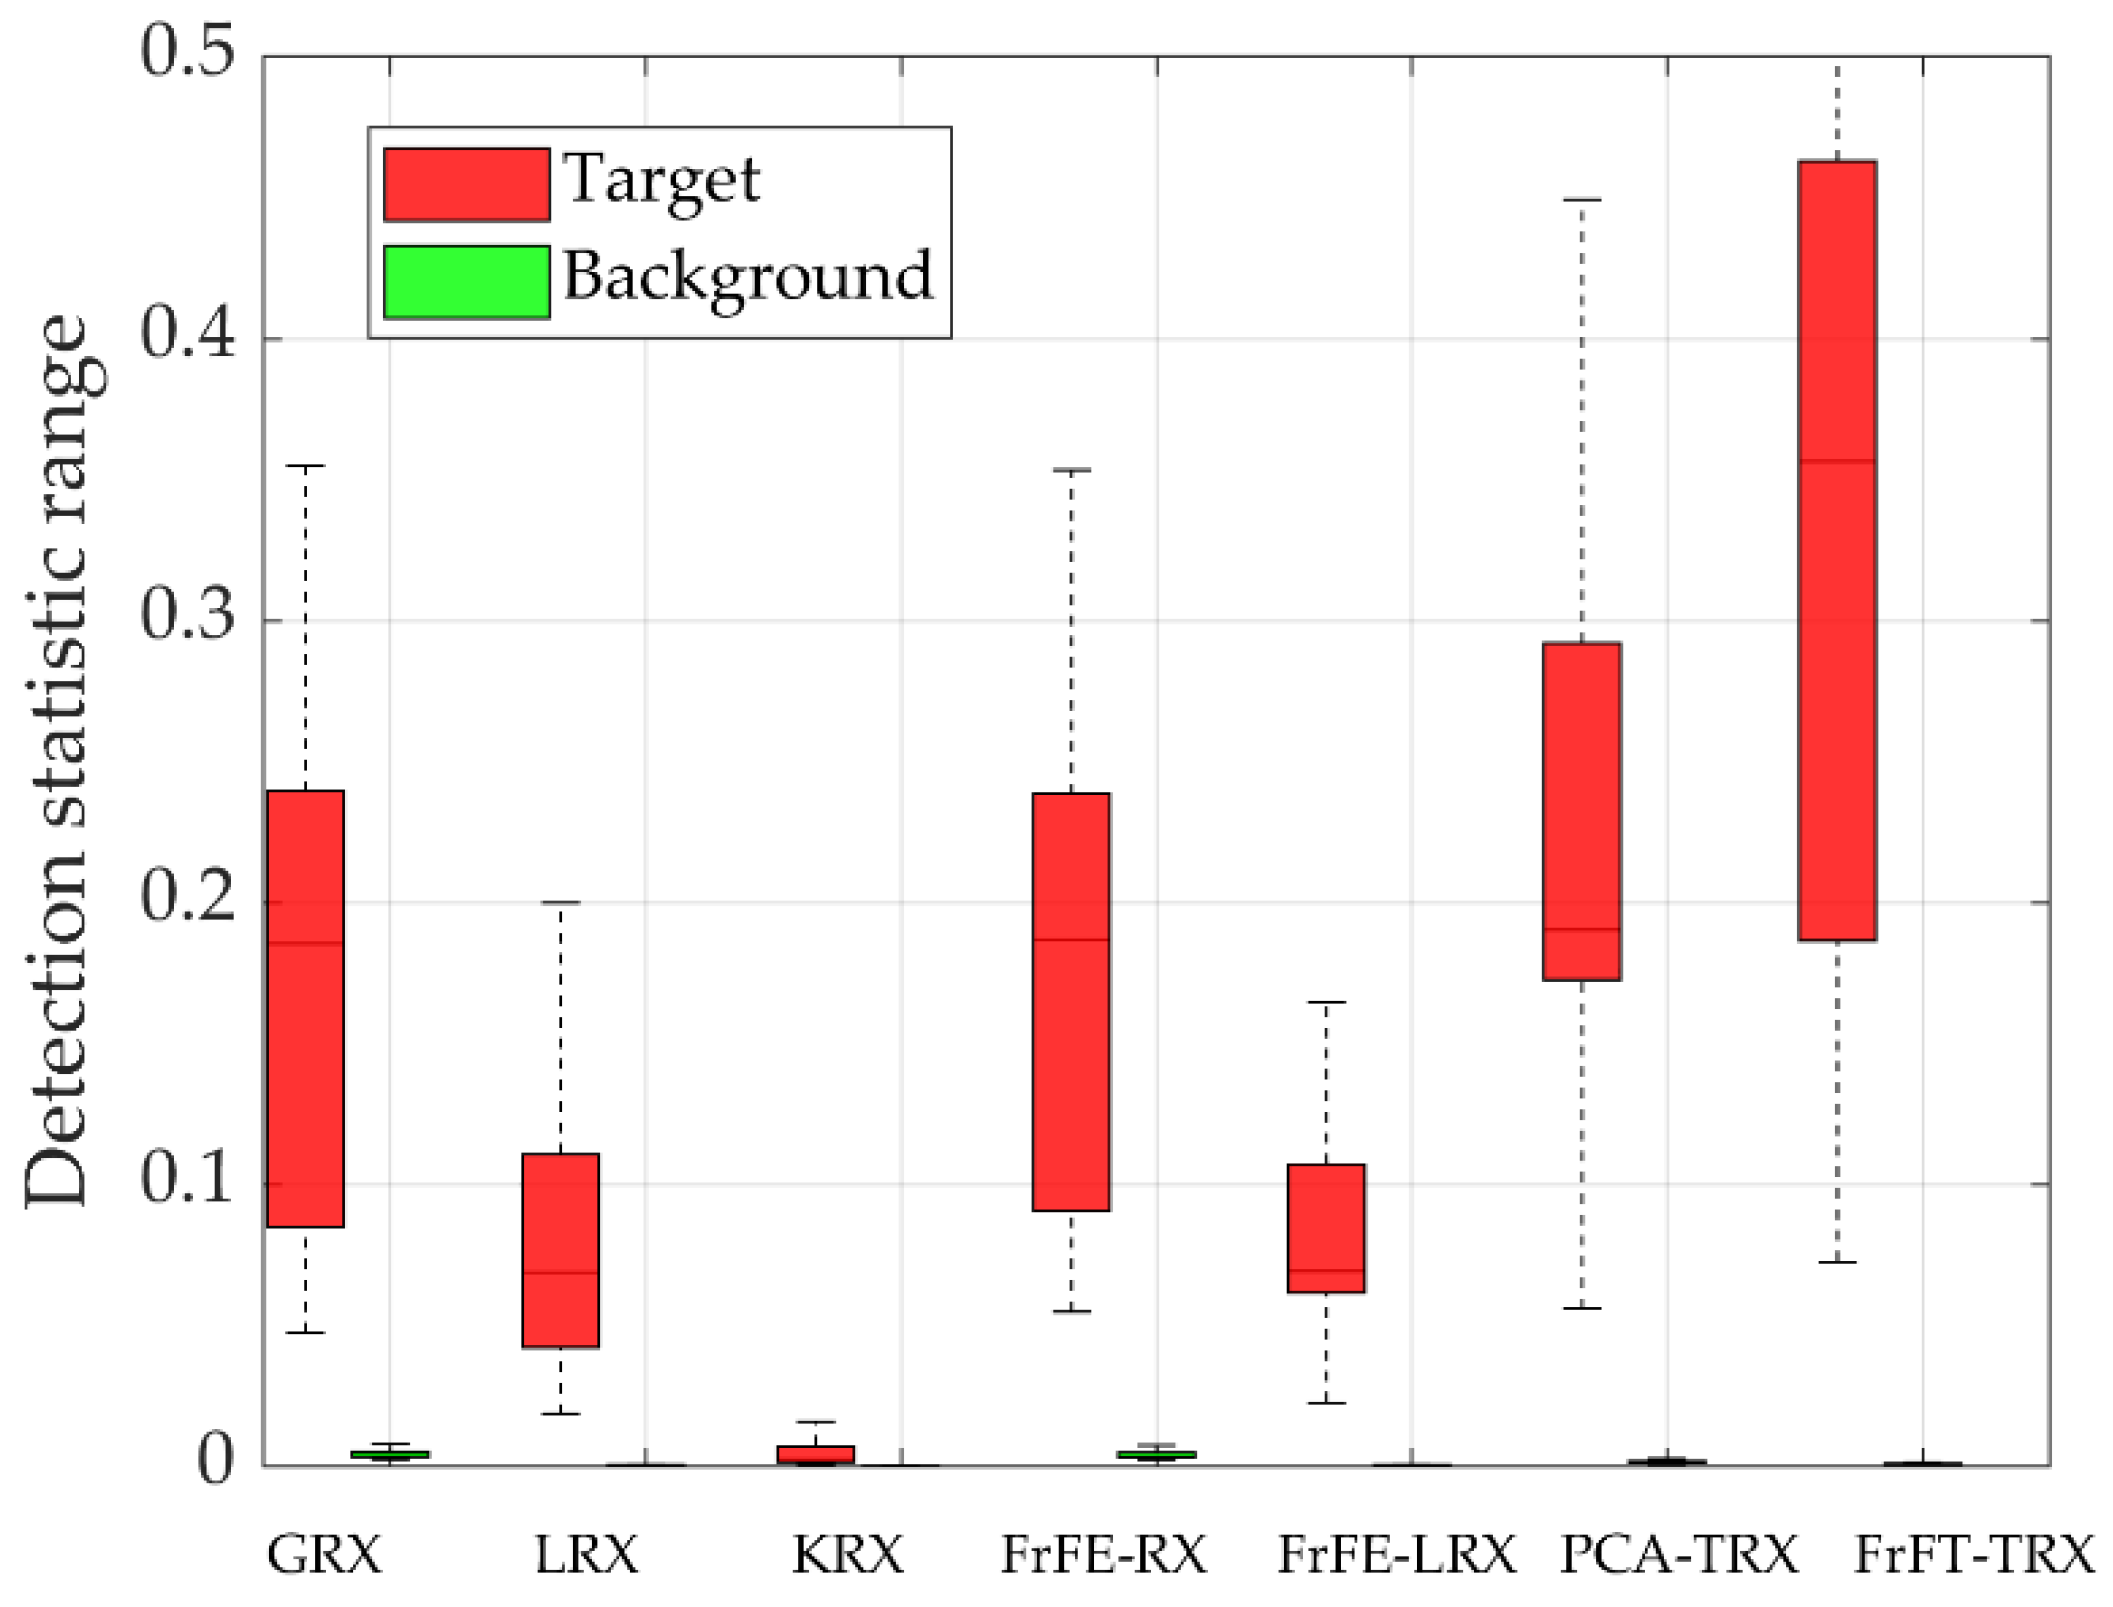
Figure 8.
Data P and two-dimensional diagrams of detection results: (a) 100th band of data P; (b) Ground-truth map; (c) GRX; (d) LRX; (e) KRX; (f) FrFE-RX; (g) FrFE-LRX; (h) PCA-TRX; and (i) FrFT-TRX.
Figure 8.
Data P and two-dimensional diagrams of detection results: (a) 100th band of data P; (b) Ground-truth map; (c) GRX; (d) LRX; (e) KRX; (f) FrFE-RX; (g) FrFE-LRX; (h) PCA-TRX; and (i) FrFT-TRX.

Figure 9.
ROC curves and AUC values for data P.
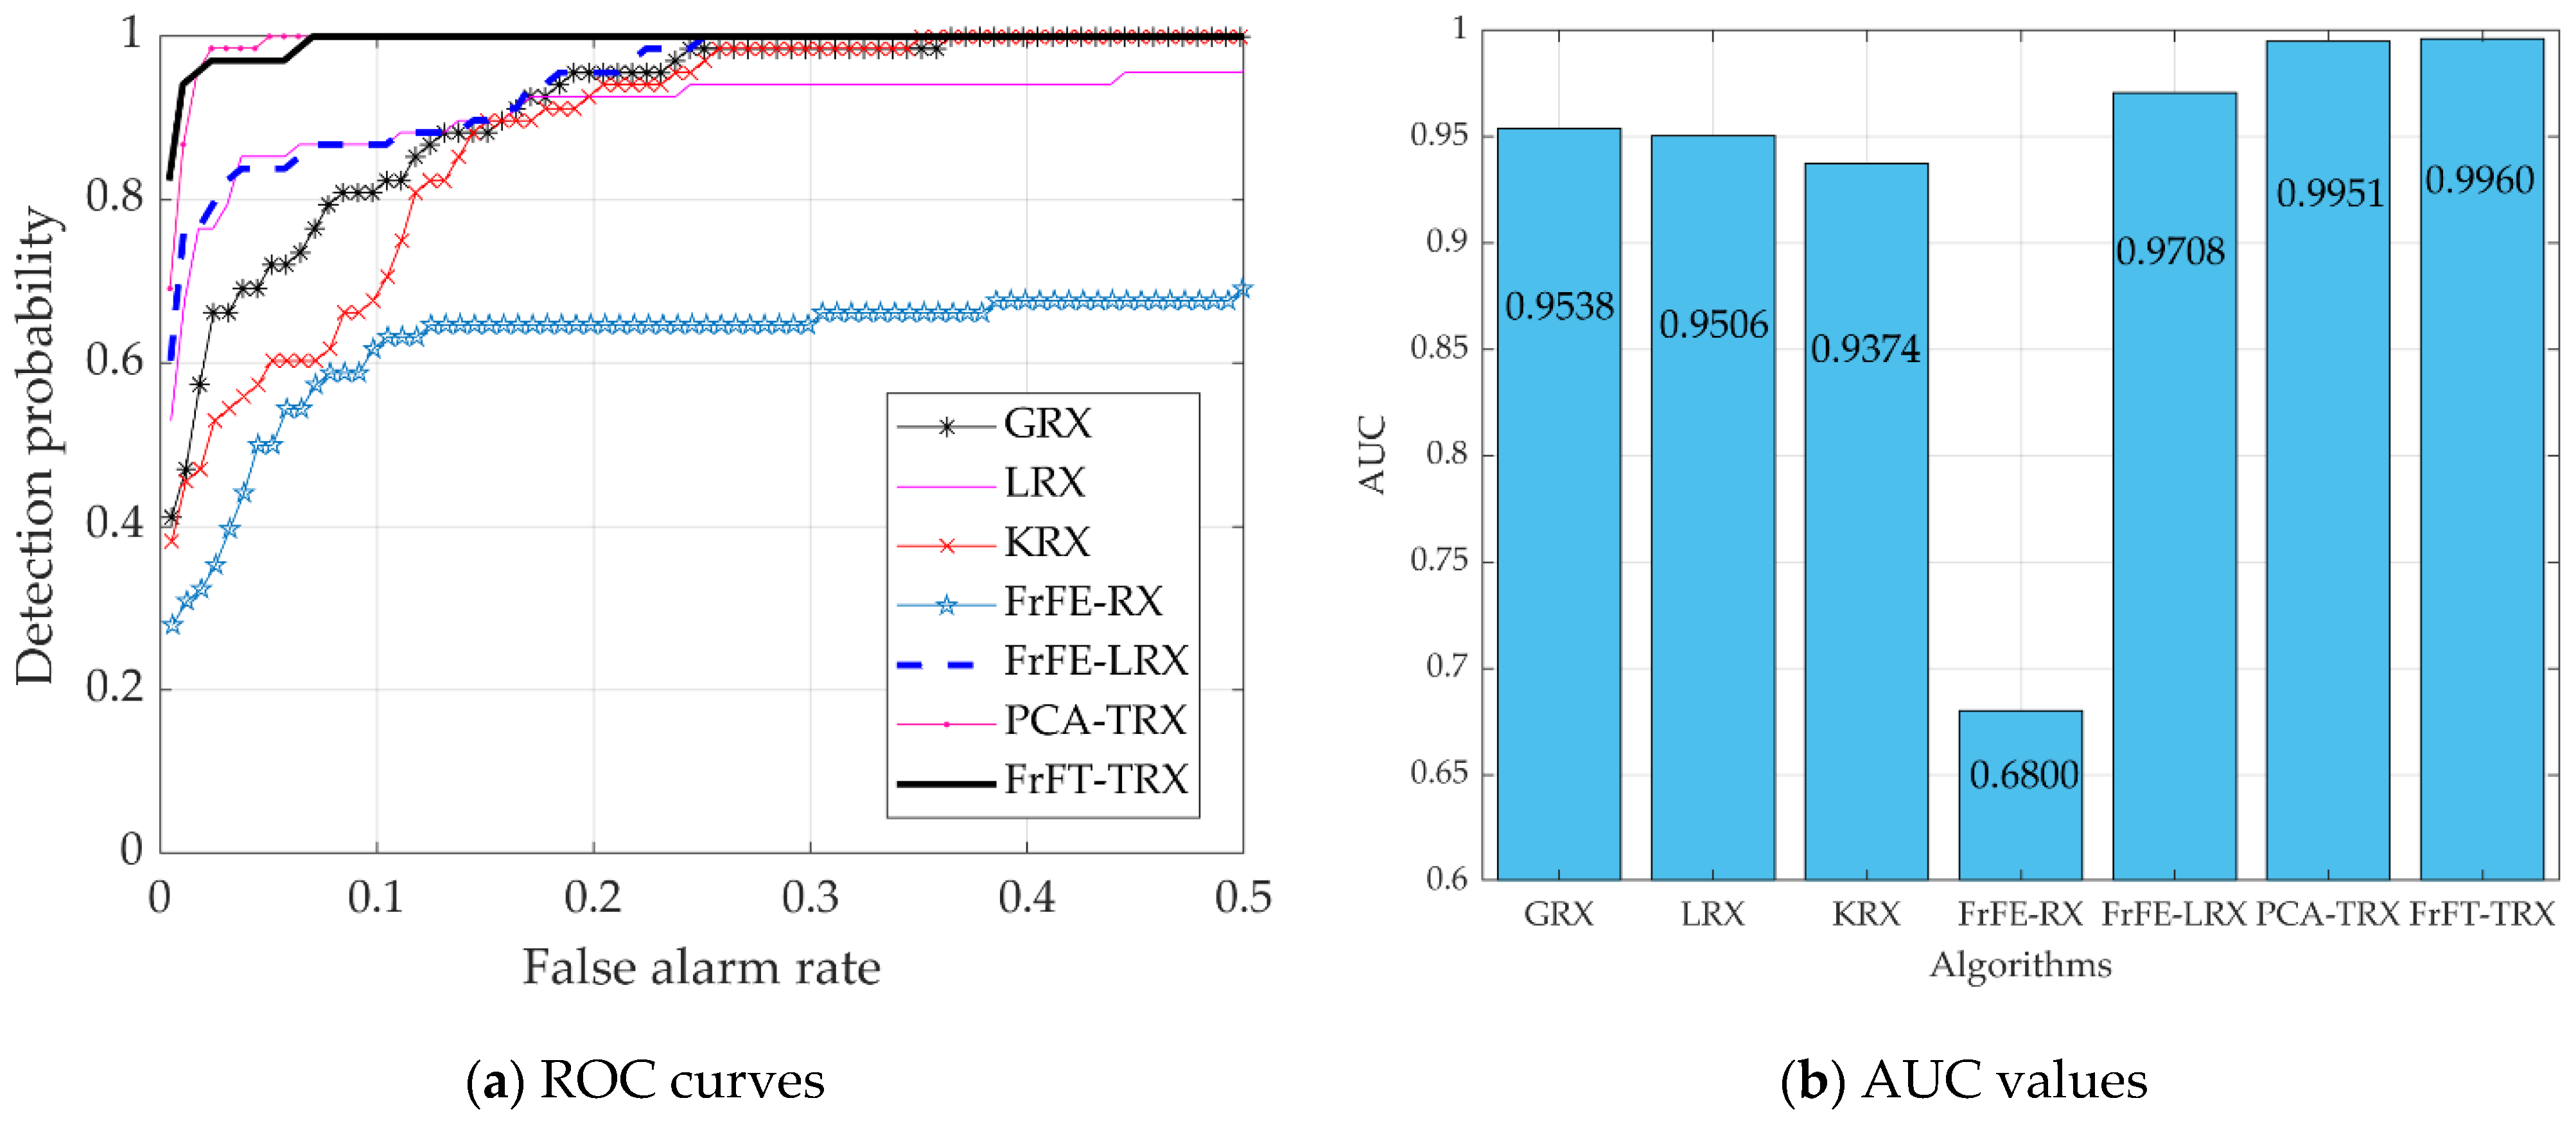
Figure 10.
Separability graphs for data P.
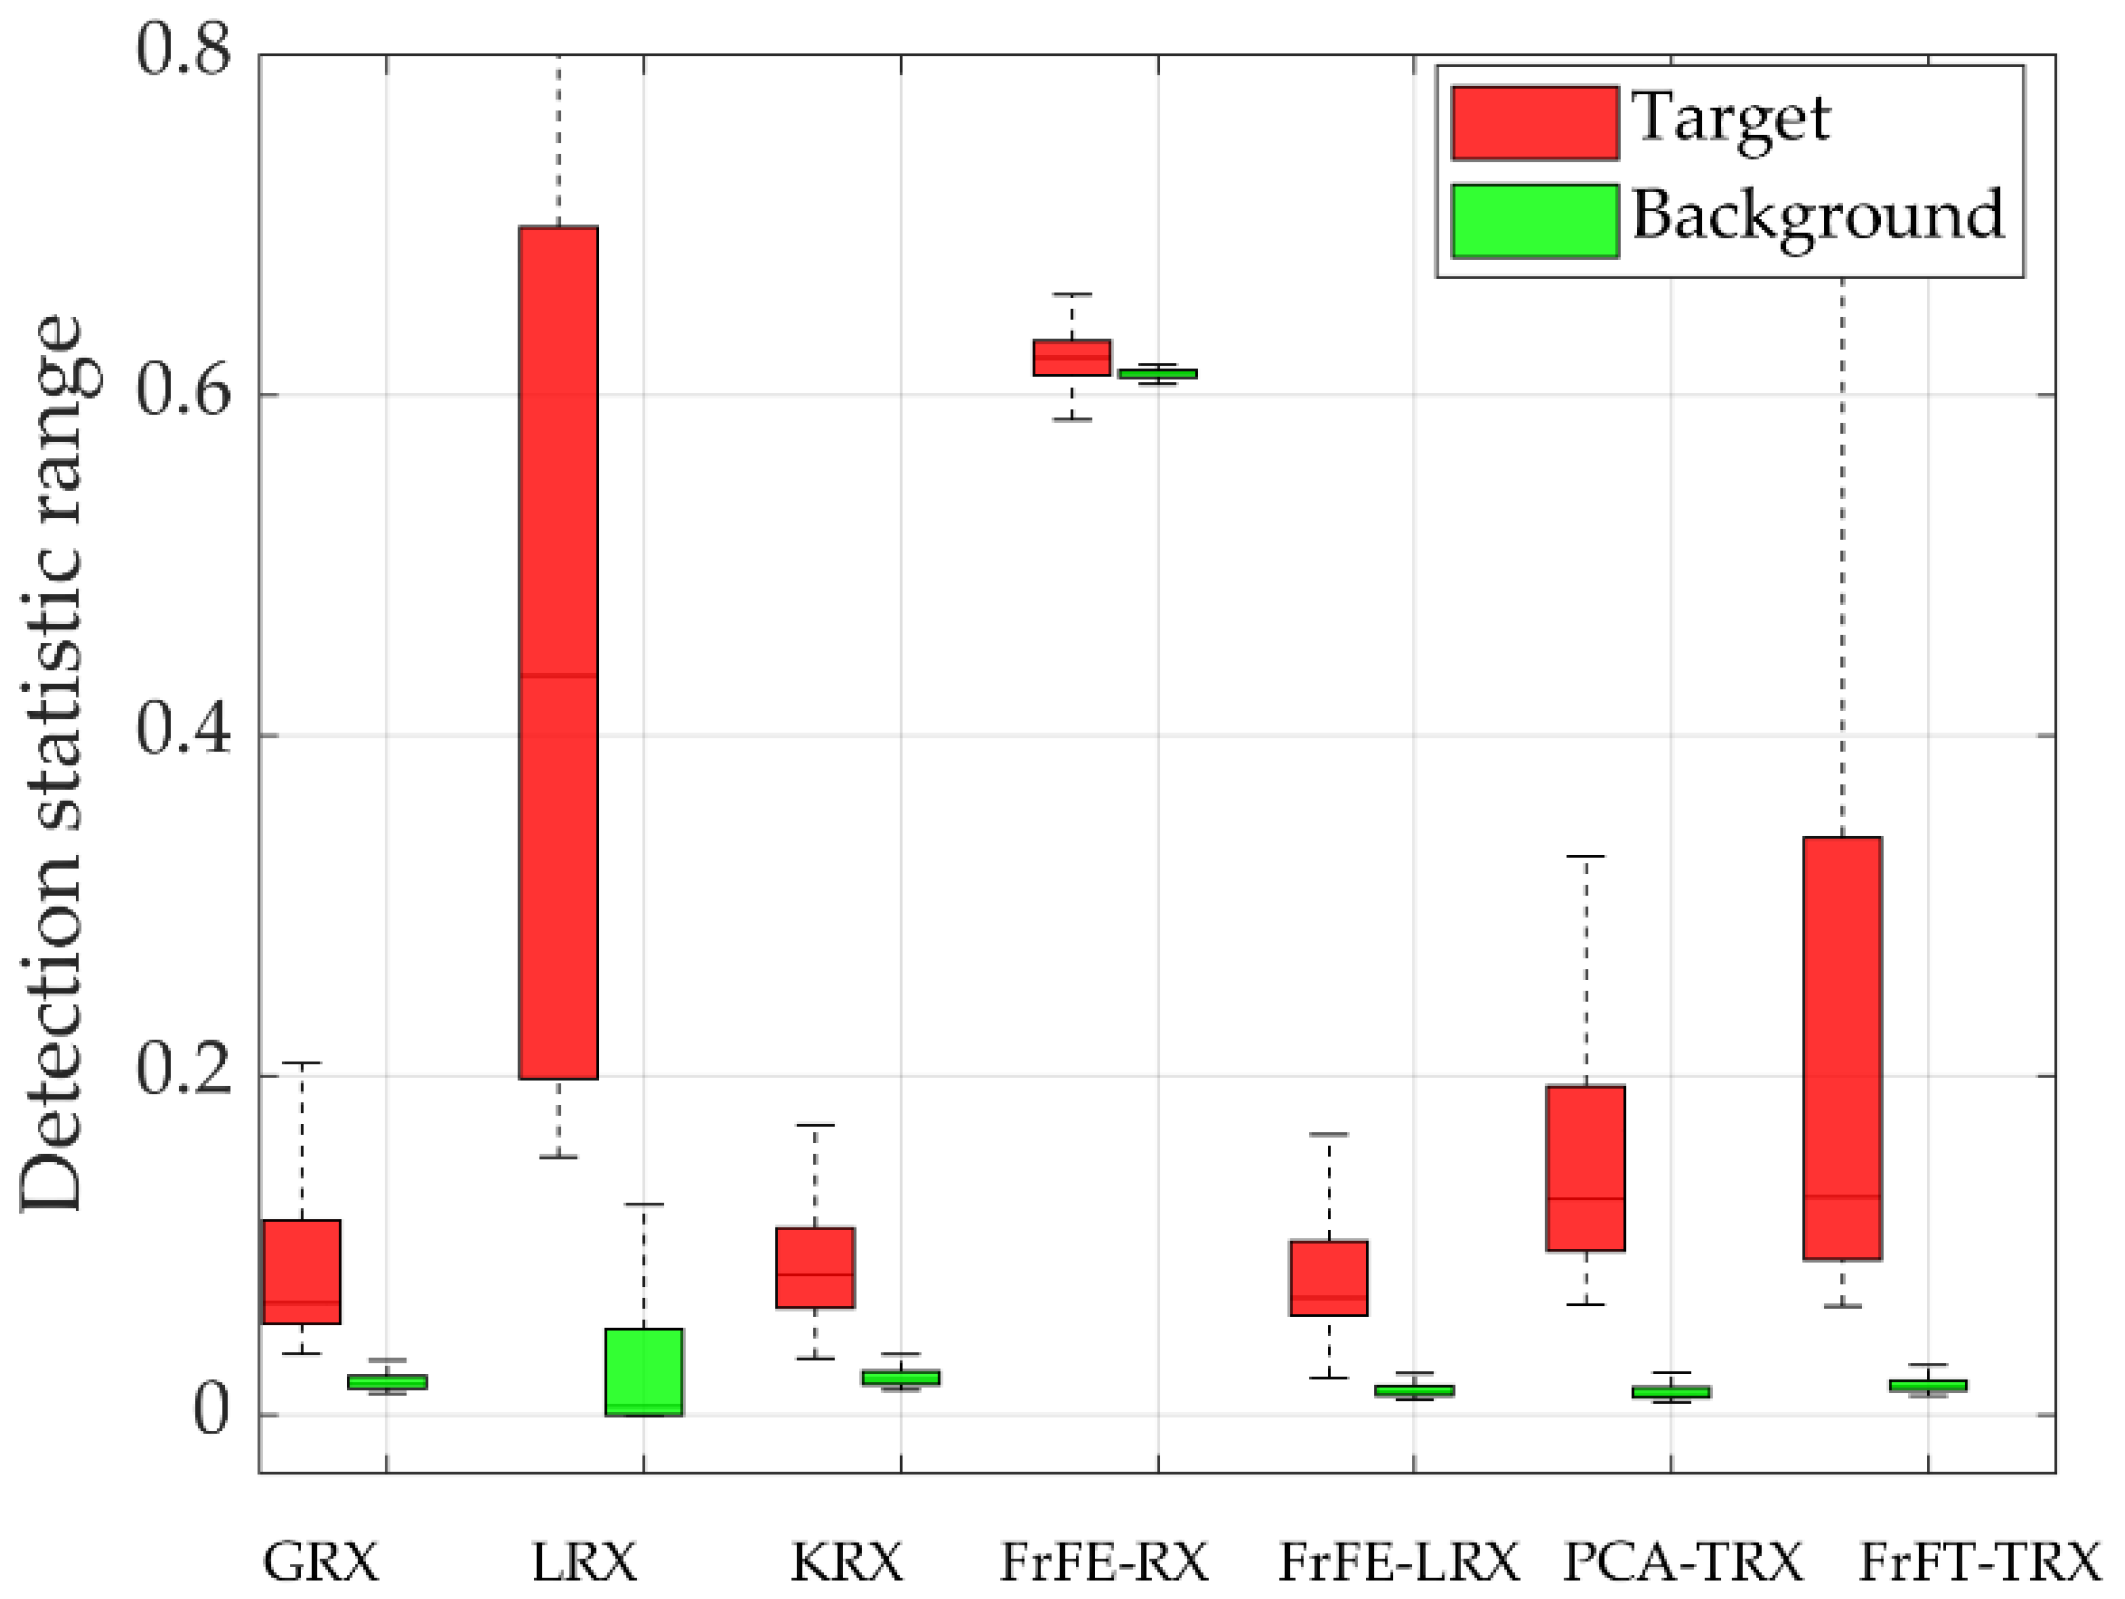
Figure 11.
Data T and two-dimensional diagrams of detection results: (a) 100th band of data T; (b) Ground-truth map; (c) GRX; (d) LRX; (e) KRX; (f) FrFE-RX. (g) FrFE-LRX; (h) PCA-TRX; and (i) FrFT-TRX.
Figure 11.
Data T and two-dimensional diagrams of detection results: (a) 100th band of data T; (b) Ground-truth map; (c) GRX; (d) LRX; (e) KRX; (f) FrFE-RX. (g) FrFE-LRX; (h) PCA-TRX; and (i) FrFT-TRX.
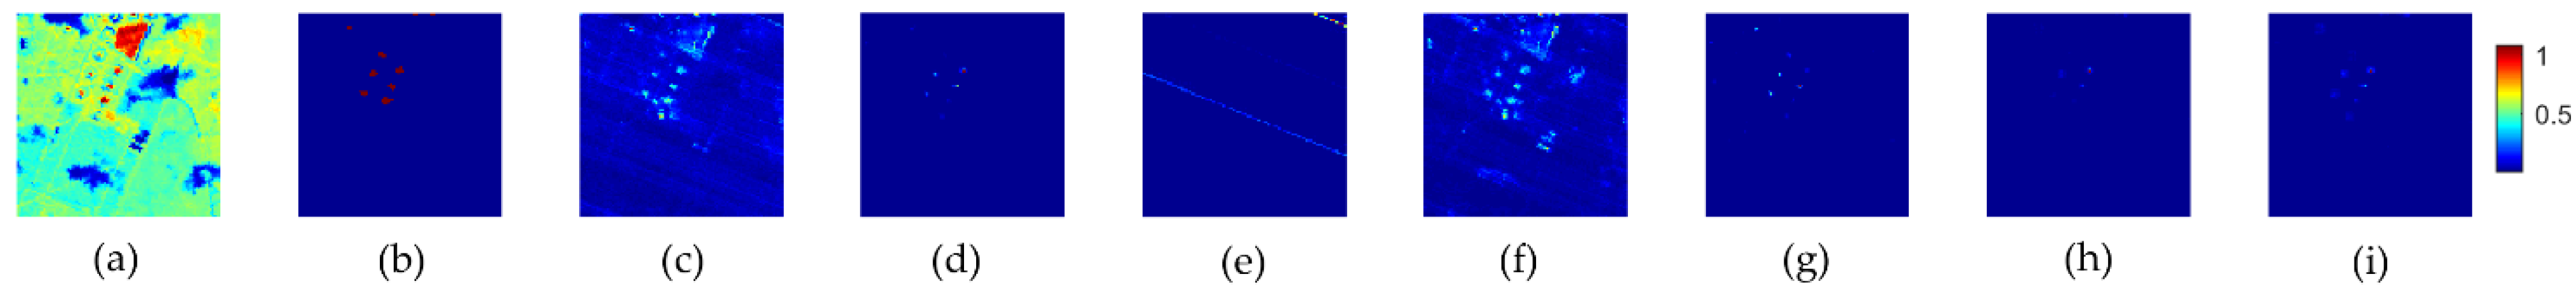
Figure 12.
ROC curves and AUC values for data T.
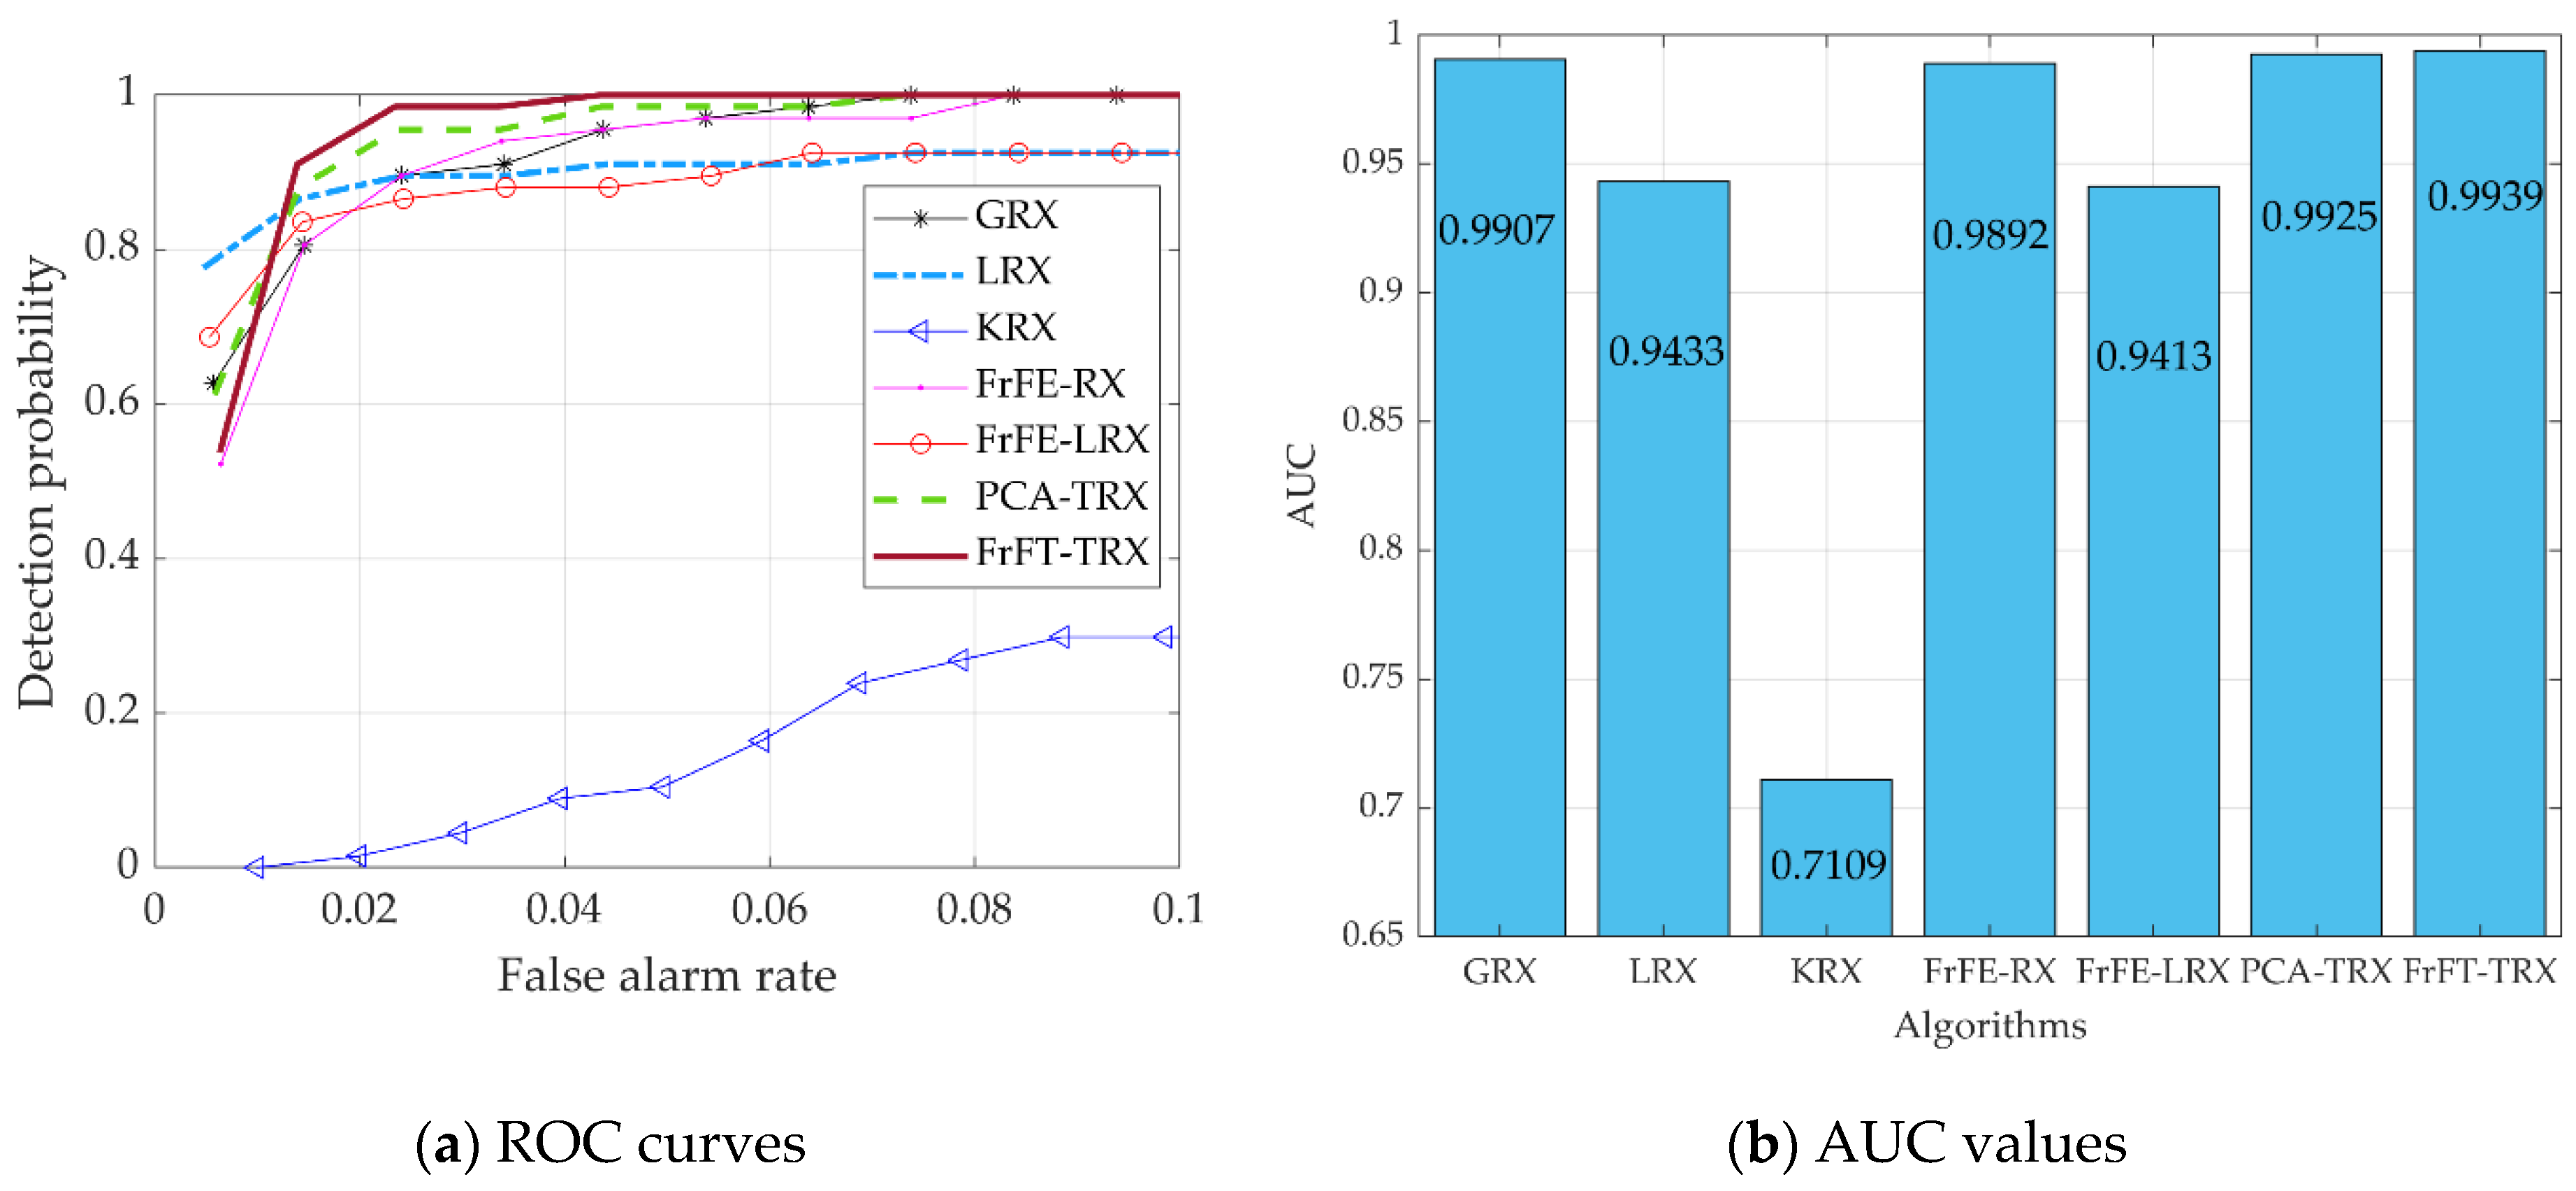
Figure 13.
Separability graphs for data T.
Figure 14.
Data S and two-dimensional diagrams of detection results: (a) 100th band of data S; (b) Ground-truth map; (c) GRX; (d) LRX; (e) KRX; (f) FrFE-RX; (g) FrFE-LRX; (h) PCA-TRX; and (i) FrFT-TRX.
Figure 14.
Data S and two-dimensional diagrams of detection results: (a) 100th band of data S; (b) Ground-truth map; (c) GRX; (d) LRX; (e) KRX; (f) FrFE-RX; (g) FrFE-LRX; (h) PCA-TRX; and (i) FrFT-TRX.

Figure 15.
ROC curves and AUC values for data S.
Figure 16.
Separability graphs for data S.
Figure 17.
AUC values versus p for data L.
Figure 18.
AUC values versus p for data C.
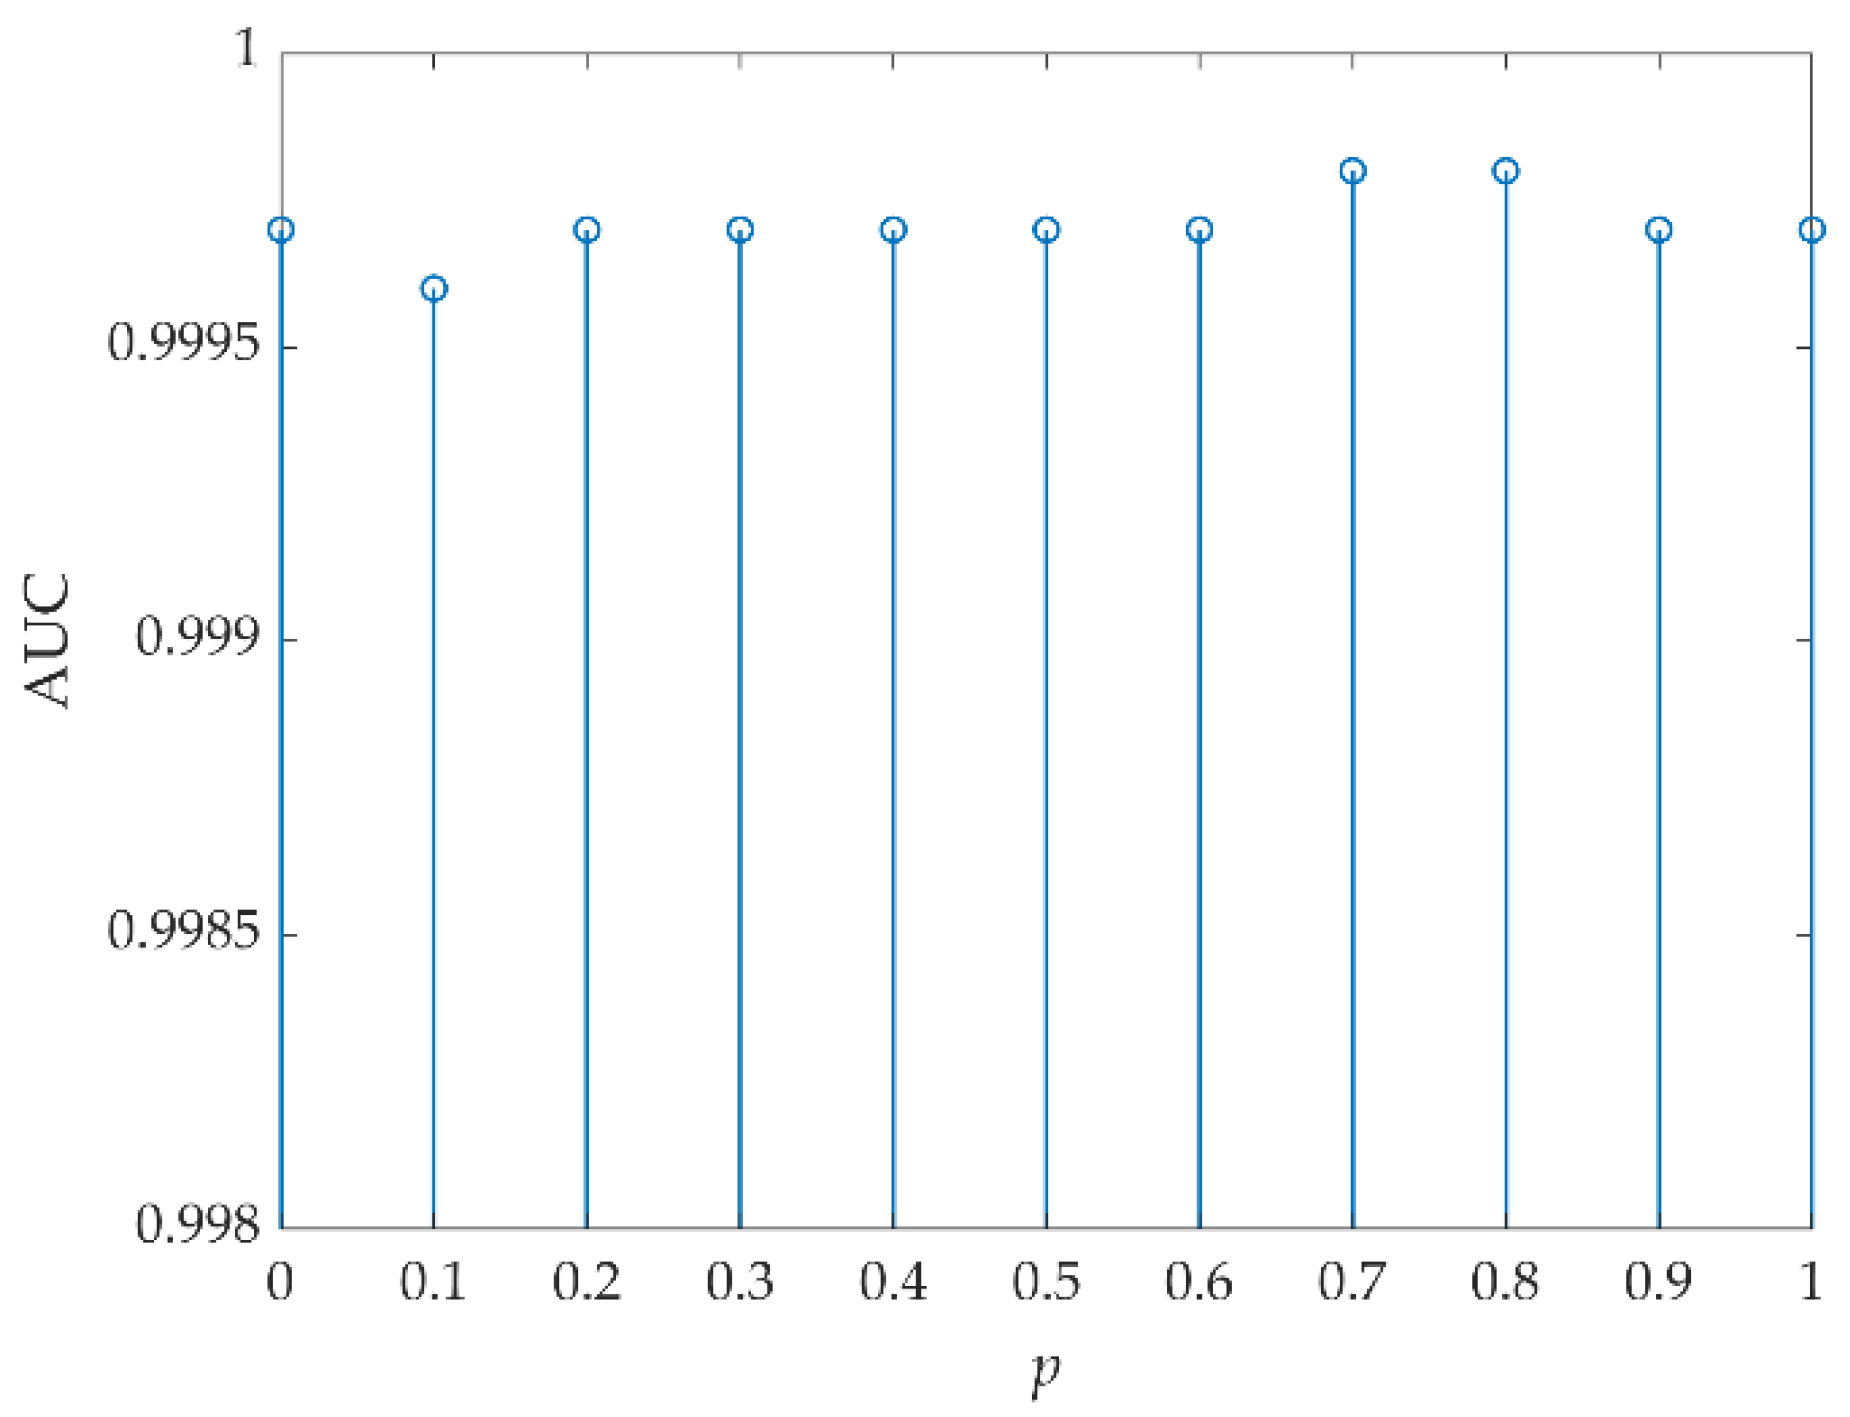
Figure 19.
AUC values versus p for data P.

Figure 20.
AUC values versus p for data T.
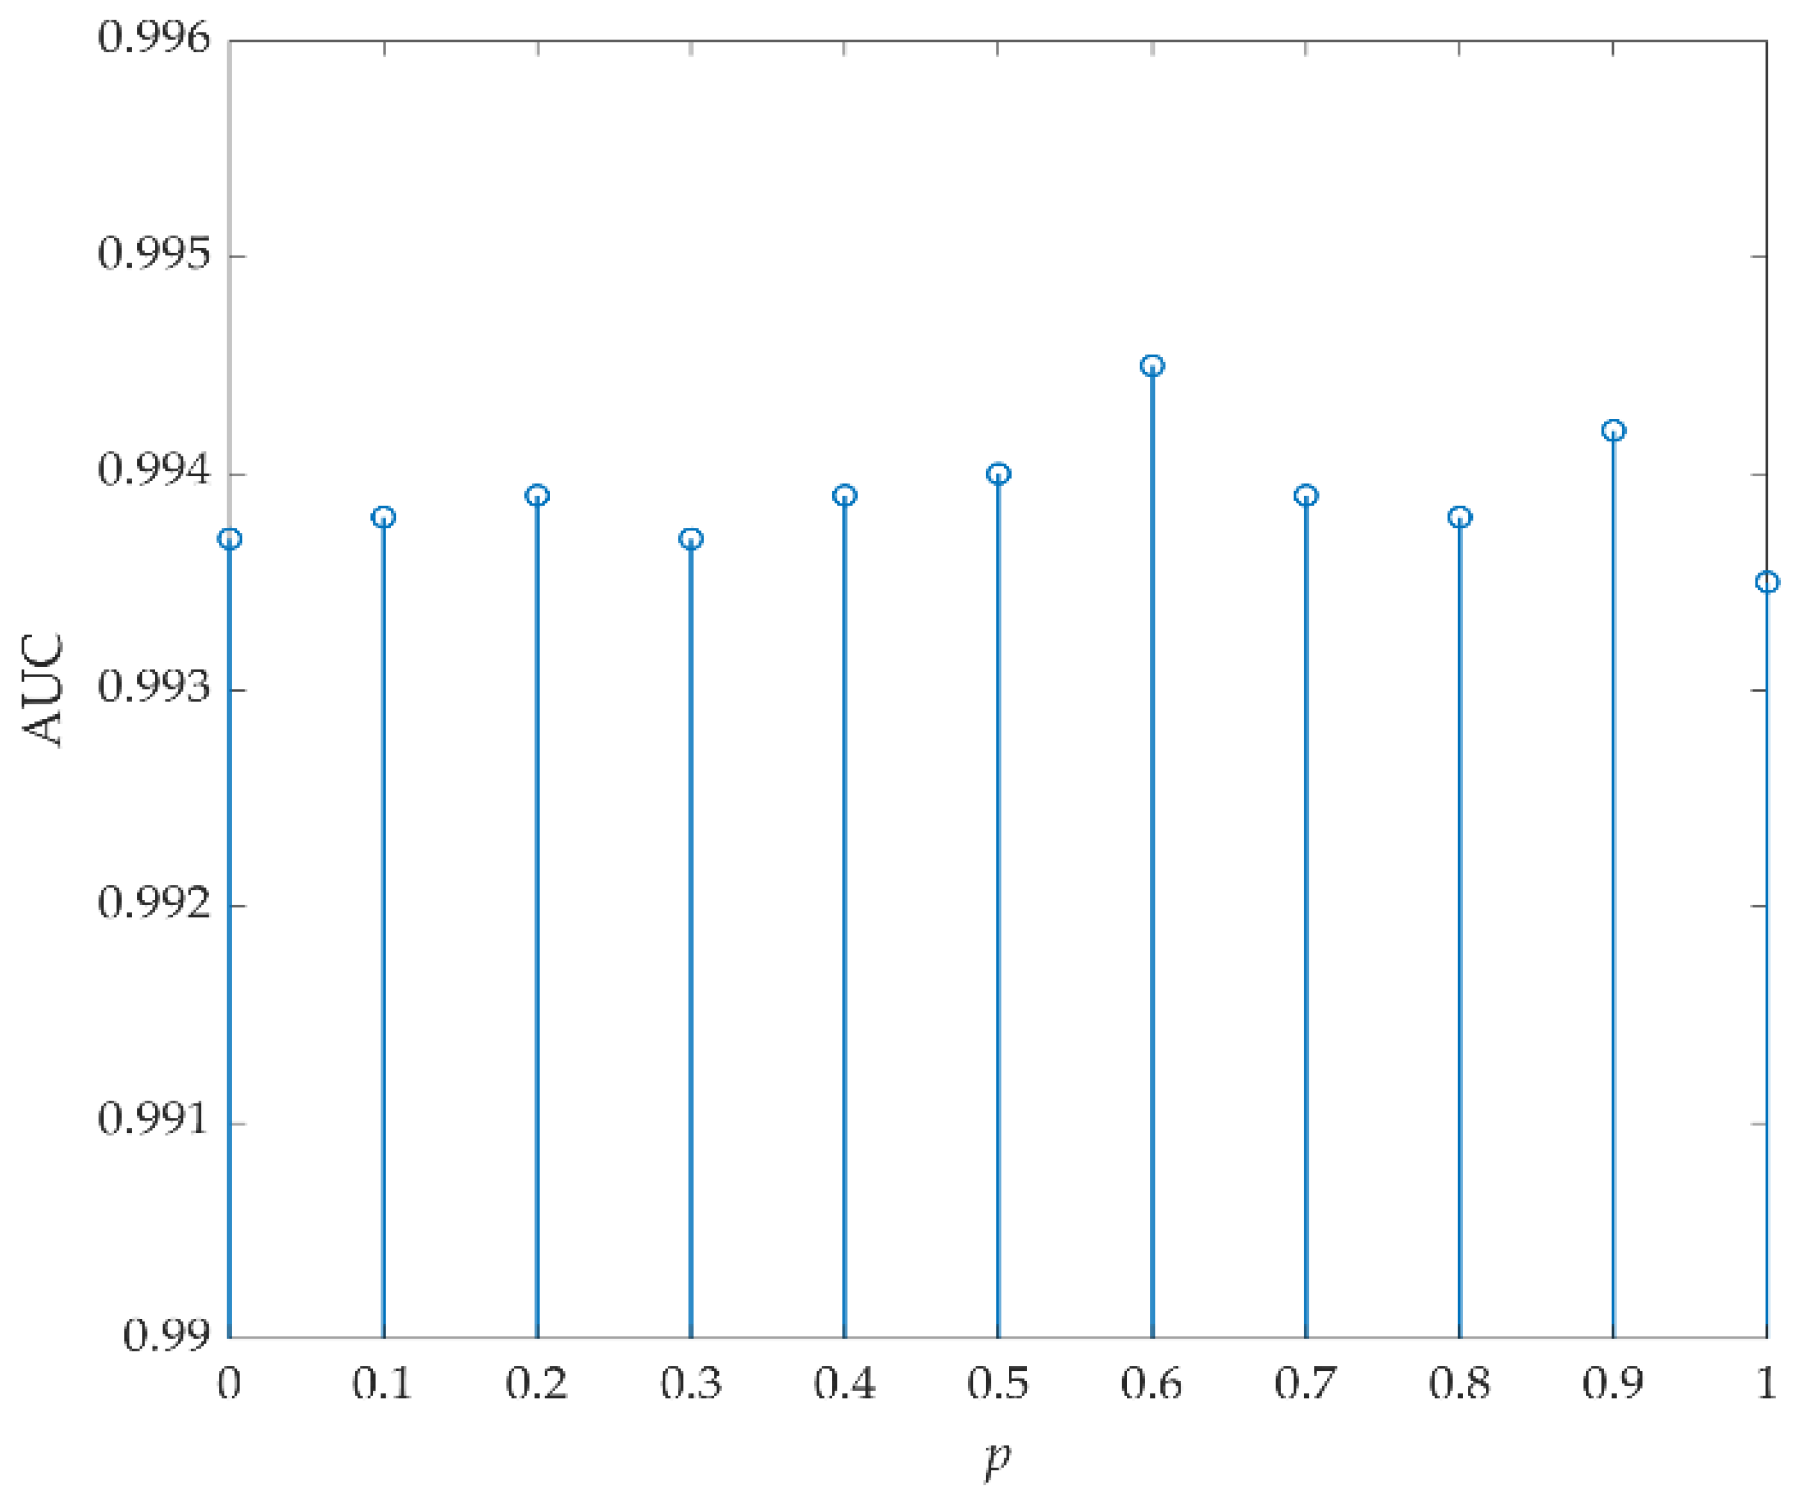
Figure 21.
AUC values versus p for data S.

Table 1.
Features of five experimental HSIs.
| Data | Capture Location | Resolution | Sensor | Experimental Size | Flight Date |
|---|---|---|---|---|---|
| data L | Los Angeles | 7.1 m | AVIRIS | 100 × 100 × 205 | 11/9/2011 |
| data C | Cat Island | 17.2 m | AVIRIS | 150 × 150 × 189 | 9/12/2010 |
| data P | Pavia | 1.3 m | ROSIS-03 | 150 × 150 × 102 | Unknown |
| data T | Texas Coast | 17.2 m | AVIRIS | 100 × 100 × 204 | 8/29/2010 |
| data S | San Diego | 3.5 m | AVIRIS | 120 × 120 × 126 | Unknown |
Table 2.
Parameter settings of LRX, FrFE-RX, FrFE-LRX, and FrFT-TRX for the five experimental HSIs.
| Data | LRX (Win, Wout) | KRX (c, Win, Wout) | FrFE-RX p | FrFE-LRX (p, Win, Wout) | PCA-TRX (d, Wt, Wb) | FrFT-TRX (p, Wt, Wb) |
|---|---|---|---|---|---|---|
| data L | (7, 9) | (10−5, 5, 9) | 0.2 | (0.2, 7, 9) | (10, 7, 9) | (1, 7, 9) |
| data C | (25, 77) | (10−2, 5, 7) | 0.2 | (0.2, 25, 77) | (10, 3, 37) | (0.2, 3, 37) |
| data P | (25, 81) | (10−1, 25, 29) | 1 | (1, 25, 77) | (20, 3, 37) | (1, 3, 37) |
| data T | (7, 9) | (10−2, 7, 9) | 1 | (1, 5, 7) | (8, 7, 9) | (0.2, 7, 9) |
| data S | (7, 9) | (10−2, 7, 9) | 0.9 | (0.9, 7, 9) | (9, 3, 31) | (0.9, 3, 31) |
Table 3.
Time consumption (in seconds) of all test algorithms for the five HSIs.
| Data | GRX | LRX | KRX | FrFE-RX | FrFE-LRX | PCA-TRX | FrFT-TRX |
|---|---|---|---|---|---|---|---|
| data L | 1.43 | 27.79 | 56.67 | 11.35 | 39.08 | 4.97 | 32.54 |
| data C | 0.71 | 421.21 | 25.87 | 22.35 | 430.72 | 2.92 | 140.65 |
| data P | 0.63 | 236.19 | 1418.01 | 11.86 | 218.95 | 5.56 | 44.78 |
| data T | 0.58 | 26.95 | 20.92 | 10.96 | 38.06 | 5.64 | 33.13 |
| data S | 0.59 | 15.05 | 26.21 | 9.37 | 24.89 | 1.80 | 33.61 |
Table 4.
AUC values versus (Wt, Wb) for data L.
| Wt | Wb | |||||
|---|---|---|---|---|---|---|
| 5 | 7 | 9 | 11 | 13 | 15 | |
| 3 | 0.8812 | 0.8898 | 0.8790 | 0.8484 | 0.8041 | 0.6838 |
| 5 | 0.9314 | 0.9356 | 0.9056 | 0.8655 | 0.7733 | |
| 7 | 0.9485 | 0.9410 | 0.9135 | 0.8449 | ||
| 9 | 0.9493 | 0.9144 | 0.8744 | |||
Table 5.
AUC values versus (Wt, Wb) for data C.
| Wt | Wb | ||||||
|---|---|---|---|---|---|---|---|
| 15 | 17 | 19 | 21 | 23 | 25 | 27 | |
| 3 | 0.9923 | 0.9992 | 0.9865 | 0.9994 | 0.9997 | 0.9997 | 0.9997 |
| 5 | 0.9994 | 0.9996 | 0.9996 | 0.9996 | 0.9996 | 0.9996 | 0.9996 |
| 7 | 0.998 | 0.9994 | 0.9995 | 0.9995 | 0.9995 | 0.9995 | 0.9995 |
| 9 | 0.9994 | 0.9994 | 0.9995 | 0.9995 | 0.9995 | 0.9995 | 0.9995 |
Table 6.
AUC values versus (Wt, Wb) for data P.
| Wt | Wb | ||||||
|---|---|---|---|---|---|---|---|
| 31 | 33 | 35 | 37 | 39 | 41 | 43 | |
| 1 | 0.9697 | 0.9714 | 0.9725 | 0.9732 | 0.9738 | 0.9741 | 0.9746 |
| 3 | 0.9955 | 0.9958 | 0.9959 | 0.9960 | 0.9954 | 0.9957 | 0.9958 |
| 5 | 0.9941 | 0.9945 | 0.9948 | 0.9945 | 0.9942 | 0.9942 | 0.9945 |
| 7 | 0.9853 | 0.9864 | 0.9874 | 0.9868 | 0.9855 | 0.9845 | 0.9849 |
Table 7.
AUC values versus (Wt, Wb) for data T.
| Wt | Wb | ||||||
|---|---|---|---|---|---|---|---|
| 5 | 7 | 9 | 11 | 13 | 15 | 17 | |
| 3 | 0.9315 | 0.9736 | 0.9832 | 0.7310 | 0.9645 | 0.9440 | 0.9537 |
| 5 | 0.9916 | 0.9934 | 0.9917 | 0.9400 | 0.9487 | 0.9574 | |
| 7 | 0.9935 | 0.9904 | 0.9160 | 0.9277 | 0.9159 | ||
| 9 | 0.9750 | 0.9476 | 0.8347 | 0.8363 | |||
Table 8.
AUC values versus (Wt, Wb) for data S.
| Wt | Wb | ||||||
|---|---|---|---|---|---|---|---|
| 25 | 27 | 29 | 31 | 33 | 35 | 37 | |
| 1 | 0.9747 | 0.9797 | 0.9808 | 0.9798 | 0.9782 | 0.9742 | 0.9723 |
| 3 | 0.9899 | 0.9914 | 0.9921 | 0.9923 | 0.9920 | 0.9900 | 0.9876 |
| 5 | 0.9874 | 0.9893 | 0.9901 | 0.9903 | 0.9896 | 0.9873 | 0.9825 |
| 7 | 0.9881 | 0.9896 | 0.9901 | 0.9896 | 0.9884 | 0.9842 | 0.9802 |
| 9 | 0.9907 | 0.9913 | 0.9907 | 0.989 | 0.9863 | 0.9795 | 0.9740 |
Publisher’s Note: MDPI stays neutral with regard to jurisdictional claims in published maps and institutional affiliations. |
© 2022 by the authors. Licensee MDPI, Basel, Switzerland. This article is an open access article distributed under the terms and conditions of the Creative Commons Attribution (CC BY) license (https://creativecommons.org/licenses/by/4.0/).
Share and Cite
MDPI and ACS Style
Zhang, L.; Ma, J.; Cheng, B.; Lin, F. Fractional Fourier Transform-Based Tensor RX for Hyperspectral Anomaly Detection. Remote Sens. 2022, 14, 797. https://doi.org/10.3390/rs14030797
AMA Style
Zhang L, Ma J, Cheng B, Lin F. Fractional Fourier Transform-Based Tensor RX for Hyperspectral Anomaly Detection. Remote Sensing. 2022; 14(3):797. https://doi.org/10.3390/rs14030797
Chicago/Turabian StyleZhang, Lili, Jiachen Ma, Baozhi Cheng, and Fang Lin. 2022. "Fractional Fourier Transform-Based Tensor RX for Hyperspectral Anomaly Detection" Remote Sensing 14, no. 3: 797. https://doi.org/10.3390/rs14030797
Note that from the first issue of 2016, this journal uses article numbers instead of page numbers. See further details here.