
Rapid Inspection of Large Concrete Floor Flatness Using Wheeled Robot with Aided-INS
by
 , , ,
, , ,
Zhipeng Chen
1,2,3,4 ,
,
Qingquan Li
2,3,4,5,*,†,
Weixin Xue
1,2,3,4,
Dejin Zhang
1,2,3,4,
Siting Xiong
2,3,4,5,
Yu Yin
2,3,4,5 and
Shiwang Lv
2,3,4,5,† 1
School of Architecture and Urban Planning, Shenzhen University, Shenzhen 518060, China
2
Guangdong Key Laboratory of Urban Informatics, Shenzhen University, Shenzhen 518060, China
3
MNR Key Laboratory for Geo-Environmental Monitoring of Great Bay Area, Shenzhen University, Shenzhen 518060, China
4
Shenzhen Key Laboratory of Spatial Smart Sensing and Services, Shenzhen University, Shenzhen 518060, China
5
College of Civil and Transportation Engineering, Shenzhen University, Shenzhen 518060, China
*
Author to whom correspondence should be addressed.
†
These authors contributed equally to this work.
Remote Sens. 2022, 14(7), 1528; https://doi.org/10.3390/rs14071528
Submission received: 31 January 2022
/
Revised: 6 March 2022
/
Accepted: 14 March 2022
/
Published: 22 March 2022
(This article belongs to the Special Issue GPS/INS and Mapping Techniques for Environmental and Infrastructure Monitoring)
Abstract
:Flatness is an important parameter for the quality assessment of concrete floors. Traditional flatness inspection methods have problems with sparse sampling and low efficiency for large concrete floors. In this paper, a rapid flatness inspection method for large concrete floors based on a wheeled robot with an aided inertial navigation system (INS) is proposed. The robot realizes high precision relative to the three-dimensional profile measurement of concrete floors through fusion of INS, odometers and total station. The overall measurement of concrete floor flatness is realized through a certain density of profiles. The measurement performance of the proposed method has been tested in laboratory, and the effectivity is tested in the flatness inspection of the concrete base of an ice floor in the National Speed Skating Oval of 2022 Beijing Winter Olympic Games. The results demonstrate that the floor flatness inspection accuracy can meet the requirement of ±0.5 mm over 5 m and the efficiency is several times that of the traditional method. This technology is promising for high precision and rapid flatness inspection of large floors.
1. Introduction
The floor is the basis of goods storage, transportation and people’s activities [1]. Floor flatness is of great significance in ensuring the stability of moving objects and to avoid damage caused by uneven or excessively inclined floors. It also affects the visual effect of the ground. Flatness is one important parameter for evaluating the quality of concrete floors. With the development of the economy, the number of floor constructions and holdings has become larger and larger, and the area of a single floor has also shown an increasing trend. For example, large sports stadiums and large logistics warehouses have a floor area of several ten thousand square meters, and the flatness requirements become higher and higher. Fast floor flatness inspection technology is urgently needed by the industry for the construction and operation of large floors.
There are several methods for floor flatness inspection. These methods can be divided into two categories, i.e., the contact type and the non-contact type [2], according to the relative relationship between the measuring device and the floor. The contact type means that the instrument directly contacts the floor to collect relevant data and includes the straightedge method [3], the leveling method [4] and the profiler method [5,6,7]. The straightedge method uses a feeler gauge to measure the gap width between the straightedge and the floor. It is widely used because it is easy to understand and inexpensive. The efficiency is low so that it is only suitable for sparse point sampling inspection. In addition, there is no specification on how to locate the straightedge on the surface, resulting in low repeatability in practice. The leveling method uses a leveling gauge to measure the relative height of the floor. It is easy to conduct, but the degree of automation is low so that it is not suitable for a large floor. In order to improve the repeatability of the flatness measurement method, the American Society for Testing and Materials (ASTM) introduced the industry standard ASTM E1155 for floor shape measurement and proposed a quantitative measurement method based on the profiler. The profiler is a measuring instrument with two feet at the bottom. It walks along the planned route. The horizontal angle of the instrument is measured by inclinometer. Since the distance between the feet is known, the height between the feet can be calculated. Then, the F-number standard algorithm [5] is used to calculate the corresponding index according to the average and standard deviation of the height difference. It has the advantages of high repeatability high automation. However, only the overall flatness of the floor can be evaluated, and the local flatness of any position on the floor cannot be known. Kangs et al. [8] combined a concrete vibrating trowel with various sensors such as displacement, speed and angle sensors, to analyze and evaluate the flatness of uncured concrete surfaces. However, this method uses mechanical boom support and drives a vibrating trowel and multiple sensors. The measurement area is limited by the length of the boom; hence, it is not suitable for measuring the flatness of a large floor. Therefore, the current contact type methods generally have the problems of sparse measurement points and low efficiency. In addition, the contact type methods cannot obtain the location of the inspection data. It is not beneficial for the subsequent further repair of over-limit flatness, which is critical in the construction or maintenance of large-scale floors.
The non-contact type flatness inspection method refers to measurement through technology such as photogrammetry [9,10], three-dimensional laser scanning [11,12,13,14,15,16], etc. Photogrammetry uses a camera to capture the target from different perspectives and calculates the three-dimensional coordinates of the target with a high accuracy. The vertical and horizontal accuracy can reach up to one tenth of a millimeter [10]. However, this method requires cooperating markers set on the ground. This step is very time-consuming for super-large floors and will have certain impact on the construction. LiDAR is a common instrument for intensive and accurate three-dimensional shape scanning. There are existing flatness quality evaluation methods for cast-in-place ground and prefabricated components [11]. It can be integrated with BIM (building information model) with high accuracy and large data volume [14]. However, the farther the distance, the sparser the point cloud. The density and accuracy of the point cloud at a long distance cannot meet the requirements for flatness quality inspection, which limits the measurement range. The effective measurement distance of LiDAR is only about 20 m from the scanner because of the low scan density and high incident angle of laser beams [16]. It is more suitable for small areas and rooms. In addition, the non-contact type method has the problem of being easily blocked. Therefore, it is necessary to change the position of the instrument many times, which will introduce registration errors into the flatness measurement. On the whole, the existing methods have various problems and cannot satisfy the requirements of rapid inspection for the flatness of large floors.
Aiming at rapid and high-precision flatness inspection of large indoor floors, we propose a large-scale floor flatness inspection method based on wheeled robot with aided INS (Inertial Navigation System). Specifically, the wheeled robot integrates high-precision INS, odometers, and prism, and an automatic tracking total station is used to track the prism on the robot to obtain its planar position at the same time. Through a certain travel routine, we can achieve the measurement of the relief of large floor surface. In order to comprehensively utilize the complementary advantages of INS, odometers, and total station, we closely integrate data from them to achieve rapid, high-precision flatness measurement. The abnormal flatness locations are finally detected. This method can provide support for the quality inspection of larger floors and guide the adjustment of flatness. The main contributions of this paper are as follows:
- (1)
- A rapid measurement method of floor flatness based on the fusion of INS, odometers and total station is proposed, which is suitable for high-precision and rapid inspection of large floors.
- (2)
- We designed a high-precision wheeled robot for rapid floor flatness inspection. We also introduced the multiple sensors integrated method and estimated the measurement accuracy of the robot.
- (3)
- Laboratory tests and engineering applications for the National Speed Skating Oval of the 2022 Beijing Winter Olympics have verified the effectiveness of the proposed method.
The rest of this paper is arranged as follows. Section 2 introduces the wheeled flatness measurement robot and the data processing methods. We then verified our method and equipment through experiments in Section 3. We also introduced our application of this method in the acceptance inspection of the floor of the National Speed Skating Oval. The advantages, limitations, and other details of this method are discussed in Section 4. Finally, we summarize the content of this paper in Section 5.
2. Methods
2.1. Overview
The essence of floor flatness inspection is to measure the height deviation within a local area. Inspired by the principle of measuring flatness with the straightedge and the feeler gauge, we proposed an idea of first measuring the relief of the floor within a certain length range, then constructing a virtual baseline, and finally calculating the flatness. The measurement principle is shown in Figure 1.
Inertial measurement [17] is an emerging technology for structural shape measurement which has a high accuracy of acceleration and rotation measurement over a short time. It utilizes a platform with inertial sensors which move on the surface of a target object to realize the measurement. However, the position error of INS will drift and diverge quickly. Therefore, other information is needed to correct it. An odometer is a commonly used speed sensor which can accurately measure the speed of the platform by recording the rolling angle of the measuring wheel. The speed measurement error of the odometer does not diverge over time. Therefore, it can be used to correct the speed of INS to suppress its divergence rate. When the odometer is in an abnormal status such as slipping, the displacement estimated by the inertial navigation system can be used to compare with the odometer, and the abnormal status can be identified. However, the INS and odometer integrated navigation system is still a dead reckoning position system [18]. Its position error will continue to increase as time increases. Therefore, it needs to be corrected by global control points. These can be achieved by measurements from the automatic tracking total station, which has the function of continuous tracking measurement. The point measurement accuracy can reach the millimeter level [19]. The global positioning from total station can effectively correct the drift error of INS.
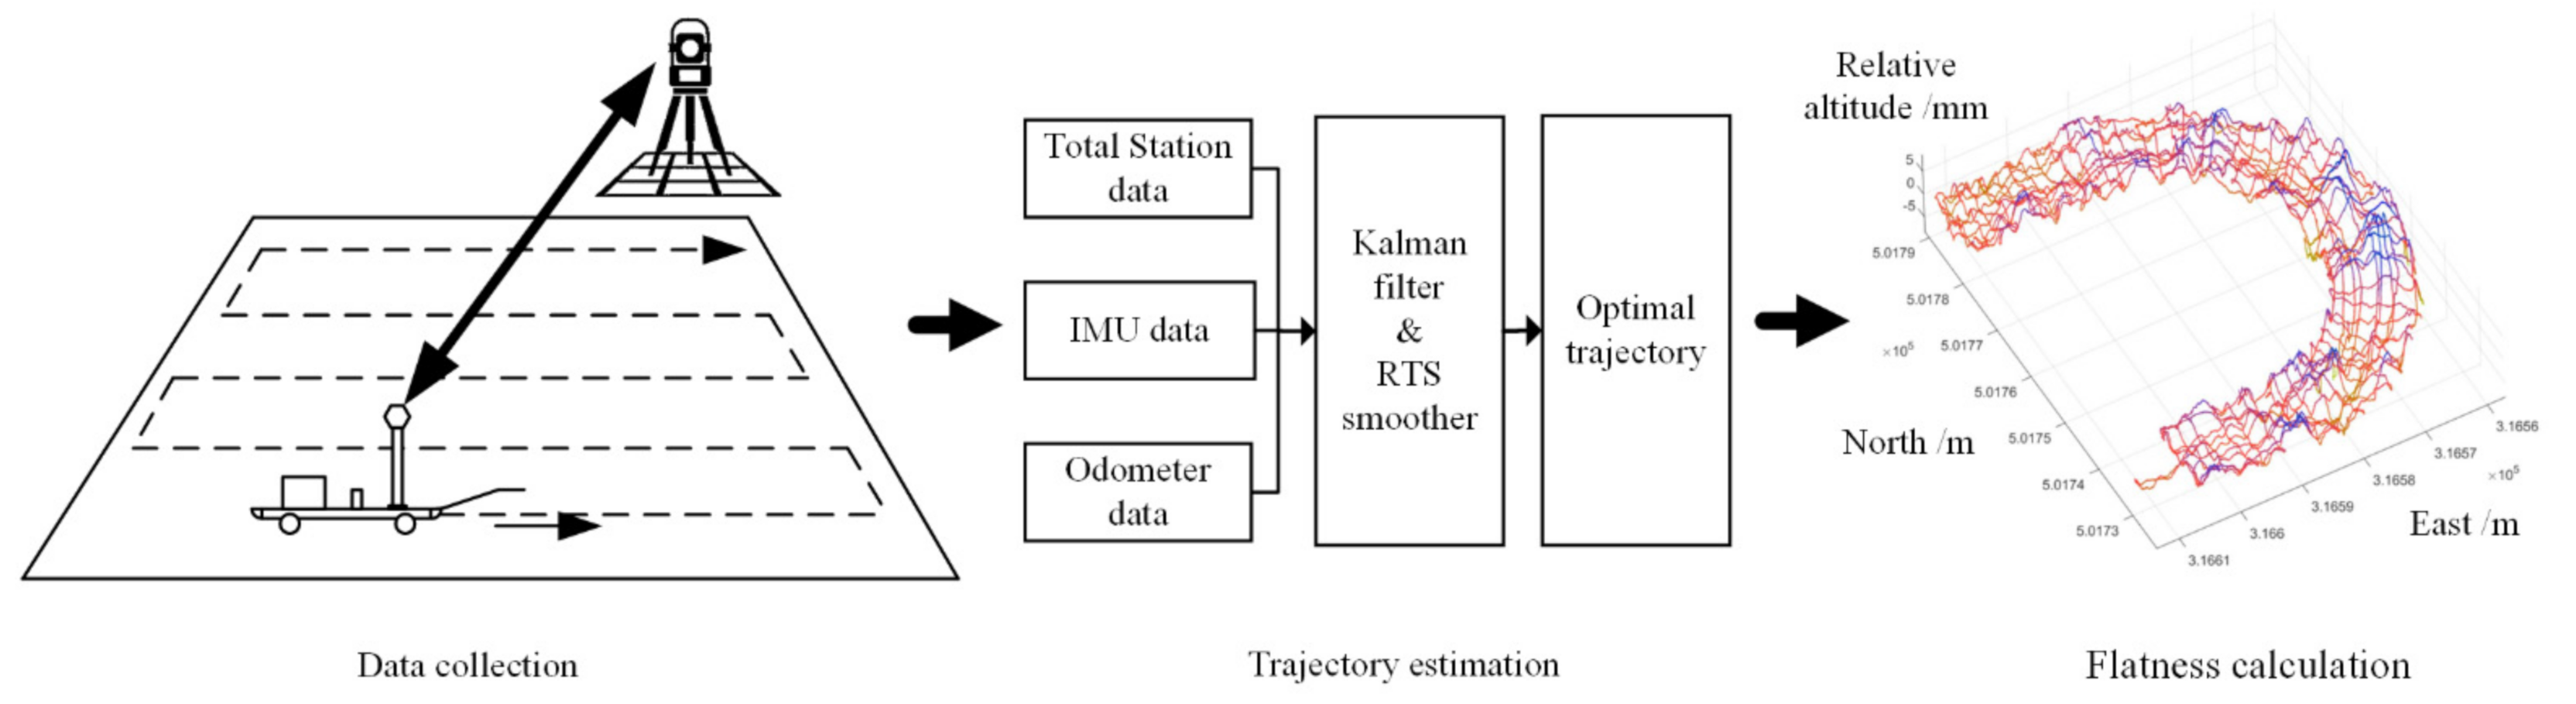
The workflow of proposed rapid flatness inspection method is shown in Figure 2, which can be divided into three phrases: data collection, trajectory estimation and flatness calculation. Before data collection, we planned a suitable measurement route, and then moved the wheeled robot with aided INS along the route to measure the relief of the super-large floor. The moving speed is measured by odometer, and the global position is tracked by the total station. The trajectory of the measuring trolley is estimated by the optimal fusion of multi-source data through Kalman filter and Rauch-Tung-Striebel (RTS) smoother [20]. The floor flatness index is estimated based on the trajectory. The results are finally rendered into a map and provided to the user.
2.2. Wheeled Robot for Flatness Inspection
2.2.1. System Design
The wheeled robot designed in this paper is shown in Figure 3. It is mainly composed of two parts: the moving platform and the measuring module. The moving platform includes 1 type I roller, 2 type II rollers fixed with odometers, a frame and a T-type hand push rod. The I-type roller rotates around a vertical support shaft to adjust the moving direction of the wheeled robot. The two type II rollers are symmetrically distributed. Their height is the same as that of the I type roller. The data measurement device includes a main control module, an INS, two odometers fixed on the type II rollers and a total station prism on the robot body. The INS is used to record the acceleration and angular velocity. The odometers are used to measure the speed of the robot. The prism cooperates with the total station to record the three-dimensional coordinates of the wheeled robot. The main control module ensures the INS and odometers collect the raw data synchronously. The specific parameters of INS, odometers and total stations are listed in Table 1.
According to the configuration of sensors on the robot, its measurement performance can be preliminarily evaluated according to the measurement principle. A high-precision INS with gyroscope bias of 0.01 °/h and accelerometer bias of 50 ug is applied. According to the measurement principle, the accuracy of the height difference measurement is mainly affected by the accuracy of the pitch angle. Therefore, the measurement accuracy of the system is estimated as follows:
- (1)
- Assuming that the acceleration bias is and the gravity is g, the initial error of the pitch angle is calculated as follows:
- (2)
- Assuming that the robot’s movement speed is 1 m/s and the inspection baseline is 5 m long, the integral error of horizontal angle caused by gyroscope is calculated as follows:
- (3)
- Therefore, the horizontal angle error on each survey line section is calculated as follows:
- (4)
- Assuming that the inspection baseline is 5 m, the relative height difference accuracy is calculated as follows:
Therefore, based on the above estimation, the accuracy of the proposed measuring robot in this paper can reach 0.25 mm/5 m at least in theory. It can meet the accuracy requirement for large floor inspection, which is 0.5 mm over 5 m.
2.2.2. Robot Implementation and Multiple Sensors Integration
The sensors used in the robot have their own temporal and spatial referencing systems. Their measurements should be converted to one uniform temporal to produce consistent measurements. To this end, we designed a multiple-sensor integrated data acquisition system, which is composed of a field programmable gate array (FPGA) control core, a high-precision time reference source, INS, odometers, upper computer and other modules. The framework of the multi-sensors integrated system is shown in Figure 4. The system uses a high-voltage, temperature-controlled and compensated quartz crystal as the system time reference source. We use time as the trigger source to control the sensor’s synchronous data collection and upload. The upper computer sends the acquisition control instruction to the FPGA through the universal asynchronous receiver/transmitter (UART). After the FPGA receives the instruction, it uploads the measurement data to the upper computer according to the protocol in real time through the USB to serial port module for analysis and storage. The trans-flash (TF) card and WiFi are used as data storage and transmission module.
For the spatial reference, we defined two coordinate frames, i.e., the body frame and the navigation frame (Figure 3a). The body frame is a right-hand frame with its origin fixed on the robot frame center O(b), the x-axis pointing to the right and the yaxis pointing to forward. This frame is short for the b-frame. The navigation frame is a local-level right-hand frame with the x-axis pointing to the east direction and the y-axis pointing to the north direction. This frame is short for the n-frame. The raw data collected from sensors on the robot are expressed in the body frame. The measurement data from total station is expressed in the navigation frame. The frame of a variable is denoted as a superscript; for example, velocity of the body frame is denoted as , offset and rotation from the a frame to the b frame are denoted as variable with subscript and superscript, such as .
Due to the long distance between the robot and the total station, it is difficult to perform an accurate time synchronization between these two systems by hardware. We applied a post-data synchronization to data obtained from the total station and the wheeled robot. The moving speed of the robot can be calculated by the distance and time difference between the track points measured by the total station. It can also be measured by the odometer. Therefore, we could accurately estimate the time offset between the two speeds through mobile correlation registration [21] and realize the synchronization of the measurement data from the total station and the wheeled robot (Figure 5).
2.3. Data Processing
2.3.1. Motion Trajectory Estimation
Estimating the trajectory of wheeled robots is the key to flatness inspection. The core algorithm for estimating the trajectory is shown in Figure 6. It ingests three types of measurements, i.e., the inertial measurement from INS, three-dimensional coordinates data observed by the total station and speed obtained by the odometers. These measurements are input in a Kalman filter which recursively returns corrections for INS and output the position/velocity and attitude. Then the output and intermediate information is input into RTS smoother to optimize the estimated trajectory.
The state vector refers to a vector in a Kalman filter describing the system state. For an aided INS measurement system, it is essential to estimate the navigation states (including the attitude, position, and velocity), inertial sensor errors, and aiding sensor errors, which are the odometer-scale coefficient errors in this paper. Therefore, we adopted a 17-dimension state vector to represent the instantaneous state of the robot. The state vector is shown in the following equation:
where denotes the attitude error vector, is the velocity error vector, is the position error vector, is the residual gyroscope bias, is the residual accelerometer bias, and is the scale coefficient errors of the two odometers.
We used a dynamic model to describe the changing of the system state. In this paper, the navigation state and biases of inertial sensors and the time-varying rule for odometer scale factors are modeled. The classic phi angle error model [22] is used for navigation error modeling. The navigation error equation can be expressed as follows:
where indicates the attitude matrix from the body frame to the navigation frame; is the error of the angular rate; is the angular velocity of the navigation frame with respect to the inertial frame expressed in navigation frame; is the measured specific force; is the error of a specific force; is the local gravity error; is the angular rate of the earth-fixed frame with respect to the inertial frame; is the angular rate of the navigation frame with respect to the earth-fixed frame; is the rotation error of calculated navigation frame with respect to the true navigation frame.
Since the robot adopts a high-precision INS with a low sensor nonlinearity and the robot moves at a low speed (<2 m/s), we only considered the bias errors. The first-order random Markov model is used to describe the inertial sensor bias error dynamics as presented in the following equations:
where and is the correlation time parameters of gyroscope and accelerometer, respectively, and and are the process noise.
Due to the uniform force exerted on the odometer wheels, the scale factor of odometer remains unchanged. Therefore, the dynamics of odometer scale coefficient error is modeled as the random constant via Equation (11).
The velocity of the INS is obtained through the integral of acceleration. Due to the bias and random error of the accelerometer, the velocity error increases with time until it diverges, so the relative accuracy of the curve measurement cannot be guaranteed. Tow odometers are used to obtain reliable and precise velocities to assist INS, which can effectively improve the relative accuracy of curve measurements. The measurement model of the odometers is shown in the following equation:
where represents the predicted vehicle frame velocity and refers to the vehicle frame velocity measured by the odometer.
In addition, as the robot moves on the floor, the wheel only has the forward speed in the vehicle body frame, so nonholonomic constraints (NHC) [23] can be used. The constraint measurement model can be expressed as Equation (13).
where and is the forward component of vehicle body frame velocity.
To improve the absolute accuracy of the curve measurements, the global position tracked by total station is also fused. The control point measurement model can be expressed as:
where denotes the predicted control point coordinates, represents the measured coordinates of the prism on the robot, is the predicted position of robot, is the estimated attitude matrix, is the position vector of the prism on the robot with respect to the INS, and denotes the measurement noise of the total station. The errors of INS can be corrected effectively through Equations (12)–(14).
The Kalman filtering result is the optimal estimation of the system state by using the measurements collected up to current time. To estimate the optimal trajectory with all the measurements, RTS smoothing is applied for the Kalman filtering results, and an optimal postprocessing solution can be obtained with significantly better precision than that of the filtering solution. The smoothed solution includes navigation states (i.e., position, velocity and attitude) of the robot at each sampling time, which formed the trajectory of robot.
2.3.2. Flatness Calculation and Analysis
After the trajectory of the wheeled robot is estimated, the flatness of the floor is further calculated. According to the definition of flatness in this paper (Figure 2), it only needs to analyze the relative height in a local area. In order to facilitate the calculation, we first convert the three-dimensional discrete trajectory points into a one-dimensional distance-height curve. Therefore, we first calculate the distance-height curve of the measurement route, supposing the distance and height of the starting point is zero. The mileage and the height of each point along the measurement route are recursively deduced according to the body frame speed and pitch angle at time , and the sampling time interval ∆t of the INS. The calculation is shown in Equation (15),
where is the distance traveled by the n-th trajectory point at time , is the height relative to the starting point, and is the body frame velocity, which can be calculated from the navigation speed and attitude. The data sampling frequency of the IMU is as high as hundreds of hertz, and the amount of data is large. Therefore, it is necessary to resample the waypoints. The equidistant resampling method is used to resample the distance–height curve, and the sampling interval is set to 0.1 m, which can greatly reduce redundant points and speed up data calculation.
After obtaining the distance–height curve, the flatness index can be calculated according to the flatness definition. The specific steps are as follows: (1) For any point on the resampled measurement route, it is used as the midpoint to intercept a local window of length L on the distance–height curve. The two points before and after the middle point of L/2 are truncated. (2) We calculate the difference between the maximum height , minimum height and average height of all points in the local window to obtain the maximum peaks and the maximum depression . Its meaning is the maximum fluctuation of the waypoint height in the local window relative to the average height of the window. (3) The largest absolute value of and is taken as the flatness index at the center point . The calculation formula of is shown in Equations (16):
The flatness of a floor is measured in a gridded way. A two-dimensional flatness raster can then be produced by bilinearly interpolating the gridded samples into a refined flatness. To evaluate the overall quality of the floor, statistical analysis is performed on flatness of different grades. Generally, the flatness can be divided into several grades according to the difference between the measured flatness and the qualified flatness threshold, and the percentage of different grade inspection points are calculated. Taking the qualified points and the over-limit points as the scoring basis, the overall evaluation of the floor quality can be realized.
3. Results
In order to validate the proposed method, we constructed an experimental system (Figure 3) and tested its repeatability and accuracy. After the test, we applied this system to the completion acceptance project of the National Speed Skating Oval of the 2022 Beijing Winter Olympics.
3.1. Wheeled Robot Performance Testing
The performance of the flatness measuring robot is primarily evaluated by the height repeatability and the relative height accuracy of the surveying route. The layout is a grid of 3 rows and 5 columns. Five points in each row are separated by 3 m, and three points in each column are 2 m apart. There are 15 path points in total on the test site, as shown in Figure 7.
3.1.1. Repeatability of Relative Height Measurement
First, we used a total station to measure the horizontal position of each path point. Then, we designed a leveling route and used a leveling instrument and a leveling ruler to measure the relative height between the path points as the true value. Finally, the flatness measuring robot was used to perform multiple repetitive measurements along the same route in the same field, as shown in Figure 7a. During the test, the robot passes through all edge path points in a clockwise direction and a counterclockwise direction, respectively. A total of two sets of data are measured, and each dataset is implemented in a clockwise or counterclockwise direction for three rounds, a total of six rounds. We made repeatability statistics on the deviation of each set of measurement curves in the vertical direction. Finally, the repeatability statistics were performed on the distance–height curve of the six sets of measurement data, and the height measurement repeatability of the flatness measurement robot was obtained, as shown in Figure 7b. The results show that the total length of the measurement route is about 193 m, and the average height repeatability is about 1.9 mm.
3.1.2. Accuracy of Relative Height Measurement
We used the wheeled robot to perform multiple measurements in the same site, as shown in Figure 8. The route of the robot should pass through all path points, and each measurement route includes two mutually perpendicular S-shaped routes, thus forming a grid. A total of two sets of data were obtained, and each dataset contained a grid of measurement routes, with a total of two rounds. First, we used the Trimble Dini 0.3 electronic leveling instrument [24] to measure the closed route. The closing error of the leveling route is 0.67 mm. Then, the elevation data obtained by the wheeled robot was compared and analyzed with that of the leveling measurement, as shown in Table 2. According to the check results of the relative elevation of the 15 path points, the calculated median errors of the difference between the two sets of data are 1.2 mm and 0.8 mm, respectively. The lengths of the two sets of leveling routes are 101 m and 74 m, respectively. The relative median errors are calculated to be 1/84,167 and 1/92,500, respectively, which is about 1/85,000 on average. Therefore, the flatness measuring robot proposed in this paper has a high accuracy.
3.2. Flatness Inspection for National Speed Skating Oval
The National Speed Skating Oval, or the Ice Ribbon, is in the Olympic Park in Chaoyang District, Beijing. It is the new ice competition venue for the Beijing 2022 Winter Olympics. It has the largest all-ice design in Asia with an ice area of 12,000 square meters (Figure 9).
The top layer of ice board is lying on a concrete base, which is the upper layer on the refrigeration tubes. A flat concrete base is crucial for guaranteeing the even temperature of ice surface. According to the requirements of the International Skating Union, the ice surface temperature difference of speed skating venues shall not exceed 1.5 degrees Celsius. The smaller the temperature difference, the more uniform and smoother the ice surface hardness, which is also conducive to athletes’ good results. Therefore, the flatness of the concrete foundation needs to be inspected at the last stage of the construction to assist final stage adjustment before its completion.
According to the official standard documents and the project requirement of the National Speed Skating Oval [25], height difference of the concrete base should be less than ±3 mm over 5 m. The inspection result lays the foundation for the follow-up project. We conducted the acceptance flatness inspection of the large concrete floor in December 2021.
3.2.1. Measurement Route Planning
The inspection robot measures the relative height of profile along its path, so it can only reflect the flatness of each point on its route. For a wide rectangle floor, the route of the robot is planned in a grid way as shown in Figure 10a. For a long and narrow sports runway, the route is planned along the direction of the runway (Figure 10b).
3.2.2. Measurement Results
For good visibility conditions, the total station is set on the auditorium when taking measurement. The area to be tested is divided into four areas: the racetrack, the practice track, the north inner rink, and the south inner rink. The distribution of inspection route of the National Speed Skating Oval is shown in Figure 11, and the measurement results of the four areas are shown in Figure 12. For most of the areas, we use grid lines of 2–3 m width for data acquisition. The total length of the measurement route is about 10,261 m. The total measurement time is about 4.88 h. The measurement speed reached about 2 km/h and the number of final flatness inspection points is about 102,000. Traditionally, surveying such a large floor by using leveling methods needs 2–3 days. It can be seen that the efficiency of our method is increased by about four times.
The measurement results show that the measured flatness of 99.4% sampling points over the standard speed skating track is within ±3 mm over 5 m. This number is 99.3%, 99.7% and 99.3% over the practice track, the north inner rink and south inner rink, respectively. It should be noted that there are some sampling points which measured to be over-limit in an extremely small area on the southwest of the standard speed track and the practice track. Overall, the floor flatness of the National Speed Skating Oval meets the design requirements. The final temperature difference is less than 0.5 degrees Celsius [26], which proves the good quality of the ice making system. It fully meets the requirements of the International Skating Union.
4. Discussion
The flatness inspection of super-large floors, such as the National Speed Skating Oval, requires very accurate and efficient measurement and poses challenges to traditional measurement methods. The aided INS measurement technology has the advantage of high relatively measurement accuracy and continues measurement. The INS aided by precise odometers can ensure high-precision measurement of local relief of the ground, and the total station can achieve effective position control of the large-scale measurement accuracy. The combination of the INS, odometer and total station can ensure large-scale, high-precision measurement results. For measurement targets of different shapes, different survey routine can be used, and multiple survey lines form a network, like a mesh grid to describe the flatness of any shape of ground.
Compared with the traditional contact measurement method, the proposed method can measure the floor continuously and result in a very dense sampling points on the survey line. The measurement process is completely automated, free from operator’s intervention. Therefore, it has high measurement repeatability. In addition, the measurement results also have global coordinates, which can give a unified location to each flatness inspection datapoint. The measurement efficiency mainly depends on the speed of the mobile platform. It has several times the efficiency improvement compared with the traditional method. Over-limit locations found in the inspection can be accurately adjusted in time at the final stage to ensure a high-standard construction.
Accuracy is the most important issue of the inspection method. Due to the laser scanning polar coordinate measurement principle, the farther the measurement target is, the worse its accuracy will be. The laser scanning method requires multiple measurement stations for large floor inspection. In addition, the accuracy of measurement points in one station is inconsistent. Although the measurement sampling points of our proposed method are sparse in one direction, it has the advantage that it can measure the whole field at once compared with the laser scanning method. The measurement scope mainly depends on the tracking range of the total station. Therefore, our method is more flexible. The local accuracy of the method in this paper mainly depends on the accuracy of the gyroscope of INS, so it also has the advantage of uniform accuracy.
In addition, the total station in our method is mainly used for the correction of the horizontal position of the INS and the restriction of the drift of INS in vertical direction in large scale. Therefore, the total station does not need to have high measurement accuracy. The centimeter-level measurement accuracy and a measurement frequency of are sufficient to meet the flatness measurement requirements. At the same time, due to the unpredictable obstruction on the construction site, the total station will sometimes be lost on the site. The short-term loss will not affect the flatness measurement because odometer-aided INS can keep the accuracy for a short time.
5. Conclusions
In response to the quality requirements for the rapid inspection of super-large concrete floors, the traditional methods are inefficient and cannot fully reflect the state of the ground flatness. We invented a wheeled inertial flatness measurement method and system, which integrates high-precision odometers, INS and tracking total stations to realize the relative three-dimensional curve measurement of the floor. It can realize floor flatness inspection through a certain density of line grid measurement. After testing in campuses and the application of the National Speed Skating Oval, the results show that the measurement accuracy of the floor flatness can reach up to ±0.5 mm over 5 m distance, which fully meets the completion acceptance requirements of the super-large floor flatness. The efficiency is several times that of the traditional leveling method. With the proposed method and system, not only can the overall flatness quality of the floor be evaluated, but also the over-limit locations can be detected, and the floor can be adjusted or repaired before the construction of the ice board. It has the potential to be one standard method for large-scale floor flatness inspection.
Limitations of our proposed method and system should be mentioned at last. The cost of the INS currently used is relatively high. The feasibility of substituting it with a low-cost INS will be explored later. In addition, an autopilot system can be developed in the future for the automatic driving of the robot, enabling a more automatic flatness inspection.
Author Contributions
Conceptualization, Q.L. and Z.C.; methodology, Z.C., Y.Y. and S.L.; software, Z.C. and S.L.; validation, Z.C., Y.Y. and S.L.; formal analysis, Z.C. and S.L.; investigation, Z.C., Y.Y. and S.L.; resources, Q.L.; writing—original draft preparation, Z.C., S.L. and W.X.; writing—review and editing, Z.C., S.X., S.L. and Y.Y.; visualization, Y.Y. and S.L.; supervision, Q.L.; project administration, Q.L. and Z.C.; funding acquisition, Z.C. and D.Z. All authors have read and agreed to the published version of the manuscript.
Funding
This research was funded by the China Natural Science Foundation (grant number U1934215,41901412) and the National key research and development plan (2020YFC1512001,2019YFB2102703).
Institutional Review Board Statement
Not applicable.
Informed Consent Statement
Not applicable.
Data Availability Statement
Not applicable.
Acknowledgments
Thanks for the support of Jiulin Li and Liming Chen from National Speed Skating Oval, Chao Tang from Beijing urban construction exploration & surveying design research institute co., LTD, Qingzhou Mao and Tingli Fan from Wuhan University.
Conflicts of Interest
The authors declare no conflict of interest.
References
- General Administration of Sport of China. Technical Requirements and Test Methods for Natural Material Sports Field Part 3: Ice Rink; Standards Press of China: Beijing, China, 2006. [Google Scholar]
- Kim, M.-K.; Wang, Q.; Li, H. Non-Contact Sensing Based Geometric Quality Assessment of Buildings and Civil Structures: A Review. Autom. Constr. 2019, 100, 163–179. [Google Scholar] [CrossRef]
- British Standards Institution (BSI). BS 8204—Screeds, Bases and In Situ Flooring; BSI: London, UK, 2009. [Google Scholar]
- Henry, R.S.; Ingham, J.M. Field Measurements of Concrete Floor Surface Regularity. In Proceedings of the The New Zealand Concrete Industry Conference, Wellington, New Zealand, 7–9 October 2010; p. 9. [Google Scholar]
- ASTM International. ASTM E 1155-96-Standard Test Method for Determining FF Floor Flatness and FL Floor Levelness Numbers; American Concrete Institute: Detroit, MI, USA, 2001; Volume 4.11. [Google Scholar]
- American Concrete Institute (ACI). Specification for Tolerances for Concrete Construction and Materials and Commentary; American Concrete Institute: Farmington Hills, MI, USA, 2010. [Google Scholar]
- Steffey, D.; Uriz, P.; Osteraas, J. Using ASTM E1155 to Determine Finished Floor Quality: Minimum Sampling Requirements Used to Establish Compliant Floor Flatness and Levelness. In Forensic Engineering; American Society of Civil Engineers: San Francisco, CA, USA, 2012; pp. 605–612. [Google Scholar]
- Kangas, M.A. Concrete Screeding System with Floor Quality Feedback/Control. U.S. Patent 9,835,610, 2017. [Google Scholar]
- Hutchinson, T.C.; Chen, Z. Improved Image Analysis for Evaluating Concrete Damage. J. Comput. Civ. Eng. 2006, 20, 210–216. [Google Scholar] [CrossRef]
- Zhu, Z.; Brilakis, I. Machine Vision-Based Concrete Surface Quality Assessment. J. Constr. Eng. Manag. 2010, 136, 210–218. [Google Scholar] [CrossRef]
- Nuikka, M.; Rönnholm, P.; Kaartinen, H.; Kukko, A.; Suominen, A.; Salo, P.; Pöntinen, P.; Hyyppä, H.; Hyyppä, J.; Haggrén, H.; et al. Comparison of Three Accurate 3D Measurement Methods for Evaluating As-Built Floor Flatness. Int. Arch. Photogramm. Remote Sens. Spat. Inf. Sci. 2008, B5, 129–134. [Google Scholar]
- Tang, P.; Huber, D.; Akinci, B. Characterization of Laser Scanners and Algorithms for Detecting Flatness Defects on Concrete Surfaces. J. Comput. Civ. Eng. 2011, 25, 31–42. [Google Scholar] [CrossRef]
- Bosché, F.; Guenet, E. Automating Surface Flatness Control Using Terrestrial Laser Scanning and Building Information Models. Autom. Constr. 2014, 44, 212–226. [Google Scholar] [CrossRef]
- Li, D.; Liu, J.; Feng, L.; Zhou, Y.; Liu, P.; Chen, Y.F. Terrestrial Laser Scanning Assisted Flatness Quality Assessment for Two Different Types of Concrete Surfaces. Measurement 2020, 154, 107436. [Google Scholar] [CrossRef]
- Kim, M.-K.; Thedja, J.P.P.; Wang, Q. Automated Dimensional Quality Assessment for Formwork and Rebar of Reinforced Concrete Components Using 3D Point Cloud Data. Autom. Constr. 2020, 112, 103077. [Google Scholar] [CrossRef]
- Li, F.; Li, H.; Kim, M.-K.; Lo, K.-C. Laser Scanning Based Surface Flatness Measurement Using Flat Mirrors for Enhancing Scan Coverage Range. Remote Sens. 2021, 13, 714. [Google Scholar] [CrossRef]
- Niu, X.; Chen, Q.; Kuang, J.; Liu, J. Return of Inertial Surveying-Trend or Illusion? In Proceedings of the 2016 IEEE/ION Position, Location and Navigation Symposium (PLANS), Savannah, GA, USA, 11–14 April 2016; pp. 165–169. [Google Scholar]
- Groves, P.D. Principles of GNSS, Inertial, and Multi-Sensor Integrated Navigation Systems; Artech House: Boston, MA, USA; London, UK, 2008; ISBN 978-1-58053-255-6. [Google Scholar]
- Leica Nova TS60-World’s Most Accurate Total Station. Available online: https://leica-geosystems.com/products/total-stations/robotic-total-stations/leica-nova-ts60 (accessed on 2 January 2022).
- Särkkä, S. Bayesian Filtering and Smoothing; Cambridge University Press: Cambridge, UK, 2013; ISBN 1-107-03065-X. [Google Scholar]
- Knapp, C.; Carter, G. The Generalized Correlation Method for Estimation of Time Delay. IEEE Trans. Acoust. Speech Signal Process. 1976, 24, 320–327. [Google Scholar] [CrossRef] [Green Version]
- Shin, E.-H. Estimation Techniques for Low-Cost Inertial Navigation; Doctor: Calgary, AB, Canada, 2005. [Google Scholar]
- Dissanayake, G.; Sukkarieh, S.; Nebot, E.; Durrant-Whyte, H. The Aiding of a Low-Cost Strapdown Inertial Measurement Unit Using Vehicle Model Constraints for Land Vehicle Applications. IEEE Trans. Robot. Autom. 2001, 17, 731–747. [Google Scholar] [CrossRef] [Green Version]
- Trimble DiNi Level|Digital Levels|Trimble Geospatial. Available online: https://geospatial.trimble.com/products-and-solutions/trimble-dini-level (accessed on 27 January 2022).
- LI, J.; Xu, H.; Tang, C. Key technology of dynamic high-precision construction measurement in National Speed Skating Oval and its application. Bull. Surv. Mapp. 2021, 8, 123–128. [Google Scholar] [CrossRef]
- National Speed Skating Oval Aims to Produce “Fastest” Ice for Skaters at Beijing 2022. Available online: https://www.beijing2022.cn/wog.htm?cmsid=MHI2021111500663300 (accessed on 27 January 2022).
Figure 1.
Flatness and its measurement principle.
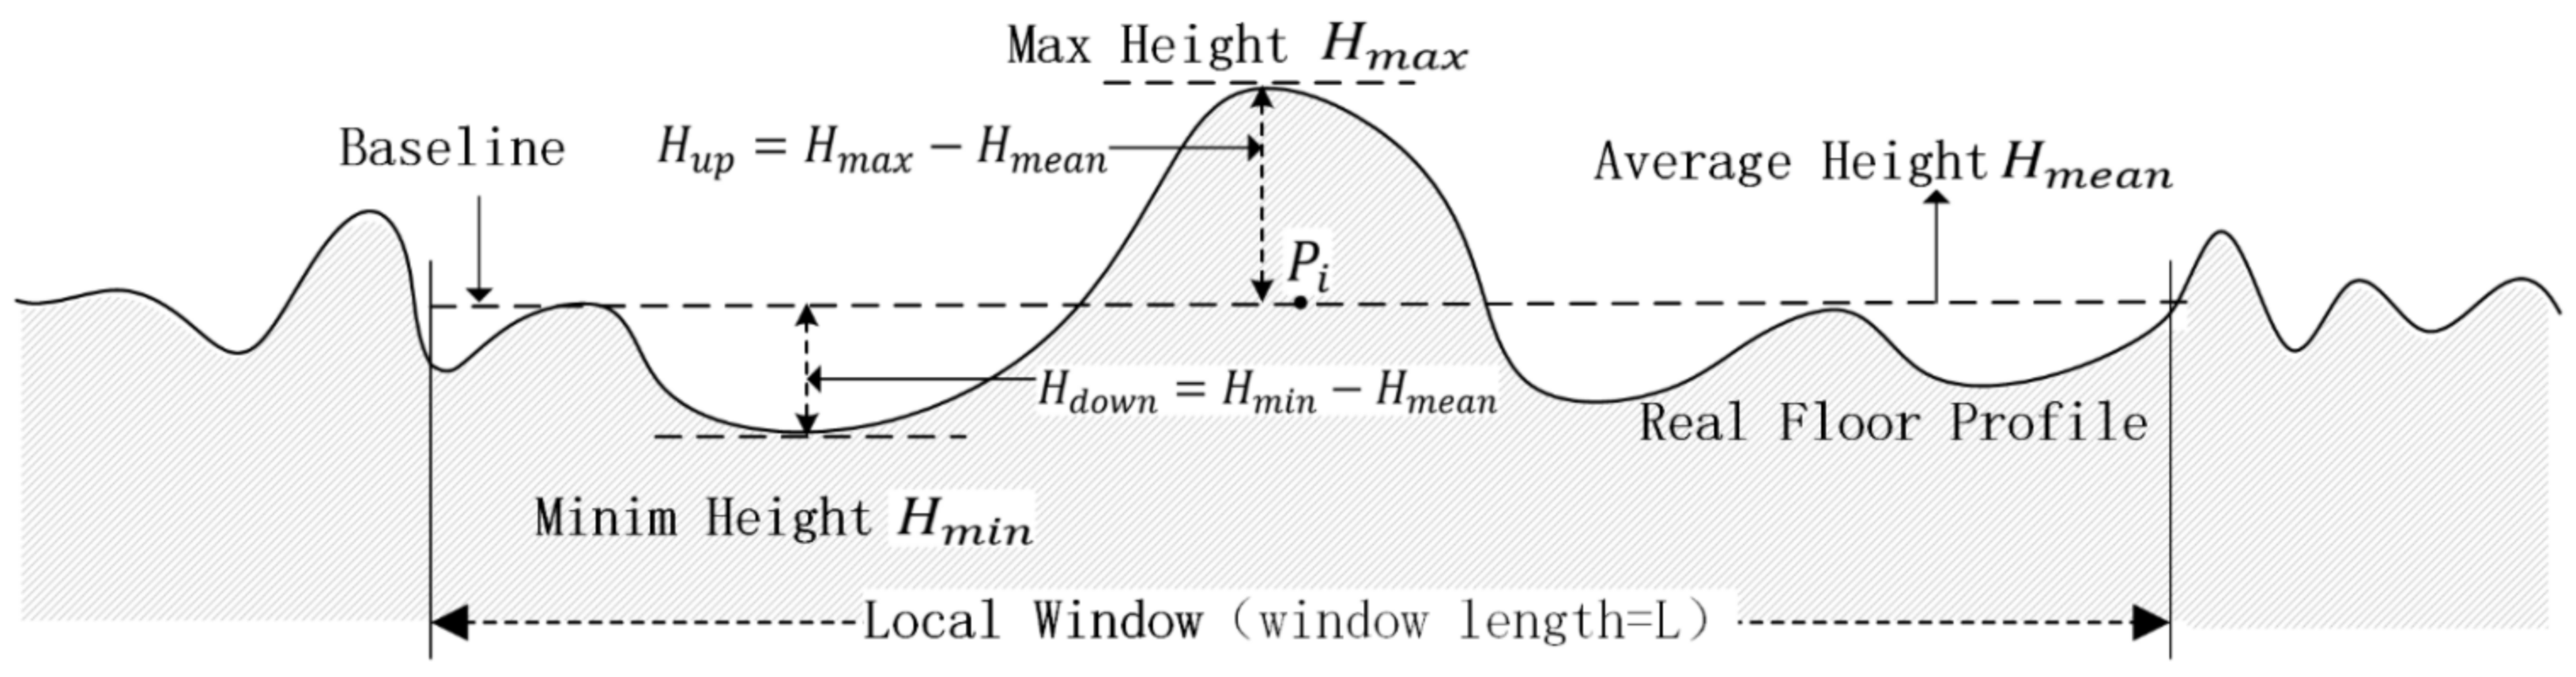
Figure 2.
Framework of large-floor flatness inspection by wheeled robot with aided INS.

Figure 3.
Wheeled robot. (a) Design of the measurement robot. (b) experimental system.
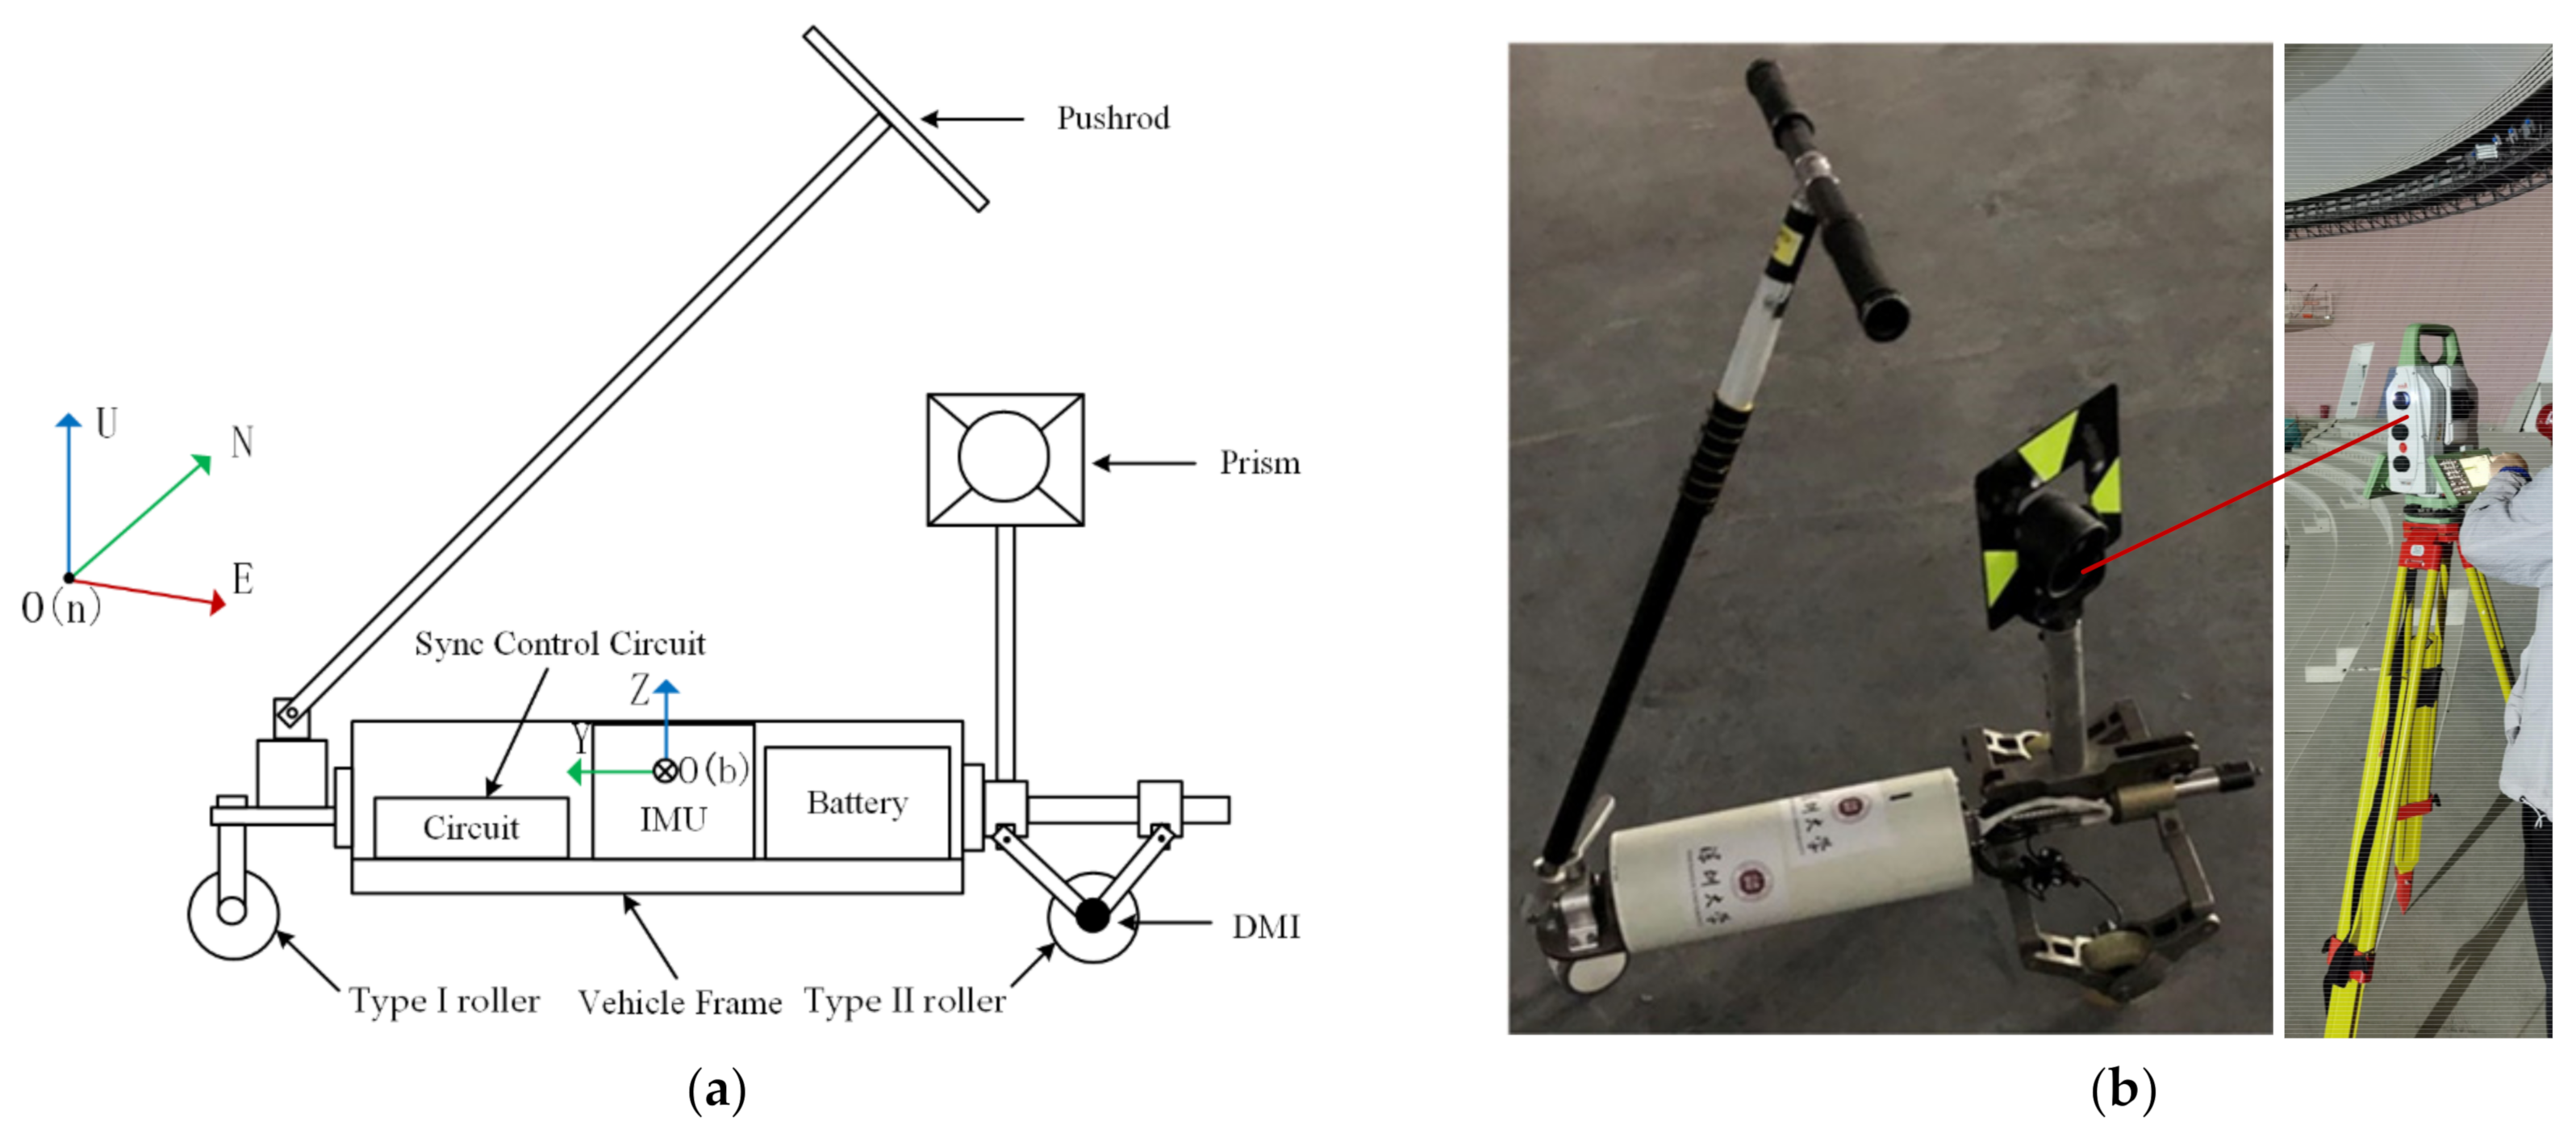
Figure 4.
Framework of the multi-sensor integrated system.

Figure 5.
Time synchronization between the total station and INS. (a) Time-velocity plot before time registration; (b) time-velocity plot after time registration.
Figure 5.
Time synchronization between the total station and INS. (a) Time-velocity plot before time registration; (b) time-velocity plot after time registration.

Figure 6.
Trajectory estimation framework by fusion of INS, odometer and total station data.
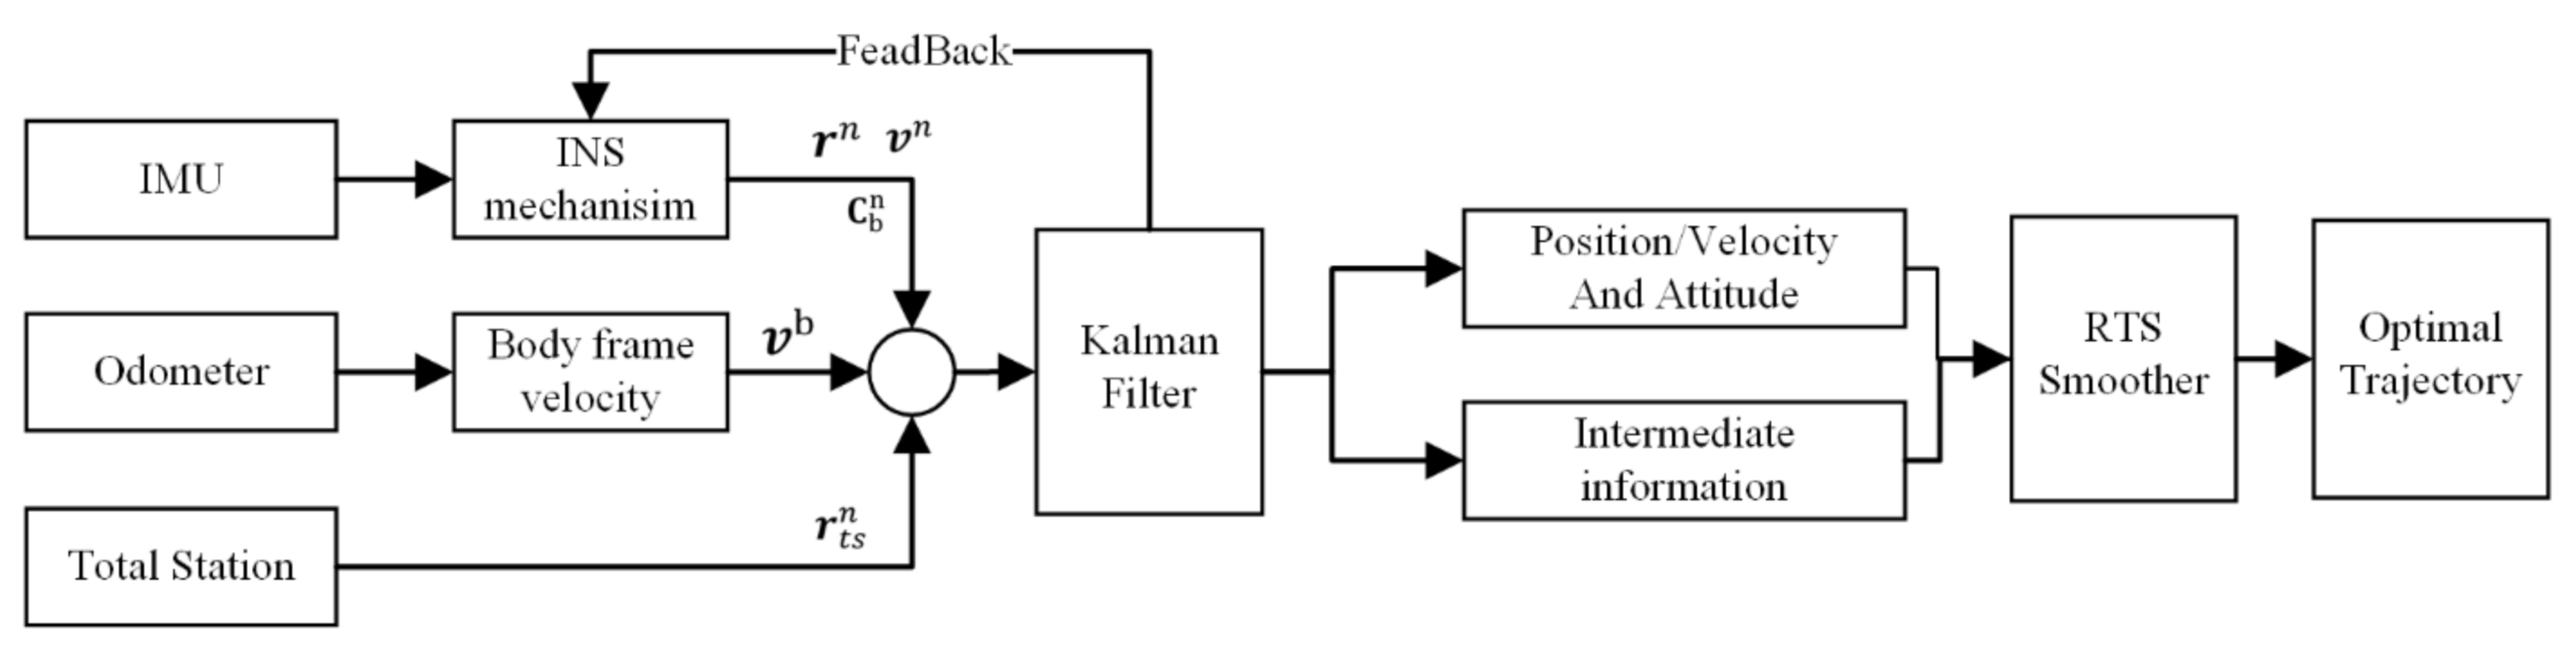
Figure 7.
Repeatability of relative height measurement. (a) path of wheeled robot. (b) results of six runs.
Figure 7.
Repeatability of relative height measurement. (a) path of wheeled robot. (b) results of six runs.

Figure 8.
Testing routine for relative height accuracy. (a) travel routine 1. (b) travel routine 2.
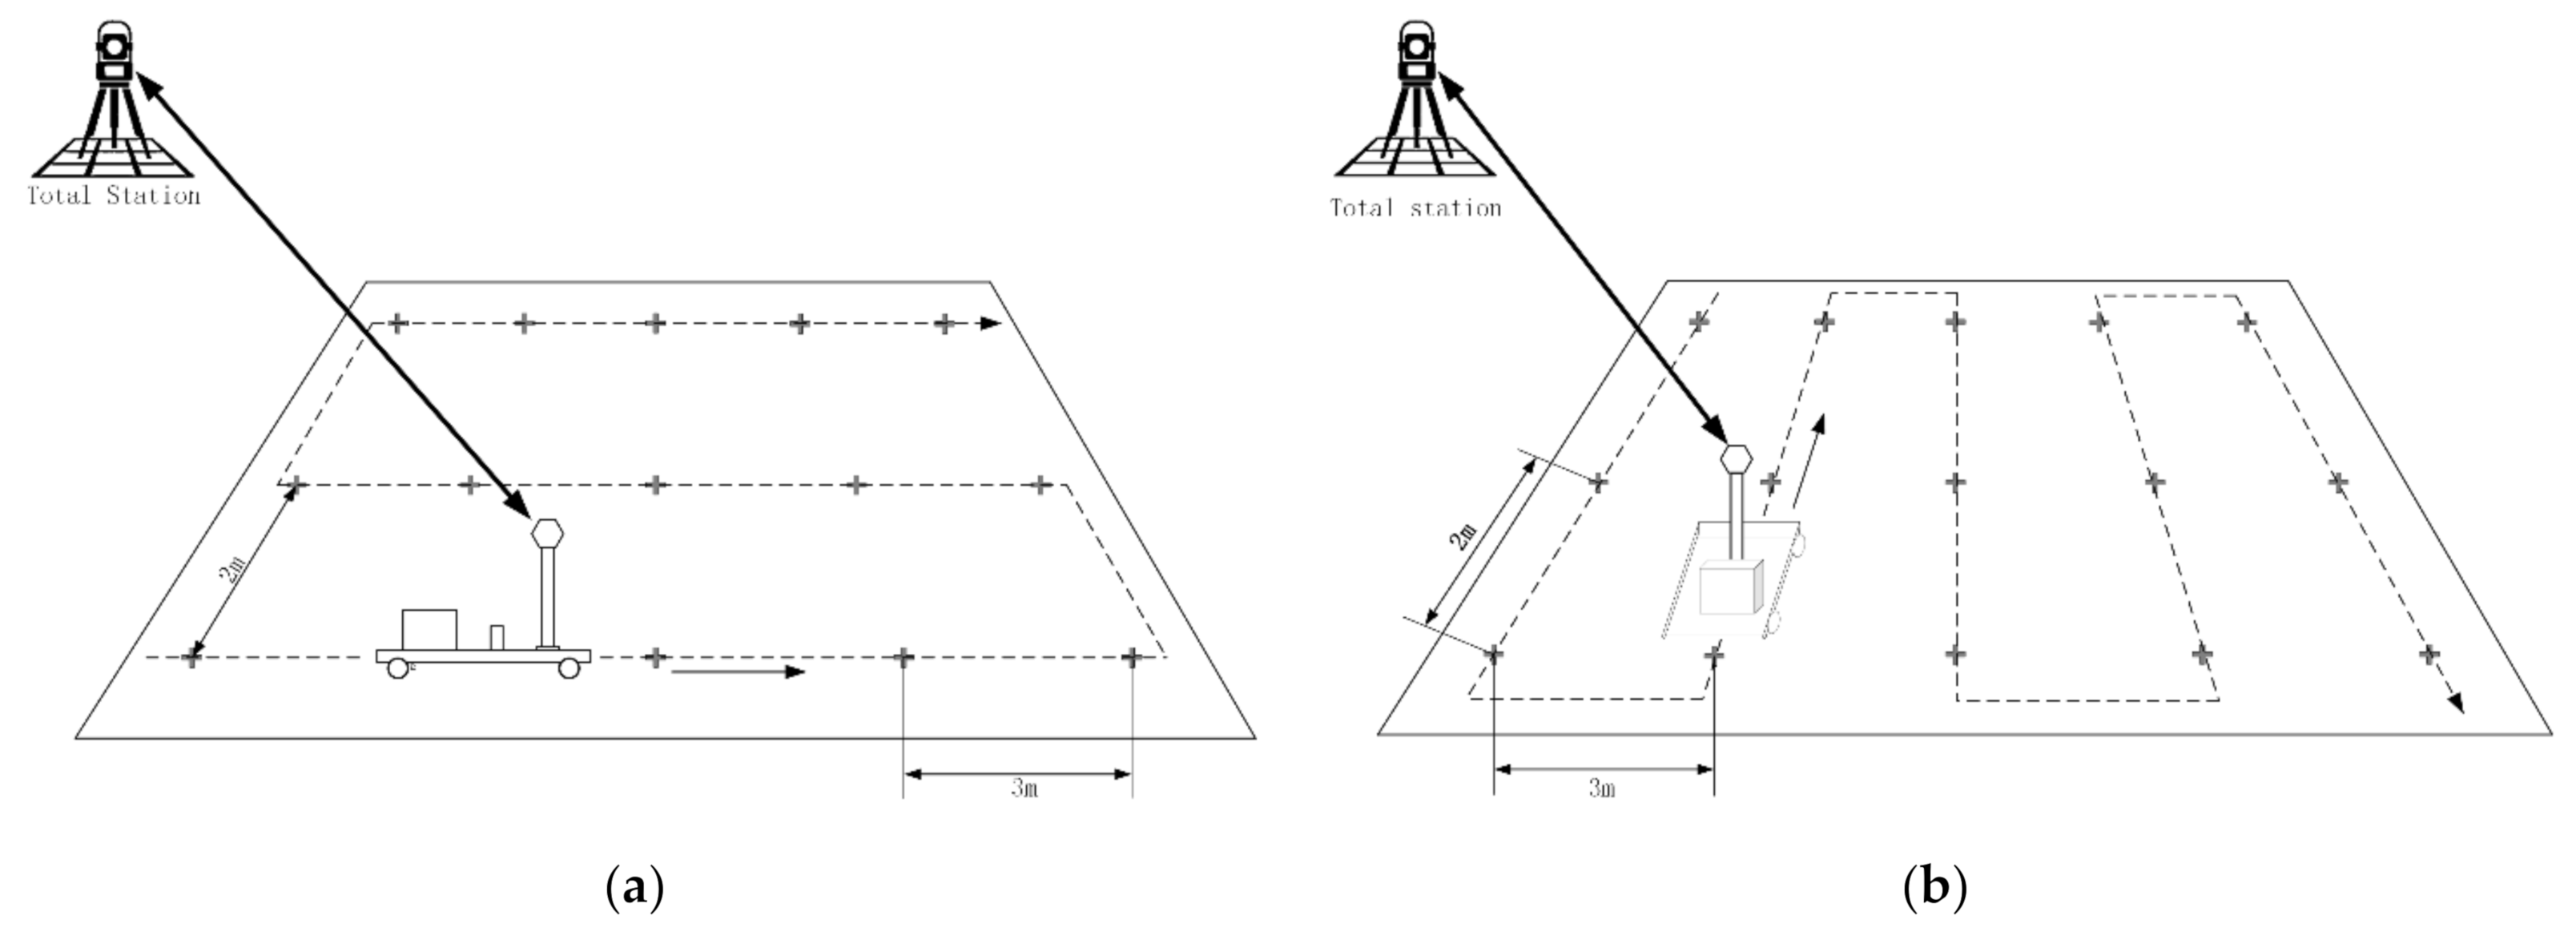
Figure 9.
The National Speed Skating Oval of Beijing 2022 Winter Olympics. (a) overview; (b) indoor scene.
Figure 9.
The National Speed Skating Oval of Beijing 2022 Winter Olympics. (a) overview; (b) indoor scene.
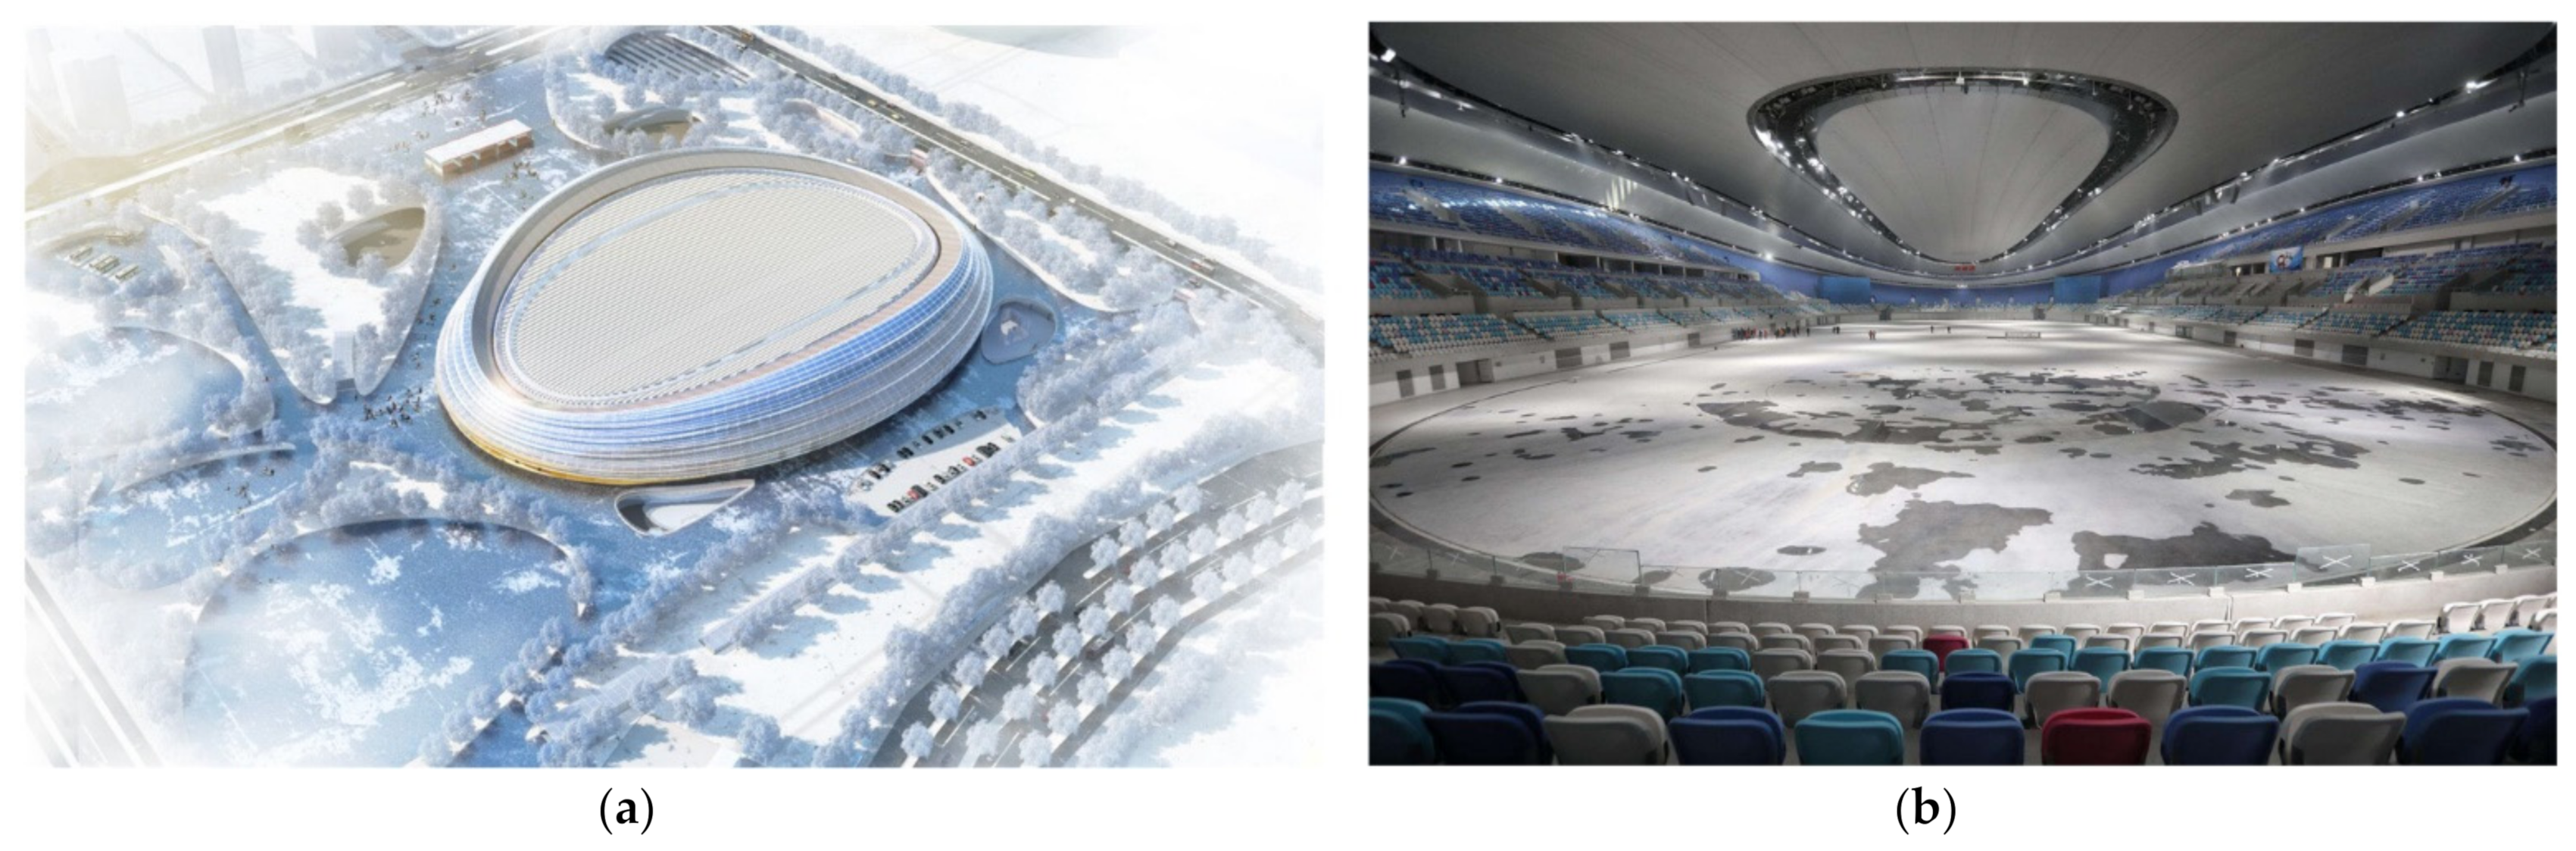
Figure 10.
Measurement routes for different floors. (a) inspection route for wide rectangle floor block. (b) inspection route for runway area.
Figure 10.
Measurement routes for different floors. (a) inspection route for wide rectangle floor block. (b) inspection route for runway area.
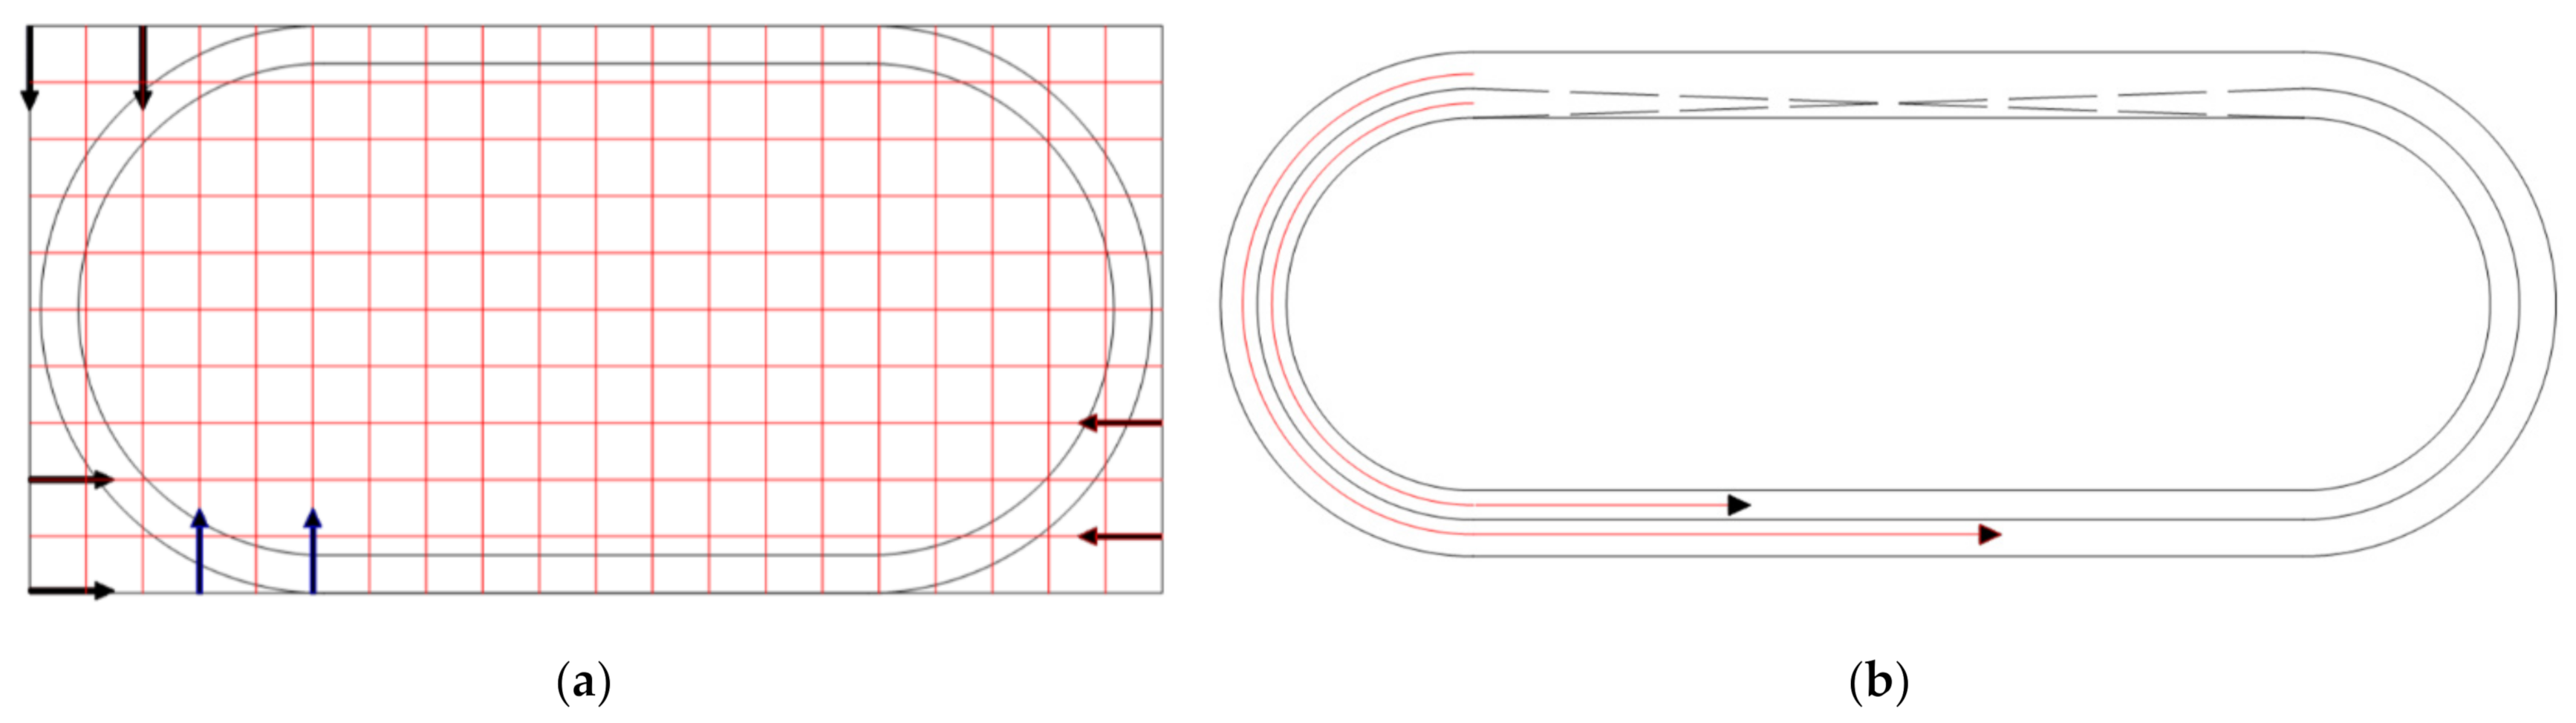
Figure 11.
Overview of the measurement route of the National Speed Skating Oval.
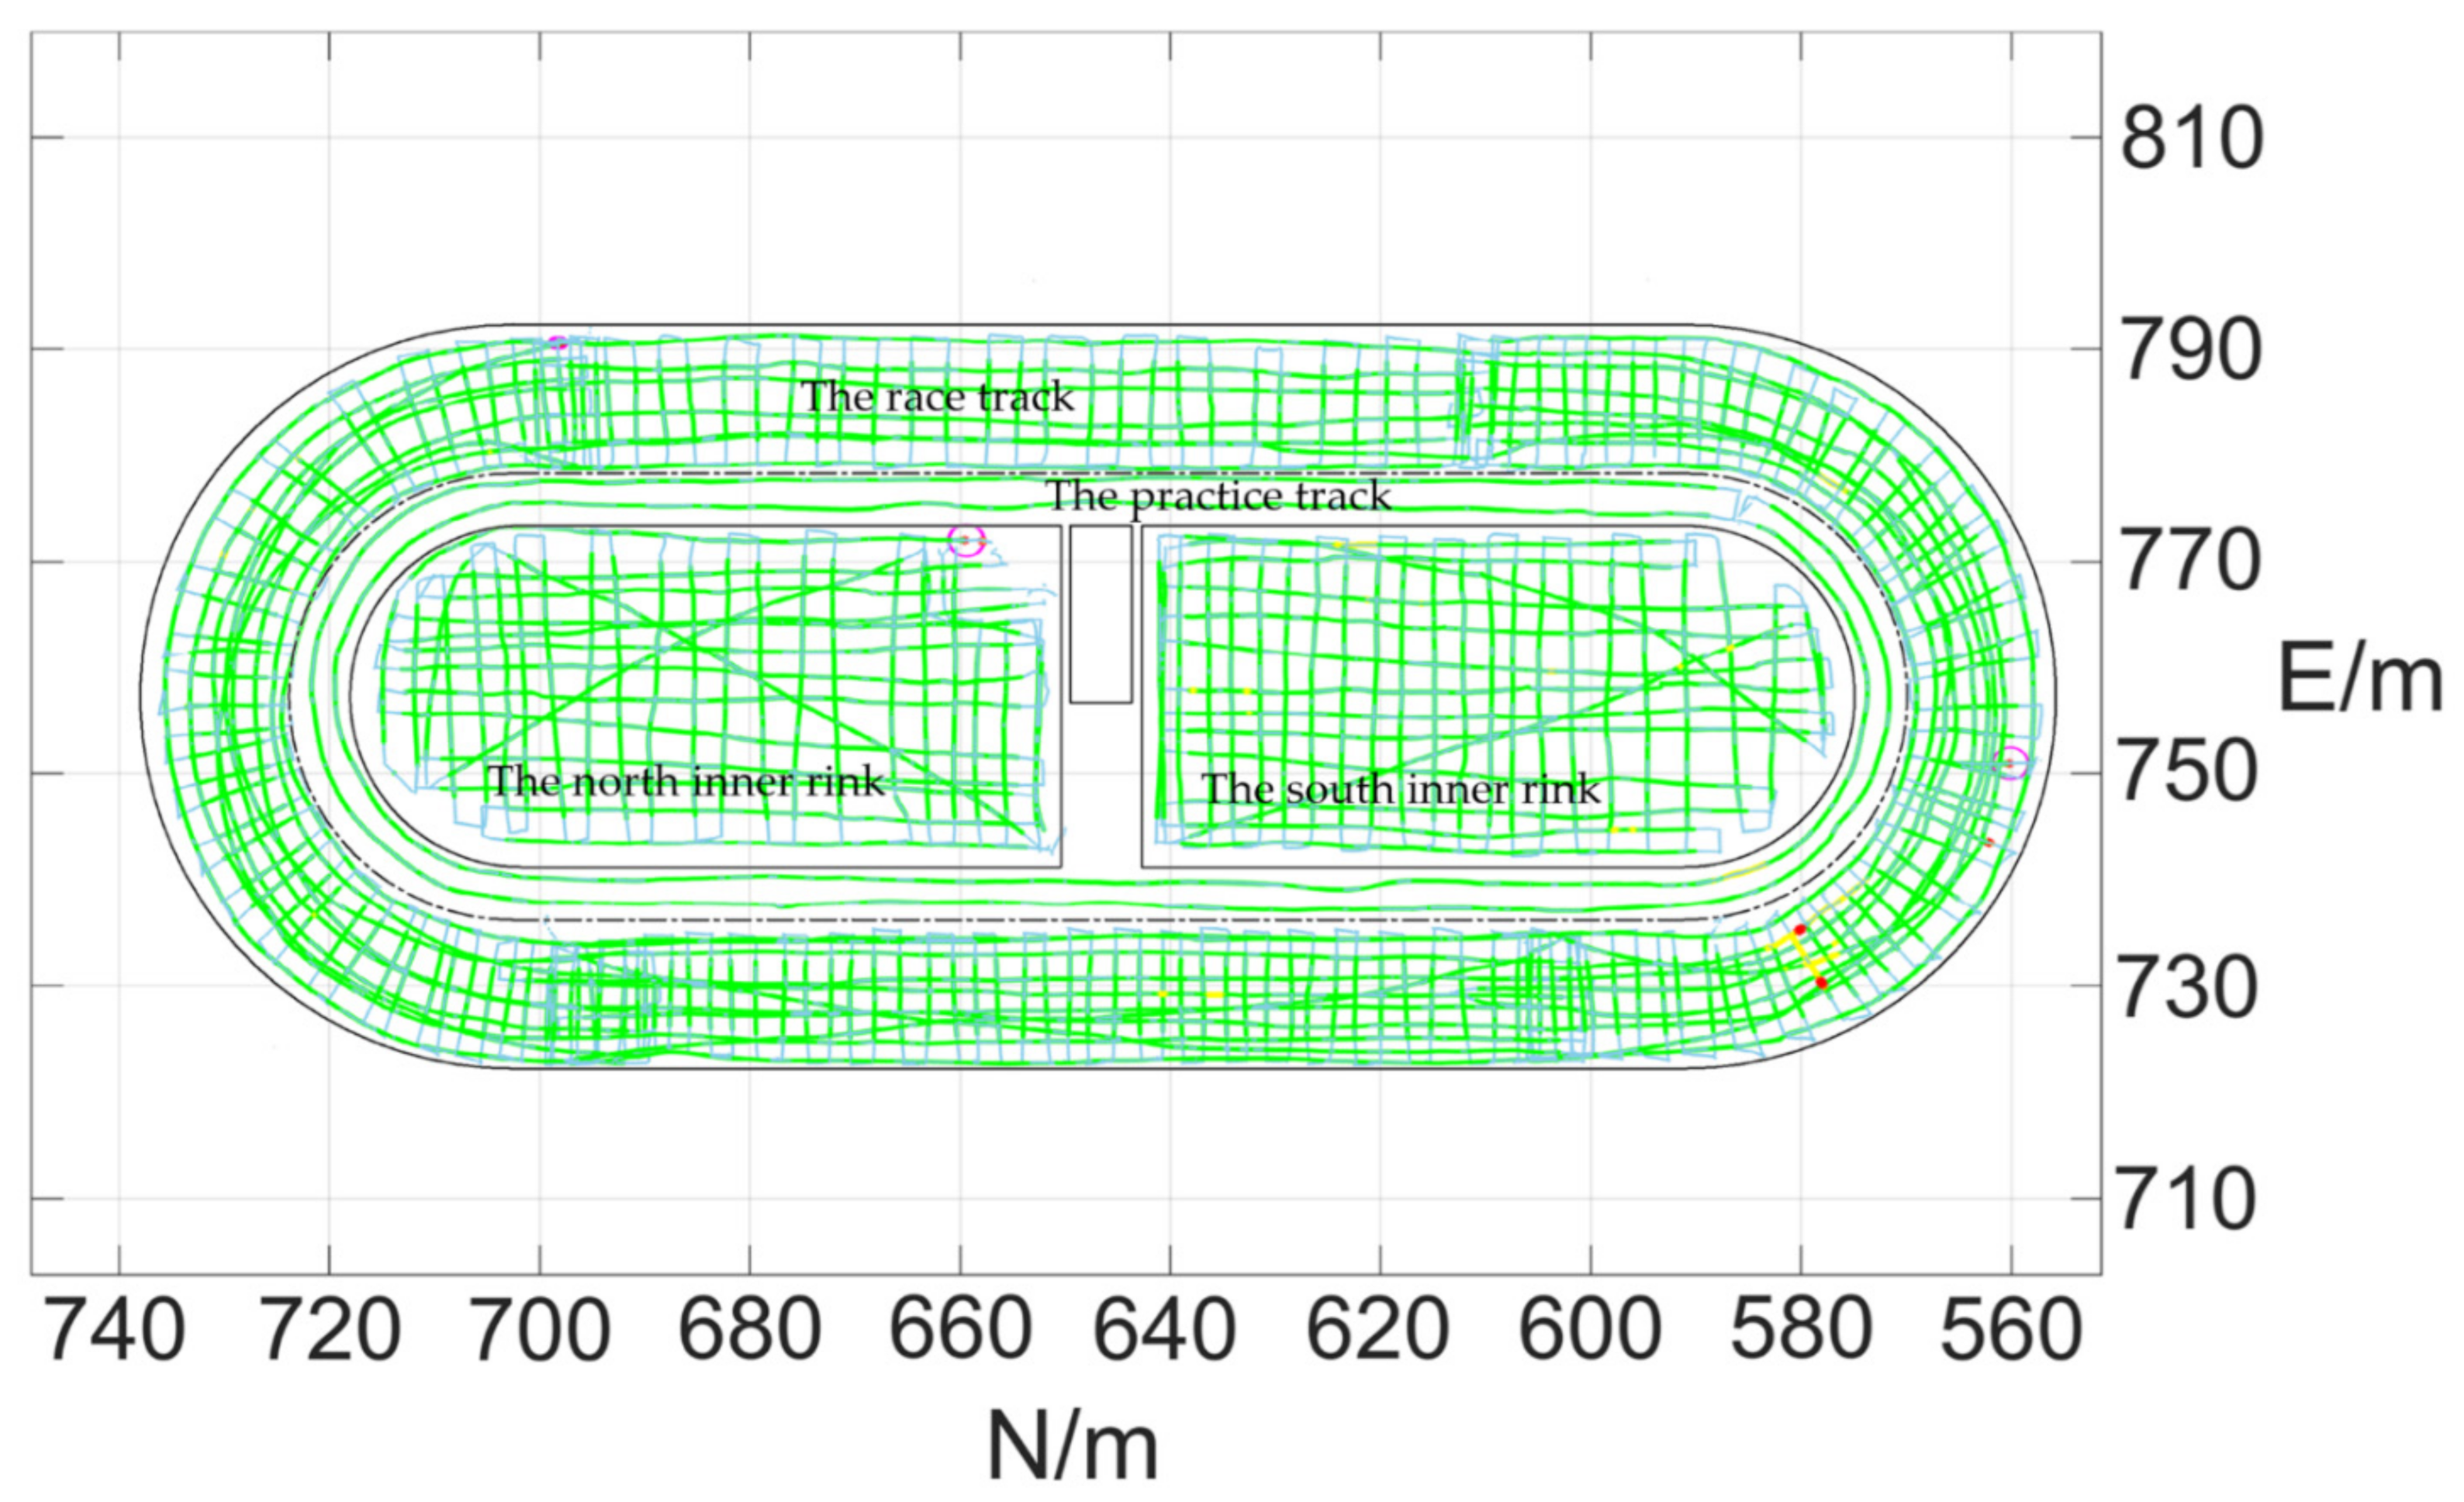
Figure 12.
Map and statistics analysis of flatness measurement results of different blocks. (a) the racetrack. (b) the practice track. (c) the north inner rink. (d) the south inner rink.
Figure 12.
Map and statistics analysis of flatness measurement results of different blocks. (a) the racetrack. (b) the practice track. (c) the north inner rink. (d) the south inner rink.


Table 1.
Parameters of sensors on the wheeled robot.
| INS | Gyroscope | Accelerometer | Odometer | Total Station | ||
|---|---|---|---|---|---|---|
| Sampling Rate | 500 hz | 500 hz | Sampling Rate | 500 hz | Sampling Rate | <10 hz |
| Range | ±220°/s | ±5 g | Angular resolution | 17 bits, 131,072 | Measurement range | 1000 m |
| Noise | ≤0.002°/ | 30 μg/ | Static error | <0.025° | Distance Accuracy | 1 ppm + 0.6 mm |
| Bias | 0.01°/h (1) | ≤15 μg (1) | Maximum operational speed | 4000 rpm | Angel accuracy | 0.5″ |
Table 2.
Relative height comparation of all check points on the routine.
| Check Points | Relative Height by Leveling/m | Relative Height by Wheeled Robot/m | Difference/mm | ||
|---|---|---|---|---|---|
| Test 1 | Test 2 | Test1 | Test2 | ||
| CTL01 | 0.0000 | 0.0000 | 0.0000 | 0.0 | 0.0 |
| CTL02 | −0.0162 | −0.0169 | −0.0165 | −0.7 | −0.3 |
| CTL03 | −0.0204 | −0.0216 | −0.0198 | −1.2 | 0.6 |
| CTL04 | −0.0182 | −0.0174 | −0.0179 | 0.8 | 0.3 |
| CTL05 | −0.0049 | −0.0058 | −0.0067 | −0.9 | −1.8 |
| CTL06 | −0.0240 | −0.0231 | −0.0234 | 0.9 | 0.6 |
| CTL07 | −0.0346 | −0.0330 | −0.0329 | 1.6 | 1.7 |
| CTL08 | −0.0363 | −0.0380 | −0.0357 | −1.7 | 0.6 |
| CTL09 | −0.0360 | −0.0379 | −0.0358 | −1.9 | 0.2 |
| CTL10 | −0.0266 | −0.0281 | −0.0259 | −1.5 | 0.7 |
| CTL11 | −0.0388 | −0.0400 | −0.0379 | −1.2 | 0.9 |
| CTL12 | −0.0444 | −0.0464 | −0.0428 | −2.0 | 1.6 |
| CTL13 | −0.0485 | −0.0499 | −0.0477 | −1.4 | 0.8 |
| CTL14 | −0.0417 | −0.0439 | −0.0409 | −2.2 | 0.8 |
| CTL15 | −0.0325 | −0.0334 | −0.0318 | −0.9 | 0.7 |
Publisher’s Note: MDPI stays neutral with regard to jurisdictional claims in published maps and institutional affiliations. |
© 2022 by the authors. Licensee MDPI, Basel, Switzerland. This article is an open access article distributed under the terms and conditions of the Creative Commons Attribution (CC BY) license (https://creativecommons.org/licenses/by/4.0/).
Share and Cite
MDPI and ACS Style
Chen, Z.; Li, Q.; Xue, W.; Zhang, D.; Xiong, S.; Yin, Y.; Lv, S. Rapid Inspection of Large Concrete Floor Flatness Using Wheeled Robot with Aided-INS. Remote Sens. 2022, 14, 1528. https://doi.org/10.3390/rs14071528
AMA Style
Chen Z, Li Q, Xue W, Zhang D, Xiong S, Yin Y, Lv S. Rapid Inspection of Large Concrete Floor Flatness Using Wheeled Robot with Aided-INS. Remote Sensing. 2022; 14(7):1528. https://doi.org/10.3390/rs14071528
Chicago/Turabian StyleChen, Zhipeng, Qingquan Li, Weixin Xue, Dejin Zhang, Siting Xiong, Yu Yin, and Shiwang Lv. 2022. "Rapid Inspection of Large Concrete Floor Flatness Using Wheeled Robot with Aided-INS" Remote Sensing 14, no. 7: 1528. https://doi.org/10.3390/rs14071528
Note that from the first issue of 2016, this journal uses article numbers instead of page numbers. See further details here.