
Monitoring Potential Geological Hazards with Different InSAR Algorithms: The Case of Western Sichuan
by
Zezhong Zheng
1,*,†, 
Chuhang Xie
1,†,
Yong He
2,†,
Mingcang Zhu
3,
Weifeng Huang
1 and
Tianming Shao
1 1
School of Resources and Environment, University of Electronic Science and Technology of China, Chengdu 611731, China
2
Sichuan Research Institute for Ecosystem Restoration & Geohazard Prevention, Chengdu 610084, China
3
Department of Natural Resources of Sichuan Province, Chengdu 610015, China
*
Author to whom correspondence should be addressed.
†
These authors contributed equally to this work.
Remote Sens. 2022, 14(9), 2049; https://doi.org/10.3390/rs14092049
Submission received: 9 March 2022
/
Revised: 16 April 2022
/
Accepted: 19 April 2022
/
Published: 25 April 2022
(This article belongs to the Special Issue SAR in Big Data Era II)
Abstract
:In recent years, the number of geological disasters in Sichuan Province has significantly increased due to the influence of earthquakes and extreme climate, as well as the disturbance to the geological environment by human activities. Thus, geological disaster monitoring is particularly important, which can provide some scientific basis for disaster prevention and reduction. In this paper, the interferometric synthetic aperture radar (InSAR) technology was introduced to monitor potential geological hazards, taking parts of Dujiangyan City, Wenchuan County, and Mao County in Sichuan Province, China as examples. Firstly, the data such as Sentinel-1A Terrain Observation with Progressive Scans (TOPS) Synthetic Aperture Radar (SAR) images and Precision Orbit Determination (POD) precise orbit ephemerides from 2018 to 2020, high-resolution optical satellite images and Digital Elevation Model (DEM) were collected. Secondly, the Differential InSAR (D-InSAR), Persistent Scatterer InSAR (PS-InSAR), Small Baseline Subset InSAR (SBAS-InSAR), Offset-Tracking, and Distributed Scatterer InSAR (DS-InSAR) algorithms were used to invert the surface deformation of the study area. Thirdly, according to the deformation results obtained by experiments, we used GF-1 and GF-2 optical images as a reference and combine the experimental results of InSAR algorithms to delineate the areas affected by geological disasters. A total of 49 geological disaster areas were obtained, mainly including landslides, collapses, and debris flow. Through field verification, the overall accuracy rate of InSAR deformation monitoring achieved 69.23%, and the accuracy rate of new potential hazards monitoring reached 63.64%. Among all InSAR methods, the DS-InSAR method outperformed and monitored the geological disaster areas well. Finally, the study area was divided into three elevation intervals and the applicability of different InSAR algorithms in different elevation intervals was discussed.
1. Introduction
Due to the steep terrain and frequent geological disasters in Southwest China, the local people are greatly threatened. Among all the geological disasters, the geological disasters dominated by landslides not only occur frequently but also affect a wide range. Among them, under the action of natural and human factors, the landslide with the tendency to evolve into a landslide disaster can be called a potential landslide. Accurate identification and prediction of these potential landslides play a key role in reducing and avoiding landslide disasters [1]. At present, there are some disadvantages to conventional measurement methods, such as the Global Position System (GPS) [2,3] and leveling [4,5]. The main problems are time-consuming and laborious monitoring work, small monitoring areas, and expensive equipment and instruments [6].
InSAR is a new geological hazard monitoring technology developed in recent decades. It can be continuously monitored under various climatic conditions and its monitoring space is wide [7,8]. Many scholars have studied how to monitor the surface deformation of geological disasters. Massonnet applied the D-InSAR technique to obtain the surface deformation information of the earthquake, and inverts the geometric parameters of the earthquake by a mathematical model [9]. Shi employed a point-like target Offset-Tracking technique with multi-mode high-resolution TerraSAR-X data to monitor the landslide deformation in the Three Georges area [10]. However, InSAR technology is vulnerable to decorrelation, and atmospheric and orbital errors [11,12]. Thus, to solve these problems, time series InSAR technology is proposed to study the temporal and spatial characteristics of surface deformation in detail [13,14,15]. Ferretti proposed PS technology, which improved the defects of D-InSAR technology [16]. Berardino combines SAR images of all-time series according to a certain spatiotemporal baseline threshold to form interference pairs, to extract deformation information. This method called short baseline subsets (SBAS) technology can reduce the impact of spatiotemporal decorrelation [17]. Later, many experts and scholars put forward improved methods based on PS-InSAR and SBAS-InSAR technology [18]. Hooper et al. combined PS and SBAS theory to improve the accuracy of deformation monitoring [19]. Zhang et al. proposed an InSAR analysis method for identifying and extracting the temporary coherence point (TCP) between two SAR values [20]. Chen aimed to compare the two commonly used multi-temporal InSAR techniques, that is, PS-InSAR and SBAS-InSAR, in monitoring shallow landslides [21]. Dong validated the DS-InSAR algorithm to monitor the Xishan Landslide in the western mountainous region of Sichuan province with a qualitative and quantitative simulation analysis [22]. The variety of InSAR algorithms often implies lots of knowledge that provides much information about the research with us. In addition, many studies combined InSAR technology with GPS-measured data, leveling data, et al. for land movement caused by natural and anthropogenic [23,24]. Parcharidis et al. estimated the spatial-temporal characteristics of subtle ground deformation between 1992 and 2009 in the broader area of the Mornos River delta in Central Greece, using Persistent Scatterers Interferometry (PSI) [25]. However, most of the relevant studies lack the applicability of the InSAR algorithm in the selected study area from the perspective of variant elevations.
In this study, three typical experimental areas with a total area of about 5101.46 km2, located in the northwest of Mao County, the northeast of Wenchuan County, and the whole area of Dujiangyan City, along the surrounding area of the Longmenshan fault zone in northern Sichuan, are selected for typical demonstration research. The terrain characteristics in the study area are quite complex, and the slope and aspect characteristics vary greatly between different regions, resulting in more disasters such as landslides, collapses, and debris flow. Here, we use a variety of InSAR algorithms for surface deformation monitoring and comprehensive interpretation of optical remote sensing. According to the monitoring results, we compared the applicability of different InSAR algorithms in disaster monitoring in the study area.
The paper is structured as follows: Section 2 introduces the datasets used and the principles of several InSAR algorithms mainly used. The recognition monitoring results and accuracy evaluation of different InSAR algorithms are introduced in Section 3. The applicability of different InSAR algorithms in the study area is discussed in Section 4. Finally, Section 5 summarizes the conclusions based on the monitoring results.
2. Study Area
The study area is located in northern Sichuan Province, China, including Dujiangyan City, Wenchuan County, and Mao County (Figure 1). The study area is distributed around the Longmenshan fault zone, and the climate characteristics are very complex. The vertical climate change in the study area is obvious, and many different types of climate zones have been formed from northwest to Southeast. The temperature and precipitation are greatly affected by the terrain, so they are unevenly distributed in the region. The annual average precipitation in the study area is about 800 mm. Affected by many factors such as monsoon climate and atmospheric circulation, the precipitation gradually increases from north to south. In addition, the temperature distribution is high in the east and low in the west, with an annual average of about 13.8 °C. The flood period is mainly concentrated from June to August, which is synchronized with the rainy season. Thus, during this period, a large amount of rainwater infiltration will soften the rock mass, thereby reducing the stability of the slope and increasing the risk of hidden geological hazards in the study area.
The total elevation interval of the study area is 570–5156 m (Figure 2), and the east-west direction shows the distribution of high in the middle and low on both sides. The main landform type in the study area is a mountainous area. The terrain features are complex, and the slope and aspect characteristics vary greatly between different regions. Geotectonics is mainly the combination of Yangtze quasi-platform and Songpan-Ganzi geosyncline folds. Strata are well developed, mainly including Triassic, Sinian, Silurian, Paleogene-Neogene, and Quaternary strata. The Triassic is mainly distributed in the west of the study area. It is rich in fossils, hosts a variety of useful minerals, and is most prone to geological disasters. The Silurian is mainly distributed in the central and southeastern regions of the study area and is dominated by neritic clastic rocks and carbonate facies. The control area of this system is large and prone to geological disasters. The Sinian system is mainly distributed in the central and northeastern regions of the study area. Due to the abundance of sedimentary minerals in this area, mining activities are frequent, and geological disasters such as collapse and ground subsidence occur frequently. Besides this, the Quaternary system is mainly distributed in the southern part of the study area. This system is thick and well-preserved, and is also prone to collapse, landslide and debris flow disasters. Meanwhile, the population density of the study area is about 97 persons per square kilometer. Most populated areas are located along valleys, or at the intersection of rivers and ditches, so they are easily affected by geological disasters.
In addition, in recent years, there are many geological disasters in the study area with complex types (Figure 2), and they are characterized by belt-shaped centralized development and distribution along the fault zone. On 24 June 2017, a catastrophic landslide occurred in Mao County, Sichuan Province, which led to the destruction of Xinmo Village and the death of 83 people. Since the Wenchuan Earthquake (12 May 2008), the stability of Wenchuan’s geological environment has deteriorated greatly. From 2013 to 2015, 690 geological disasters occurred in this county. The distribution of geological disasters in Dujiangyan City has the characteristics of many hidden dangers of secondary disasters and high distribution density, with the density of disaster reaching 0.358 per square kilometer.
3. Test Datasets and Methods
3.1. Test Datasets
3.1.1. Optical Satellite Image Data
In this study, high-resolution optical satellite image data (GF-1 and GF-2) covering typical experimental areas in Mao County, Wenchuan County, and Dujiangyan City were collected and obtained. The GF-1 satellite is the first satellite in China’s high-resolution earth observation system. It adopts a solar synchronous orbit. The spectral range includes panchromatic and multispectral cameras, of which the panchromatic resolution is 2 m and the multispectral resolution is 8 m [26]. The GF-2 satellite is equipped with two high-resolution 1 m panchromatic and 4 m multispectral cameras. Compared with the GF-1 satellite, the GF-2 satellite image has higher spatial resolution and spectral resolution [27]. Thus, the efficiency and accuracy of optical remote sensing interpretation of geological hazard hidden dangers in typical experimental areas can be improved. The distribution of GF-1 and GF-2 optical images is shown in Figure 3.
3.1.2. SAR Image Related Data
In this study, Sentinel-1A lift orbit SAR image data (Figure 4a), precision orbit ephemeris data corresponding to SAR image time, and external reference DEM data (Figure 4b) were obtained. Sentinel-1A satellite maps the world every 12 days, and the revisit cycle of two constellations is shortened to 6 days. Sentinel-1A is a C-band synthetic aperture radar system (5.6 cm). Compared with the L-band SAR satellite, its wavelength is shorter and is widely used in the field of surface deformation detection. The main parameters of the Sentinel-1A satellite used in this study are shown in Table 1.
Sentinel-1A satellite orbit data mainly include precision orbit determination (POD), regression orbit data (institute orbit), and precision orbit ephemerides. Among them, the accuracy of pod precise orbit determination ephemeris data is the most accurate, with an accuracy of less than 5 cm. The positioning accuracy of pod regression track data is less than 10 cm. In this study, the precise orbit determination ephemeris data corresponding to Sentinel-1A satellite data in each period are used for orbit error correction. Moreover, from the website (http://gdex.cr.usgs.gov/gdex/, accessed on 18 June 2020), the Shuttle Radar Topography Mission (SRTM) data, which cover a typical experimental area, are downloaded as an external reference DEM for InSAR deformation monitoring. These data are mainly used to remove the influence of errors such as the terrain phase of image data during subsequent interference processing.
3.2. Methods
Five InSAR algorithms are used to process Sentinel-1A data to obtain the spatio-temporal distribution characteristics of deformation in the study area from 2018 to 2020. Then, based on InSAR results and combined with optical satellite images, the hidden dangers of geological disasters are identified and interpreted. Finally, we proposed suggestions and strategies for geological hazard monitoring in different elevation intervals with different InSAR algorithms. The method flow is shown in Figure 5.
3.2.1. D-InSAR
During the acquisition of surface deformation, the phase influence caused by topographic relief and the ellipsoid phase can be removed by pairwise interferogram. After several times of interference, the accurate surface deformation information can be obtained from the interference image through filtering and phase unwrapping [28,29]. This measurement technology is D-InSAR.
In Figure 6, P and P’ are the positions of two images in the same area. Before the surface deformation, the first image is obtained. Under this condition, the return signal formula of point P is denoted as
After the surface deformation occurs, the second image is collected. Generally, compared with the radar resolution unit, the deformation generated by the surface is very small, so the return signal formula of point P under this condition is defined as
where d is the displacement caused by the deformation of point P, and R1 and R2 are the oblique distance of P and P’, respectively. After obtaining the two images, the corresponding interferogram can be obtained. The interferogram contains the terrain information of the coverage area and the information about the surface deformation during the observation process.
3.2.2. Offset-Tracking
Offset tracking is a technology that uses the intensity information of two SAR images covering the same area for sub-pixel level registration to obtain a large number of sub-pixel level offsets of pixel coordinates with the same name, and then decomposes them into component values in an oblique direction (along satellite line of sight direction) and azimuth direction (along orbit flight direction) [10,30].
The oblique range deformation variable (consistent with the line of sight direction of D-InSAR) can be converted to horizontal and vertical deformation through the following Equation (3).
where D1 represents oblique distance deformation; Dh is horizontal deformation and Dv is vertical deformation; α is the incident angle of the satellite. Under certain circumstances, if the horizontal displacement is very small and can be ignored, the oblique distance deformation in Equation (3) can be converted into vertical deformation
According to the principle of offset tracking technology, it mainly processes SAR images such as oversampling and interpolation sampling. Its purpose is to obtain the sub-pixel level accurate registration results between SAR images [31]. Therefore, the monitoring accuracy of this technology also depends on the sub-pixel level accurate registration process, which can usually reach 1/30 of the resolution of SAR images.
3.2.3. PS-InSAR
PS-InSAR technology was first proposed in 2000 [32]. It is a deformation monitoring technology that sets the points with a high signal-to-noise ratio as the persistent scatterer targets based on realizing differential interference processing and carries out interference phase modeling and solution according to the target points. PS-InSAR analyzes and overcomes the influence of spatiotemporal decoherence on interference signals through the idea of modeling point targets that maintain coherence based on temporal and spatial baselines [33,34].
However, PS point selection is a difficult problem. At present, the more common method is the amplitude dispersion index threshold method proposed by Ferretti, which calculates the ratio of time series amplitude standard deviation to mean value, judges the target stability according to the ratio, and then selects the threshold to determine the candidate PS point [35]. The interference phase of the primary detection point includes deformation, atmospheric delay, noise, orbital residual, terrain, and other phases, as shown in Formula (5).
where φd represents phases of deformation; φa represents the atmospheric delay phase; φn represents the noise phase; φorb represents the orbital residual phase; φf represents the topographic phase. On this basis, the four phases affecting the decorrelation on the SAR image are eliminated by using the adaptive filtering method, and the correlation error of the incident angle is eliminated at the same time. By iterating the above process, the maximum estimation of the time correlation coefficient of the primary point of PS can be obtained as Equation (6).
where N represents the number of interference pairs composed of N + 1 images; φint,x,i represents the unwrapped observation phase after removing the atmospheric effect; j represents the complex unit; φs,x,i represents the elevation related part, and Δφh,x,i represents the terrain-related part.
With this standard, the candidate points of PS are selected first and then unwrapped according to the coherence coefficient of the coherence map, to extract the stable PS points. Then, the phase information of the permanent scatterer target points in the study area is decomposed twice to extract useful information on surface deformation [36].
3.2.4. SBAS-InSAR
SBAS-InSAR technology was proposed through the in-depth study of the “small baseline” method, in which the obtained SAR images were combined to form an interference image pair by setting a certain spatio-temporal baseline threshold, to extract deformation information [17].
According to the quality screening of the interference pairs of the selected spatio-temporal baseline, the ones with good coherence are retained as a subset. Assuming that N radar images in the study area, each image can be combined with any image in the other N-1 images. All combinations can be subject to differential interference to obtain M interference pairs, and the value range of M is Equation (7).
After the interference pair is generated by calculation, the InSAR phase deformation extraction method is used to collect the differential interferogram, and the interferogram is obtained by phase filtering and phase unwrapping [37]. Assuming that the obtained interferogram does not contain residual terrain phase, atmospheric phase and noise phase, the interference phase of the j-th interferogram can be expressed as Formula (8).
where is the time of acquisition of the main image; represents the time of acquisition from the image; x and y are the coordinate values of the azimuth and distance of the image, respectively; λ is the central wavelength. After the coherent points in the phase diagram are unwrapped, assuming that there are N Unknown phases, the phase matrix of time-series SAR image φT and the differential phase matrix of M interferograms ΔφT can be expressed as Formula (9).
After the above steps, the interferograms of the main image IE and the auxiliary image IS are arranged according to the time series, and the matrix is converted into a Formula (10).
The vector phase of the interferogram can be expressed as
In the matrix, each row corresponds to a pair of differential phase interferograms, and each column corresponds to SAR images at different times. In the matrix, the columns of the main image and the auxiliary image are ±1, and the other columns are 0, then the matrix G can be expressed as
When the generated series of interference pairs are in the same small baseline subset, M ≥ N, and N is the rank of G, the phase matrix of formula (13) can be obtained by the least square method.
If the interference pairs of the image are not in the same baseline subset, the singular value decomposition method can be used to solve the least square solution of the equations. After the singular matrix is decomposed, Equation (14) can be obtained.
where VT is the rate of average phase, U is the orthogonal matrix and S is the diagonal matrix. The solution of the equation can be indicated as
Through the calculation of the above formula, the minimum norm solution of the velocity vector V can be obtained and then integrated to obtain the estimated value of the deformation phase. Since the atmospheric delay phase is still included in the above-calculated estimator, a more accurate deformation phase vector φ can be obtained after filtering.
3.2.5. DS-InSAR
Distributed scatterers refer to the point targets in which backscattering without any scatterers dominates within the radar resolution unit [38]. In SAR images, they often correspond to the fragment area with medium coherence and the non-cultivated land or desert area with sparse vegetation. Though the average temporal coherence of these natural radar targets is usually low, the number of pixels sharing the same statistical behavior can be large enough that some of them may exceed the coherence threshold and then become the PS points [39].
DS-InSAR technology combines PS points extracted by PS-InSAR technology and adds DS points through analysis to increase the number of scatterers on non-artificial surfaces [40]. Before interferogram filtering, it is a key step to judge the scattering characteristics of pixel points in the window and select sample points with consistent backscattering characteristics. KS test can identify whether the two image pixels belonging to the interference data stack are statistically uniform, to extract homogeneous points. For any pixel P in the SAR image, the backscattering coefficient can be identified as
where di(P) represents the complex reflectance value of the i-th image corresponding to pixel P; For PS point, d(P) is directional quantity, and for DS point, d(P) is a random vector. KS test determines whether pixels P1 and P2 are statistically uniform pixels. Based on the distribution function of the two datasets, the maximum value of the absolute value of the difference is made. It is analyzed that the random variables of DS points are stable under reparameterization [41]. The discriminant formula of the KS test can be expressed as
where and are the distribution functions of pixels P1 and P2, respectively. The probability distribution function DN can be approximated by empirical KS distribution, which can be expressed as
KS test determines whether P1 and P2 conform to the same distribution by judging whether DN is greater than the probability of the set threshold.
Phase triangulation algorithm (PTA) is used in DS-InSAR to “reconstruct” the interference phase, which has less noise than the interference phase of spatial filtering, making the spatial phase unwrapping process more robust. Phase triangulation provides a bridge between PS and DS so that it can select N optimal phase values (PS) of DS points from N(N − 1)/2 interference pairs [42].
4. Results
4.1. Monitoring Results of Potential Geological Hazards
Using the acquired temporal Sentinel-1A data, five different InSAR technologies are used to process it to obtain the surface deformation monitoring data. According to the InSAR monitoring results, the optical visual interpretation was carried out concerning the GF-1 and GF-2 optical images. The visual interpretation results were compared with the geological hazard database, and the interpretation results were verified in the field. Finally, 49 geological hazards were obtained. The typical cases obtained from partial interpretation are shown in Figure 7. Moreover, there might be repetitive and non-repetitive points in the monitoring results of potential geological hazards by different InSAR algorithms. The quantity distribution statistics of potential geological hazards monitored by different InSAR algorithms are shown in Table 2. Among the 49 potential geological hazard points, there were 38 known and 11 newly added geological hazard points, including landslide, collapse, and debris flow. The distribution statistics of potential geological hazards monitored in the study area were shown in Table 3.
According to the divided elevation interval, we count the number of points of potential geological hazards interpreted in different elevation intervals. The statistical data are shown in Table 4. Combined with the principles and characteristics of different InSAR algorithms mentioned above and the monitoring results of five InSAR algorithms, it can be seen that the DS-InSAR method monitored the most potential geological hazard points, and most of them were landslides.
4.2. Accuracy Evaluation
The overall accuracy rate of InSAR deformation monitoring and the newly added identification accuracy rate of potential geological hazards were selected as the accuracy evaluation indexes of this paper. Among the above 49 potential geological hazard points, 13 were selected for field verification, of which 11 were confirmed as newly added by comparing with the database. With the field verification results, nine were found to have obvious deformation, and seven were field ground truth to be a newly added potential geological hazard.
5. Discussion
5.1. Causes of the Areas Affected by “Geological Hazards”
Precipitation is considered to be an important factor in the formation of geological disasters. The flood season in the study area is mainly concentrated from June to August, and the summer is also the period with a high geological disasters occurrence rate. When rainwater intrudes into the fractured rock mass, the rock mass undergoes physical and chemical erosion. The continuous intrusion of rainwater will also form pore water pressure which will exert a downward push on rock mass and slope mass, resulting in the increased crack rate of rock mass, thus rock mass will be destabilized under the influence of gravity and slide downwards as a whole. The increment of deformation in the flood season is very large, which indicates that there is a strong correlation between surface deformation and precipitation. In addition, since the pore water pressure has not reached the critical value, the influence of precipitation on landslides has a certain lag.
Stratigraphic lithology is also one of the important factors inducing geological disasters. The lithology near the Longmenshan fault zone in the north of the study area is mostly Triassic strata. The geological movement in this area is active, and the degree of rock weathering and fragmentation is high. Moreover, due to the large topographic fluctuation and the development of gullies, it provides conditions for the formation of hidden dangers of geological disasters. In addition, there is less vegetation coverage inside the hazard site, so the soil fixation is very limited. This leads to and works as a trigger factor in disaster formation. The lithology in the south of the study area comprises mainly Sinian, Proterozoic, and Quaternary strata. Among them, the Quaternary stratum has a large accumulation thickness and is rich in a large number of sedimentary minerals. Thus, mining activities are frequent in this area, resulting in poor stability of rock mass. In addition, there is less vegetation coverage inside the area, so the soil fixation is very limited. According to the experimental results, most of the hidden dangers are affected by these factors, which are very prone to geological disasters.
5.2. Applicability of Different InSAR Algorithms
We analyzed the applicability of five InSAR algorithms for the three elevation intervals. The elevation range below 1000 m in the typical experimental area selected in the study is generally low vegetation coverage, mostly urban plain, with gentle slope and terrain, and uneven rainfall distribution throughout the year, which is mainly concentrated in the flood season (May–September). There are very few hidden danger points obtained from comprehensive remote sensing monitoring of geological hazard hidden danger in the elevation range below 1000 m, which may be suitable for using D-InSAR and DS-InSAR. By comparing and analyzing the number of deformation feature points extracted by different time-series InSAR algorithms (PS-InSAR, SBAS-InSAR, and DS-InSAR) in the elevation range (Table 6), the number of deformation points monitored by PS-InSAR, SBAS-InSAR and DS-InSAR are 59,981, 74,090, and 182,960, respectively, which shows that in the three time-series InSAR deformation monitoring algorithms, DS-InSAR is an algorithm that can extract the most deformation information in the experimental area. It is proved that DS-InSAR has relatively good applicability in the elevation range below 1000 m in the typical experimental area.
The environmental characteristics of the elevation range of 1000–3500 m in the typical experimental area selected in the study are generally high vegetation coverage, mostly in mountainous regions. A small number of towns and villages are scattered, the terrain slope is large, and the overall surface terrain is steep and complex. SBAS-InSAR or DS-InSAR is suitable for comprehensive remote sensing monitoring of geological hazard hazards in the elevation range of 1000–3500 m. The number of deformation points obtained from orbit lifting monitoring of PS-InSAR, SBAS-InSAR, and DS-InSAR is 12,165, 137, 316, and 80,430, respectively. This further shows that among the three time-series InSAR deformation monitoring algorithms, SBAS-InSAR and DS-InSAR can extract relatively more deformation information in the experimental area. Hence, compared with other InSAR algorithms that require high surface target point coherence, SBAS-InSAR and DS-InSAR are more suitable for the study area with an elevation of 1000–3500 m with high vegetation coverage, low surface target point coherence, and complex terrain.
In the typical experimental area selected in the study, the vegetation coverage between areas with an elevation of more than 3500 m is relatively low (lower than that between areas with an elevation of 1000–3500 m). Most of them are mountainous areas, and there are no human activities such as towns, villages, and retail investors. At the same time, the terrain slope is large, the overall surface shape is steep and complex, and there is snow cover in many high-altitude mountainous areas. The occurrence of snow and the melting and thawing of snow will affect the accuracy of surface deformation monitoring in these snow areas by InSAR to a certain extent. There is no hidden danger of geological hazards in the study area with an elevation of more than 3500 m. Although several abnormal areas of surface deformation can be identified by using different InSAR algorithms in this elevation range, they are not identified as hidden points of geological disasters due to fewer human activities and fewer threat objects. In addition, although there are large deformation anomalies in some areas, it is found that there is snow cover in these areas by comparing the visual interpretation results of optical remote sensing. Thus, these deformation anomalies may be caused by the formation and melting of snow, rather than the slow surface deformation of geological hazards. However, the applicability of different algorithms in the elevation interval above 3500 m is still different. The number of deformation points monitored by PS-InSAR, SBAS-InSAR, and DS-InSAR in orbit lifting images for the mentioned areas is 19,212, 90,452, and 111,315, respectively. Thus, it can be inferred that SBAS-InSAR and DS-InSAR may have relatively good applicability in the study area at an elevation of more than 3500 m.
6. Conclusions
In this paper, the remote sensing monitoring method based on different InSAR algorithms was introduced to the potential geological hazards, taking the whole area of Dujiangyan City and parts of Mao County and Wenchuan County as the cases. InSAR technology was introduced to monitor potential geological hazards, taking parts of Dujiangyan City, Wenchuan County, and Mao County in Sichuan Province, China as examples. Firstly, the data such as SAR images and POD precise orbit ephemerides from 2018 to 2020, high-resolution optical satellite images, and DEM were collected. Secondly, D-InSAR, PS-InSAR, SBAS-InSAR, Offset-Tracking, and DS-InSAR algorithms were used to invert the surface deformation of the study area. Through field verification, the overall accuracy rate of InSAR deformation monitoring achieved 69.23% and 63.64% of the newly added identification accuracy rate of potential geological hazards. By comparing and analyzing the deformation monitoring results of various InSAR technologies applied to different elevation intervals, the applicability of each InSAR technology algorithm in different elevation intervals is obtained.
- (1)
- In the elevation range below 1000 m, the vegetation coverage is low and the terrain slope is slow. There are very few hidden points of geological disasters extracted by various InSAR methods, but DS-InSAR can extract more deformation feature points compared to the other four InSAR methods and has a better monitoring effect.
- (2)
- In the elevation range of 1000–3500 m, the vegetation coverage is high and the terrain slope is steep. SBAS-InSAR and DS-InSAR can extract more deformation feature points and potential geological hazard points, which has a good monitoring effect.
- (3)
- In the elevation range above 3500 m, the vegetation coverage is high and the terrain slope is steep. By comparing and analyzing the number of deformation feature points extracted by different algorithms in this area, it is concluded that SBAS-InSAR and DS-InSAR have relatively good applicability in the study area with an elevation of more than 3500 m.
Author Contributions
Methodology, C.X.; formal analysis, C.X.; investigation, Z.Z. and W.H.; data preprocessing, Z.Z. and M.Z.; data processing T.S.; writing—original draft preparation, C.X.; writing—review and editing, Y.H.; project administration, Y.H. All authors have read and agreed to the published version of the manuscript.
Funding
This research was funded in part by the funds of research and application of constructing satellite remote sensing technology power application comprehensive test site and environment wide-area intelligent monitoring (YNKJXM 20191246); the Open Fund of Key Laboratory of Urban Land Resources Monitoring and Simulation, Ministry of Natural Resources (Grant No. KF-2019-04 -074); the Open Fund of State Key Laboratory of Remote Sensing Science (Grant No. OFSLRSS 201819); the Science Research Program of Natural Resources Department of Sichuan Province (Grant No. KJ-2020-3 and Grant No. KJ-2021-13); the Key Technologies Research and Development Program of Sichuan Province (Grant No. 2020YFSY0041); the Open Fund of State Key Laboratory of Water Resources and Hydropower Engineering Science (Grant No. 2014SWG04); the Guangxi Key Laboratory for Spatial Information and Geomatics (Grant No. 19-050-11-06).
Acknowledgments
The authors would like to give their sincerest thanks to the three anonymous reviewers for their constructive suggestions and comments, which were of great value for improving the manuscript. The authors also thank the Editor for the kind assistance and beneficial comments. We gratefully acknowledge the funders of this study.
Conflicts of Interest
The authors declare no conflict of interest.
References
- Angeli, M.-G.; Pasuto, A.; Silvano, S. A critical review of landslide monitoring experiences. Eng. Geol. 2000, 55, 133–147. [Google Scholar] [CrossRef]
- Li, C.; Shi, X.; Tang, L.; Qiu, H.; Tan, M. Real-Time Geological Disaster Monitoring with Deformation Parameters Auto-Detection Technique. In Second International Conference on Earth Observation for Global Changes; International Society for Optics and Photonics: Bellingham, WA, USA, 2009; Volume 7471, p. 74711. [Google Scholar]
- Huang, F.; Wu, P.; Ziggah, Y. GPS Monitoring Landslide Deformation Signal Processing using Time-series Model. Int. J. Signal Process. Image Process. Pattern Recognit. 2016, 9, 321–332. [Google Scholar] [CrossRef]
- Li, S.; Wang, Z.; Yuan, L.; Li, X.; Huang, Y.; Guo, R. Mechanism of land subsidence of plateau lakeside Kunming city cluster (China) by MT-InSAR and leveling survey. J. Coast. Res. 2020, 115, 666–675. [Google Scholar] [CrossRef]
- Carminati, E.; Martinelli, G. Subsidence rates in the Po Plain, northern Italy: The relative impact of natural and anthropogenic causation. Eng. Geol. 2002, 66, 241–255. [Google Scholar] [CrossRef]
- Hu, B.; Chen, J.; Zhang, X. Monitoring the Land Subsidence Area in a Coastal Urban Area with InSAR and GNSS. Sensors 2019, 19, 3181. [Google Scholar] [CrossRef] [Green Version]
- Kang, Y.; Lu, Z.; Zhao, C.; Xu, Y.; Kim, J.-W.; Gallegos, A.J. InSAR monitoring of creeping landslides in mountainous regions: A case study in Eldorado National Forest, California. Remote Sens. Environ. 2021, 258, 112400. [Google Scholar] [CrossRef]
- Zhu, K.; Xu, P.; Cao, C.; Zheng, L.; Liu, Y.; Dong, X. Preliminary identification of geological hazards from Songpinggou to Feihong in Mao county along the Minjiang river using SBAS-InSAR technique integrated multiple spatial analysis methods. Sustainability 2021, 13, 1017. [Google Scholar] [CrossRef]
- Massonnet, D.; Rossi, M.; Carmona, C.; Adragna, F.; Peltzer, G.; Feigl, K.; Rabaute, T. The displacement field of the Landers earth-quake mapped by radar interferometry. Nature 1993, 364, 138–142. [Google Scholar] [CrossRef]
- Shi, X.; Zhang, L.; Balz, T.; Liao, M. Landslide deformation monitoring using point-like target offset tracking with multi-mode high-resolution TerraSAR-X data. ISPRS-J. Photogramm. Remote Sens. 2015, 105, 128–140. [Google Scholar] [CrossRef]
- Lee, H.; Liu J, G. Analysis of topographic decorrelation in SAR interferometry using ratio coherence imagery. IEEE Trans. Geosci. Remote Sensing. 2001, 39, 223–232. [Google Scholar]
- Zhang, L.; Ding, X.; Lu, Z.; Jung, H.-S.; Hu, J.; Feng, G. A Novel Multitemporal InSAR Model for Joint Estimation of Deformation Rates and Orbital Errors. IEEE Trans. Geosci. Remote Sens. 2013, 52, 3529–3540. [Google Scholar] [CrossRef] [Green Version]
- Zhao, C.; Kang, Y.; Zhang, Q.; Lu, Z.; Li, B. Landslide Identification and Monitoring along the Jinsha River Catchment (Wudongde Reservoir Area), China, Using the InSAR Method. Remote Sens. 2018, 10, 993. [Google Scholar] [CrossRef] [Green Version]
- Yang, C.-S.; Zhang, Q.; Xu, Q.; Zhao, C.-Y.; Peng, J.-B.; Ji, L.-Y. Complex Deformation Monitoring over the Linfen–Yuncheng Basin (China) with Time Series InSAR Technology. Remote Sens. 2016, 8, 284. [Google Scholar] [CrossRef] [Green Version]
- Yang, C.-S.; Zhang, Q.; Zhao, C.-Y.; Wang, Q.-L.; Ji, L.-Y. Monitoring land subsidence and fault deformation using the small baseline subset InSAR technique: A case study in the Datong Basin, China. J. Geodyn. 2014, 75, 34–40. [Google Scholar] [CrossRef]
- Ferretti, A.; Prati, C.; Rocca, F. Permanent scatterers in SAR interferometry. IEEE Trans. Geosci. Remote Sens. 2001, 39, 8–20. [Google Scholar] [CrossRef]
- Berardino, P.; Fornaro, G.; Lanari, R.; Sansosti, E. A new algorithm for surface deformation monitoring based on small baseline differential SAR interferograms. IEEE Trans. Geosci. Remote Sens. 2002, 40, 2375–2383. [Google Scholar] [CrossRef] [Green Version]
- Zhao, R.; Li, Z.W.; Feng, G.C.; Wang, Q.J.; Hu, J. Monitoring surface deformation over permafrost with an improved SBAS-InSAR algorithm: With emphasis on climatic factors modeling. Remote Sens. Environ. 2016, 184, 276–287. [Google Scholar] [CrossRef]
- Hooper, A. A multi-temporal InSAR method incorporating both persistent scatterer and small baseline approaches. Geophys. Res. Lett. 2008, 35. [Google Scholar] [CrossRef] [Green Version]
- Zhang, L.; Ding, X.; Lu, Z. Ground settlement monitoring based on temporarily coherent points between two SAR acquisitions. ISPRS J. Photogramm. Remote Sens. 2011, 66, 146–152. [Google Scholar] [CrossRef]
- Chen, X.; Tessari, G.; Fabris, M.; Achilli, V.; Floris, M. Comparison between PS and SBAS InSAR Techniques in Monitoring Shallow Landslides. In Workshop on World Landslide Forum; Springer: Cham, Switzerland, 2021; pp. 155–161. [Google Scholar]
- Dong, J.; Gong, J.; Liao, M.; Zhang, L.; Shi, X.; Liu, Y. Landslides analysis in western moutainous areas of China using Distributed Scatterers based InSAR. In Proceedings of the 2016 IEEE International Geoscience and Remote Sensing Symposium (IGARSS), Beijing, China, 10–15 July 2016; pp. 5773–5776. [Google Scholar]
- Mazzotti, S.; Lambert, A.; Van Der Kooij, M.; Mainville, A. Impact of anthropogenic subsidence on relative sea-level rise in the Fraser River delta. Geology 2009, 37, 771–774. [Google Scholar] [CrossRef]
- Burgmann, R.; Hilley, G.; Ferretti, A.; Novali, F. Resolving vertical tectonics in the San Francisco Bay Area from permanent scatterer InSAR and GPS analysis. Geology 2006, 34, 221. [Google Scholar] [CrossRef] [Green Version]
- Parcharidis, I.; Kourkouli, P.; Karymbalis, E.; Foumelis, M.; Karathanassi, V. Time Series Synthetic Aperture Radar Interferometry for Ground Deformation Monitoring over a Small Scale Tectonically Active Deltaic Environment (Mornos, Central Greece). J. Coast. Res. 2011, 29, 325–338. [Google Scholar] [CrossRef] [Green Version]
- Sun, W.; Tian, Y.; Mu, X.; Zhai, J.; Gao, P.; Zhao, G. Loess Landslide Inventory Map Based on GF-1 Satellite Imagery. Remote Sens. 2017, 9, 314. [Google Scholar] [CrossRef] [Green Version]
- Wang, G.; Xie, M.; Chai, X.; Wang, L.; Dong, C. D-InSAR-based landslide location and monitoring at Wudongde hydropower reservoir in China. Environ. Earth Sci. 2013, 69, 2763–2777. [Google Scholar] [CrossRef]
- Meng, Q.; Li, W.; Raspini, F.; Xu, Q.; Peng, Y.; Ju, Y.; Zheng, Y.; Casagli, N. Time-series analysis of the evolution of large-scale loess landslides using InSAR and UAV photogrammetry techniques: A case study in Hongheyan, Gansu Province, Northwest China. Landslides 2021, 18, 251–265. [Google Scholar] [CrossRef]
- Cascini, L.; Fornaro, G.; Peduto, D. Advanced low-and full-resolution DInSAR map generation for slow-moving landslide analysis at different scales. Eng. Geol. 2010, 112, 29–42. [Google Scholar] [CrossRef]
- Wang, C.; Mao, X.; Wang, Q. Landslide displacement monitoring by a fully polarimetric SAR offset tracking method. Remote Sens. 2016, 8, 624. [Google Scholar] [CrossRef] [Green Version]
- Xu, X.; Ma, C.; Lian, D.; Zhao, D. Inversion and Analysis of Mining Subsidence by Integrating DInSAR, Offset Tracking, and PIM Technology. J. Sens. 2020, 2020, 4136837. [Google Scholar] [CrossRef]
- Ferretti, A.; Prati, C.; Rocca, F. Nonlinear subsidence rate estimation using permanent scatterers in differential SAR interferometry. IEEE Trans. Geosci. Remote Sens. 2000, 38, 2202–2212. [Google Scholar] [CrossRef] [Green Version]
- Beladam, O.; Balz, T.; Mohamadi, B.; Abdalhak, M. Using ps-insar with sentinel-1 images for deformation monitoring in northeast Algeria. Geosciences 2019, 9, 315. [Google Scholar] [CrossRef] [Green Version]
- Greif, V.; Vlcko, J. Monitoring of post-failure landslide deformation by the PS-InSAR technique at Lubietova in Central Slovakia. Environ. Earth Sci. 2012, 66, 1585–1595. [Google Scholar] [CrossRef]
- Ferretti, A.; Prati, C.; Rocca, F. Analysis of permanent scatterers in SAR interferometry. In Proceedings of the IGARSS 2000—IEEE International Geoscience and Remote Sensing Symposium, Honolulu, HI, USA, 24–28 July 2000. [Google Scholar]
- Sousa, J.J.; Ruiz, A.M.; Hanssen, R.F.; Bastos, L.; Gil, A.J.; Galindo-Zaldívar, J.; de Galdeano, C.S. PS-InSAR processing method-ologies in the detection of field surface deformation—Study of the Granada basin (Central Betic Cordilleras, southern Spain). J. Geodyn. 2010, 49, 181–189. [Google Scholar] [CrossRef]
- Hooper, A.; Segall, P.; Zebker, H. Persistent scatterer interferometric synthetic aperture radar for crustal deformation analysis. J. Geophys. Res. 2007, 112, 1–21. [Google Scholar]
- Liu, Y.; Fan, H.; Wang, L.; Zhuang, H. Monitoring of surface deformation in a low coherence area using distributed scatterers InSAR: Case study in the Xiaolangdi Basin of the Yellow River, China. Bull. Eng. Geol. Environ. 2021, 80, 25–39. [Google Scholar] [CrossRef]
- Goel, K.; Adam, N. A distributed scatterer interferometry approach for precision monitoring of known surface deformation phenomena. IEEE Trans. Geosci. Remote Sens. 2013, 52, 5454–5468. [Google Scholar] [CrossRef]
- Liu, G.; Zbigniew, P.; Stefano, S.; Benni, T.; Wu, L.; Fan, J.; Joaquim, J.S. Land Surface Displacement Geohazards Monitoring Using Multi-temporal InSAR Techniques. J. Geod. Geoinf. Sci. 2021, 4, 77. [Google Scholar]
- Li, T.; Zhang, H.; Fan, H.; Zheng, C.; Liu, J. Position inversion of goafs in deep coal seams based on DS-InSAR data and the probability integral methods. Remote Sens. 2021, 13, 2898. [Google Scholar] [CrossRef]
- Ferretti, A.; Fumagalli, A.; Novali, F.; Prati, C.; Rocca, F.; Rucci, A. A New Algorithm for Processing Interferometric Data-Stacks: SqueeSAR. IEEE Trans. Geosci. Remote Sens. 2011, 49, 3460–3470. [Google Scholar] [CrossRef]
Figure 1.
Location of the study area in Sichuan Province, China.

Figure 2.
Types and distribution of known geological hazards of study area.
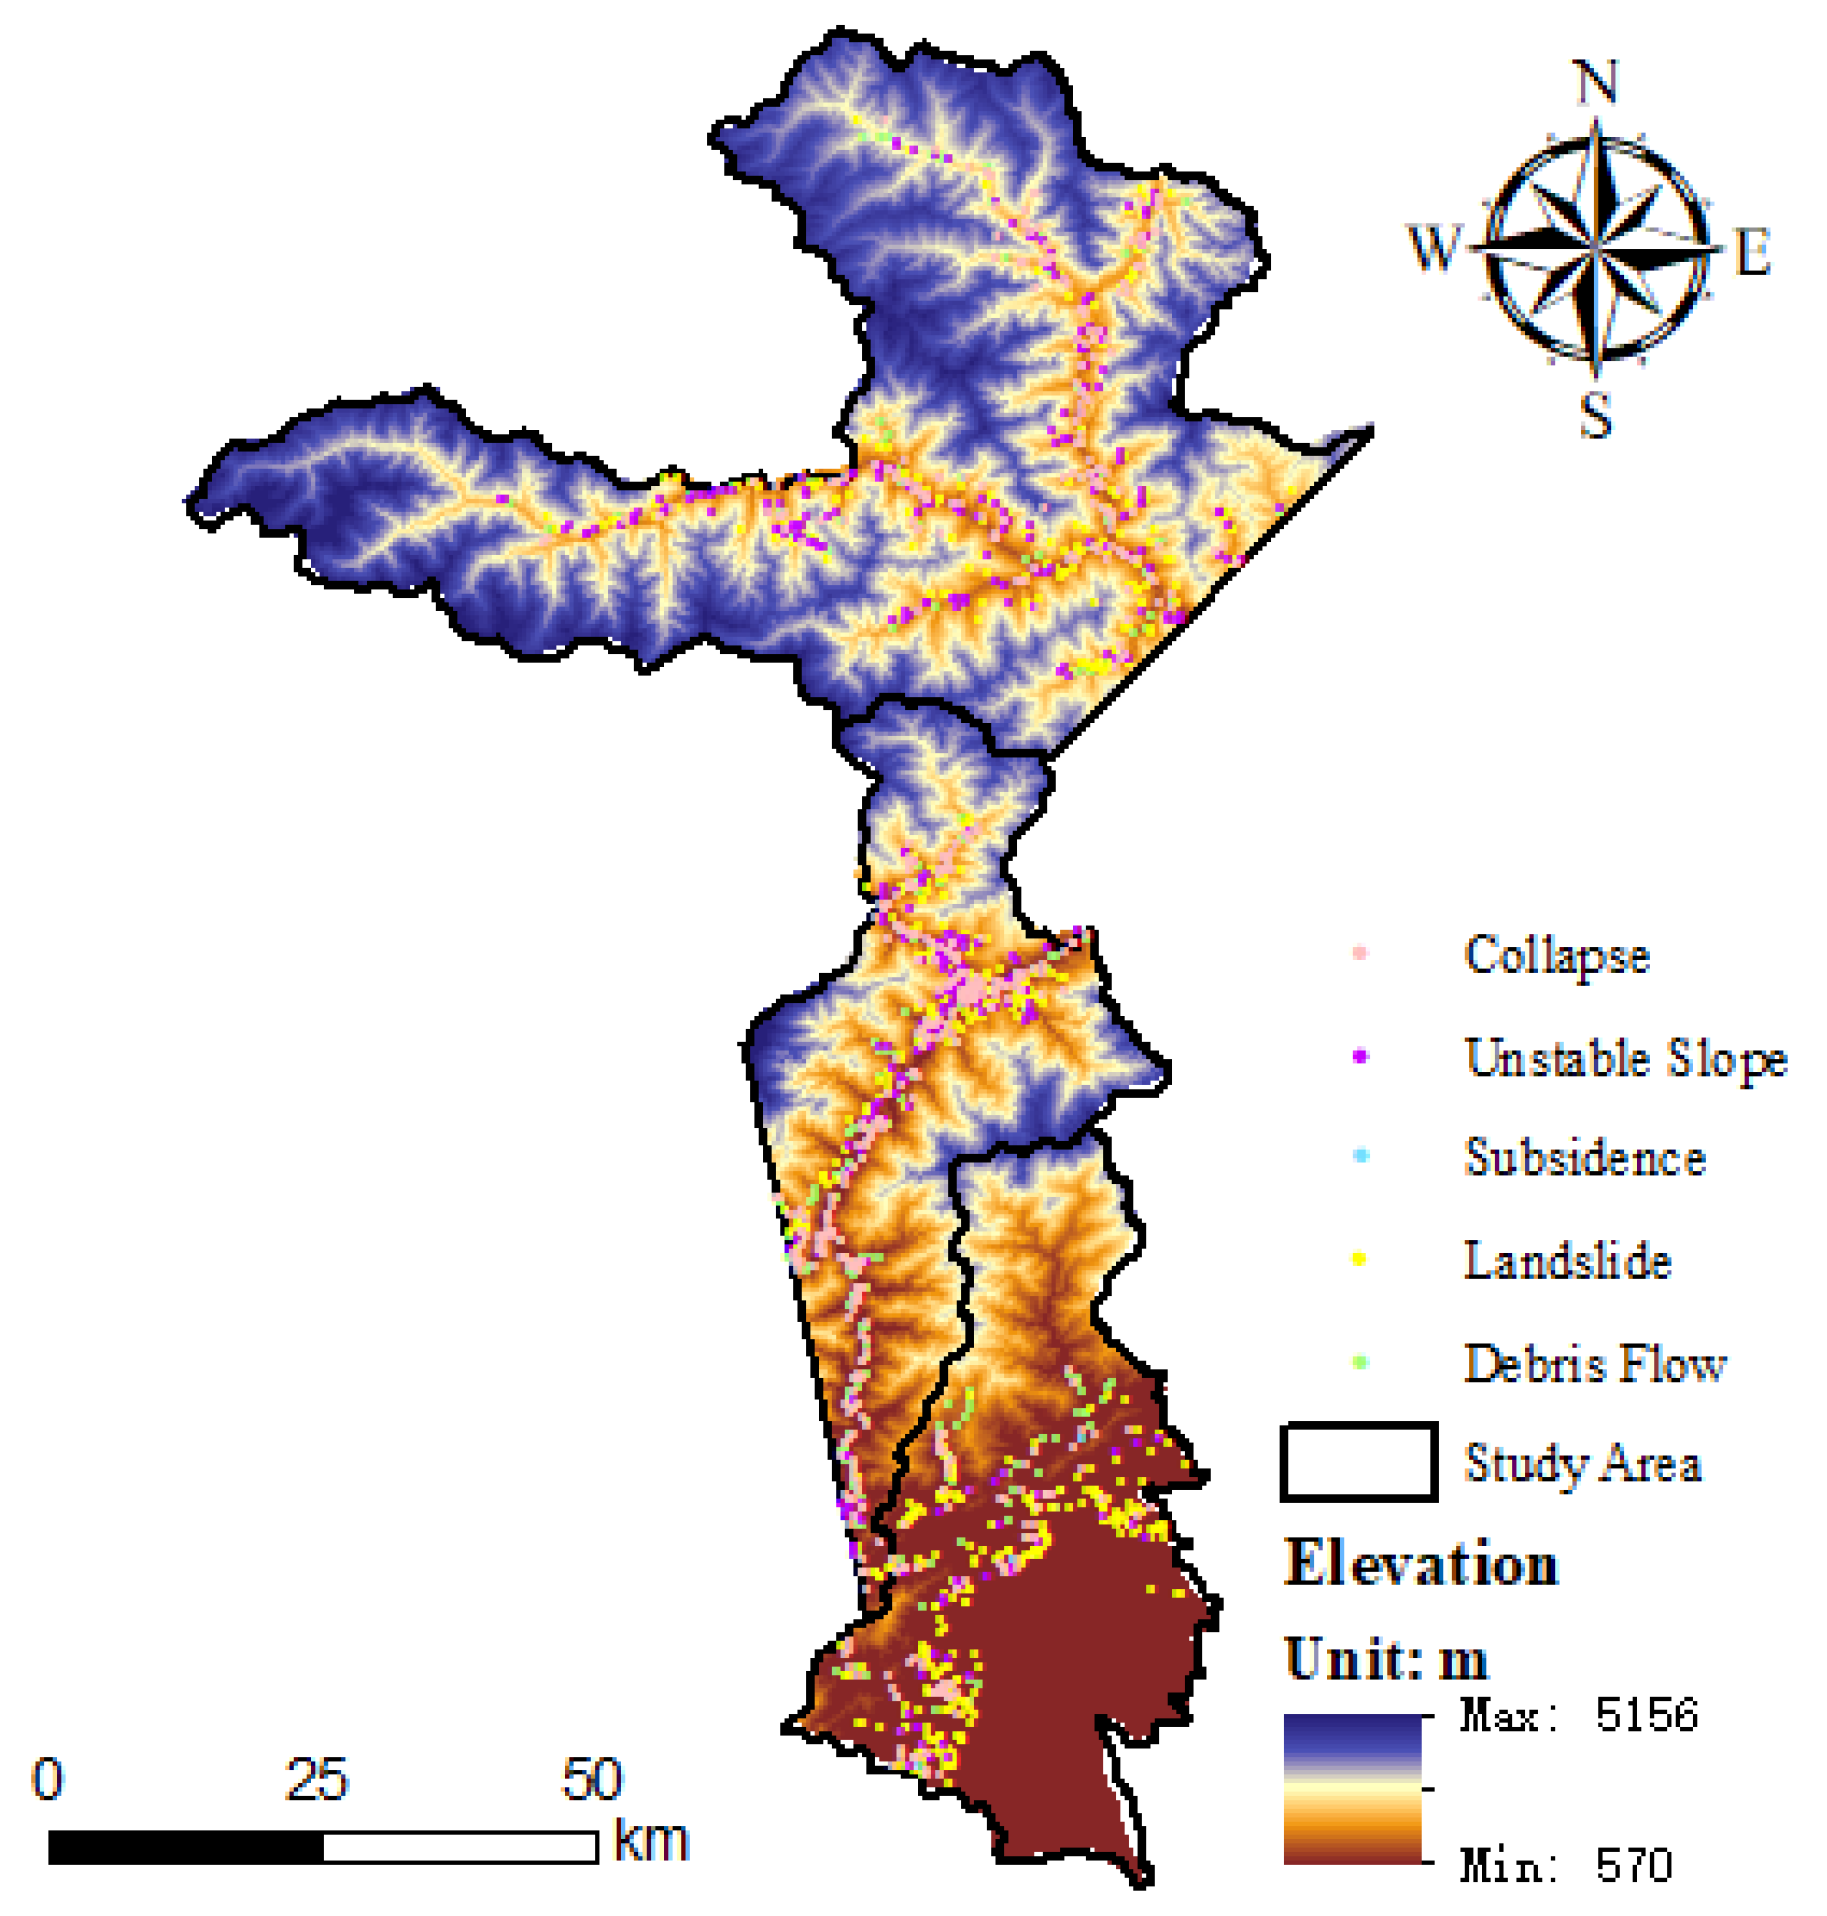
Figure 3.
Optical images are used as an aid to identify and monitor the hidden dangers of geological disasters. (a) GF-1 optical image distribution; (b) GF-2 optical image distribution.
Figure 3.
Optical images are used as an aid to identify and monitor the hidden dangers of geological disasters. (a) GF-1 optical image distribution; (b) GF-2 optical image distribution.
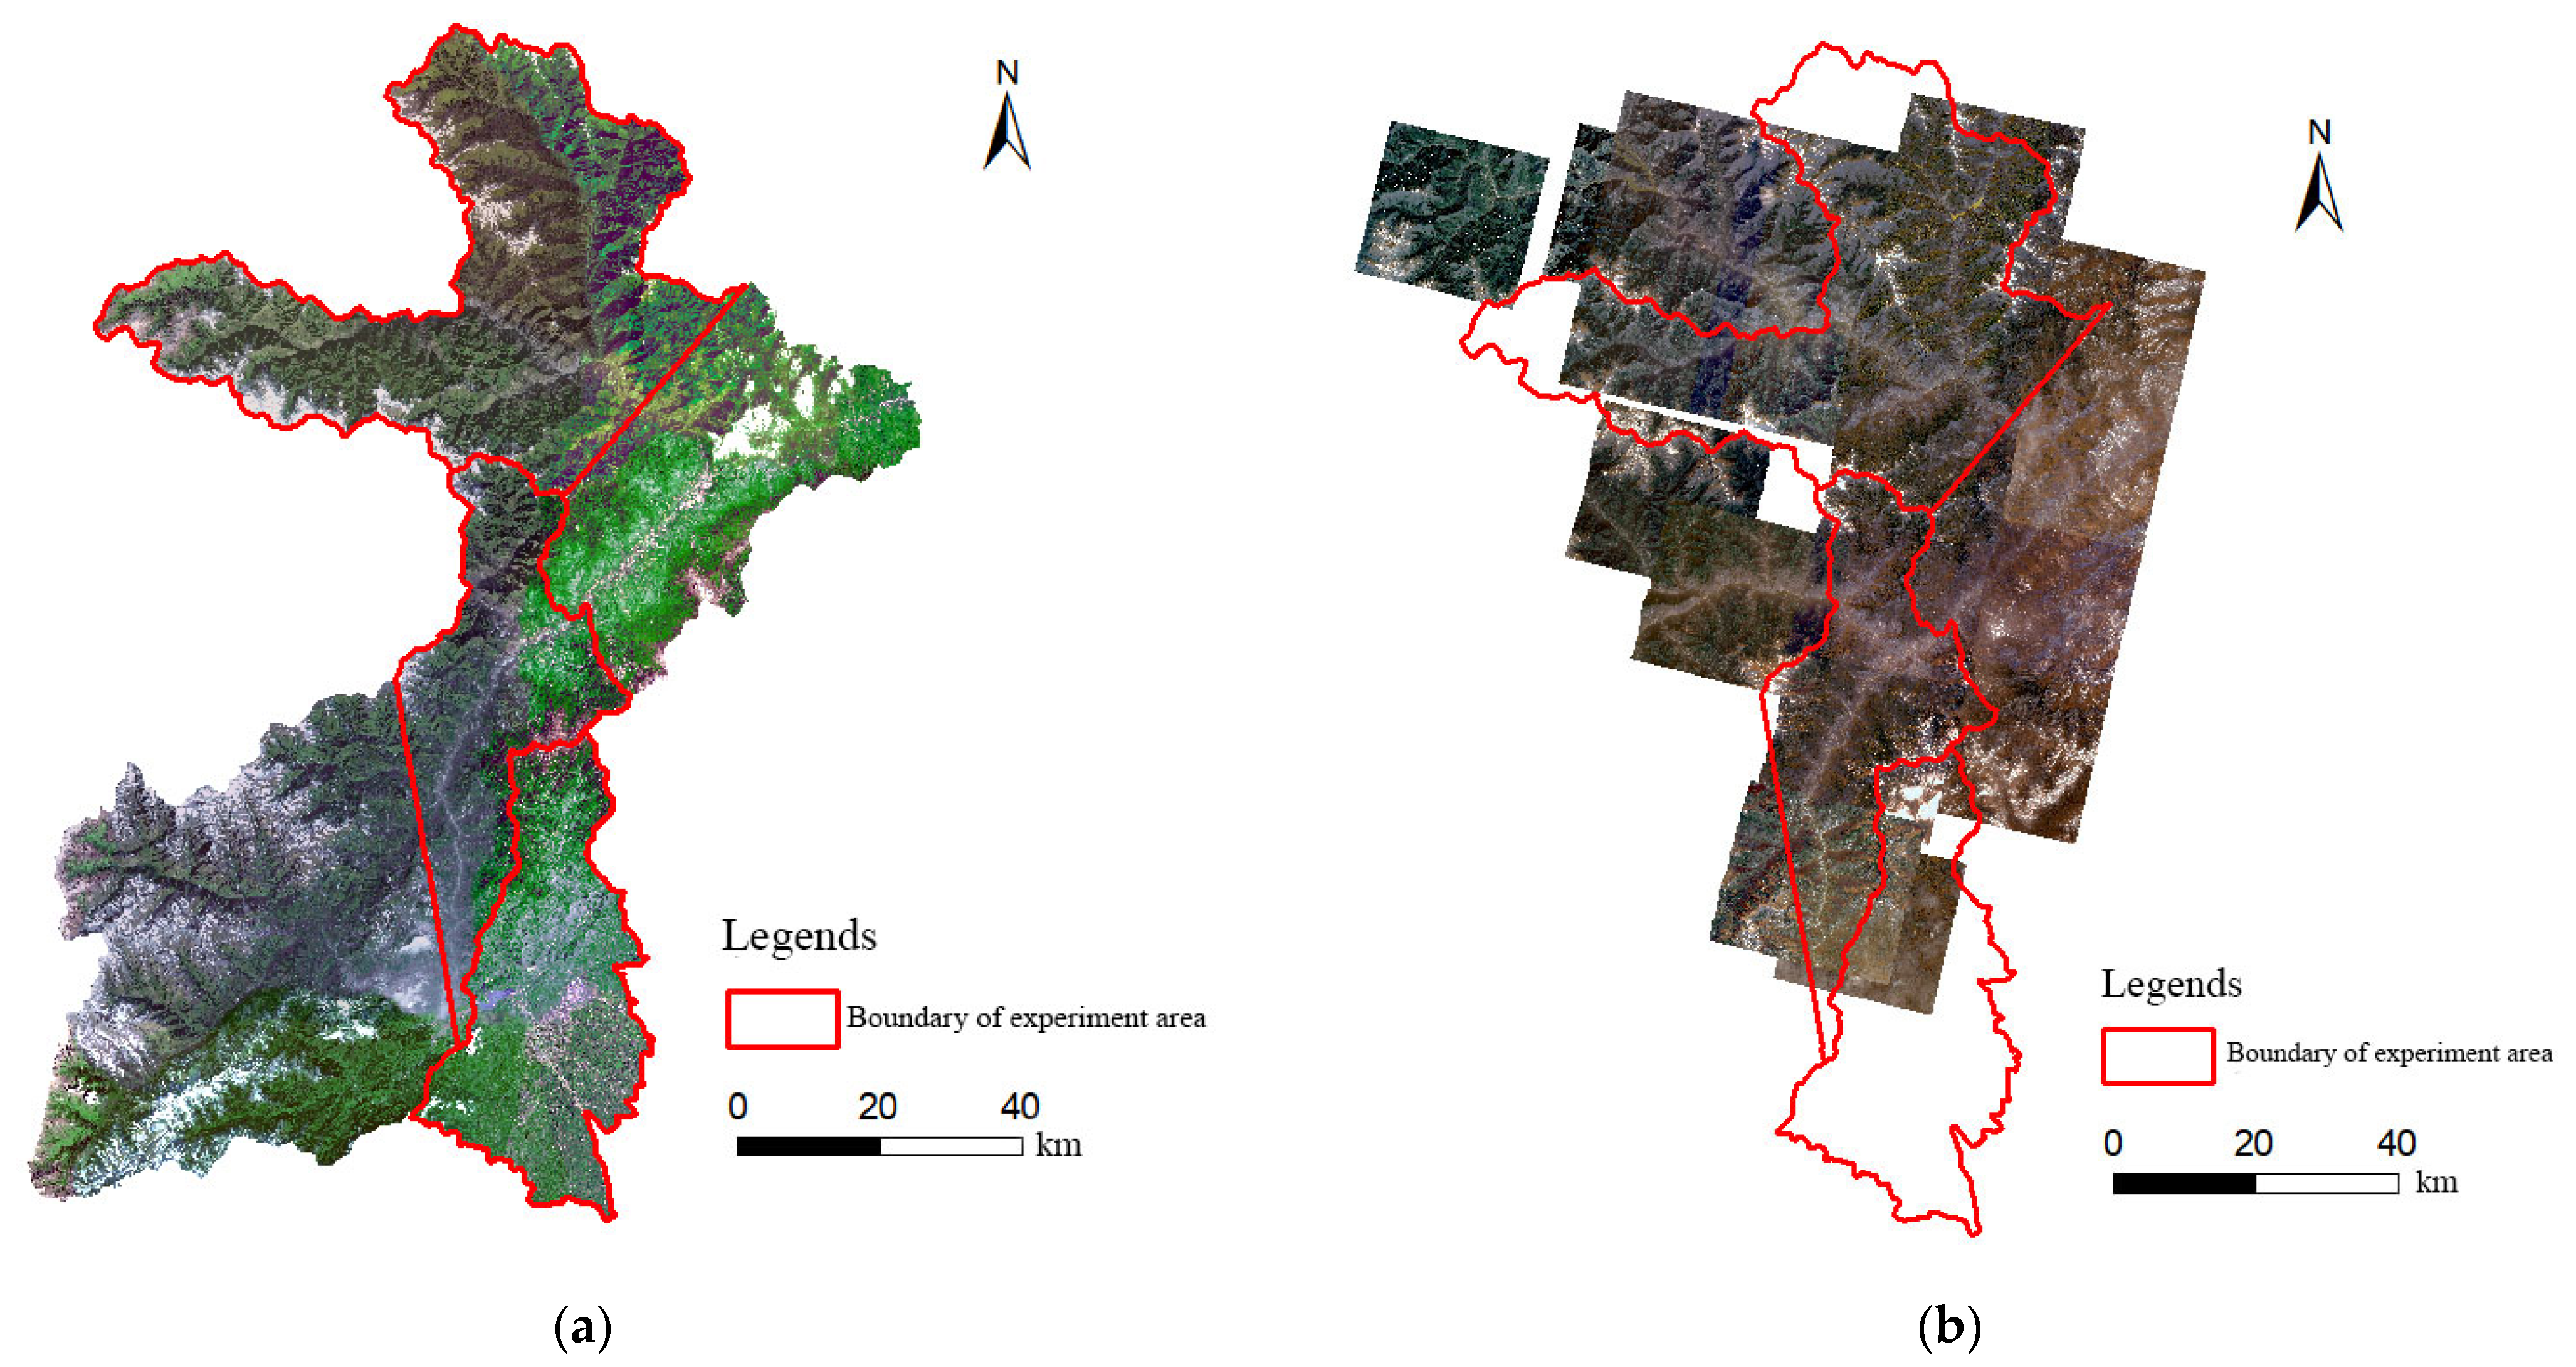
Figure 4.
The distribution of collected SAR images and their related data. (a) The distribution of SAR image data; and (b) the distribution of DEM data.
Figure 4.
The distribution of collected SAR images and their related data. (a) The distribution of SAR image data; and (b) the distribution of DEM data.
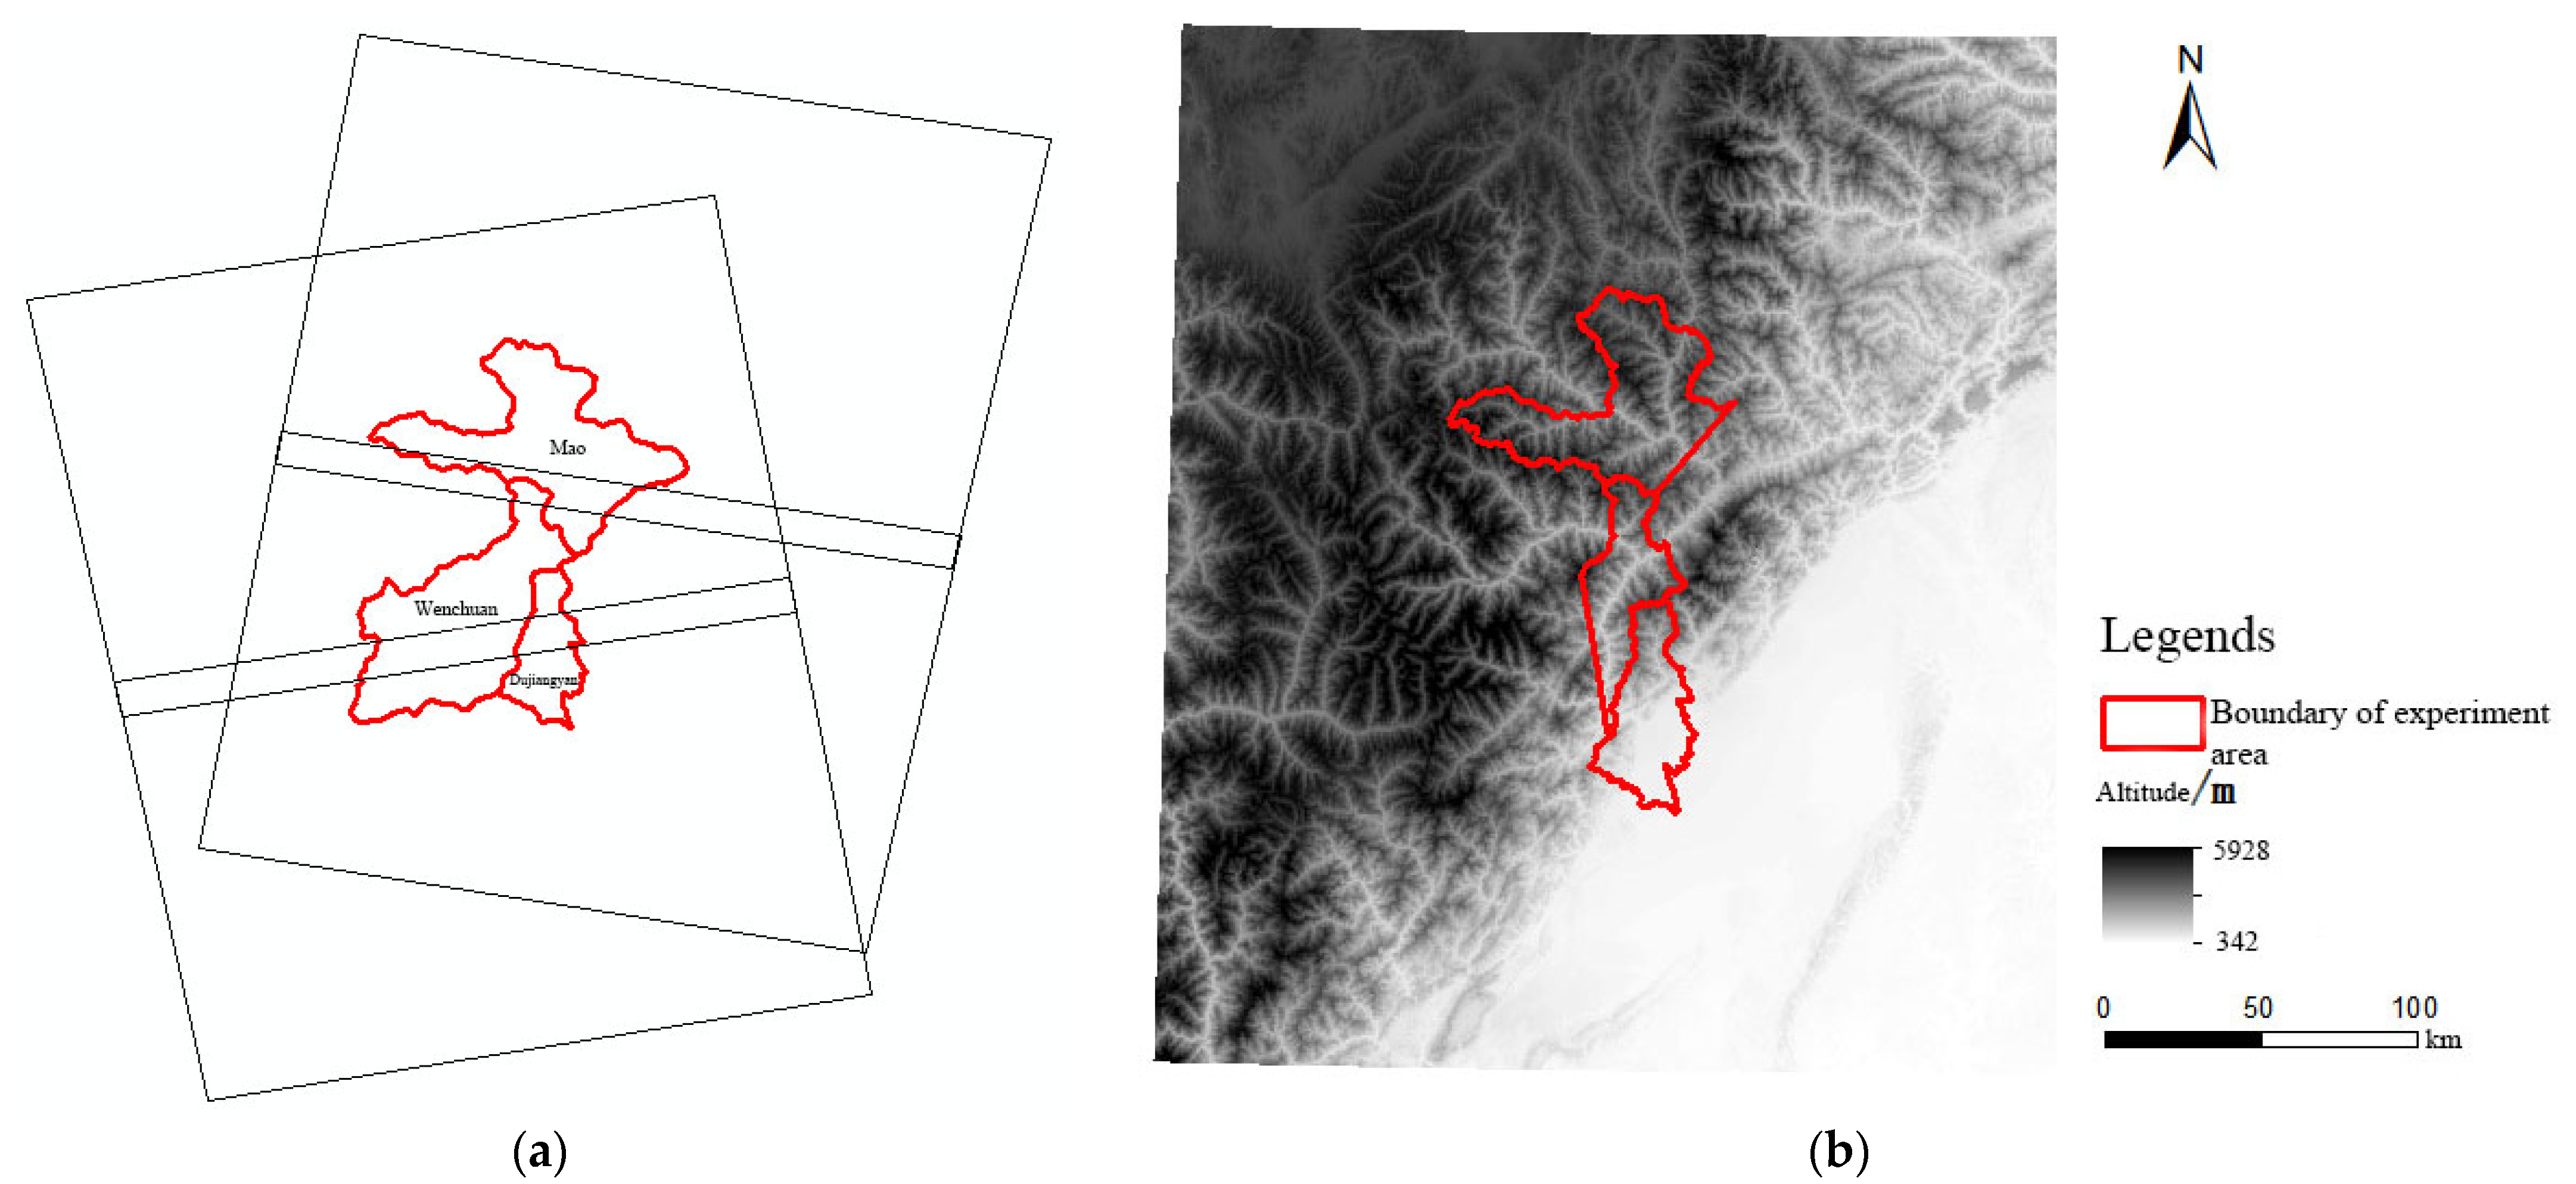
Figure 5.
The overall technical flow chart.
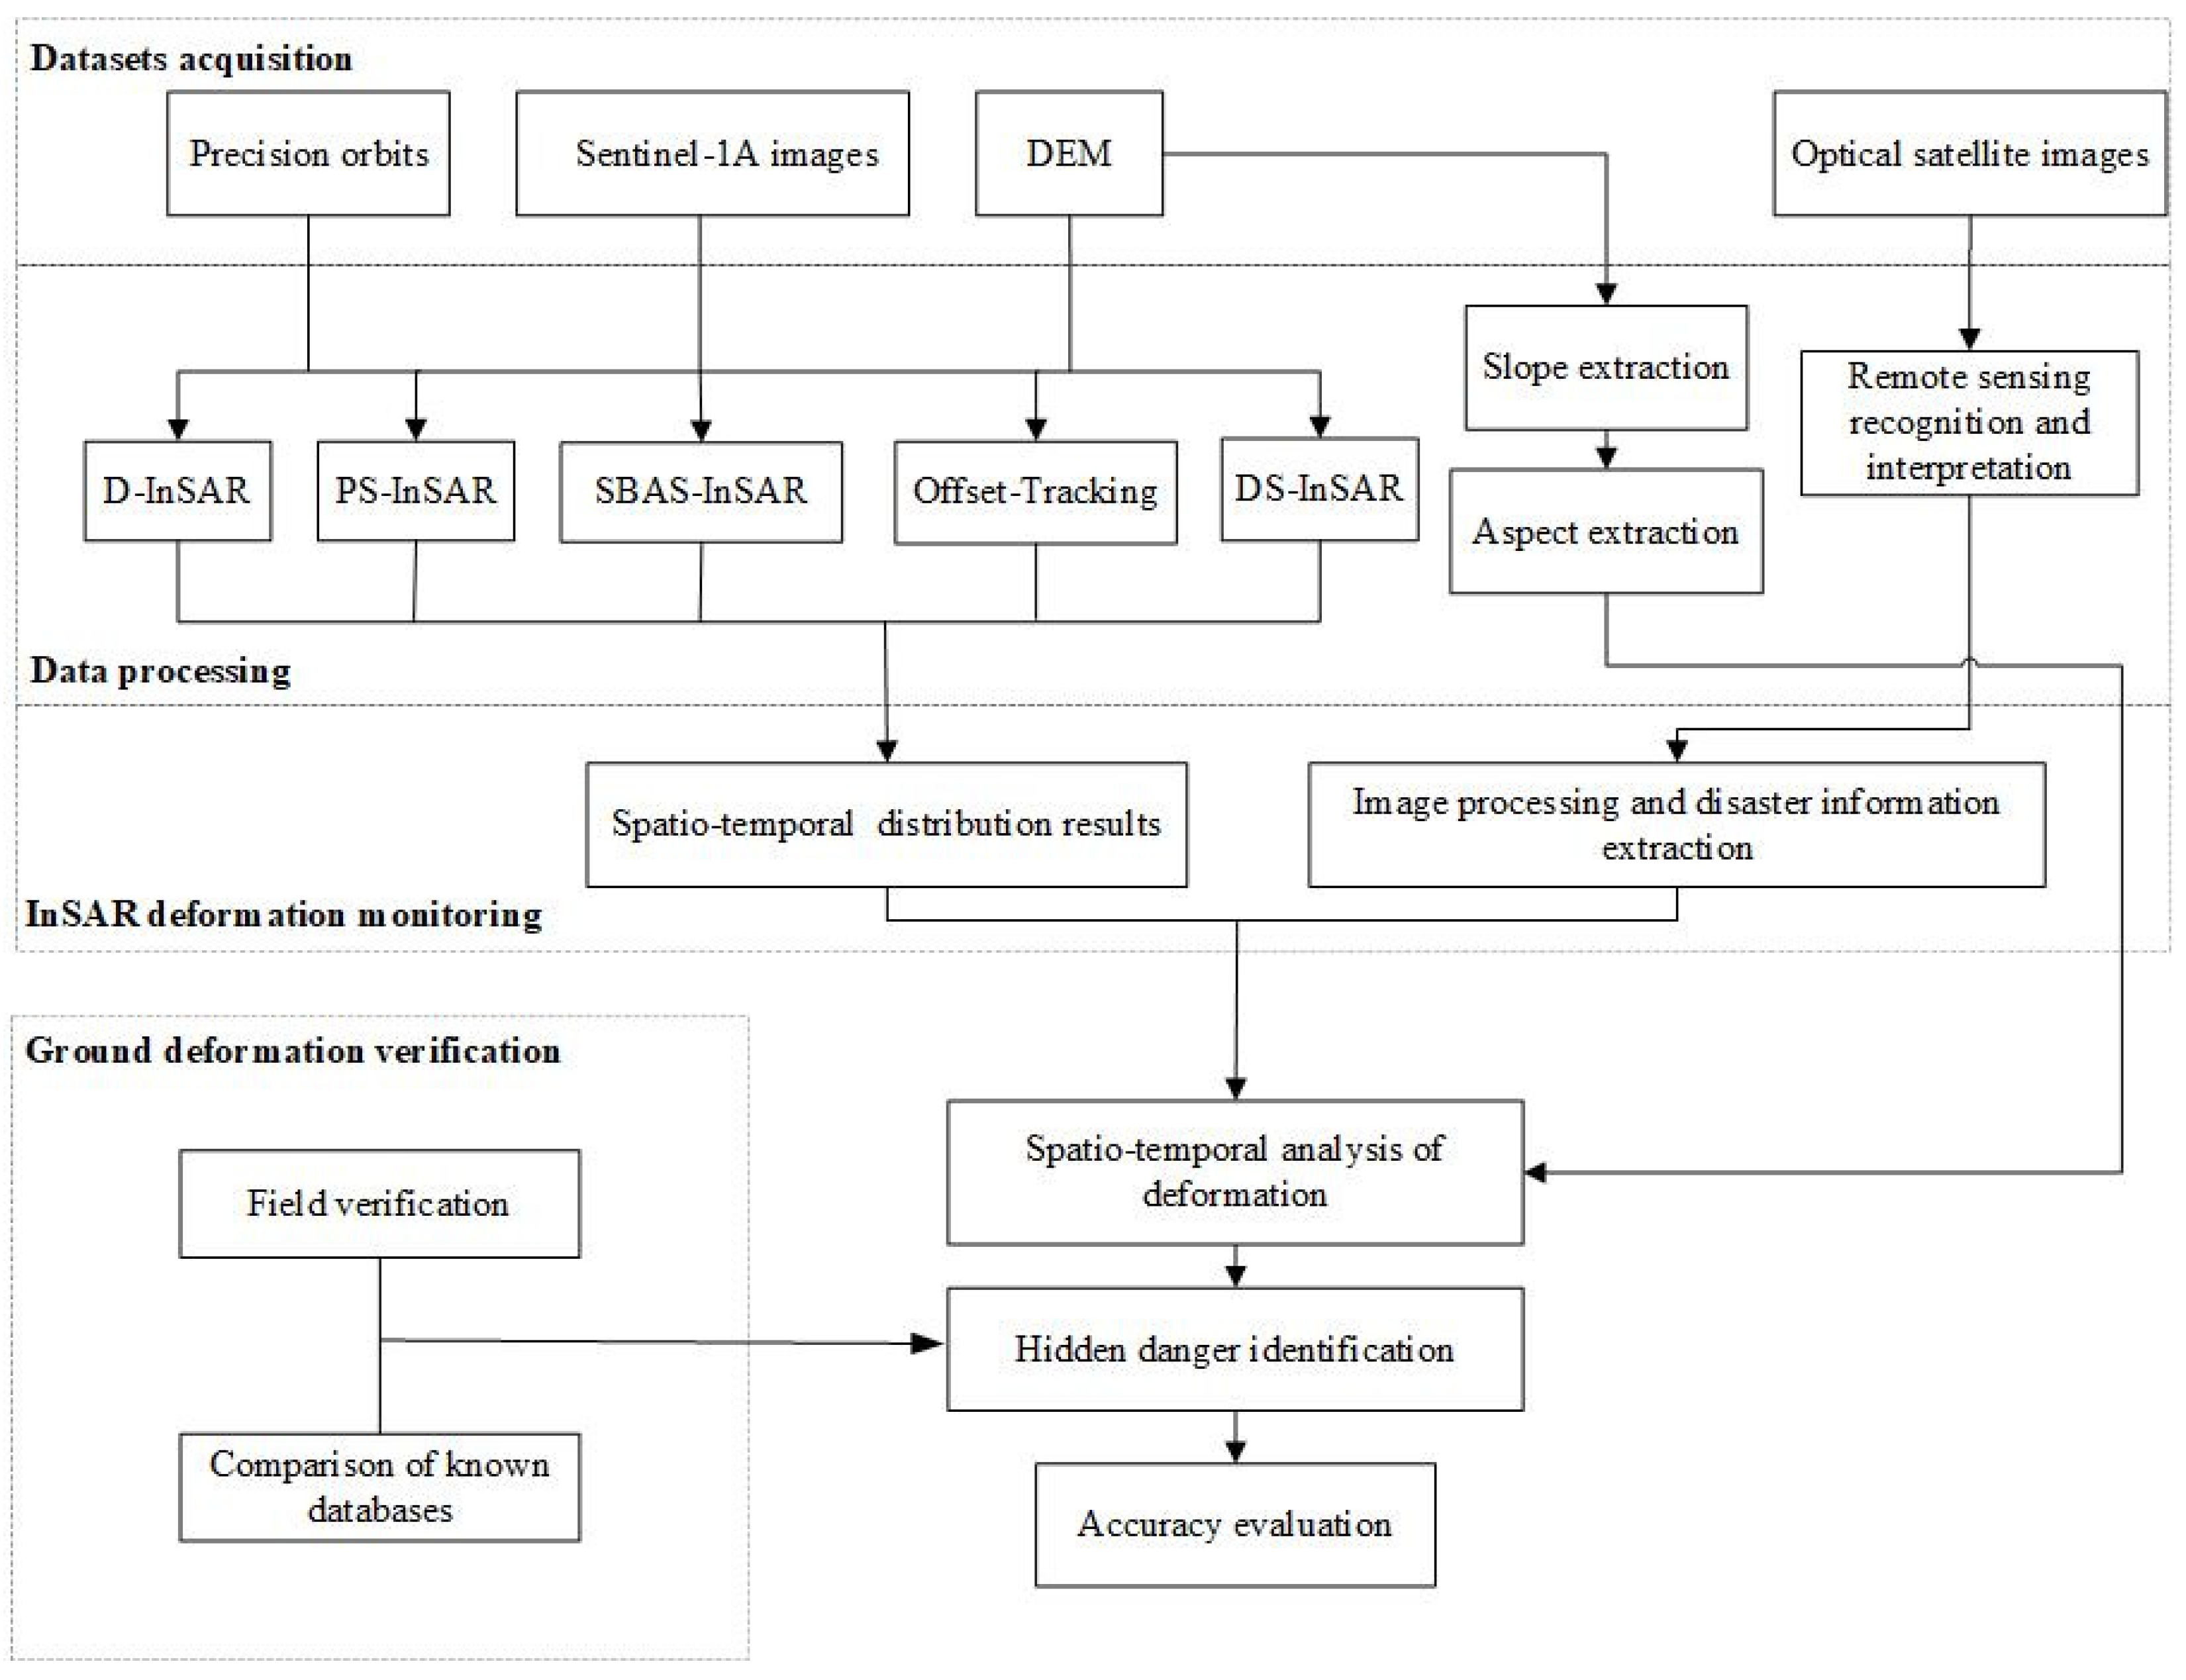
Figure 6.
Geometric relationship of differential radar interferometry imaging.

Figure 7.
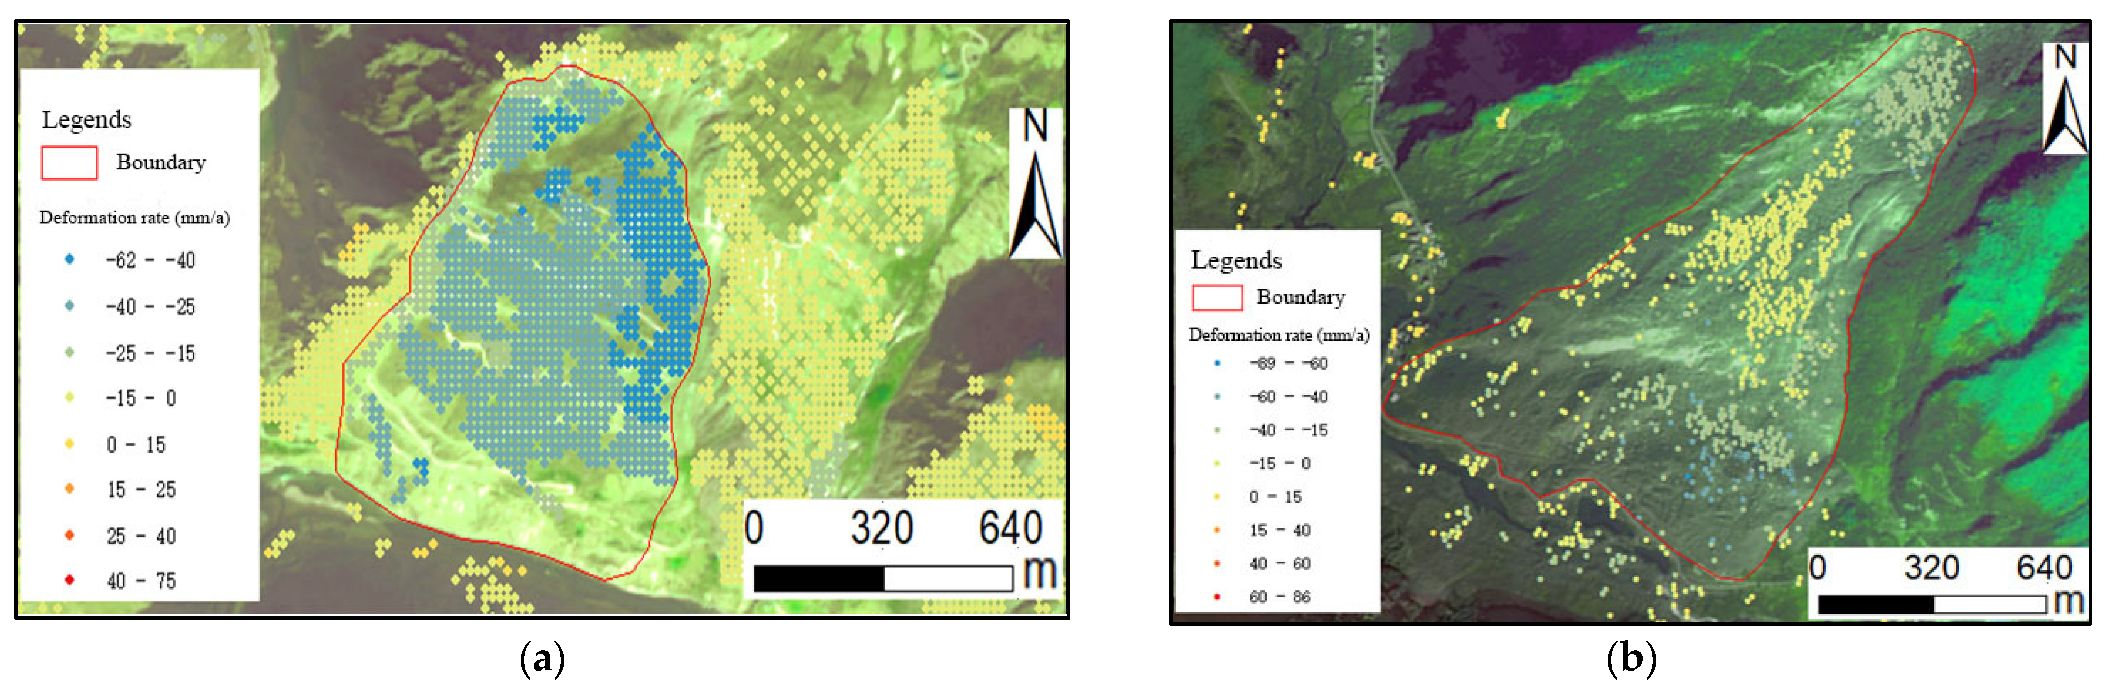
Deformation monitoring results from different InSAR algorithms at different elevation intervals. (a) Geological hazard area interpreted based on D-InSAR algorithm (elevation interval is below 1000 m); (b) geological hazard area interpreted based on SBAS-InSAR algorithm (elevation ranged from 1000 m to 3500 m); and (c) geological hazard area interpreted based on DS-InSAR algorithm (elevation ranged from 1000 m to 3500 m).
Figure 7.
Deformation monitoring results from different InSAR algorithms at different elevation intervals. (a) Geological hazard area interpreted based on D-InSAR algorithm (elevation interval is below 1000 m); (b) geological hazard area interpreted based on SBAS-InSAR algorithm (elevation ranged from 1000 m to 3500 m); and (c) geological hazard area interpreted based on DS-InSAR algorithm (elevation ranged from 1000 m to 3500 m).


Table 1.
Main parameter information of Sentinel-1A satellite data.
| Satellite System Parameters | Description |
|---|---|
| Launch date | April 2014 |
| Frequency | 5.4 GHz |
| Band | C |
| Revisit period | 12 d |
| Shooting mode | IW |
| Resolution ratio (m) | 5 × 20 |
| Width of cloth | 250 km |
| Polarization mode | VV |
Table 2.
Potential hazards are monitored by InSAR algorithms.
| No. | Repetitive | Non-Repetitive | Total | |
|---|---|---|---|---|
| Methods | ||||
| D-InSAR | 3 | 2 | 5 | |
| SBAS-InSAR | 12 | 12 | 24 | |
| PS-InSAR | 9 | 3 | 12 | |
| DS-InSAR | 16 | 16 | 32 | |
| Offset-Tracking | 0 | 0 | 0 | |
Table 3.
Potential identified geological hazards in the study area.
| Types | No. Potential Geological Hazards | Total | ||
|---|---|---|---|---|
| Dujiangyan | Wenchuan | Mao | ||
| Landslide | 2 | 14 (7) | 29 (4) | 45 (11) |
| Collapse | 0 | 2 | 1 | 3 |
| Debris flow | 1 | 0 | 0 | 1 |
| Total | 3 | 16 (7) | 30 (4) | 49 (11) |
Remarks: The number of newly added potential geological hazard points is indicated in parentheses.
Table 4.
Distribution of geological hazard points obtained from interpretation of different elevation intervals.
Table 4.
Distribution of geological hazard points obtained from interpretation of different elevation intervals.
| Algorithms | No. Potential Disaster Points | Total | ||
|---|---|---|---|---|
| <1000 m | 1000–3500 m | >3500 m | ||
| D-InSAR | 1 | 4 | 0 | 5 |
| SBAS-InSAR | 0 | 24 | 0 | 24 |
| PS-InSAR | 0 | 12 | 0 | 12 |
| DS-InSAR | 2 | 30 | 0 | 32 |
| Offset-Tracking | 0 | 0 | 0 | 0 |
Table 5.
Results of the geological hazards.
| Values | Field Verification | Correct Number | Accuracy (%) | |
|---|---|---|---|---|
| Types | ||||
| Deformation areas | 13 | 9 | 69.23 | |
| New potential hazards | 11 | 7 | 63.64 | |
Table 6.
Distribution of deformation feature points monitored by different InSAR algorithms in different elevation intervals.
Table 6.
Distribution of deformation feature points monitored by different InSAR algorithms in different elevation intervals.
| Algorithms | No. Deformation Feature Points | Total | ||
|---|---|---|---|---|
| <1000 m | 1000–3500 m | >3500 m | ||
| PS-InSAR | 59,981 | 12,165 | 19,212 | 91,358 |
| SBAS-InSAR | 74,090 | 137,316 | 90,452 | 301,858 |
| DS-InSAR | 182,960 | 80,430 | 111,335 | 374,725 |
Publisher’s Note: MDPI stays neutral with regard to jurisdictional claims in published maps and institutional affiliations. |
© 2022 by the authors. Licensee MDPI, Basel, Switzerland. This article is an open access article distributed under the terms and conditions of the Creative Commons Attribution (CC BY) license (https://creativecommons.org/licenses/by/4.0/).
Share and Cite
MDPI and ACS Style
Zheng, Z.; Xie, C.; He, Y.; Zhu, M.; Huang, W.; Shao, T. Monitoring Potential Geological Hazards with Different InSAR Algorithms: The Case of Western Sichuan. Remote Sens. 2022, 14, 2049. https://doi.org/10.3390/rs14092049
AMA Style
Zheng Z, Xie C, He Y, Zhu M, Huang W, Shao T. Monitoring Potential Geological Hazards with Different InSAR Algorithms: The Case of Western Sichuan. Remote Sensing. 2022; 14(9):2049. https://doi.org/10.3390/rs14092049
Chicago/Turabian StyleZheng, Zezhong, Chuhang Xie, Yong He, Mingcang Zhu, Weifeng Huang, and Tianming Shao. 2022. "Monitoring Potential Geological Hazards with Different InSAR Algorithms: The Case of Western Sichuan" Remote Sensing 14, no. 9: 2049. https://doi.org/10.3390/rs14092049
Note that from the first issue of 2016, this journal uses article numbers instead of page numbers. See further details here.