
Remote Sensing-Detected Changes in Precipitation over the Source Region of Three Rivers in the Recent Two Decades


1
Key Laboratory of Land Surface Process and Climate Change in Cold and Arid Regions, Northwest Institute of Eco-Environment and Resources, Chinese Academy of Sciences, Lanzhou 730000, China
2
Zoige Plateau Wetland Ecosystem Research Station, Northwest Institute of Eco-Environment and Resources, Chinese Academy of Sciences, Lanzhou 730000, China
3
Southern Marine Science and Engineering Guangdong Laboratory (Zhuhai), Zhuhai 519000, China
4
University of Chinese Academy of Sciences, Beijing 100029, China
*
Author to whom correspondence should be addressed.
Remote Sens. 2022, 14(9), 2216; https://doi.org/10.3390/rs14092216
Submission received: 12 April 2022
/
Revised: 2 May 2022
/
Accepted: 4 May 2022
/
Published: 5 May 2022
(This article belongs to the Special Issue Land-Atmosphere Interactions and Effects on the Climate of the Tibetan Plateau and Surrounding Regions)
Abstract
:The source region of three rivers (SRTR) is an important water conservation area, also known as the Water Tower of Asia. Precipitation is one of the most important factors affecting the ecological system and water resources over the SRTR. However, the characteristics and mechanism of its change at different time scales are still uncertain. Using the GSMaP remote sensing products and ERA5 reanalysis data, this study analyzes the spatial and temporal variability of precipitation and water vapor transport in the SRTR over the past two decades. The annual precipitation slightly reduces in the north and west and slightly increases in the east and south parts of the SRTR. The spring, autumn and winter dominate the decrease in precipitation in most areas of the SRTR, while the summer contributes the most increases. In contrast with the 2000s, the afternoon precipitation slightly reduced in the 2010s, while the nighttime precipitation increases significantly. The changes in nighttime precipitation, especially its intensity, associated with the water vapor transport contribute to the changes in precipitation over the SRTR.
1. Introduction
The Tibetan Plateau (TP), due to its unique high altitude, large topography and hollow heating effect, plays an important role in the modulation of Asian and even global atmospheric circulation [1,2]. In recent decades, the TP has been experiencing rapid warming and humidification characteristics, with the warming rate almost 1.5 times the global average value [3]. Thus, the TP is known as the “initiator” and “amplifier” of climate change. The source region of Three Rivers (SRTR) is located on the eastern TP and includes the source region of the Yangtze River, Yellow River and Lantsang River and is honored as the “Asia’s Water Tower” [4]. Precipitation is one of the most important climatic factors affecting the ecological system and water resources over the SRTR [5]. Because it is located in the intersection area of the Indian monsoon, East Asian monsoon and westerly belt, the SRTR has a complex variety of climate types and inter-annual variation of precipitation [6]. Generally, the precipitation in the eastern and southern parts of the SRTR is significantly more than that in the northwest [7], and there is a complex coupling relationship between land surface processes and precipitation in different regions. Therefore, it is of great value for climate change, water resources research and ecological protection to study the characteristics and mechanisms of precipitation change in the SRTR.
The precipitation in the SRTR has been widely analyzed by using the in situ observation data. Besides the dominant pattern with high and low-value centers located in the southeast and northwest SRTR, respectively, a dipole pattern with southwest–northeast reverse distribution also exists in the SRTR [8]. From 1961 to 2019, the SRTR average annual precipitation was 470.7 mm and increased by 10.31 mm·10 a−1 [9], and the frequency of extreme events has increased [10]. The period 1971–1980 was the driest period since the year 1961, and 2001–2015 was the wettest period [11]. The trends in precipitation variation during spring, summer and autumn decreased from northwest to southeast, but the opposite trend was observed in winter [9]. Even in cold seasons, the precipitation has discordant trends in different months, with an increasing trend in November and February and a decreasing trend in other winter months [12].
In addition to meteorological station data, remote sensing products and reanalysis data have also been used to analyze precipitation in the SRTR. The Global Precipitation Climatology Project (GPCP) data are in agreement with the in situ measured precipitation [13]. The Integrated Multisatellite Retrievals for Global Precipitation Measurement (IMERG) products are affected by the temporal scale, precipitation intensity and phase, and the performance in the wet season is superior to that in the dry season [14]. Compared to the in situ observation data, the Climatic Research Unit (CRU) dataset underrated the annual precipitation but gave a similar variation characteristic in the SRTR [15]. On the same time scale, the consistency of NOAA Climate Prediction Center (CPC) products and Tropical Rainfall Measuring Mission (TRMM) products is better than that of the NOAA PERSIANN Precipitation Climate Data Record (PERSIANN-CDR) products [16]. Overall, remote sensing products have a higher ability to detect precipitation in high-altitude areas (>3000 m) than in low-altitude areas (<3000 m), and they have a better detection performance for light rain than moderate and heavy rain events [16].
Many studies have focused on the sources of water vapor and mechanisms of precipitation variation over the SRTR under different climates, but the results remain inconclusive. A study using the GPCP data suggests that the abnormal wind convergence and the low-pressure system, combined with the effects of the western Pacific subtropical high and the Mongolian high, provide conditions for the transport of water vapor and precipitation over the SRTR [13]. Another study suggests that Niño3.4, North Atlantic oscillation and Arctic oscillation play more important roles in the variation of dryness/wetness patterns in the SRTR [12]. In the cold season, the mechanisms for the interannual variation in precipitation are significantly different in different months. The main factors modulating the interannual variability of precipitation are the anomalous westerly water vapor transport (WVT) branch in November and southwesterly WVT anomalies in January and February [13].
In general, previous studies mostly focused on the analysis of long-term interannual or seasonal variations of SRTR precipitation and rarely discusses the changes in specific precipitation types (such as afternoon convective precipitation or nocturnal precipitation). A few studies have found that precipitation in the TP occurred mostly in the afternoon and night due to the thermal processes and the longwave radiation cooling [17,18]. In this study, we used the remote sensing precipitation product to diagnose precipitation changes in the SRTR in the last two decades. As previous studies emphasized an important influence of the hydrological cycle on local precipitation [19,20,21], we also present variation of afternoon precipitation as it is a dominant part of local triggered precipitation and is strongly related to the local thermal and hydrological processes. The paper is organized as follows. Section 2 introduces the study area and data used in this study. Section 3 presents the results. Section 4 is the discussion. Section 5 presents the conclusions.
2. Study Area and Data
2.1. Study Area
The SRTR is located in the northeastern of the TP, with an average elevation of 3500 m; we mainly focused on the area of 30–37°N and 88–104°E in this study (Figure 1). Previous studies show that 38% of runoff in the source region of the Yellow River, 15% of runoff in the source region of the Lantsang River and a considerate amount of runoff in the Yangtze River originate from the SRTR [4,22]. The GSMaP_Gauge is densely covered with rivers, lakes, wetlands, snow-capped mountains and glaciers and thus is an important ecological shelter zone in China [23].
2.2. The GSMaP Precipitation Product
GSMaP (Global Satellite Mapping of Precipitation) and IMERG (Integrated Multi-satellite Retrievals for GPM) are two widely used satellite precipitation products in the GPM era, with high spatial and temporal resolutions. GSMaP (Global Satellite Mapping of Precipitation), developed by the Japan Aerospace Exploration Agency (JAXA) (https://sharaku.eorc.jaxa.jp/GSMaP_CLM/index.htm, accessed on 10 May 2020), is one of the most popular algorithms in the era of GPM [24,25]. The GSMaP_Guage product we used in this study is a gauge-calibrated product that adjusts the GSMaP_MVK estimation with CPC (Climate Precipitation Center) gauge-based analysis of global daily precipitation, whose spatial and temporal resolutions are 0.1° × 0.1° and 1 h, respectively. Kentaro et al. (2015) compared GSMaP_Gauge and GSMaP_MVK products in Japan and found that GSMaP_Gauge products have a better detection performance under different time scales and precipitation intensities [26]. Previous studies show that GSMaP gets some improvements in inversion accuracy and hydrological simulation utility compared to TRMM (Tropical Rainfall Measuring Mission) products over the Tibetan Plateau [27]. In the Yellow River basins. The latest GSMaP data is evaluated as having a relatively higher accuracy than IMERG [28].
2.3. ERA5 Reanalysis Data
ERA5 is the fifth generation of global climate atmospheric reanalysis information from the Copernicus Climate Change Service (C3S) at the European Centre for Medium-range Weather Forecasts (ECMWF) (https://www.ecmwf.int/en/forecasts/dataset/ecmwf-reanalysis-v5, accessed on 30 August 2021), which uses an advanced modeling and data assimilation system to combine model data with observations from around the world to form a globally complete and consistent dataset. Compared to its predecessor, ERA5 has a finer horizontal grid of about 30 km while also improving vertical resolution and providing hourly estimates of a large number of atmospheric, terrestrial and oceanic climate variables [29,30,31]. Moreover, ERA5 effectively corrects for overestimating some physical quantities of thermodynamics and can be used for general analysis of the Tibetan Plateau [32,33].
3. Results
3.1. Climatology of Precipitation
Figure 2 shows the climatology of annual and seasonal precipitation on the SRTR. The annual precipitation ranges from 500 to 1000 mm/a, presenting a pattern of gradual decrease from southeast to northwest. Among the different seasons, summer (June-July-August, JJA) precipitation dominates the pattern of annual precipitation, accounting for about 61.3% of the annual precipitation (Figure 3). In spring (March-April-May, MAM), summer and autumn (September-October-November, SON), the precipitation distribution presents a pattern of decrease from southeast to northwest, while in winter (December-January-February, DJF), precipitation has no significant spatial distribution characteristics. In addition, the summer precipitation is mainly in July and August, suggesting influences of water vapor transport by the summer monsoon.
In terms of precipitation occurrence ratio (i.e., proportion of precipitation days in the total days, Figure 4), the distribution characteristics for multi-year climatology, MAM, JJA and SON consistently decline from southeast to northwest, the same as precipitation amount shown in Figure 2. There is not much distinction between MAM and SON. However, for JJA, precipitation days occupy more than 60%, particularly in June, almost 80% of the days have precipitation events, followed by July and August. In the west of the SRTR, precipitation is suppressed most of the time. However, for the east part of the source region of the Yellow River, it always presents a relatively higher frequency of precipitation in all seasons, which has also become an important water supply area for the Yellow River. In DJF, precipitation only occurs in this region, suggesting a very dry condition in other regions of the SRTR.
3.2. Changes in Precipitation
3.2.1. Precipitation Amount
Figure 5 shows differences between the climatology of precipitation in the two decades, i.e., 2010 to 2019 and 2001 to 2010. For the annual average precipitation, it shows a slight decrease in the north and west of the SRTR and a slight increase in the eastern and southern parts. In a large area of central SRTR, precipitation shows tiny variation. The most significant changes happened in the southeast of the source region of the Yellow River and the Lantsang River. Considering the contribution of different seasons, MAM, SON and DJF dominate the decreasing of precipitation in most area of the SRTR, while JJA contributes the most increases. Precipitation in spring presents a similar pattern, with the annual average, while in SON, precipitation in most of the area shows a drying trend except the southeast of the source region of the Yellow and Lanstang Rivers. The winter presents a total drying pattern in contrast with the total wetting variation in most areas in summer. For different months in summer, precipitation shows a significant increase in June, especially in the center to the south, while it has an increase in the north in August. In July, it shows basically a drying trend in the northwest of the SRTR and a wetting trend in the south.
3.2.2. Precipitation Frequency
As to the changes in precipitation frequency, for the annual average, MAM, SON and DJF, most areas show a reduction in the precipitation occurrence ratio (Figure 6). Only in June and August do the precipitation occurrence ratios increase in most areas. In the west of the Yangtze River headwater region, a significant rise in the precipitation occurrence ratio is presented, although the precipitation amount does not increase correspondingly in this region. The spatial correlation coefficients between the variations of precipitation amount and precipitation occurrences ratio over the two decades are 0.689, 0.752, 0.48, 0.697 and 0.437 for the annual average, MAM, JJA, SON and DJF, respectively. The higher spatial correlation in MAM and SON suggests the possibility of precipitation reduction caused by the decreasing precipitation frequency in these two seasons, while this is not the same in JJA and DJF. In June, July and August, the spatial correlation coefficients are 0.195, 0.604 and 0.611, indicating the inconsistency in changes in precipitation amount and frequency.
3.2.3. Afternoon and Nighttime Precipitation
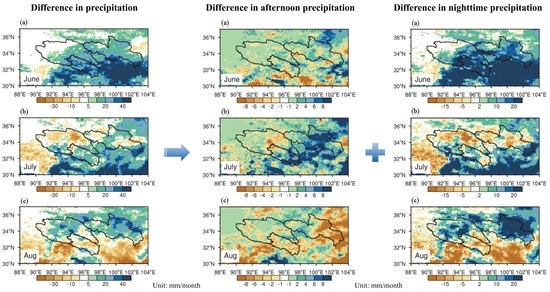
Figure 7 shows the changes in afternoon precipitation in the same period as Figure 5. To address the contribution of afternoon precipitation to precipitation changes in the two decades, we calculated spatial correlation coefficients between the afternoon precipitation differences and total precipitation differences between the two decades (Table 1). Comparing Figure 5 with Figure 7, there was a similar pattern in Year, MAM, SON and JJA, but the results were quite different in the three months in summer. In terms of the spatial correlation coefficients, the maximum is from the total precipitation changes between the two decades, and the correlation coefficients are 0.552, 0.438, 0.518 and 0.805 for MAM, JJA, SON, and DJF, respectively, which are all larger than that in each month in summer.
As shown in Figure 8, the nighttime precipitation changes show similar patterns as in Figure 5, except the magnitude in the night is different. The spatial correlation coefficients are around 0.9 for almost all time periods (Table 2), suggesting a dominant contribution of nighttime precipitation to the total precipitation changes. Figure 9 shows diurnal changes in precipitation rates between the two decades. In the morning in the local time (i.e., 00:00 to 04:00 UTC), there are no significant changes between the two decades. For afternoon precipitation (04:00 UTC to 12:00 UTC), there is a slight reduction in the 2010s in contrast with the 2000s, whilst there is a strong increase shown for the nighttime precipitation, emphasizing the contribution of nighttime precipitation variation to the total precipitation.
In order to quantify the causes of precipitation changes, we calculated the correlation coefficients of precipitation difference with precipitation probability, afternoon precipitation difference, nighttime precipitation difference, afternoon precipitation frequency difference and nighttime precipitation frequency difference (Table 3). It is very clear that the maximums of the correlation coefficients occur between the precipitation difference and the nighttime precipitation difference, suggesting the domination of nighttime precipitation changes in the total variations. When comparing the precipitation intensity and frequency in the nighttime (Table 4), the nighttime precipitation intensity difference shows a higher correlation with the night precipitation changes, implying the domination of nighttime precipitation.
4. Discussion
As was shown above, the nighttime precipitation intensity dominates the variations of night precipitation and then precipitation amount in the SRTR. Previous studies have investigated the interdecadal variability of regional precipitation in the SRTR. For example, Shang et al. (2021) found that the increased precipitation in the cold season over the SRTR is associated with the strengthened easterly anomalies over the TP and water vapor meridional transport enhancement from tropical oceans and the South China Sea [34]. Zhao et al. (2021) found the heavy precipitation events, which mainly contribute to the interannual increasing trend of summer precipitation over the SRTR, could be largely attributed to the enhanced moisture sources from the neighboring northeastern areas of the SRTR [35]. It is necessary to diagnose the changes in water vapor between the two decades.
Figure 10 shows the difference between the climatology of water vapor and its divergence between the two decades. For the changes in annual average and different seasons, the variation in atmospheric water vapor convergence and dispersion is in good agreement with the variation in the nighttime precipitation (Figure 8). For example, in SON and July, the increase in water vapor transported from the south side and the decrease in water vapor on the north side result in a distribution characteristic of a dry north and a wet south, despite the spatial gradients being different. In MAM and DJF, the water vapor variation is not evident, and with the strong decrease of vertical velocity (figure not shown), the nighttime precipitation of the SRTR generally presents a reduction trend (Figure 8). For JJA, a clearly drying trend is shown, although the pattern varies from month to month. Basically, the water vapor transport increases from the south ocean in the monsoon period, while it shows a decreasing trend in the monsoon retreat period. It is worth noting that the substantial drying of the atmospheric water vapor content and decrease of vertical upward motion in July in the past two decades over the whole SRTR has led to a decrease in summer precipitation, which are different from other studies focusing on longer time periods [12,35,36,37].
5. Conclusions
This study focuses on the spatial and temporal variability of precipitation in the SRTR over the past two decades based on satellite observations and reanalysis data. The annual precipitation shows a slight reduction in the north and west of the SRTR and a slight increase in the east and south parts. In most regions of central SRTR, there is little variation in precipitation. For the annual variation, JJA contributes the most increases, while the remaining three seasons dominate the decrease in precipitation in most areas of the SRTR. In the west of the Yangtze River headwater region, although the precipitation amount does not increase, the precipitation occurrences ratio significantly raises. The higher spatial correlation between the precipitation amount and precipitation occurrences ratio in MAM and SON suggests the possibility of precipitation reduction caused by the decreasing precipitation frequency in these two seasons, while this is not the same in JJA and DJF. In contrast with the 2000s, the afternoon precipitation slightly reduced in the 2010s, while there is a strong increase shown for the nighttime precipitation. The spatial correlation coefficients between nighttime and total precipitation differences between the two decades are around 0.9 for almost all time periods, suggesting a dominant contribution of nighttime precipitation to the total precipitation changes. The water vapor transport changes dominate the precipitation changes in different seasons and months in summer, while the decreasing vertical velocity depresses precipitation to some extent. The changes in nighttime precipitation, especially its intensity, associated with the water vapor transport, contribute to the changes in precipitation over the SRTR region.
Author Contributions
Data curation, M.D. and Y.L.; Formal analysis, Z.L.; Project administration, X.M.; Software, M.D. and Y.L.; Writing—original draft, X.M.; Writing—review and editing, Z.L. and L.Z. All authors have read and agreed to the published version of the manuscript.
Funding
This study was conducted under the auspices of the National Natural Science Foundation of China (41930759, 91837209, 42075089, 41975012), the Science and Technology Research Plan of Gansu Province (20JR10RA070).
Data Availability Statement
Not applicable.
Acknowledgments
We would like to that the GSMaP science team for making the satellite precipitation data available and thanks to the ECMWF for providing ERA5 reanalysis data.
Conflicts of Interest
The authors declare no conflict of interest.
References
- Liu, Y.M.; Lu, M.M.; Yang, H.J.; Duan, A.M.; He, B.; Yang, S.; Wu, G. Land–atmosphere–ocean coupling associated with the Tibetan Plateau and its climate impacts. Natl. Sci. Rev. 2020, 7, 534–552. [Google Scholar] [CrossRef] [PubMed] [Green Version]
- You, Q.L.; Chen, D.L.; Wu, F.Y.; Pepin, N.; Cai, Z.Y.; Ahrens, B.; Jiang, Z.; Wu, Z.; Kang, S.; AghaKouchak, A. Elevation dependent warming over the Tibetan Plateau: Patterns, mechanisms and perspectives. Earth-Sci. Rev. 2020, 210, 103349. [Google Scholar] [CrossRef]
- Yang, K.; Wu, H.; Qin, J.; Lin, C.G.; Tang, W.J.; Chen, Y.Y. Recent climate changes over the Tibetan Plateau and their impacts on energy and water cycle: A review. Glob. Planet. Chang. 2014, 112, 79–91. [Google Scholar] [CrossRef]
- Mao, T.X.; Wang, G.X.; Zhang, T. Impacts of climatic change on hydrological regime in the Three-River headwaters region, China, 1960–2009. Water Resour. Manag. 2016, 30, 115–131. [Google Scholar] [CrossRef]
- Li, Y.; Xiao, J.S.; Yan, D.L. Precipitation pattern of Three River source area in Qinghai from 1964 to 2014. Agric. Res. Arid Areas 2016, 34, 282–288. [Google Scholar]
- Meng, X.; Chen, H.; Li, Z.; Zhao, L.; Zhou, B.; Lü, S.; Deng, M.; Liu, Y.; Li, G. Review of Climate Change and Its Environmental Influence on the Three-River Regions. Plateau Meteorol. 2020, 39, 1133–1143. [Google Scholar]
- Wei, Y.L.; Han, F.X.; Xie, W.X. Analysis on change characteristics of precipitation in the Three-River Headwaters Region in the past 53 years. Sci. Technol. Qinghai Agric. For. 2015, 2, 45–48. [Google Scholar]
- Dong, Y.Y.; Zhai, J.Q.; Zhao, Y.; Li, H.H.; Wang, Q.M.; Jiang, S.; Chang, H.; Ding, Z. Teleconnection patterns of precipitation in the Three-River Headwaters region, China. Environ. Res. Lett. 2020, 15, 104050. [Google Scholar] [CrossRef]
- Cai, Y.X.; Luo, S.H.; Wang, J.; Qi, D.L.; Hu, X.Y. Spatiotemporal variations in precipitation in the Three-River Headwater region from 1961 to 2019. Pratacultural Sci. 2022, 39, 10–20. [Google Scholar]
- Xi, Y.; Miao, C.Y.; Wu, J.W.; Duan, Q.Y.; Lei, X.H.; Li, H. Spatiotemporal Changes in Extreme Temperature and Precipitation Events in the Three-Rivers Headwater Region, China. J. Geophys. Res. Atmos. 2018, 123, 5827–5844. [Google Scholar] [CrossRef]
- Li, S.S.; Yao, Z.J.; Wang, R.; Liu, Z. Dryness/wetness pattern over the Three-River Headwater Region: Variation characteristic, causes, and drought risks. Int. J. Climatol. 2020, 40, 3550–3566. [Google Scholar] [CrossRef]
- Wang, T.; Sun, B.; Wang, H.J. Interannual variations of monthly precipitation and associated mechanisms over the Three River Source region in China in winter months. Int. J. Climatol. 2020, 41, 2209–2225. [Google Scholar] [CrossRef]
- Chen, Y.; Wen, J.; Liu, R.; Zhou, J.; Liu, W. The characteristics of water vapor transport and its linkage with summer precipitation over the Source Region of the Three-River. J. Hydrometeorol. 2022, 441–455. [Google Scholar] [CrossRef]
- Meng, C.C.; Mo, X.G.; Liu, S.X.; Hu, S. Extensive evaluation of IMERG precipitation for both liquid and solid in Yellow River source region. Atmos. Res. 2021, 256, 105570. [Google Scholar] [CrossRef]
- Shi, H.Y.; Li, T.J.; Wei, J.H. Evaluation of the gridded CRU TS precipitation dataset with the point rain gauge records over the Three-River Headwaters Region. J. Hydrol. 2017, 548, 322–332. [Google Scholar] [CrossRef] [Green Version]
- Wang, X.Y.; Lu, F.; Zhu, K.; Zhou, Y.Y.; Wu, Z. Comparison of different remote sensing precipitation products at multiple time scales: A case study in the source region of Three Rivers. China Rural Water Hydropower 2022, 1–14. Available online: http://kns.cnki.net/kcms/detail/42.1419.TV.20220218.1747.022.html (accessed on 10 May 2020).
- Guo, J.P.; Zhai, P.M.; Wu, L.; Cribb, M.; Li, Z.Q.; Ma, Z.Y.; Wang, F.; Chu, D.; Wang, P.; Zhang, J. Diurnal variation and the influential factors of precipitation from surface and satellite measurements in Tibet. Int. J. Climatol. 2014, 34, 2940–2956. [Google Scholar] [CrossRef]
- Li, J. Hourly station-based precipitation characteristics over the Tibetan Plateau. Int. J. Climatol. 2018, 38, 1560–1570. [Google Scholar] [CrossRef]
- Dirmeyer, P.A.; Schlosser, C.A.; Brubaker, K.L. Precipitation, recycling, and land memory: An integrated analysis. J. Hydrometeorol. 2009, 10, 278–288. [Google Scholar] [CrossRef]
- Findell, K.L.; Eltahir, E.A. Atmospheric controls on soil moisture–boundary layer interactions. Part II: Feedbacks within the continental United States. J. Hydrometeorol. 2003, 4, 570–583. [Google Scholar] [CrossRef]
- Zhao, C.L.; Meng, X.H.; Li, Y.H.; Lyu, S.H.; Guo, J.; Liu, H. Impact of soil moisture on afternoon convection triggering over the Tibetan Plateau based on 1-D boundary layer model. J. Geophys. Res. Atmos. 2022, 127, e2021JD035591. [Google Scholar] [CrossRef]
- Zhang, Y.; Fu, Y.F.; Hou, B.J. Analysis of the causes for runoff evaluation in the Yellow River source region. Yellow River 2013, 35, 22–24. [Google Scholar]
- Sheng, W.P.; Zhen, L.; Xiao, Y.; Hu, Y.F. Ecological and socioeconomic effects of ecological restoration in China’s Three Rivers Source Region. Sci. Total Environ. 2019, 650, 2307–2313. [Google Scholar] [CrossRef] [PubMed]
- Kachi, M.; Kubota, T.; Aonashi, K.; Ushio, T.; Oki, R. Recent improvements in the global satellite mapping of precipitation (GSMaP). In Proceedings of the 2014 IEEE Geoscience and Remote Sensing Symposium, Quebec City, QC, Canada, 13–18 July 2014. [Google Scholar]
- Okamoto, K.I.; Ushio, T.; Iguchi, T.; Takahashi, N.; Iwanami, K. The global satellite mapping of precipitation (GSMaP) project. In Proceedings of the IEEE International Geoscience & Remote Sensing Symposium, Seoul, Korea, 25–29 July 2005; Volume 5, pp. 3414–3416. [Google Scholar]
- Kentaro, T.; Saavedra, V.; Masahiro, R.; Kazuki, T.; Tomoo, U.; Takuji, K. Spatiotemporal evaluation of the gauge-adjusted global satellite mapping of precipitation at the basin scale. J. Meteorol. Soc. Jpn. 2016, 94, 185–195. [Google Scholar]
- Lu, D.K.; Yong, B. Evaluation and hydrological utility of the latest GPM IMERG v5 and GsMAP v7 precipitation products over the Tibetan Plateau. Remote Sens. 2018, 10, 2022. [Google Scholar] [CrossRef] [Green Version]
- Ning, S.W.; Song, F.; Parmeshwar, U.; Jin, J.L.; Thapa, B.R.; Ishidaira, H. Error analysis and evaluation of the latest GSMap and IMERG precipitation products over Eastern China. Adv. Meteorol. 2017, 2017, 1803492. [Google Scholar] [CrossRef] [Green Version]
- Kalverla, P.C.; Duncan, J.B., Jr.; Steeneveld, G.J.; Holtslag, A. Low-level jets over the North Sea based on ERA5 and observations: Together they do better. Wind Energy Sci. Discuss. 2019, 4, 193–209. [Google Scholar] [CrossRef] [Green Version]
- Hersbach, H.; Bell, B.; Berrisford, P.; Hirahara, S.; Horányi, A.; Muñoz-Sabater, J.; Nicolas, J.; Peubey, C.; Radu, R.; Schepers, D.; et al. The ERA5 global reanalysis. Q. J. R. Meteorol. Soc. 2020, 146, 1999–2049. [Google Scholar] [CrossRef]
- Lei, Y.H.; Letu, H.S.; Shang, H.S.; Shi, J.C. Cloud cover over the Tibetan Plateau and eastern China: A comparison of ERA5 and ERA-Interim with satellite observations. Clim. Dyn. 2020, 54, 2941–2957. [Google Scholar] [CrossRef]
- Zhao, J.; Li, T.J.; Shi, K.F.; Qiao, Z.; Xia, Z.Y. Evaluation of ERA-5 precipitable water vapor data in plateau areas: A case study of the Northern Qinghai-Tibet Plateau. Atmosphere 2021, 12, 1367. [Google Scholar] [CrossRef]
- Xin, Y.F.; Liu, J.B.; Liu, X.W.; Liu, G.; Cheng, X.H.; Chen, Y.L. Reduction of uncertainties in surface heat flux over the Tibetan Plateau from ERA-Interim to ERA5. Int. J. Climatol. 2022. early view. [Google Scholar] [CrossRef]
- Shang, S.S.; Zhu, G.F.; Wei, J.H.; Li, Y.; Zhang, K.; Li, R.; Arnault, J.; Zhang, Z.; Laux, P.; Yang, Q.; et al. Associated atmospheric mechanisms for the increased cold season precipitation over the Three-River Headwaters Region from the Late 1980s. J. Clim. 2021, 34, 8033–8046. [Google Scholar] [CrossRef]
- Zhao, R.Y.; Chen, B.; Xu, X.D. Intensified moisture sources of heavy precipitation events contributed to interannual trend in precipitation over the Three-Rivers-Headwater Region in China. Front. Earth Sci. 2021, 9, 674037. [Google Scholar] [CrossRef]
- Zhang, Y.; Li, T.J.; Li, J.Y.; Zhong, D.Y. Influence of the westerlies and the South Asia monsoon on water vapor transport and precipitation in the Three-River Headwaters Region during the rainy season. Adv. Water Sci. 2019, 30, 348–358. [Google Scholar]
- Zhao, D.; Zhang, L.X.; Zhou, T.J. Detectable anthropogenic forcing on the long-term changes of summer precipitation over the Tibetan Plateau. Clim. Dyn. 2022, 1–14. [Google Scholar] [CrossRef]
Figure 1.
The overview of the Source Region of Three Rivers.

Figure 2.
Precipitation (mm/month) in (a) annual average, (b) June-July-August (JJA) average, (c) March-April-May (MAM) average, (d) June average, (e) September-October-November (SON) average, (f) July average, (g) December-January-Februrary (DJF) average, and (h) August average from 2001 to 2019.
Figure 2.
Precipitation (mm/month) in (a) annual average, (b) June-July-August (JJA) average, (c) March-April-May (MAM) average, (d) June average, (e) September-October-November (SON) average, (f) July average, (g) December-January-Februrary (DJF) average, and (h) August average from 2001 to 2019.

Figure 3.
Monthly accumulated precipitation on the SRTR (averaged from 2001 to 2019).

Figure 4.
Precipitation occurrence ratio in (a) annual average, (b) June-July-August (JJA) average, (c) March-April-May (MAM) average, (d) June average, (e) September-October-November (SON) average, (f) July average, (g) December-January-Februrary (DJF) average, and (h) August average from 2001 to 2019.

Figure 5.
Difference between precipitation (a) annual average, (b) June-July-August (JJA) average, (c) March-April-May (MAM) average, (d) June average, (e) September-October-November (SON) average, (f) July average, (g) December-January-Februrary (DJF) average, and (h) August average from 2010 to 2019 and from 2001 to 2010 (mm/month).

Figure 6.
Difference in precipitation occurrence ratio between 2010 and 2019 and from 2001 to 2010 in (a) annual average, (b) June-July-August (JJA) average, (c) March-April-May (MAM) average, (d) June average, (e) September-October-November (SON) average, (f) July average, (g) December-January-Februrary (DJF) average, and (h) August average.

Figure 7.
Difference between afternoon precipitation in (a) annual average, (b) June-July-August (JJA) average, (c) March-April-May (MAM) average, (d) June average, (e) September-October-November (SON) average, (f) July average, (g) December-January-Februrary (DJF) average, and (h) August average from 2010 to 2019 and from 2001 to 2010 (mm/month).

Figure 8.
Difference between nighttime precipitation in (a) annual average, (b) June-July-August (JJA) average, (c) March-April-May (MAM) average, (d) June average, (e) September-October-November (SON) average, (f) July average, (g) December-January-Februrary (DJF) average, and (h) August average from 2010 to 2019 and from 2001 to 2010 (mm/month).

Figure 9.
Diurnal changes in precipitation rate (mm/h) between the two decades.

Figure 10.
Differences between climatology of vertical water vapor (Vectors, kg/(m.s)) and its divergence (Shaded, kg/(m2.s)) in (a) annual average, (b) June-July-August (JJA) average, (c) March-April-May (MAM) average, (d) June average, (e) September-October-November (SON) average, (f) July average, (g) December-January-Februrary (DJF) average, and (h) August average from 2010 to 2019 and 2001 to 2010.


Table 1.
Spatial correlation coefficients (Cor) between afternoon precipitation differences and total precipitation differences among the two decades in different periods.
Table 1.
Spatial correlation coefficients (Cor) between afternoon precipitation differences and total precipitation differences among the two decades in different periods.
| Year | Season | Month | ||||||
|---|---|---|---|---|---|---|---|---|
| period | Year | MAM | JJA | SON | DJF | Jun | Jul | Aug |
| Cor | 0.629 | 0.552 | 0.438 | 0.518 | 0.805 | 0.186 | 0.485 | 0.326 |
Table 2.
Spatial correlation coefficients between nighttime precipitation differences and precipitation differences among the two decades in different time periods.
Table 2.
Spatial correlation coefficients between nighttime precipitation differences and precipitation differences among the two decades in different time periods.
| Year | Season | Month | ||||||
|---|---|---|---|---|---|---|---|---|
| period | Year | MAM | JJA | SON | DJF | Jun | Jul | Aug |
| Cor | 0.964 | 0.943 | 0.908 | 0.965 | 0.916 | 0.934 | 0.917 | 0.884 |
Table 3.
Correlation coefficients of precipitation difference with precipitation probability (Pp), afternoon precipitation difference (Pa), nighttime precipitation difference (Pe), afternoon precipitation frequency difference (Ppa) and nighttime precipitation frequency difference (Ppe).
Table 3.
Correlation coefficients of precipitation difference with precipitation probability (Pp), afternoon precipitation difference (Pa), nighttime precipitation difference (Pe), afternoon precipitation frequency difference (Ppa) and nighttime precipitation frequency difference (Ppe).
| Cor | Year | MAM | JJA | SON | DJF | Jun | Jul | Aug |
|---|---|---|---|---|---|---|---|---|
| Pp | 0.689 | 0.752 | 0.480 | 0.697 | 0.437 | 0.195 | 0.604 | 0.611 |
| Pa | 0.629 | 0.552 | 0.438 | 0.518 | 0.805 | 0.186 | 0.485 | 0.326 |
| Pe | 0.964 | 0.943 | 0.908 | 0.965 | 0.916 | 0.934 | 0.917 | 0.884 |
| Ppa | 0.835 | 0.834 | 0.638 | 0.743 | 0.620 | 0.586 | 0.629 | 0.646 |
| Ppe | 0.818 | 0.844 | 0.562 | 0.699 | 0.589 | 0.465 | 0.599 | 0.595 |
Table 4.
Correlation coefficients of nighttime precipitation difference with nighttime precipitation intensity difference (Se) and nighttime precipitation frequency difference (Pa).
Table 4.
Correlation coefficients of nighttime precipitation difference with nighttime precipitation intensity difference (Se) and nighttime precipitation frequency difference (Pa).
| Cor | Year | MAM | JJA | SON | DJF | Jun | Jul | Aug |
|---|---|---|---|---|---|---|---|---|
| Se | 0.963 | 0.946 | 0.890 | 0.959 | 0.912 | 0.916 | 0.909 | 0.929 |
| Pa | 0.795 | 0.823 | 0.455 | 0.705 | 0.528 | 0.393 | 0.538 | 0.469 |
Publisher’s Note: MDPI stays neutral with regard to jurisdictional claims in published maps and institutional affiliations. |
© 2022 by the authors. Licensee MDPI, Basel, Switzerland. This article is an open access article distributed under the terms and conditions of the Creative Commons Attribution (CC BY) license (https://creativecommons.org/licenses/by/4.0/).
Share and Cite
MDPI and ACS Style
Meng, X.; Deng, M.; Liu, Y.; Li, Z.; Zhao, L. Remote Sensing-Detected Changes in Precipitation over the Source Region of Three Rivers in the Recent Two Decades. Remote Sens. 2022, 14, 2216. https://doi.org/10.3390/rs14092216
AMA Style
Meng X, Deng M, Liu Y, Li Z, Zhao L. Remote Sensing-Detected Changes in Precipitation over the Source Region of Three Rivers in the Recent Two Decades. Remote Sensing. 2022; 14(9):2216. https://doi.org/10.3390/rs14092216
Chicago/Turabian StyleMeng, Xianhong, Mingshan Deng, Yumeng Liu, Zhaoguo Li, and Lin Zhao. 2022. "Remote Sensing-Detected Changes in Precipitation over the Source Region of Three Rivers in the Recent Two Decades" Remote Sensing 14, no. 9: 2216. https://doi.org/10.3390/rs14092216
Note that from the first issue of 2016, this journal uses article numbers instead of page numbers. See further details here.