


LiDAR Point Clouds Usage for Mapping the Vegetation Cover of the “Fryderyk” Mine Repository

1
Department of Forest Resource Management, Faculty of Forestry, University of Agriculture in Krakow, 31-425 Krakow, Poland
2
Department of Ecological Engineering and Forest Hydrology, Faculty of Forestry, University of Agriculture in Krakow, 31-425 Krakow, Poland
*
Author to whom correspondence should be addressed.
Remote Sens. 2023, 15(1), 201; https://doi.org/10.3390/rs15010201
Submission received: 12 December 2022
/
Revised: 22 December 2022
/
Accepted: 28 December 2022
/
Published: 30 December 2022
(This article belongs to the Special Issue Remote Sensing Solutions for Mapping Mining Environments)
Abstract
:The paper investigates the usage of LiDAR (light detection and ranging) data for the automation of mapping vegetation with respect to the evaluation of the ecological succession process. The study was performed for the repository of the “Fryderyk” mine (southern Poland). The post-flotation area analyzed is a unique refuge habitat—Natura2000, PLH240008—where a forest succession has occurred for several dozen years. Airborne laser scanning (ALS) point clouds were used for deriving detailed information about the morphometry of the spoil heap and about the secondary forest succession process—mainly vegetation parameters i.e., height and canopy cover. The area of the spoil heap is irregular with a flat top and steep slopes above 20°. Analyses of ALS point clouds (2011 and 2019), confirmed progression in the forest succession process, and land cover changes especially in wooded or bushed areas. Precise vegetation parameters (3D LiDAR metrics) were calculated and provided the following parameters: mean value of vegetation height as 6.84 m (2011) and 8.41 m (2019), and canopy cover as 30.0% (2011) and 42.0% (2019). Changes in vegetation volume (3D area) were shown: 2011—310,558 m3, 2019—325,266 m3, vegetation removal—85,136 m3, increasing ecological succession—99,880 m3.
1. Introduction
Industrial activity related to extraction has a major impact on the natural environment [1,2]. The mapping and monitoring of vegetation growing on the reclaimed areas are of wide scientific interest. Upper Silesia (southern Poland) is an area very rich in deposits of fossil raw materials, which have been mined for hundreds of years by various mining branches in Poland [3]. The most commonly mined resource in the area was hard coal, but others such as zinc–lead ores were also mined. The Upper Silesia area is the most extensive industrial and urbanization area in Central Europe and has been recognized as one of the most polluted with heavy metals [4,5,6].
Among the characteristic facilities that arise during the mining and processing of zinc–lead ores are tailings piles. These facilities are characterized by very high concentrations of heavy metals [7], which pose a major threat to the balance of the ecosystems they enter [8]. Once introduced into the environment, they function in it for a very long time. Particularly dangerous are heavy metals of metallurgical origin, which, once they enter soils, are virtually indelible from them and can negatively affect the environment for another 200 years [9].
Therefore, monitoring the impact of pollutants (heavy metals) on ecological succession on such sites is a very important and interesting issue [7,10]. The realization of this task is made possible by modern geoinformatics technologies, which allow us to present the changes in ecosystems over decades in a clear and very readable way.
Nowadays, developing solutions to provide information on the biometrical features of vegetation is worth particular attention [11]. The availability of spatial geodata, especially remote sensing products, derives objective information about the surrounding environment. The possibility of using geoinformation methods for spatial management in the environment or environmental protection has a multitude of examples in research. Widely used in this aim is LiDAR (light detection and ranging) technology, which allows the provision of large-scale research for the topography description and structure of the growing vegetation [12,13,14,15,16,17]. Determining indicators to show the spatial range or structure of vegetation, including the dynamic process of vegetation development in post-industrial areas, is a wide area of scientific interest.
Strategies aimed to map and characterize secondary succession are usually based on traditional measurements where successional stages are not considered. Secondary succession is defined as natural regeneration following complete forest clearance from anthropogenic or natural disturbances. The transitions between successional stages play a key role in ecosystem regeneration. We can evaluate the use of the LiDAR data to characterize changes in forest structure starting in early to intermediate and intermediate to late forest succession. The vertical forest structure can be analyzed using cross-sections selected between forest transitions. LiDAR techniques can identify forest structure differences between successional stages.
The focus of this manuscript is to document the use of airborne LiDAR, to quantify the extent of secondary forest succession for the post-industrial area. The goal is to determine land cover changes to describe the forest succession process and provide selected indices characterizing spatial structures of vegetation on the repository of the mine “Fryderyk” in Tarnowskie Góry (South Poland). In this aspect, the analysis of temporal and spatial changes in vegetation cover was performed using two series of LiDAR data—airborne laser scanning (ALS) point clouds in the years 2011 and 2019. The presented study indicates the possibility of automation of the process of monitoring shrubby and wooded areas developing in post-industrial areas by using modern geoinformation methods and LiDAR technology.
2. Methods
The study works were carried out for the area of the spoil heap of the “Fryderyk” mine in Tarnowskie Góry. The tested object is located in the Upper Silesian Industrial Region (50°24′54″N, 18°51′17″E; a large industrial region in the south of Poland, Figure 1, [7,18]). The post-flotation spoil tip covers an area of over 6 ha. It is an above-grade heap with a flat top and fairly steep slopes (slope angle of 45–50°). It is 13–15 m high in the southeastern part, and 17 m high in the western and northern parts.
The studied anthropogenic site is a tailings pile built from a mixture of zinc–lead ore waste (galena) and waste rock (dolomite). The stored formations are characterized by a very high content of heavy metals (Zn, Pb, and Cd), and alkaline reactions [7,19]. The formation of the repository began in 1840 and ended in the year 1912 [20]. No reclamation work was carried out on the heap, the existing vegetation has entered the path of ecological succession. The studied site is overgrown, among others, with woody species (mainly Scots pine) and rare and protected galman grasslands [21].
The post-flotation analyzed area is a unique refuge habitat—Natura2000, PLH240008—and is characterized by significant examples of the secondary forest succession process (Figure 2; [22]).
In 2017, the surveyed site was inscribed on the UNESCO World Heritage List. Due to the special protection of natural value, woody vegetation was removed on part of the site to restore the communities of galmanum vegetation as a result of the project “Good practices for enhancing biodiversity and active protection of galmanum vegetation in the Silesia-Krakow region—BioGalmany” [23].
The BioGalmany project [23] was co-financed by the European Union under the European Cohesion Fund (Operational Program Infrastructure and Environment 2014–2020; Priority: Environmental protection, including adaptation to climate change; Action: Good practice activities related to the protection of endangered species and natural habitats). The project implementation period was from 1 April 2018 to 31 December 2021. The Project aim was to restore, strengthen and maintain appropriate habitat conditions for the preservation of biodiversity of galmanum vegetation (Violetea calaminariae) in the Natura 2000 areas created in the Silesia-Krakow region and in the places where valuable fragments of galmanum vegetation occur, so far not covered by any form of protection.
In this paper, LiDAR data were used to indicate the comprehensive characteristics of growing vegetation. Analyses were performed using the following materials:
- ALS point clouds—two series: 2011 and 2019, parameters: 4 reflections as a minimum, 12 points/m2, altitude accuracy ≤ 0.15 m, situational accuracy ≤ 0.50 m; source: pl. ISOK Project—Informatics System of the Country Protection from Extraordinary Threat; Main Office of Geodesy and Cartography, Poland [24].
- Orthophotomaps: 2011 and 2019, GSD: 0.25 m, coordinates system: PL-PUWG1992, (ISOK Project [24]).
- Cadastral data (portals: WebEwid and Geoportal).
In the ISOK project [24] the territory of Poland is covered with ALS data points of various densities ranging from 4 points per m2 to as many as 20 points per m2 (in cities). Airborne LiDAR provides a representation of land as a cloud of measurement points with defined XYZ coordinates. The files are saved in LAS format and, apart from point coordinates, they also contain, among other things, information on the class of a specific point, or signal reflection intensity. The points are assigned RGB values (reflecting blue, green, and red) obtained from aerial images.
LiDAR measurements in LAS (LAZ) files from the ISOK project are provided free of charge and can be used for any purpose. Data can be downloaded from www.geoportal.gov.pl, (accessed on 1 October 2022). section "Data for download" [24]. The procedure for processing ALS data was started by creating models: DTM—digital terrain model (automated approximation of the “ground” points); DSM—digital surface model (points from the other classes). It was carried out using the functions GridSurfaceCreate and CanopyModel in FUSION software [25]. The normalized DSM (nDSM) was prepared in ArcGIS Pro (ESRI) as a difference between the DSM and DTM (nDSM = DSM-DTM). The characteristics of the “Fryderyk” spoil heap morphometry were presented also as DTM, DSM hillshades in grayscale.
Analysis of precise information (2D and 3D structure) of vegetation was performed using the FUSION procedures [25]. The height of vegetation (GridMetrics and CloudMetrics functions) was generated as a value of the 95th percentile (P95)—the height below which there exist 95% points (the relative altitude of the point clouds) [26,27]. The standard deviation of the height was also calculated (Stddev, FUSION). The canopy cover was generated using the Cover (FUSION) procedure [28] and takes values of 0%–100%. The vertical vegetation structure was visualized in the form of histograms using the Densitymetrics (FUSION) method (the number of laser points reflected from the vegetation in 1-meter vertical intervals for the raster pixel. The vegetation parameters were presented as raster maps (pixel size: 1.0 m) to derive the spatial biomass indicators of forming vegetation at the spoil heap.
The study provides an example of using two series of ALS acquisitions to monitor the shrubland or wooded post-industrial fields. For the whole analyzed area, a map of changes in height of vegetation from 2011–2019 was prepared, as an illustration of the detailed characteristic of the vegetation removing process (BioGalmany project [23]) and on the other side the increasing forest succession areas.
3. Results
The study area covered 6.64 ha. The area of the spoil heap is irregular (Figure 3) with a flat top and steep slopes above 20°. Slopes ≤ 2° cover 10. 1% of the analyzed area, 2°–5°—19.9%, 5°–10°—18.6%, 10°–20°—16.7%, and ≥20°—34.7%. The detailed information about the aspects is as follows: N—13.8% of the analyzed area, NE—13.0%; E—14.4%, SE—5.5%, S—13.8%, SW—14.1%, W—16.1%, and NW—11.3% [18].
The analysis of the terrain [18] is presented in Figure 3 and Figure 4. The spoil heap height is lowest in the southeastern part (10–15 m), increases in the western part (around 17 m), and reaches its highest value in the northern part of the heap (around 22 m above the level of the surrounding terrain).
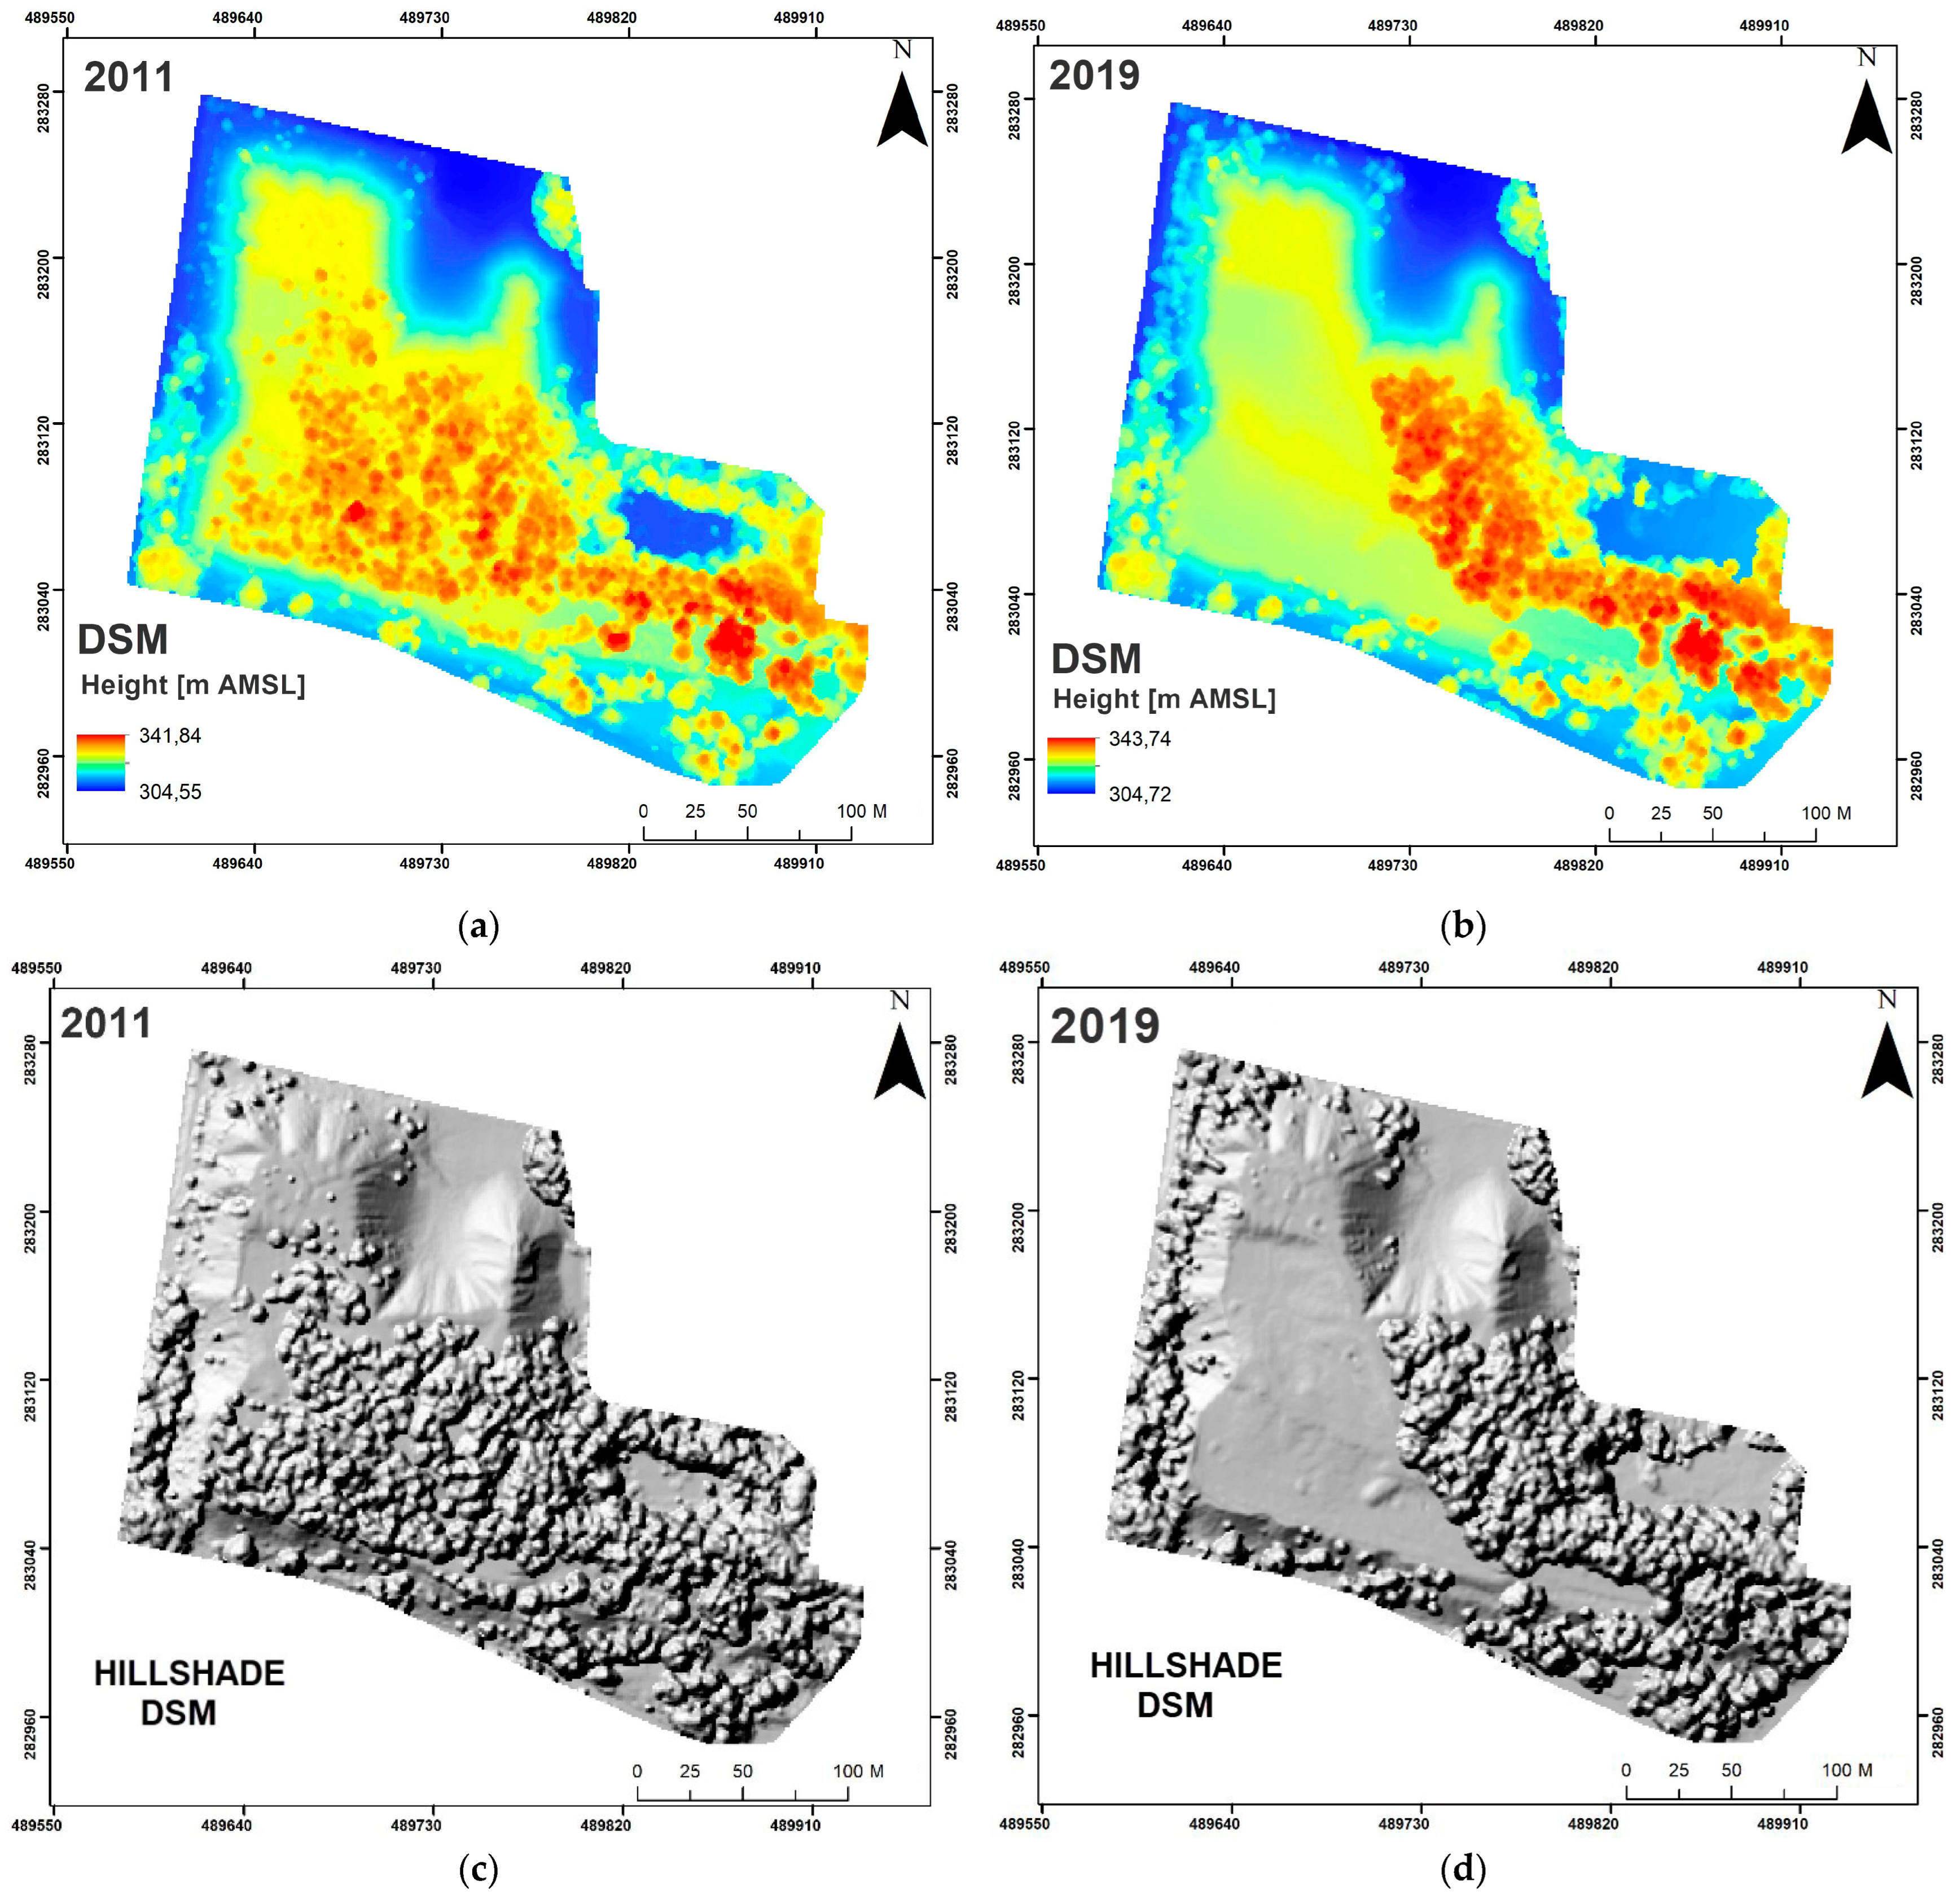
The digital surface model (values in meters AMSL) and the normalized DSM (nDSM, relative values in meters, generated based on ALS point clouds from the years 2011 and 2019 [18] are presented in Figure 5 and Figure 6. According to the field works in the BioGalmany project, shrub vegetation was largely removed in the middle of the repository, so we can see clearly in the maps.
The structure of the vegetation was prepared automatically using ALS point cloud statistics. The mean values of height (95th percentile), the standard deviation of height, and canopy cover (cover density; in values 0–100%) calculated for the years 2011 and 2019 are presented in Table 1. Only areas with vegetation left in 2019 were analyzed. Parameters confirmed the growing secondary forest succession process.
In Figure 7, precise raster maps of LiDAR metrics prepared for 2011 and 2019 are presented [18]. The height (calculated as 95th percentile), the standard deviation of height, and the canopy cover are shown. Parameters of height, and std. dev. of height or cover density help to understand how ALS technology collects information about forested landscapes. The increasing spatial range of vegetation and changes in the structure (2D, 3D) in the forested area for the analyzed period (2011–2019) can be observed, ignoring areas of removed vegetation.
For the analyzed area, the map of vegetation changes (in height and range of vegetation [18]) from 2011–2019 was prepared (Figure 8). Maps illustrate the forest succession process and on the other side the results of removing vegetation according to the BioGalmany project.
Using ALS point clouds, values of changes in vegetation volume (area 3D) in the years 2011 and 2019 were calculated (Table 2, [18]). Generally, despite the removal of vegetation in the central part of the spoil heap, the volume of vegetation increased, which confirms an intensive process of forest succession in the remaining parts of the repository.
4. Discussion
The remotely sensed materials are permanent evidence of changes in the natural environment. It is especially important to monitor such changes on anthropogenic sites in heavily industrialized and urbanized regions. These sites are very often located in the centers of large urban agglomerations, are frequently visited by the local community, and are characterized by different properties of the substrates (waste) deposited on them. The site we are studying is of particular interest, as it is a heap that was created more than 100 years ago as a result of zinc–lead ore processing [20]. The region has a very long industrial tradition and many works analyzing changes in the environment of this area have been published [29,30,31,32]. Such sites are characterized by very high concentrations of heavy metals (Zn, Pb, and Cd) in the substrates stored on them, from which future technogenic soils will be reconstituted [7].
In the first place, heavy metals contaminating the soil inhibit the growth of microorganisms functioning there [33,34,35]. In turn, the reduced activity of rhizosphere microorganisms is a major factor inhibiting plant growth and resistance to pathogens. Disruption of organic matter decomposition by microorganisms caused by excessive heavy metal concentrations can also lead to an increase in the pool of bioavailable forms of metals in the soil. The bioavailable fraction of heavy metals is easily taken up by living organisms and moves through the trophic chain, making it very dangerous [36,37], and contributing to the inhibition of the succession process.
The natural development of vegetation on mining waste is very slow due to the physical and chemical properties of this substrate being unfavorable to plants. Waste rock remaining after mining Zn–Pb ores, with its characteristic orange color, is an unstable, dry substrate, containing significant amounts of heavy metals (Fe, Zn, Pb, Cd). However, these metal-bearing substrates (waste) left without any human intervention are spontaneously colonized by organisms well-adapted to local conditions. Over time, specific zinc–lead areas are formed into galman grasslands. They are built by species found in only a few sites in Poland, as well as subspecies and ecotypes of common species. All of them can tolerate high concentrations of heavy metals [38]. Over the decades since its formation, woody vegetation communities have also encroached on the study site [7]. Monitoring these processes due to the importance and protection of galman grasslands and the adaptation of individual plant species to extremely adverse habitat conditions is a very important issue that should be carried out all the time.
The main aim of this paper was to demonstrate the potential automation in monitoring post-industrial lands using geoinformation technology and LiDAR data. Research shows that the ALS point clouds, define the metrics for the structure of vegetation [39,40,41,42,43,44]. Many of the indexes can be generated, including the number of trees per unit area, the range occupied by different vegetation patches and their spatial distribution, the height of trees, thickness and volume, the length of tree crowns, and other features describing the vegetation parameters to a greater or lesser extent [45,46,47].
The main aspect was mapping cover changes and determining the spatial structure of vegetation. The study focuses on the analysis of the spatial structure of vegetation, according to the results of BioGalmany project field works in the research area. The vegetation overgrowing the spoil heap “Fryderyk” was determined in the previous study [10]. The exploration was carried out based on aerial images and orthophotomaps from 1947, 1998, 2003, 2009, and 2011. Forest succession changes (growing process) that occurred between 1947 and 2011 were confirmed. In this study, using ALS data (2011, 2019) the precise features of vegetation overgrowing the spoil heap “Fryderyk” was determined.
The results demonstrated a gradual secondary succession of greenery on the spoil heap, and on the other side, the removal of the vegetation according to the BioGalmany project works. Tree expansion was proceeding in the west and north direction. Parameters such as the height of vegetation, and cover density calculated by ALS data indicated significant diversity in horizontal and vertical structures of vegetation. The study, similar to other papers, presents the capacity to use laser scanning technology for an impartial evaluation of the structure of vegetation, especially monitoring the process of forest succession.
The LiDAR technology offers possibilities for a fusion of 2D and 3D information in mapping land cover and vegetation classes. The procurement of many indices characterizing vegetation provides LULC automated monitoring, together with the identification of the spatial parameters of the vegetation [48,49,50,51,52,53,54,55]. According to these statements, the usage of the LiDAR data, especially ALS or point clouds generated based on images from UAVs [56,57,58,59], gives an objective assessment of biometric features. The indicators are determined for mapping and inventory of plant associations formed in the post-industrial areas.
The ALS point clouds give precise data to perform spatial characteristics of vegetation. LiDAR is a useful, objective, and large-area method for deriving information about vegetation growing in post-industrial areas. Further, regular laser scanning campaigns (airborne or from the UAV level) can provide biomass characteristics [60] as a fundamental parameter for long-term planning management and forest growth in post-industrial, reclaimed areas. Additionally, the remote sensing technologies can allow for rating the formation of new forest ecosystems, woody biomass, and global carbon storage [61,62,63].
Therefore, landscape information and mapping the cover of vegetation can be used to evaluate changes over a long time for the sustainable management of post-industrial areas. It is an essential aspect of balanced ecosystem planning and gives effective possibilities for monitoring afforestation in the post-mining areas. We should focus on the protection of increasing habitats, and geoinformation methods can help us with this issue. Automated remotely sensed methods, especially satellite or aerial images and LiDAR data, provide reliable results and benefits that deliver ecosystem services to human society and help us better understand the importance of LULC changes in sustainable land planning and the development of vegetation [64,65].
5. Conclusions
Monitoring processes related to forest succession or afforestation for post-industrial objects contaminated with heavy metals is a very interesting and important problem, which should be constantly improved based on the latest knowledge and technology. This provides valuable information on how the succession process of these specific anthropogenic features occurs over the decades. At the same time, it indicates a lot of valuable information about the pace and specificity of succession, which can currently be used during works related to the restitution of galman communities on this type of feature.
The study aimed to develop a methodology for mapping areas of potential forest vegetation. The collected ALS data showed a significant differentiation of the spatial structure of the forming and protected ecosystem. This variety is visible in the surface size (2D) and the vertical profile (3D), which indicates the progressed forest succession process. LiDAR point clouds allowed for precise and accurate assessment of the range and spatial structure of vegetation.
Post-mining sites as an example of large human disturbance, with properly developed reclamation and revegetation, can provide dynamic, novel ecosystems performing ecological services. Forest-type vegetation is an essential element of the forming ecosystem in the post-mining area, and estimating the area and structure of potential forests is very important due to the ecosystem impact. Forested areas are an essential component of the Earth’s ecosystem, sequestering carbon and providing a range of ecosystem services. Estimating the area of potential forests is very important due to the context of climate change, and biomass area reporting by individual countries (including Poland) to FAO/UN.
Author Contributions
Conceptualization, M.S., M.P.; methodology, M.S., M.P.; formal analysis, M.S., M.P.; visualization, M.S., M.P.; writing—original draft preparation, M.S., M.P.; supervision, M.S., M.P. All authors have read and agreed to the published version of the manuscript.
Funding
This research was supported by the Ministry of Science and Higher Education of the Republic of Poland.
Data Availability Statement
Not applicable.
Conflicts of Interest
The authors declare no conflict of interest. The funders had no role in the design of the study; in the collection, analyses, or interpretation of data; in the writing of the manuscript, or in the decision to publish the results.
References
- Krzaklewski, W.; Pietrzykowski, M. Selected physicochemical properties of zinc and lead ore tailings and their biological stabilisation. Water Air Soil Pollut. 2002, 141, 125–142. [Google Scholar] [CrossRef]
- Krzaklewski, W.; Barszcz, J.; Małek, S.; Kozioł, K.; Pietrzykowski, M. Contamination of forest soils in the vicinity of the sedimentation pond after zinc and lead ore flotation (in the region of Olkusz, Southern Poland). Water Air Soil Pollut. 2004, 159, 151–164. [Google Scholar] [CrossRef]
- Pradela, A.; Solarski, M. Rozwój górnictwa rud cynku i ołowiu w bytomsko−tarnogórskim rejonie złożowym od końca XVIII wieku do czasów współczesnych. In Z Badań Nad Wpływem Antropopresji na Środowisko; Machowski, R., Rzętała, M., Eds.; Studenckie Koło Naukowe Geografów UŚ, Wydział Nauk o Ziemi UŚ: Sosnowiec, Poland, 2013; Volume 14, pp. 43–50. [Google Scholar]
- Pająk, M.; Jasik, M. Heavy metal (Zn, Pb, Cd) concentration in soil and moss (Pleurozium schreberii) in the Brynica district, southern Poland. iForest-Biogeosci. For. 2011, 4, 176–180. [Google Scholar] [CrossRef] [Green Version]
- Gruszecka, A.M.; Wdowin, M. Characteristics and distribution of analyzed metals in soil profiles in the vicinity of a postflotation waste site in the Bukowno region, Poland. Environ. Monit. Assess. 2013, 185, 8157–8168. [Google Scholar] [CrossRef] [Green Version]
- Pająk, M.; Halecki, W.; Gąsiorek, M. Accumulative response of Scots pine (Pinus sylvestris L.) and silver birch (Betula pendula Roth) to heavy metals enhanced by Pb-Zn ore mining and processing plants: Explicitly spatial considerations of ordinary kriging based on a GIS approach. Chemosphere 2017, 168, 851–859. [Google Scholar] [CrossRef] [PubMed]
- Pająk, M.; Błońska, E.; Szostak, M.; Gąsiorek, M.; Pietrzykowski, M.; Urban, O.; Derbis, P. Restoration of Vegetation in Relation to Soil Properties of Spoil Heap Heavily Contaminated with Heavy Metals. Water Air Soil Pollut. 2018, 229, 392. [Google Scholar] [CrossRef] [PubMed] [Green Version]
- Kabata-Pendias, A. Trace Elements in Soils and Plants; CRC Taylor Fr Group: London, UK; New York, NY, USA, 2011. [Google Scholar]
- Kabala, C.; Chodak, T.; Szerszen, L.; Karczewska, A.; Szopka, K.; Fratczak, U. Factors influencing the concentration of heavy metals in soils of allotment gardens in the city of Wroclaw, Poland. Fresenius Environ. Bull. 2009, 18, 1118–1124. [Google Scholar]
- Szostak, M.; Wężyk, P.; Pająk, M.; Hawyło, P.; Lisańczuk, M. Determination of the spatial structure of vegetation on the repository of the mine “Fryderyk” in Tarnowskie Góry, based on airborne laser scanning from the ISOK project and digital orthophotomaps. Geod. Cartogr. 2015, 64, 87–99. [Google Scholar] [CrossRef] [Green Version]
- Korpetta, D. Introduction to forest geomatics. In Geomatics in the State Forests; Part I. Basics; State Forests Information Center: Warsaw, Poland, 2010; pp. 49–52. [Google Scholar]
- Koska, B.; Jirkab, V.; Urbana, R.; Kremena, T.; Hesslerovab, P.; Jona, J.; Pospisila, J.; Fogl, M. Suitability, characteristics, and comparison of an airship UAV with lidar for middle size area mapping. Int. J. Remote Sens. 2017, 38, 2973–2990. [Google Scholar] [CrossRef]
- Moudrý, V.; Gdulová, K.; Fogl, M.; Klápště, P.; Urban, R.; Komárek, J.; Moudrá, L.; Štroner, M.; Barták, V.; Solský, M. Comparison of leaf-off and leaf-on combined UAV imagery and airborne LiDAR for assessment of a post-mining site terrain and vegetation structure: Prospects for monitoring hazards and restoration success. Appl. Geogr. 2019, 104, 32–41. [Google Scholar] [CrossRef]
- Szostak, M.; Knapik, K.; Likus-Cieślik, J.; Wężyk, P.; Pietrzykowski, M. Fusing Sentinel-2 imagery and ALS Point Clouds for Defining the LULC Changes Ongoing on Reclaimed Areas by Afforestation. Sustainability 2019, 11, 1251. [Google Scholar] [CrossRef]
- Szostak, M.; Pietrzykowski, M.; Likus-Cieślik, J. Reclaimed Area Land Cover Mapping Using Sentinel-2 Imagery and LiDAR Point Clouds. Remote Sens. 2020, 12, 261. [Google Scholar] [CrossRef] [Green Version]
- Szostak, M.; Likus-Cieślik, J.; Pietrzykowski, M. PlanetScope Imageries and LiDAR Point Clouds Processing for Automation Land Cover Mapping and Vegetation Assessment of a Reclaimed Sulfur Mine. Remote Sens. 2021, 13, 2717. [Google Scholar] [CrossRef]
- Urban, R.; Koska, B.; Moudry, V.; Solsky, M. Terrain of post mining site from airship lidar. In Proceedings of the 16th International Multidisciplinary Scientific GeoConference, SGEM2016, Albena, Bulgaria, 30 June–6 July 2016; Volume 2, pp. 577–584. [Google Scholar] [CrossRef]
- Miodowicz, B. The Vegetation Cover Assessment on the Post-Flotation Spoil Tip of the Mine “Fryderyk” Using Geoinformation Technologies. Bachelor’s Thesis, University of Agriculture in Krakow, Kraków, Poland, 2021. [Google Scholar]
- Lamparska-Wieland, M. Dolomitic dump in Tarnowskie Góry Bobrowniki as a potential preservation object. Geogr. Stud. Diss. 1997, 21, 101–115. [Google Scholar]
- Wroński, M. Skała Życia—Monografia Górniczych Zakładów Dolomitowych w Bytomiu; Górnicze Zakłady Dolmiowe: Bytom, Poland, 1990. [Google Scholar]
- Jędrzejczyk-Korycińska, M. Floristic diversity in calamine areas of the Silesia-Cracow Monocline. Biodivers. Res. Conserv. 2006, 3–4, 340–343. [Google Scholar]
- Szostak, M.; Wężyk, P.; Pająk, M.; Hawryło, P.; Lisańczuk, M. Monitoring of the forest-forming process on a spoil heap of the “Fryderyk” mine in Tarnowskie Góry based on aerial orthophotomaps and ALS data. In Proceedings of the 2nd International Scientific Conference—Forestry in the Mountain and Industrial Regions, Krakow, Poland, 22–23 September 2014. [Google Scholar]
- BioGalmany Project. 2022. Available online: http://www.biogalmany.us.edu.pl (accessed on 1 December 2022).
- Main Office of Geodesy and Cartography. ISOK Project. 2022. Available online: https://www.isok.gov.pl/index.html (accessed on 1 December 2022).
- McGaughey, R.J. Fusion/ldv: Software for Lidar Data Analysis and Visualization; Software manual; USDA Forest Service, Pacific Northwest Research Station: Portland, OR, USA, 2012. [Google Scholar]
- Naesset, E. Predicting forest stand characteristics with airborne scanning laser using a practical two-stage procedure and field data. Remote Sens. Environ. 2002, 80, 80–99. [Google Scholar] [CrossRef]
- Naesset, E.; Økland, T. Estimating tree height and tree crown properties using airborne scanning laser in a boreal nature reserve. Remote Sens. Environ. 2002, 79, 105–115. [Google Scholar] [CrossRef]
- Mcgaughey, R.J.; Carson, W.; Reutebuch, S.; Andersen, H.E. Direct measurement of individual tree characteristics from lidar data. In Proceedings of the Annual ASPRS Conference, Denver, American Society of Photogrammetry and Remote Sensing, Louisville, KY, USA, 23–28 March 2014. [Google Scholar]
- Abramowicz, A.; Rahmonov, O.; Chybiorz, R. Environmental Management and Landscape Transformation on Self-Heating Coal-Waste Dumps in the Upper Silesian Coal Basin. Land 2020, 10, 23. [Google Scholar] [CrossRef]
- Rahmonov, O.; Czajka, A.; Nadudvari, Á.; Fajer, M.; Spórna, T.; Szypuła, B. Soil and Vegetation Development on Coal-Waste Dump in Southern Poland. Int. J. Environ. Res. Public Health 2022, 19, 9167. [Google Scholar] [CrossRef]
- Solarski, M.; Machowski, R.; Rzetala, M. Hypsometric changes in urban areas resulting from multiple years of mining activity. Sci. Rep. 2022, 12, 2982. [Google Scholar] [CrossRef]
- Szypula, B. Spatial distribution and statistical analysis of the anthropogenic line forms on the different basic fields. Environ. Socio-Econ. Stud. 2015, 1, 1–14. [Google Scholar] [CrossRef] [Green Version]
- Chodak, M.; Gołębiewski, M.; Morawska-Płoskonka, J.; Kuduk, K.; Niklińska, M. Diversity of microorganisms from forest soils differently polluted with heavy metals. Appl. Soil Ecol. 2013, 64, 7–14. [Google Scholar] [CrossRef]
- Kumar, S.; Chaudhuri, S.; Maiti, S.K. Soil dehydrogenase enzymes activity in natural and mine soil—A review. Middle-East J. Sci. Res. 2013, 13, 898–906. [Google Scholar] [CrossRef]
- Pająk, M.; Błońska, E.; Frąc MOszust, K. Functional Diversity and Microbial Activity of Forest Soils that Are Heavily Contaminated by Lead and Zinc. Water Air Soil Pollut. 2016, 227, 348. [Google Scholar] [CrossRef] [Green Version]
- Caussy, D.; Gochfeld, M.; Gurzau, E.; Neagu, C.; Ruedel, H. Lessons from case studies of metals: Investigating exposure, bioavailability, and risk. Ecotoxicol. Environ. Saf. 2003, 56, 45–50. [Google Scholar] [CrossRef]
- Yanai, J.; Fang-Jie Zhao McGrath, S.P.; Kosaki, T. Effect of soil characteristics on Cd uptake by the hyperaccumulator Thlaspi caerulescens. Environ. Pollut. 2006, 139, 167–174. [Google Scholar] [CrossRef]
- Grodzińska, K.; Korzeniak, U.; Szarek-Łukaszewska, G.; Godzik, B. Colonization of zinc mine spoils in southern Poland–preliminary studies on vegetation, seed rain and seed bank. Fragm. Florist. Geobot. 2000, 45, 123145. [Google Scholar]
- van Ewijk, K.Y.; Treitz, P.M.; Scott, N.A. Characterizing forest succession in central Ontario using lidar-derived indices. Photogramm. Eng. Remote Sens. 2011, 77, 261–269. [Google Scholar] [CrossRef]
- Falkowski, M.; Jerey, S.; Evans, J.; Martinuzzi, S.; Gessler, P.; Hudak, A. Characterizing forest succession with lidar data: An evaluation for the Inland Northwest, USA. Remote Sens. Environ. 2009, 113, 946–956. [Google Scholar] [CrossRef] [Green Version]
- Kolecka, N. Height of successional vegetation indicates moment of agricultural land abandonment. Remote Sens. 2018, 10, 1568. [Google Scholar] [CrossRef] [Green Version]
- Tompalski, P. The use of 3D spatial indices for urban vegetation analysis based on airborne laser scanning data. Arch. Photogramm. Cartogr. Remote Sens. 2012, 23, 443–456. [Google Scholar]
- Maltamo, M.; Mustonen, K.; Hyyppa, J.; Pitkanen, J.; Yu, X. The accuracy of estimating individual tree variables with airborne laser scanning in a boreal nature reserve. Can. J. For. Res. 2004, 34, 1791–1801. [Google Scholar] [CrossRef]
- Wężyk, P. Modeling of the point cloud from laser scans in tree crowns. Arch. Photogramm. Cartogr. Remote Sens. 2008, 18, 685–695. [Google Scholar]
- Pirotti, F. Analysis of full-waveform LiDAR data for forestry applications: A review of investigations and methods. iForest 2011, 4, 100–106. [Google Scholar] [CrossRef] [Green Version]
- Singh, K.; Vogler, J.; Shoemaker, D.; Meentemeyer, R. LiDAR-Landsat data fusion for large-area assessment of urban land cover: Balancing spatial resolution, data volume, and mapping accuracy. ISPRS J. Photogramm. Remote Sens. 2012, 74, 110–121. [Google Scholar] [CrossRef]
- Smreček, R.; Danihelová, Z. Forest stand height determination from low point density airborne laser scanning data in Roznava Forest enterprise zone (Slovakia). iForest 2013, 6, 48–54. [Google Scholar] [CrossRef] [Green Version]
- Alberti, G.; Boscutti, F.; Pirotti, F.; Bertacco, C.; De Simon, G.; Sigura, M.; Cazorzi, F.; Bonfanti, P. A LiDAR-based approach for a multi-purpose characterization of Alpine forests: An Italian case study. iForest 2013, 6, 156–168. [Google Scholar] [CrossRef] [Green Version]
- Andersen, H.E.; Reutebuch, S.E.; McGaughey, R.J. A rigorous assessment of tree height measurements was obtained using airborne lidar and conventional field methods. Can. J. Remote Sens. 2006, 32, 355–366. [Google Scholar] [CrossRef]
- Bork, E.; Su, J. Integrating LIDAR data and multispectral imagery for enhanced classification of rangeland vegetation: A meta-analysis. Remote Sens. Environ. 2007, 111, 11–24. [Google Scholar] [CrossRef]
- Hyyppä, J.; Hyyppä, H.; Litkey, P.; Yu, X.; Haggrén, H.; Rönnholm, P.; Pyysalo, U.; Pitkanen, J.; Maltamo, M. Algorithms and methods of airborne laser-scanning for forest measurements. Int. Arch. Photogramm. Remote Sens. Spat. Inf. Sci. 2004, 36, 82–89. [Google Scholar]
- Kolecka, N.; Kozak, J.; Kaim, D.; Dobosz, M.; Ginzler, C.; Psomas, A. Mapping secondary forest succession on abandoned agricultural land with LiDAR point clouds and terrestrial photography. Remote Sens. 2015, 7, 8300–8322. [Google Scholar] [CrossRef] [Green Version]
- Kolecka, N.; Kozak, J.; Kaim, D.; Dobosz, M.; Ginzler, C.; Psomas, A. Mapping secondary forest succession on abandoned agricultural land in the Polish Carpathians. Int. Arch. Photogramm. Remote Sens. Spat. Inf. Sci. 2016, 41, 931–935. [Google Scholar] [CrossRef] [Green Version]
- Maier, B.; Tiede, D.; Dorren, L. Characterising mountain forest structure using landscape metrics on LIDAR-based canopy surface models. In Lecture Notes in Geoinformation and Cartography, Object-Based Image Analysis; Springer: Berlin/Heidelberg, Germany, 2008; pp. 625–643. [Google Scholar] [CrossRef]
- Szostak, M. Automated land cover change detection and forest succession monitoring using LiDAR Point Clouds and GIS analyses. Geosciences 2020, 10, 321. [Google Scholar] [CrossRef]
- Osińska-Skotak, K.; Jełowiecki, Ł.; Bakuła, K.; Michalska-Hejduk, D.; Wylazłowska, J.; Kopeć, D. Analysis of using dense image matching techniques to study the process of secondary succession in non-forest natura 2000 habitats. Remote Sens. 2019, 11, 893. [Google Scholar] [CrossRef] [Green Version]
- Ostrowski, W.; Górski, K.; Pilarska, M.; Salach, A.; Bakuła, K. Comparison of the laser scanning solutions for the unmanned aerial vehicles. Arch. Photogramm. Cartogr. Remote Sens. 2017, 29, 101–123. [Google Scholar] [CrossRef]
- White, J.; Stepper, C.; Tompalski, P.; Coops, N.; Wulder, M. Comparing ALS and Image-Based Point Cloud Metrics and Modelled Forest Inventory Attributes in Complex Coastal Forest Environment. Forests 2015, 6, 3704–3732. [Google Scholar] [CrossRef]
- White, J.; Wulder, M.; Vastaranta, M.; Coops, N.; Pitt, D.; Woods, M. The Utility of Image-Based Point Clouds for Forest Inventory: A Comparison with Airborne Laser Scanning. Forests 2013, 4, 518–536. [Google Scholar] [CrossRef] [Green Version]
- Tymińska-Czabańska, L.; Hawryło, P.; Socha, J. Assessment of the effect of stand density on the height growth of Scots pine using repeated ALS data. Int. J. Appl. Earth Obs. Geoinf. 2022, 108, 102763. [Google Scholar] [CrossRef]
- Sackov, I.; Barka, I.; Bucha, T. Mapping Aboveground Woody Biomass on Abandoned Agricultural Land Based on Airborne Laser Scanning Data. Remote Sens. 2020, 12, 4189. [Google Scholar] [CrossRef]
- Susyan, E.A.; Wirth, S.; Ananyeva, N.D.; Stolnikova, E.V. Forest succession on abandoned arable soils in European Russia—Impacts on microbial biomass, fungal-bacterial ratio, and basal CO2 respiration activity. Eur. J. Soil Biol. 2011, 47, 169–174. [Google Scholar] [CrossRef]
- Verstegen, J.; der Laan, C.; Dekkerb, S.; Faaij, A.; Santos, M. Recent and projected impacts of land use and land cover changes on carbon stocks and biodiversity in East Kalimantan, Indonesia. Ecol. Indic. 2019, 103, 563–575. [Google Scholar] [CrossRef]
- Ai, J.; Zhang, C.; Chen, L.; Li, D. Mapping annual land use and land cover changes in the Yangtze estuary region using an object-based classification framework and Landsat time series data. Sustainability 2020, 12, 659. [Google Scholar] [CrossRef] [Green Version]
- Szostak, M.; Hawryło, P.; Piela, D. Using of Sentinel-2 images for automation of the forest succession detection. Eur. J. Remote Sens. 2018, 51, 142–149. [Google Scholar] [CrossRef]
Figure 1.
The analyzed area (marked yellow): orthophotomap (year: 2019, coordinates system: PL-PUWG1992) and an aerial view [7].
Figure 1.
The analyzed area (marked yellow): orthophotomap (year: 2019, coordinates system: PL-PUWG1992) and an aerial view [7].

Figure 2.
The spoil heap of “Fryderyk” mine in Tarnowskie Góry—examples of the forest succession process.
Figure 2.
The spoil heap of “Fryderyk” mine in Tarnowskie Góry—examples of the forest succession process.
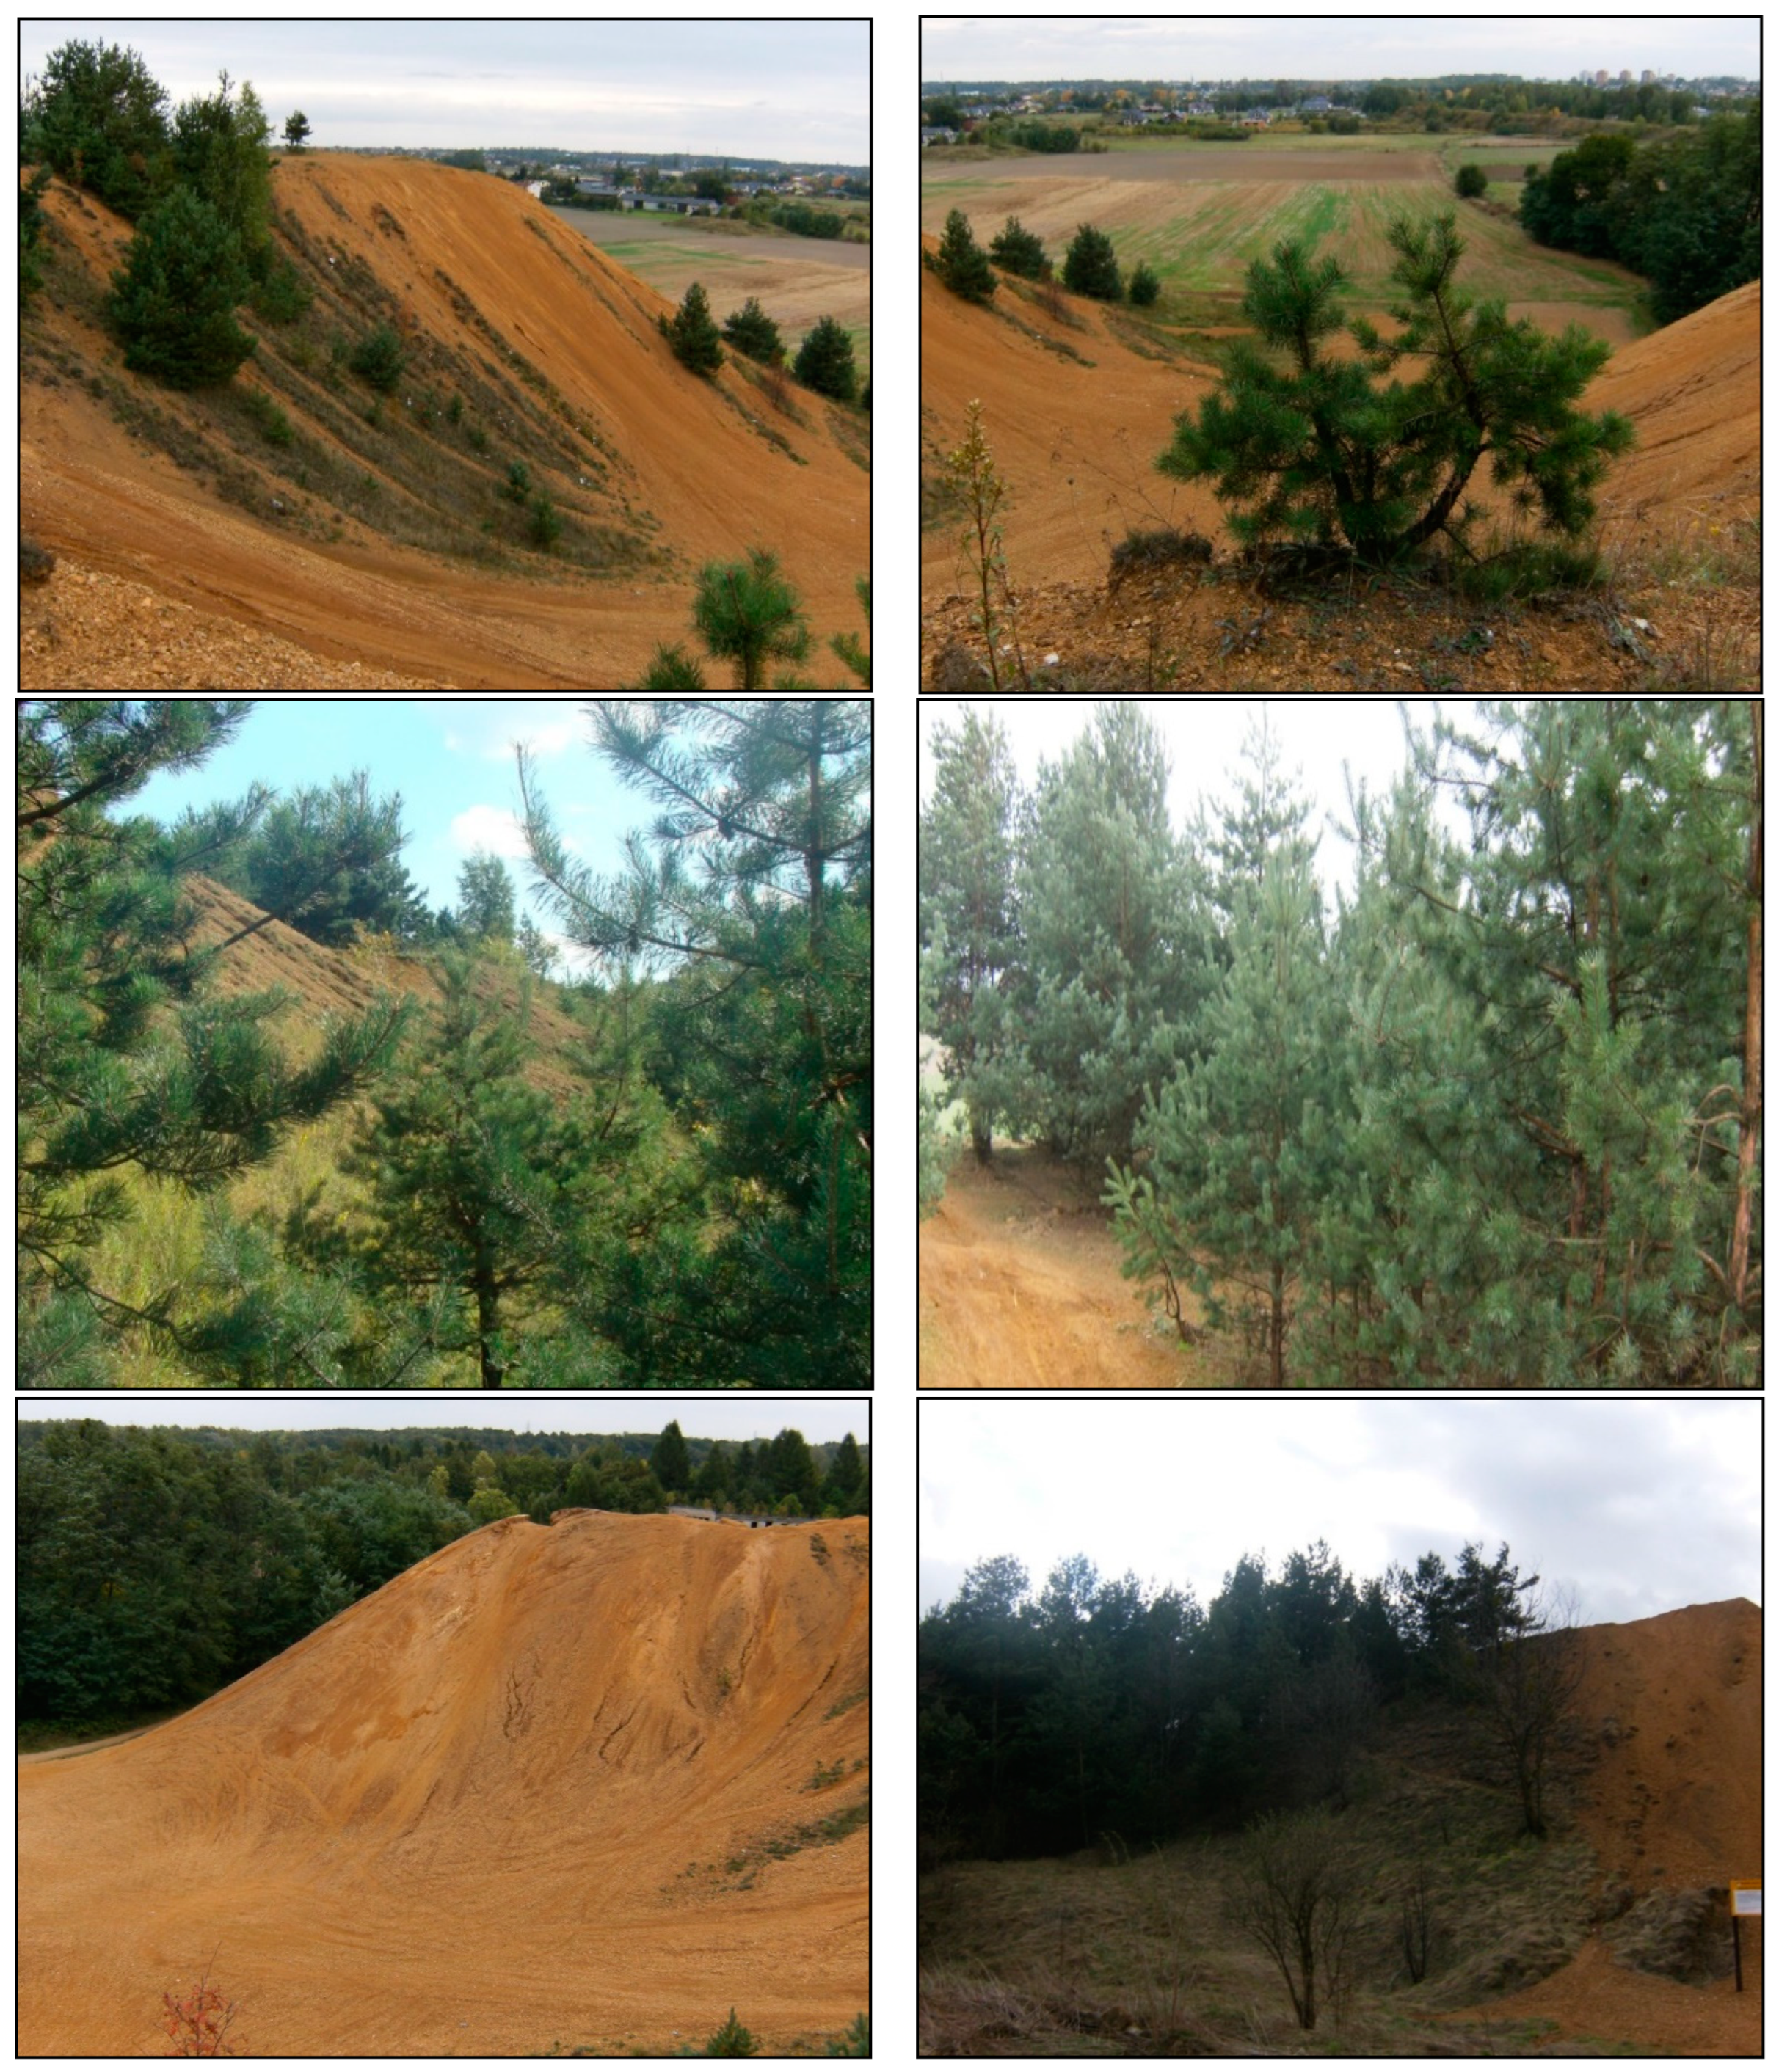
Figure 3.
The analyzed area: (a) slopes, and (b) aspects; (c) height in meters AMSL; (d) hillshade in greyscale.
Figure 3.
The analyzed area: (a) slopes, and (b) aspects; (c) height in meters AMSL; (d) hillshade in greyscale.
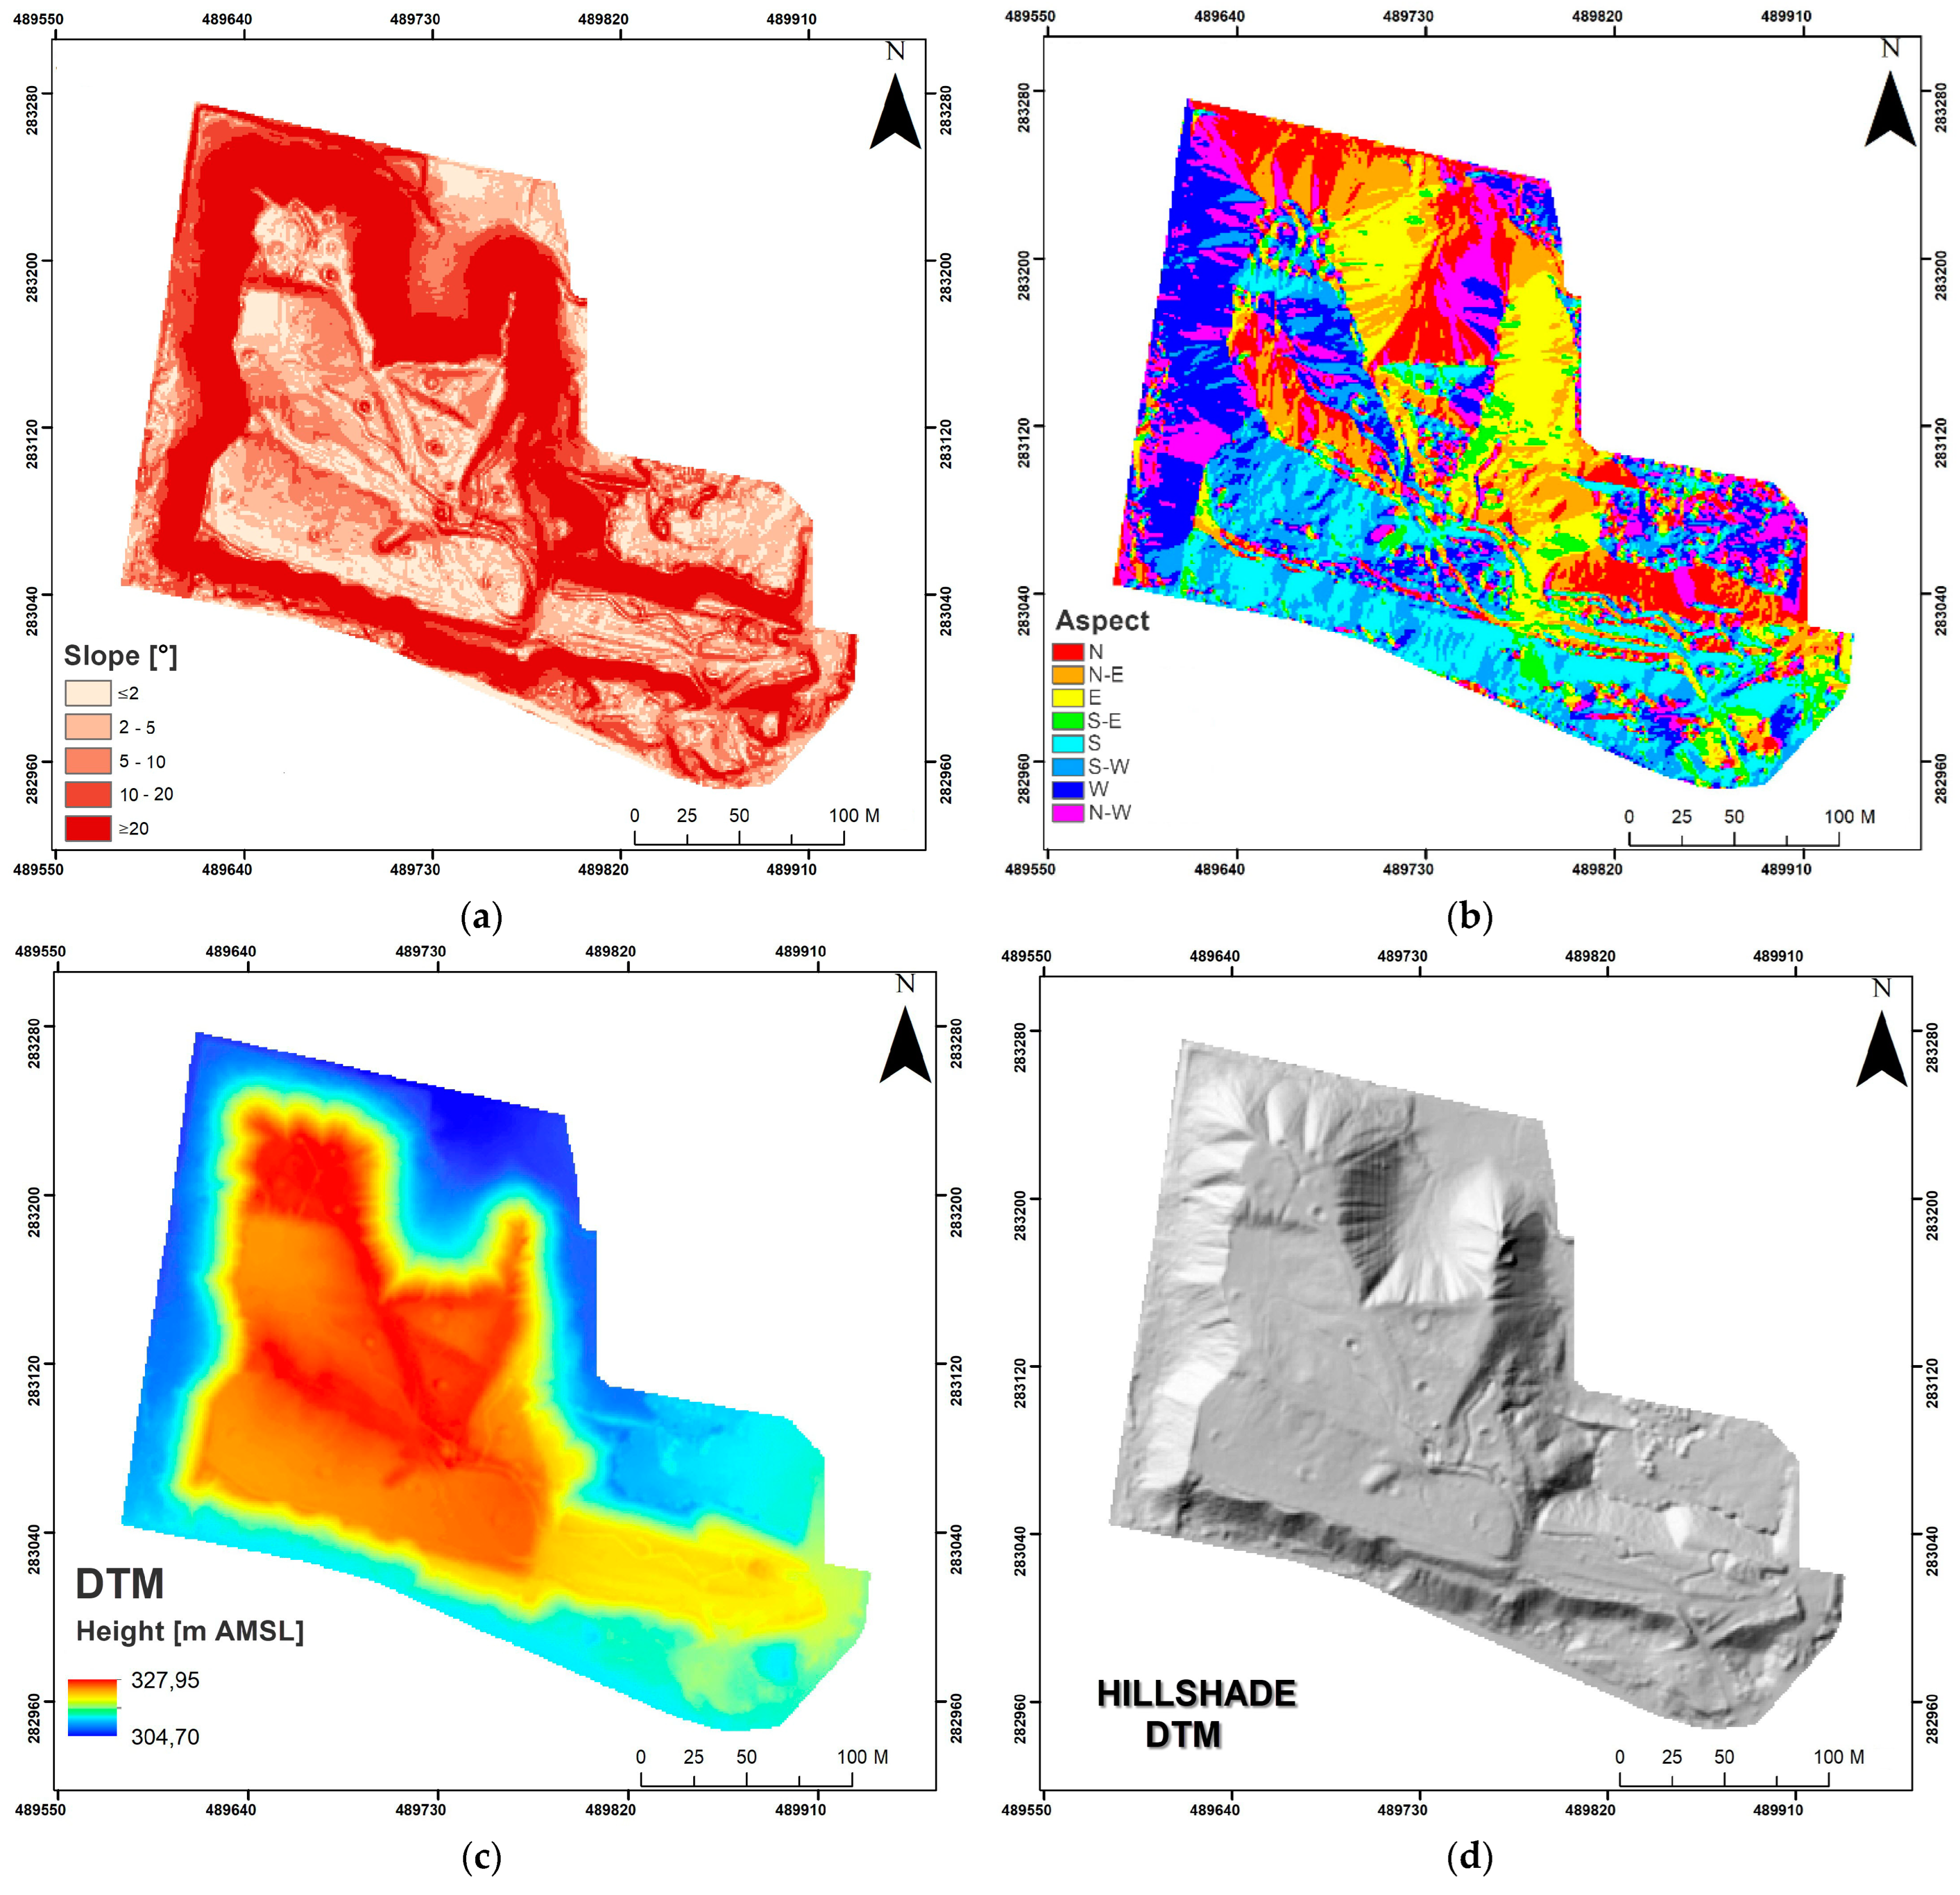
Figure 4.
The analyzed terrain: (a) hillshade with marked profiles, (b) profiles.

Figure 5.
Digital surface model and hillshades: (a,c) 2011; (b,d) 2019.

Figure 6.
The normalized digital surface model (nDSM): (a) 2011; (b) 2019.
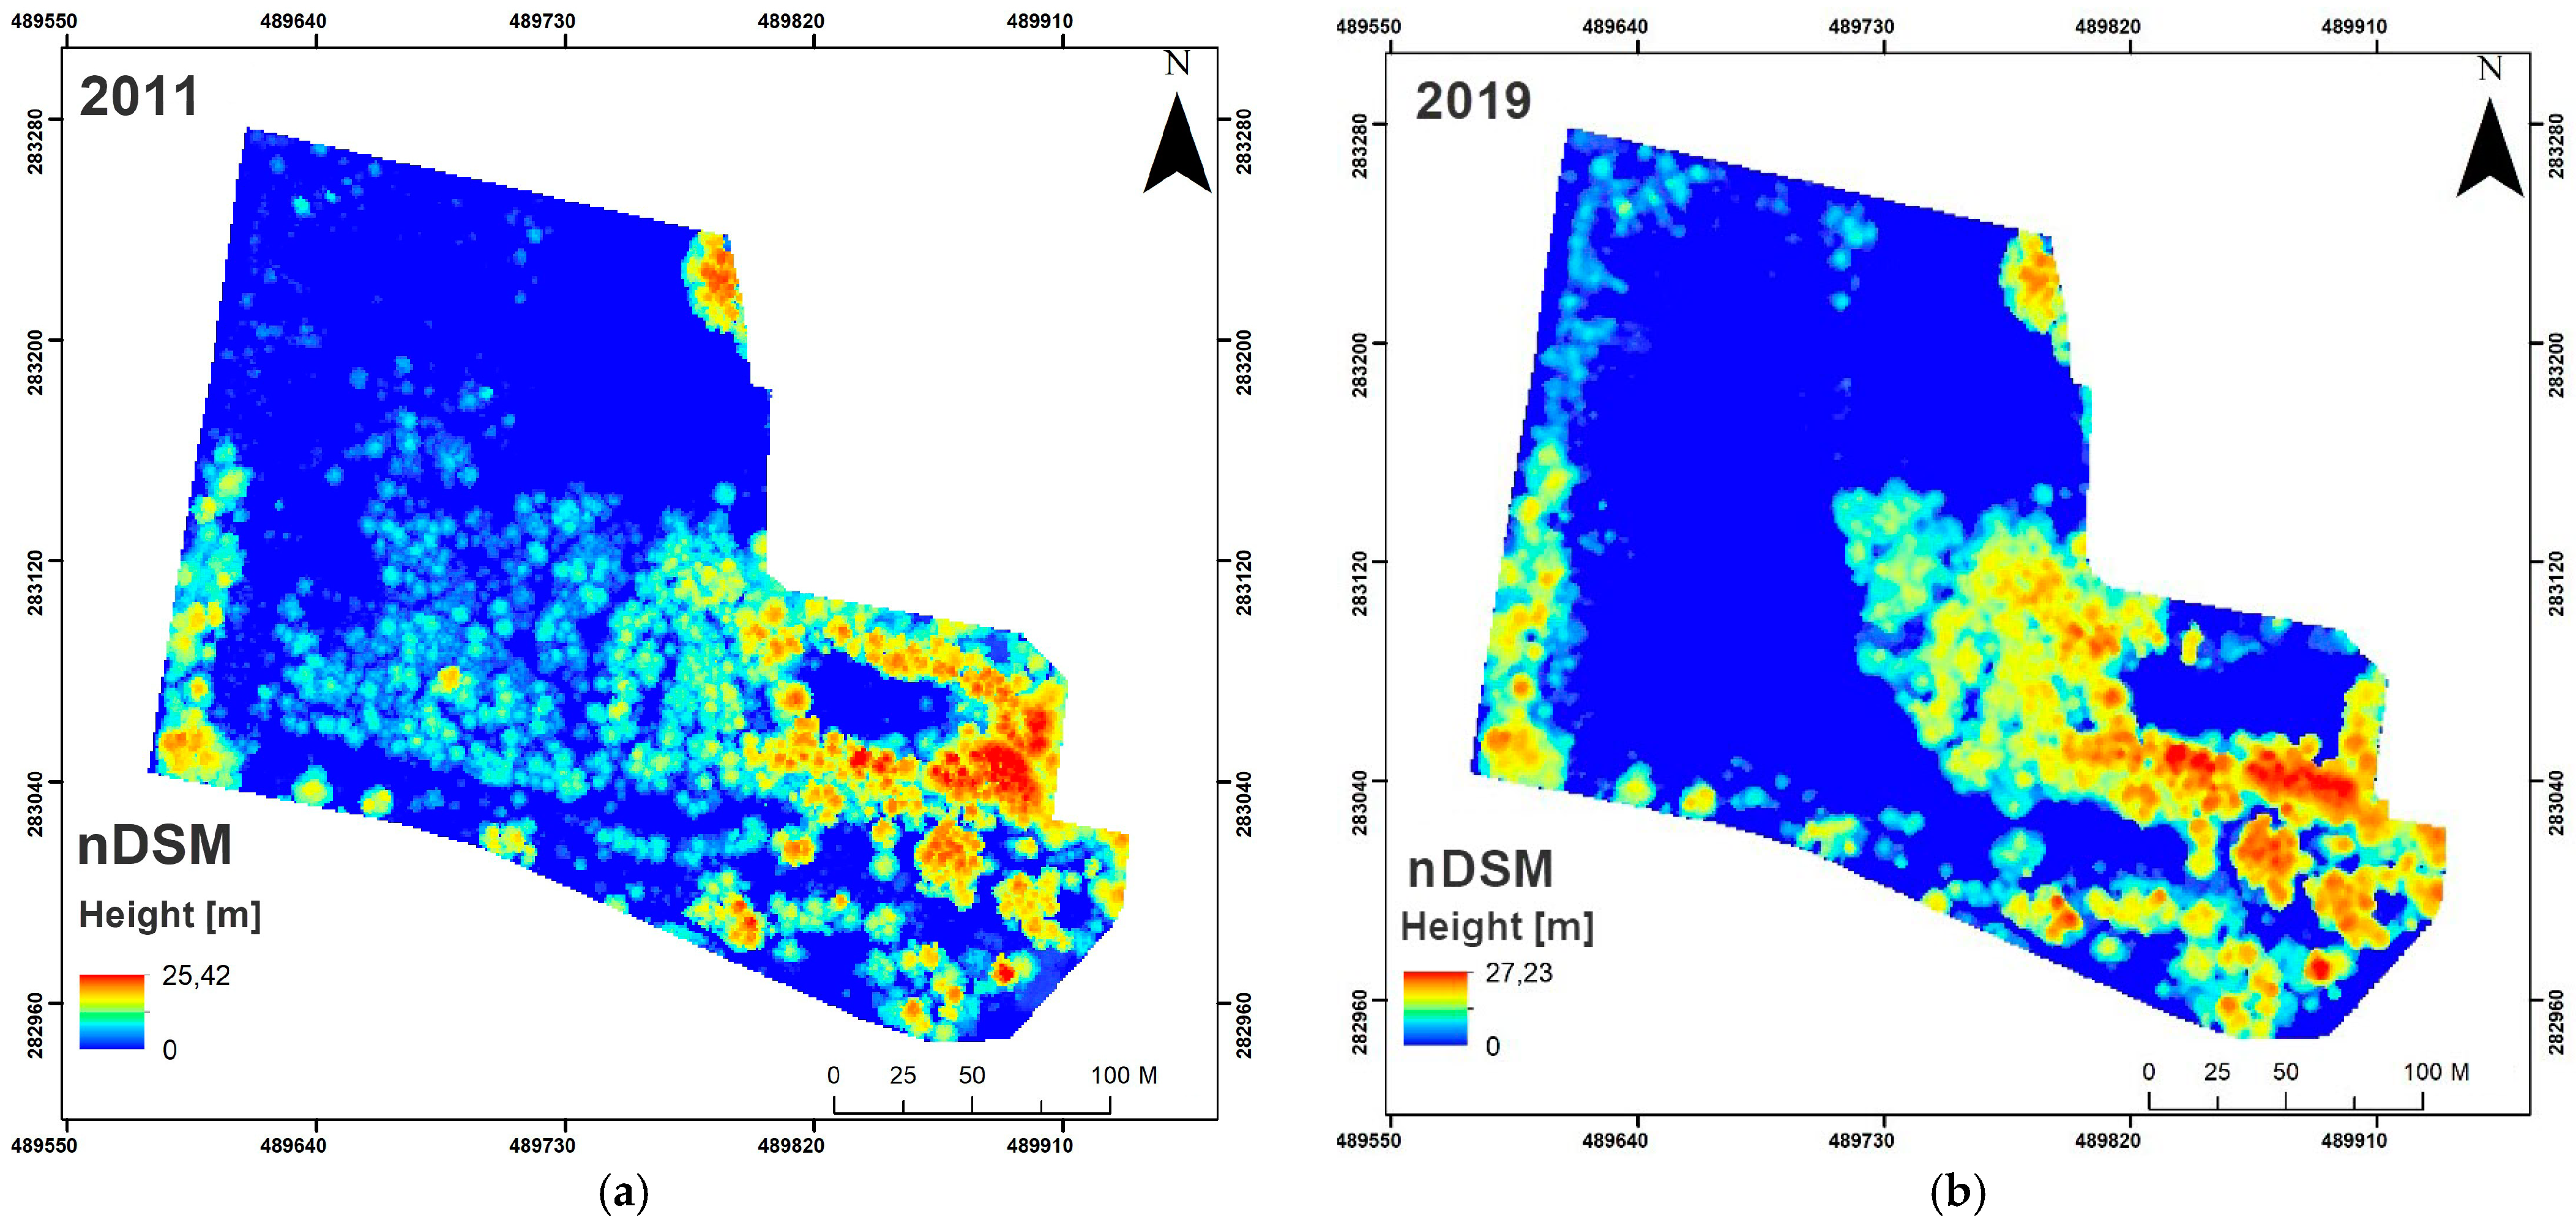
Figure 7.
The results of the LiDAR point cloud (2011, 2019) processing: (a,b) vegetation height (95th percentile, P95); (c,d) standard deviation of height; (e,f) canopy cover (0–100%).
Figure 7.
The results of the LiDAR point cloud (2011, 2019) processing: (a,b) vegetation height (95th percentile, P95); (c,d) standard deviation of height; (e,f) canopy cover (0–100%).
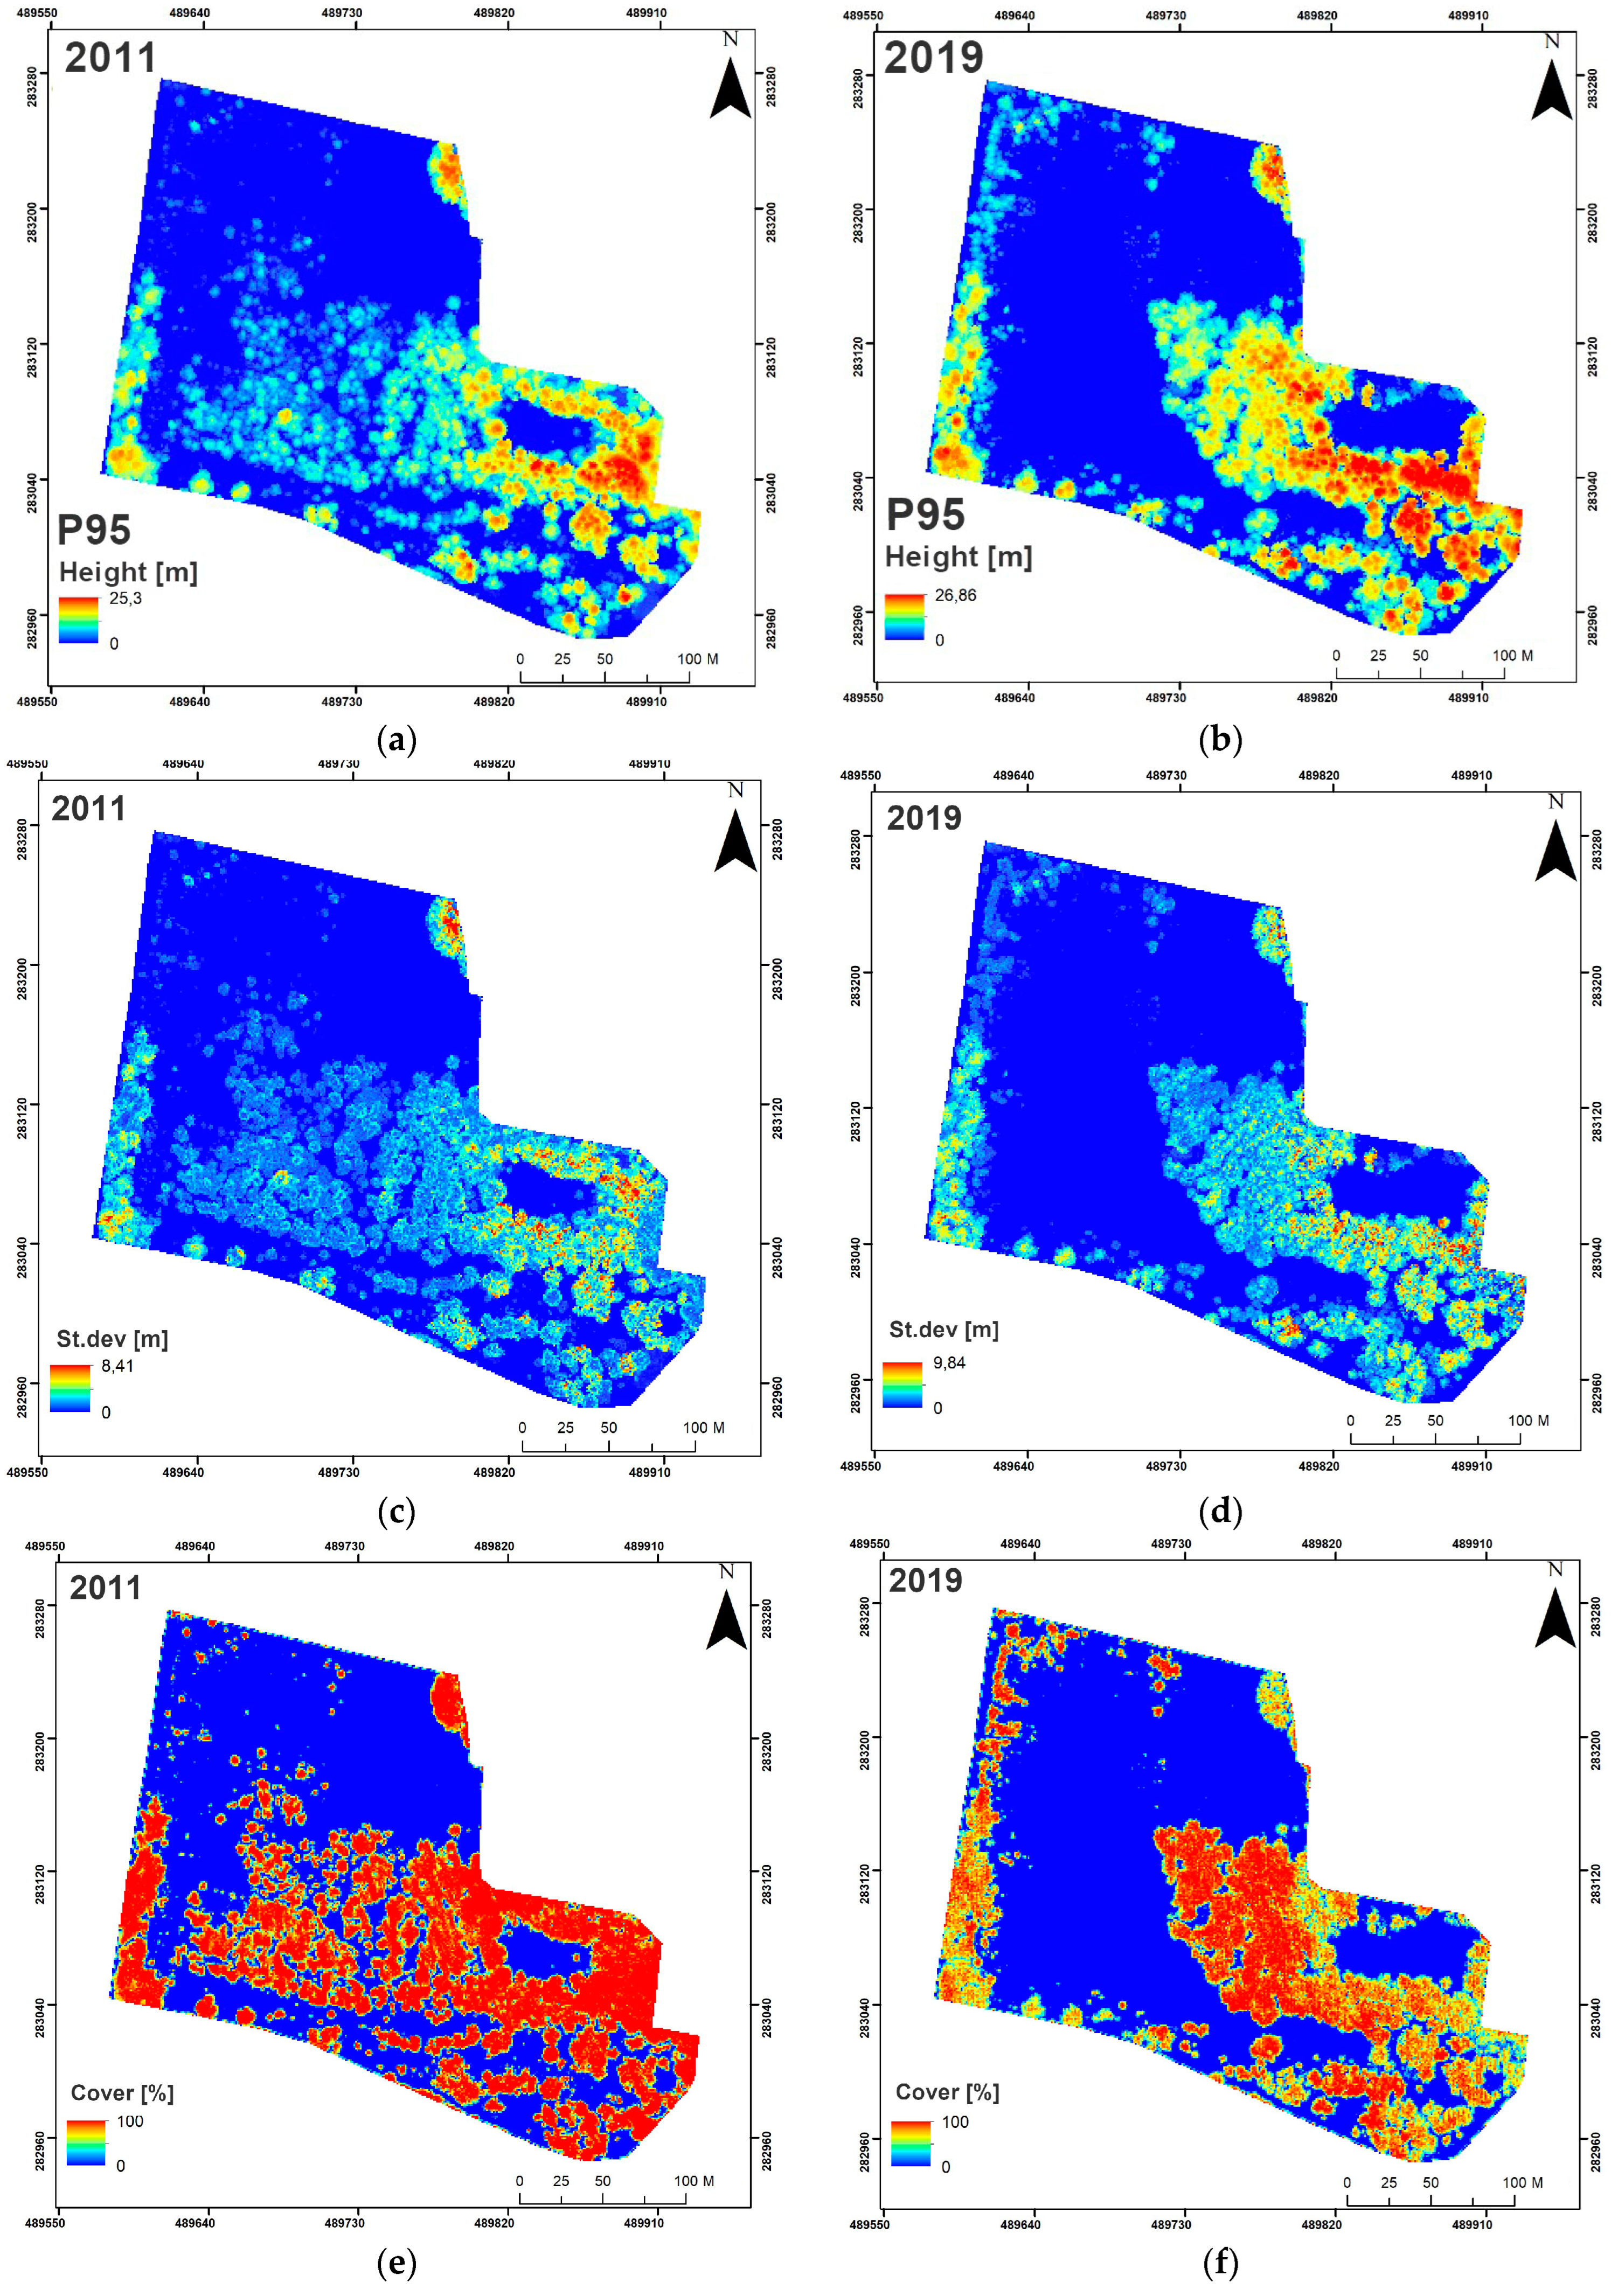
Figure 8.
Vegetation changes in the years 2011–2019: (a) height difference; (b) classes: red—removed vegetation, yellow—no vegetation, green—growing of vegetation.
Figure 8.
Vegetation changes in the years 2011–2019: (a) height difference; (b) classes: red—removed vegetation, yellow—no vegetation, green—growing of vegetation.
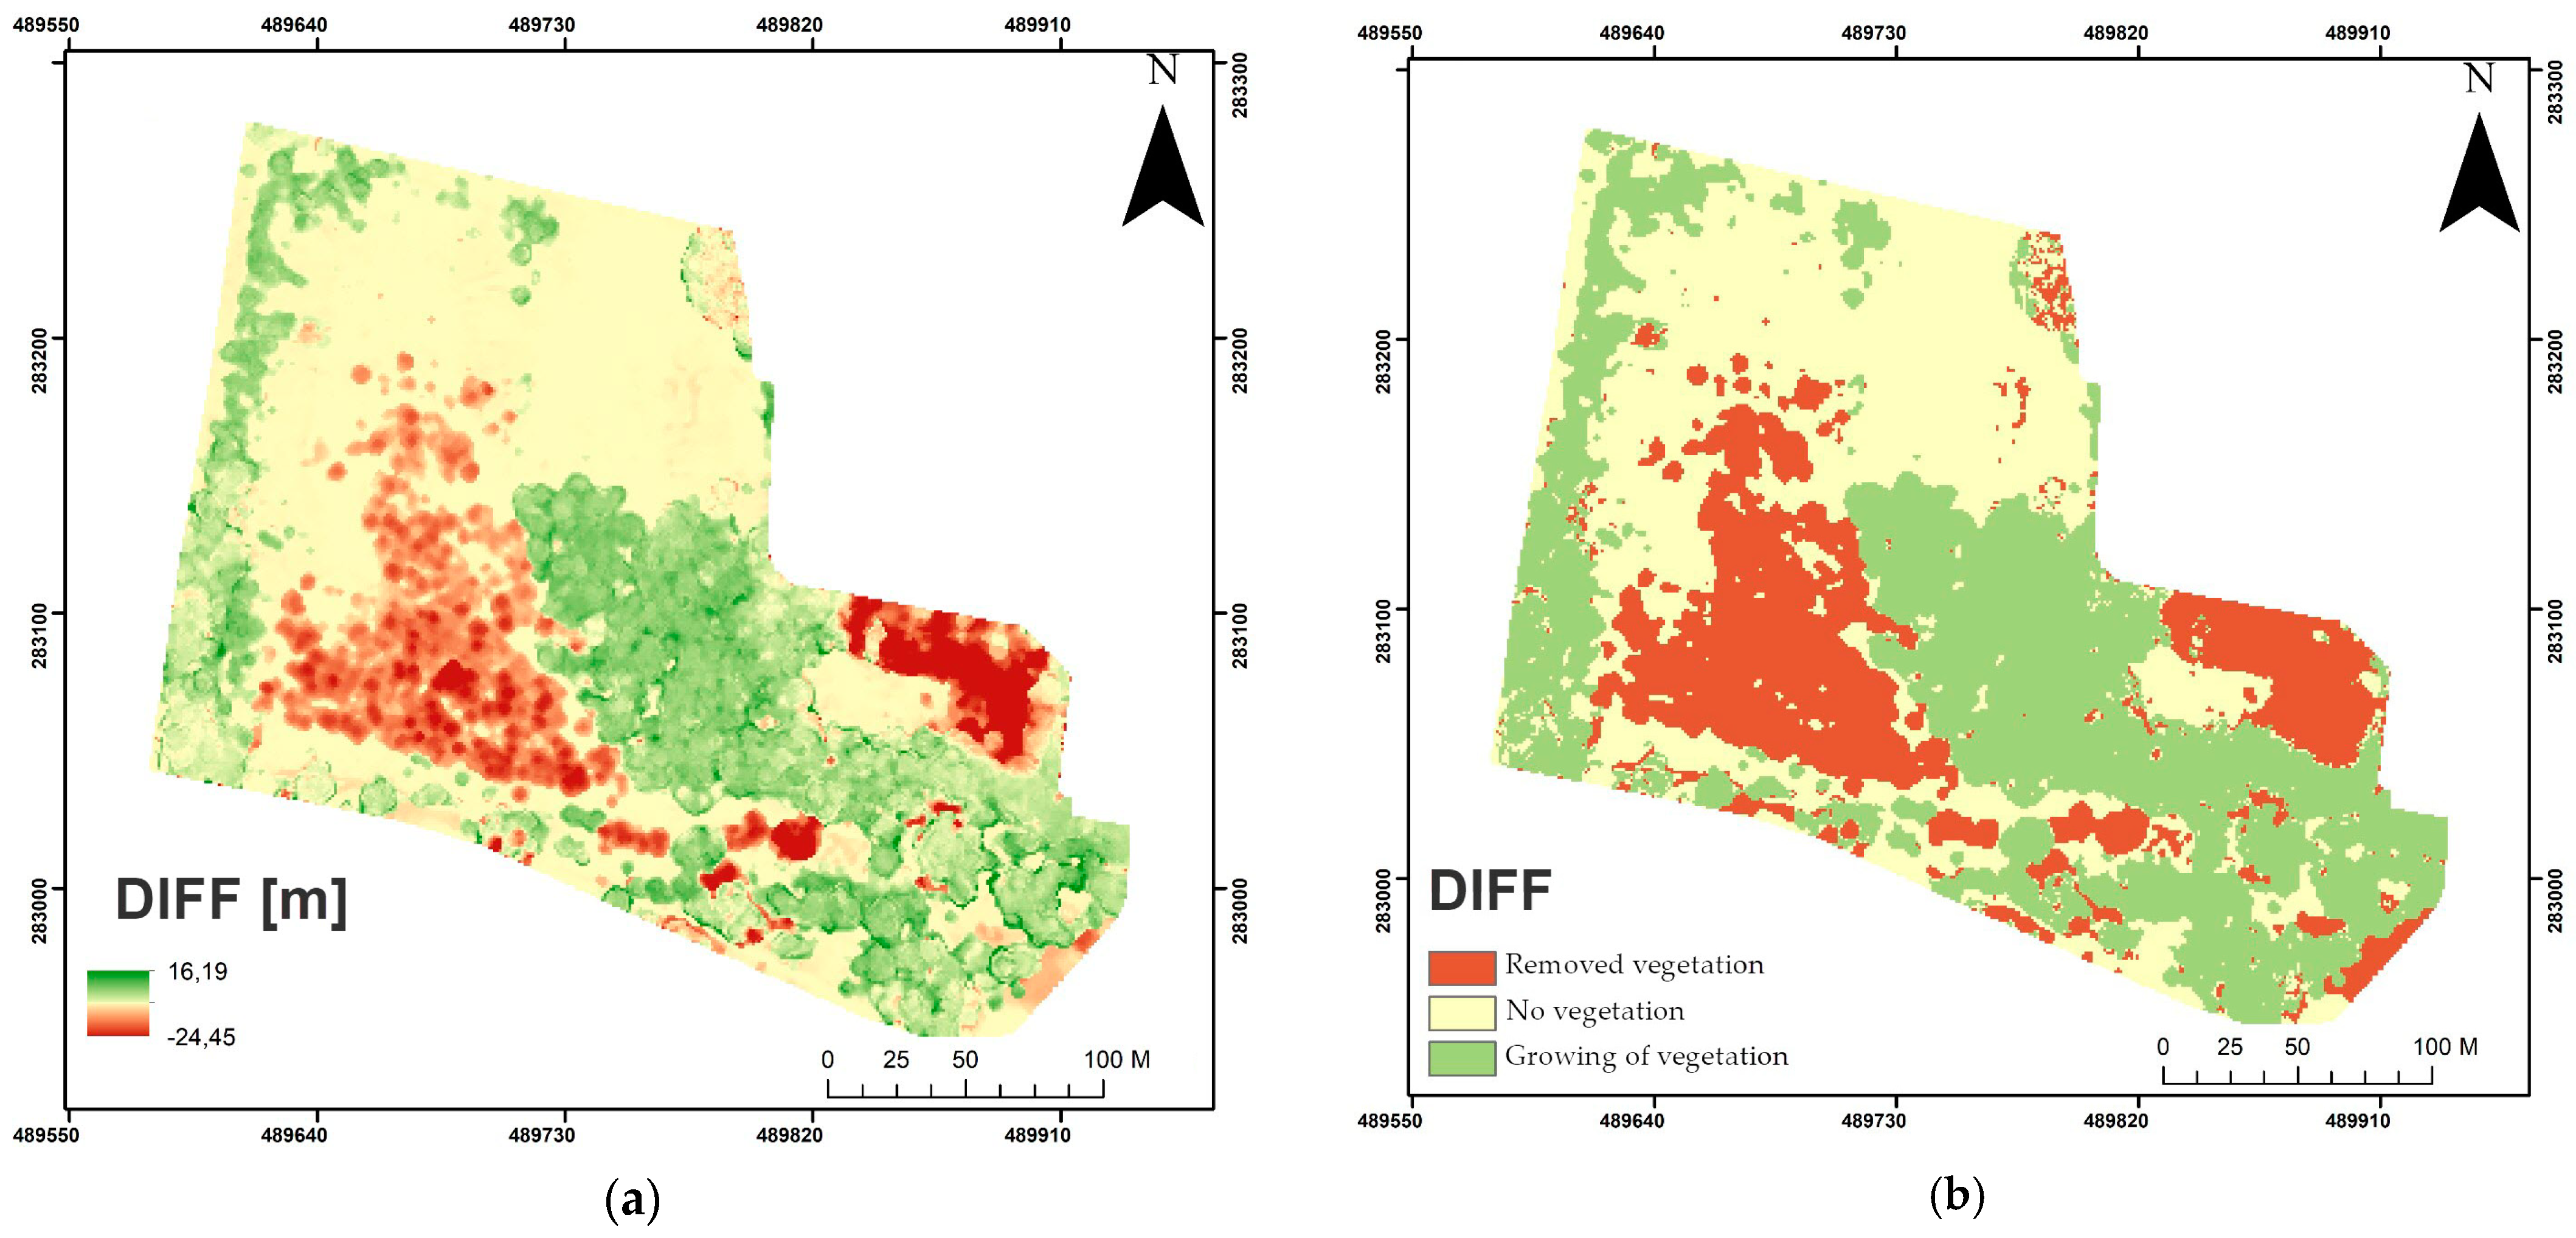
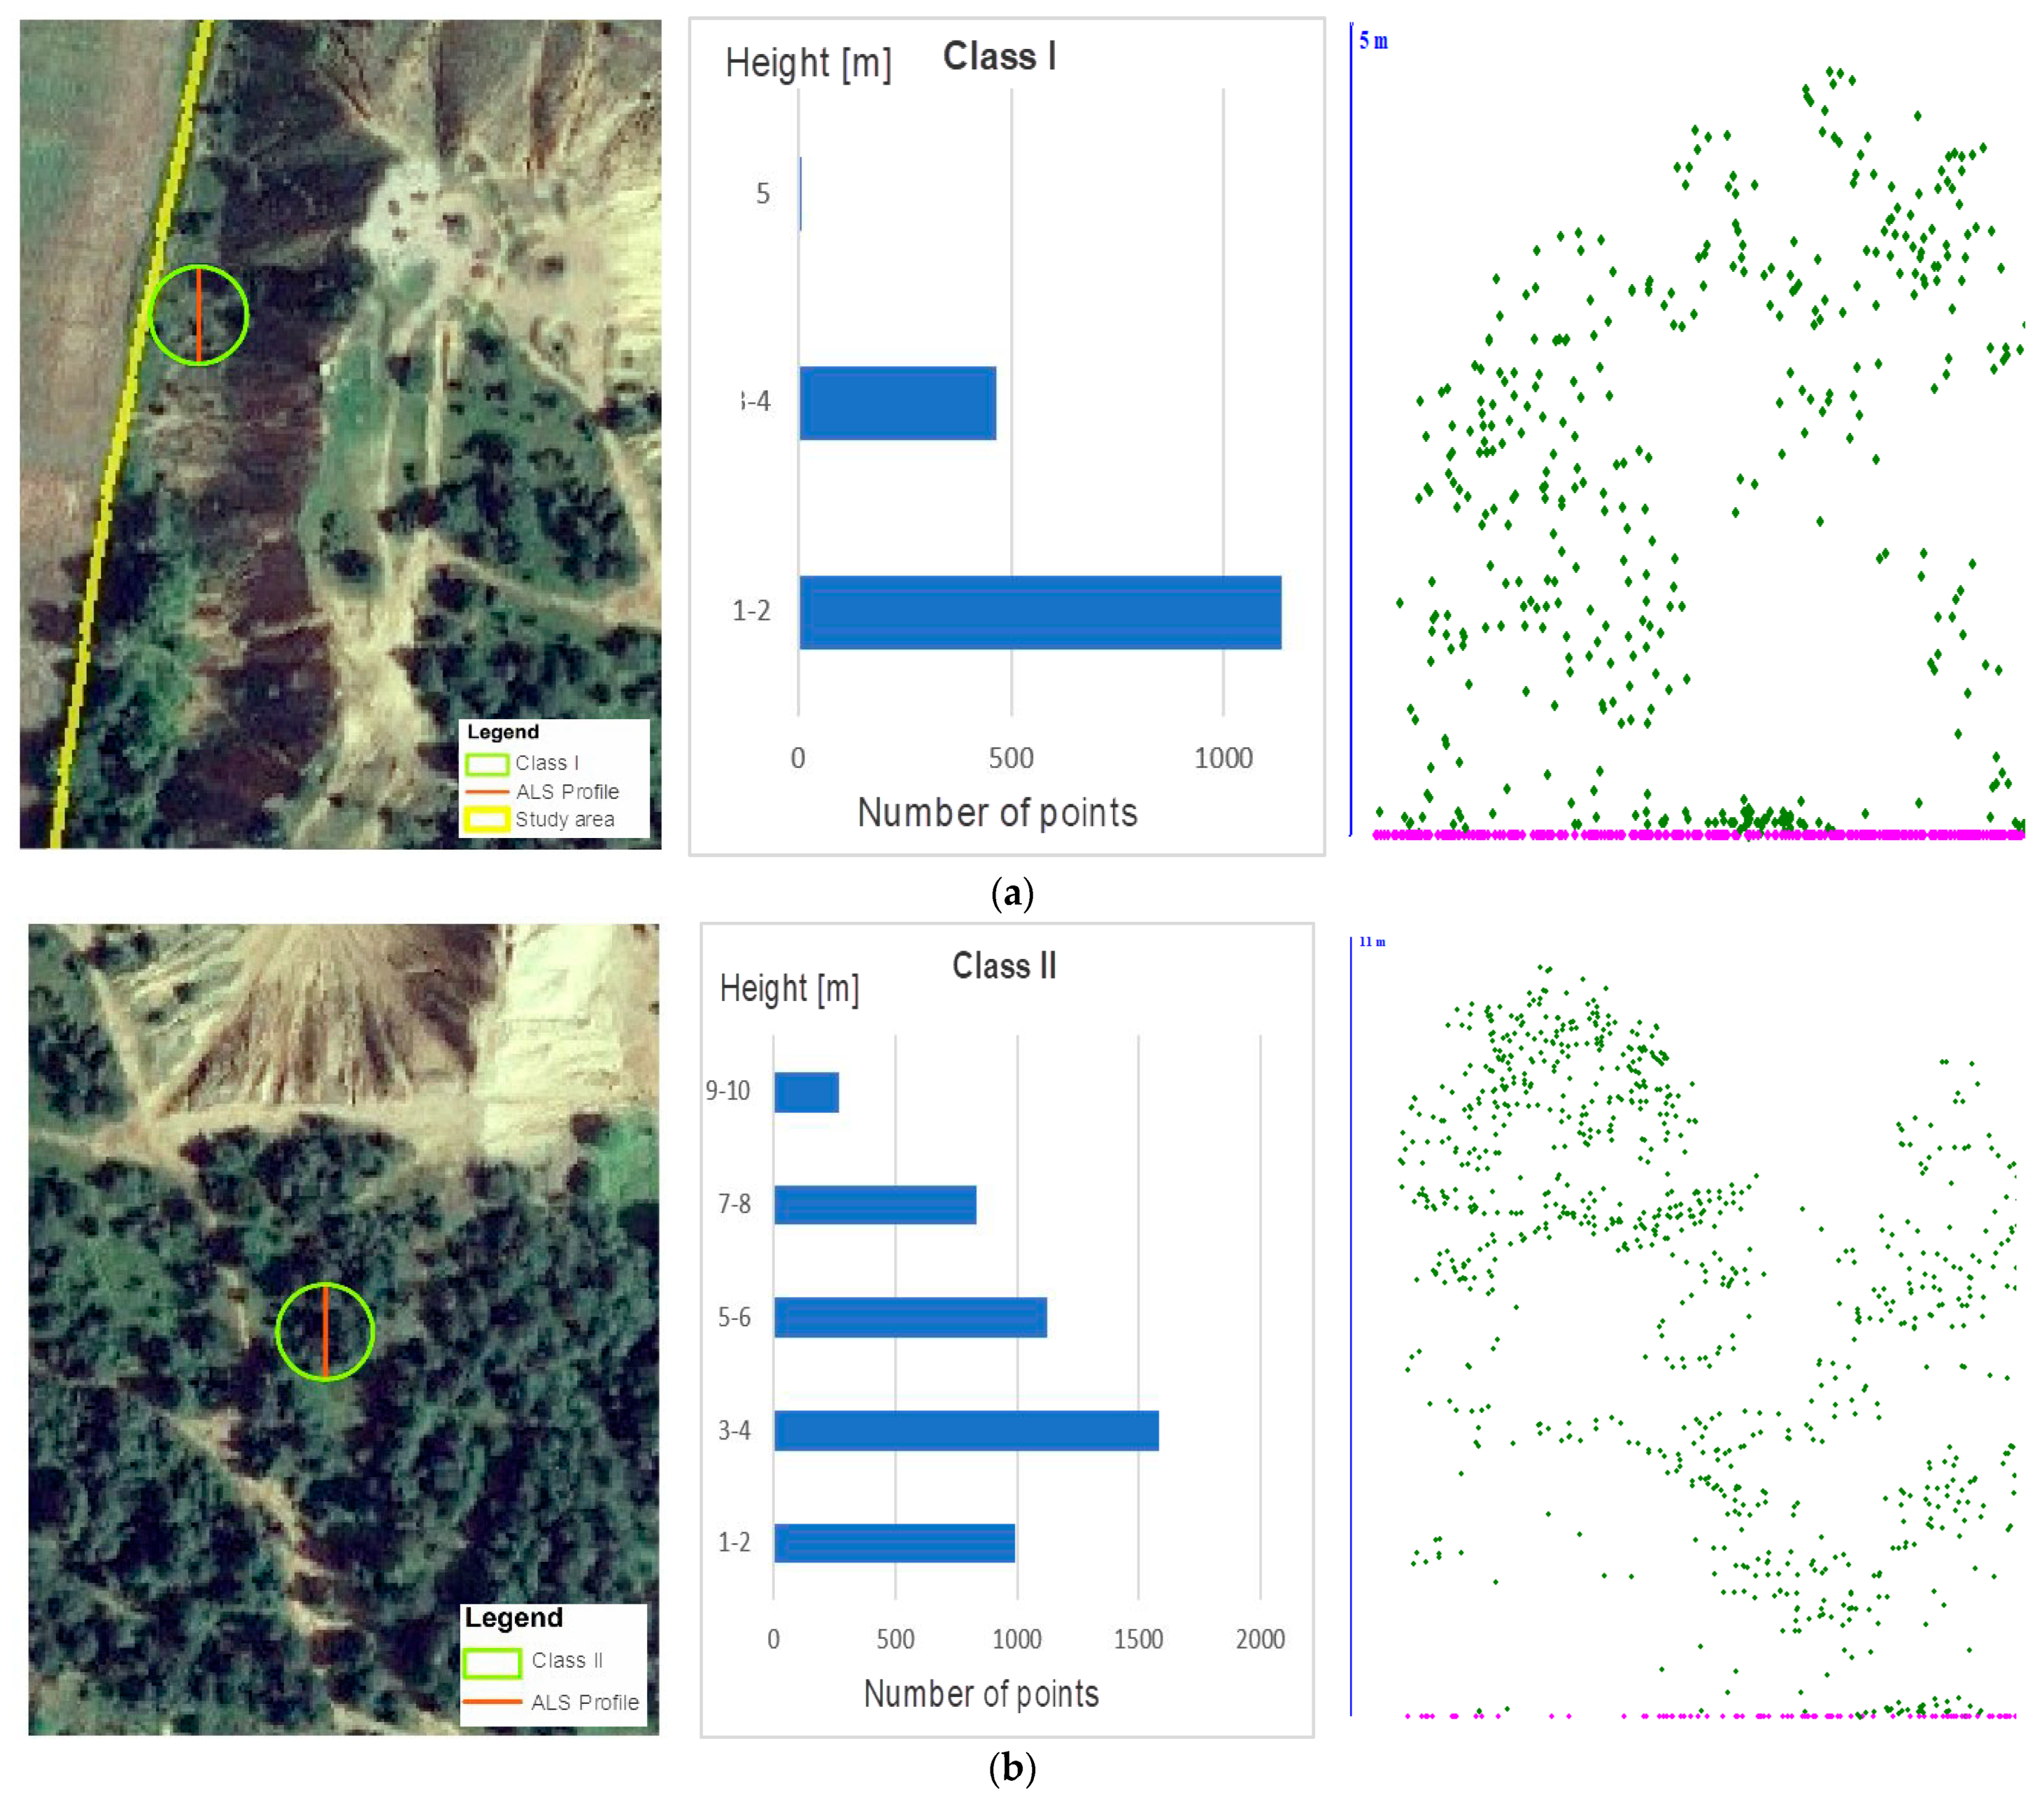
Figure 9.
The vegetation classes—view of orthophotomap, histogram (number of points), and ALS point clouds profile: (a) low vegetation; (b) medium vegetation; (c) high vegetation.
Figure 9.
The vegetation classes—view of orthophotomap, histogram (number of points), and ALS point clouds profile: (a) low vegetation; (b) medium vegetation; (c) high vegetation.


Table 1.
LiDAR metrics for vegetation—mean values of height, std. dev. of height, canopy cover.
| Year | Height [m] | Std. dev. of Height [m] | Canopy Cover [%] |
|---|---|---|---|
| 2011 | 6.84 | 0.68 | 30.0 |
| 2019 | 8.41 | 0.86 | 42.0 |
Table 2.
Changes in vegetation volume (area 3D).
| Year | Volume [m3/%] | Increase in Volume of Vegetation [m3/%] | Loss of Vegetation Volume [m3/%] |
|---|---|---|---|
| 2011 | 310,558 m3—100.0% | 99,880 m3—32.1 % | 85,136 m3—27.4 % |
| 2019 | 325,266 m3—104.7% |
Table 3.
ALS metrics for the class of vegetation—mean values of height and std. dev. of height.
| Classes | Year | Mean Height [m] | Std. dev. of Height [m] |
|---|---|---|---|
| Low vegetation (class I) | 2011 | 0.82 | 0.14 |
| 2019 | 3.31 | 0.74 | |
| Medium vegetation (class II) | 2011 | 4.75 | 0.97 |
| 2019 | 8.95 | 1.56 | |
| High vegetation (class III) | 2011 | 15.96 | 2.46 |
| 2019 | 16.70 | 3.86 |
Disclaimer/Publisher’s Note: The statements, opinions and data contained in all publications are solely those of the individual author(s) and contributor(s) and not of MDPI and/or the editor(s). MDPI and/or the editor(s) disclaim responsibility for any injury to people or property resulting from any ideas, methods, instructions or products referred to in the content. |
© 2022 by the authors. Licensee MDPI, Basel, Switzerland. This article is an open access article distributed under the terms and conditions of the Creative Commons Attribution (CC BY) license (https://creativecommons.org/licenses/by/4.0/).
Share and Cite
MDPI and ACS Style
Szostak, M.; Pająk, M. LiDAR Point Clouds Usage for Mapping the Vegetation Cover of the “Fryderyk” Mine Repository. Remote Sens. 2023, 15, 201. https://doi.org/10.3390/rs15010201
AMA Style
Szostak M, Pająk M. LiDAR Point Clouds Usage for Mapping the Vegetation Cover of the “Fryderyk” Mine Repository. Remote Sensing. 2023; 15(1):201. https://doi.org/10.3390/rs15010201
Chicago/Turabian StyleSzostak, Marta, and Marek Pająk. 2023. "LiDAR Point Clouds Usage for Mapping the Vegetation Cover of the “Fryderyk” Mine Repository" Remote Sensing 15, no. 1: 201. https://doi.org/10.3390/rs15010201
Note that from the first issue of 2016, this journal uses article numbers instead of page numbers. See further details here.