


An Algorithm to Detect Endangered Cultural Heritage by Agricultural Expansion in Drylands at a Global Scale

1
Landscape Archaeology Research Group (GIAP), Catalan Institute of Classical Archaeology (ICAC), 43003 Tarragona, Spain
2
Catalan Institution for Research and Advanced Studies (ICREA), 08010 Barcelona, Spain
3
GEO3BCN, Spanish National Research Council, 08028 Barcelona, Spain
4
Department of Archaeology, University of Cambridge, Cambridge CB2 3DZ, UK
*
Authors to whom correspondence should be addressed.
Remote Sens. 2023, 15(1), 53; https://doi.org/10.3390/rs15010053
Submission received: 22 November 2022
/
Revised: 19 December 2022
/
Accepted: 20 December 2022
/
Published: 22 December 2022
(This article belongs to the Special Issue Satellite Remote Sensing for Cultural and Natural Heritage: Assessing Copernicus Sentinels and Contributing Missions Added Value)
Abstract
:This article presents AgriExp, a remote-based workflow for the rapid mapping and monitoring of archaeological and cultural heritage locations endangered by new agricultural expansion and encroachment. Our approach is powered by the cloud-computing data cataloguing and processing capabilities of Google Earth Engine and it uses all the available scenes from the Sentinel-2 image collection to map index-based multi-aggregate yearly vegetation changes. A user-defined index threshold maps the first per-pixel occurrence of an abrupt vegetation change and returns an updated and classified multi-temporal image aggregate in almost-real-time. The algorithm requires an input vector table such as data gazetteers or heritage inventories, and it performs buffer zonal statistics for each site to return a series of spatial indicators of potential site disturbance. It also returns time series charts for the evaluation and validation of the local to regional vegetation trends and the seasonal phenology. Additionally, we used multi-temporal MODIS, Sentinel-2 and high-resolution Planet imagery for further photo-interpretation of critically endangered sites. AgriExp was first tested in the arid region of the Cholistan Desert in eastern Pakistan. Here, hundreds of archaeological mound surfaces are threatened by the accelerated transformation of barren lands into new irrigated agricultural lands. We have provided the algorithm code with the article to ensure that AgriExp can be exported and implemented with little computational cost by academics and heritage practitioners alike to monitor critically endangered archaeological and cultural landscapes elsewhere.
1. Introduction
The remote assessment and analysis of disturbances and damage affecting the preservation of cultural heritage (CH) have become particularly important over the past decade and have benefitted from improvements in the availability of global geospatial data and innovations in software and image processing techniques (see [1,2,3]). The consolidation of cloud-based platforms for the rapid analysis and visualization of open-source satellite imagery offers a game-changing scenario in CH documentation and archaeological landscape investigations. Platforms such as Google Earth Engine (GEE, [4]) have greatly facilitated the handling of multi-temporal data at larger spatial and temporal scales, particularly in remote areas with little or almost no ground information.
This study presents a novel approach that combines several aspects into a single, reproducible and exportable workflow, namely (1) the multi-temporal monitoring of agricultural expansion using big data image datasets, and (2) the automatic detection of CH locations that are potentially endangered by recent and often active agricultural developments. Our approach primarily benefited from the optimal temporal and spatial resolution of the data from the free and open-source Sentinel satellite missions, and the reliability of the performance of the multi-spectral indices for remote assessment of the vegetation’s phenology and seasonality. We have moved forward from standard approaches to detect change by analysing multi-temporal and cumulative vegetation changes that can be handily monitored across time and updated in almost-real time. Our algorithm was built on the GEE cloud-computing platform, which ensured (1) effective multi-petabyte image processing and access to Copernicus missions with the latest image data included in the catalogue; (2) support for importing and integrating external vector files, such as archaeological and heritage data gazetteers and inventories, and producing standardised outputs; and (3) the promotion of code-based archaeological remote sensing analyses. The use of this combination of open resources has significant implications for the conversion of this approach into a global tool that can be tested, implemented and modified by both scholars and heritage practitioners.
The algorithm was tested and applied in the fragile archaeological landscape of the Cholistan Desert in eastern Pakistan (Figure 1). The area was central to the development of the Indus Civilisation (ca. 3500–1600 BC) and is home to hundreds of well-preserved archaeological mounds [5,6,7]. As with many other drylands elsewhere, the recent development of irrigation schemes is threatening the preservation and visibility of many archaeological locations, and such new developments are often largely undetected. The results of the analysis were evaluated and discussed with time series from the MODIS and Sentinel-2 collections, with additional high-resolution scenes from the Planet constellation [8]. We finally discuss the opportunities and limitations for the global implementation of the algorithm in the context of new appraisals for data sharing and the method’s reproducibility.
Remote Detection and Monitoring of Endangered Archaeological Sites
The pressing impacts facing the conservation of archaeological and heritage sites are generally divided between natural and anthropogenic hazards, although, in many instances, they are intrinsically correlated [9]. Remote-based observations of natural hazards have primarily focused on monitoring flooding events and coastal erosion (e.g., [10,11,12,13,14]), as well as soil processes such as landslides, erosion and structural instability, including the impact of dams (e.g., [9,15,16,17,18,19,20,21]). In contrast, the remote detection of abrupt anthropogenic impact accounts for the vast majority of published research in diverse archaeological and ecological settings. Inter-regional initiatives such as the Endangered Archaeology in the Middle East and North Africa (EAMENA, see [22,23,24]) have systematised the main activities that pose urgent threats to site preservation and thus require rapid evaluation. These include (1) agricultural development, (2) looting, (3) urban growth, (4) infrastructural development, (5) mining and soil removal, and (6) military activities and conflict.
Looting is perhaps the anthropogenic impact that has received the most attention. Tapete and Cigna [25] observed the significant academic interest in satellite-based looting studies in the wake of the growing political instability and conflict in many regions, which, in turn, placed large-scale pillaging into the global spotlight (see e.g., [26,27,28,29,30,31,32,33], to name just a few). Conversely, land reclamation for expanding new irrigation schemes in drylands has encroached on archaeological sites for decades [34], and this is among the most critical human-made impacts that can accelerate the disappearance of cultural landscapes [35]. Mechanised ploughing disturbs the archaeological evidence preserved in archaeological topsoils, and the construction of the related infrastructure, such as irrigation canals, are also highly destructive. However, agricultural development is not systematically quantified through time or else it is typically only monitored together with other variables in generic land cover classifications and general land change monitoring (e.g., [36,37,38]). The paucity of studies that focus on agriculture-specific risks is notably in contrast with the extensive exploration of phenology of vegetation using multi-temporal and multi-spectral vegetation indices for the detection of features and crop marks in archaeological research (e.g., [39,40] and references therein). In most instances, analyses of change over time rely on the evaluation of unique “before” and “after” events that are complemented with available third-party satellite missions and ancillary data such as historical satellite imagery, historical aerial photographs and topographical maps (e.g., [41,42,43,44,45,46,47]). The analysis of multi-temporal trends in vegetation is increasingly taking advantage of the full potential of cloud computing. Orengo and Petrie [48] explored the potential of customised multi-temporal seasonal vegetation indices such as SMTVI, and Rayne et al. [22] analysed MODIS NDVI to monitor modern agriculture and surviving sites at a large scale. More recently, Rayne et al. [38] and Agapiou [49] automatised pixel-based approaches of detecting change in endangered cultural landscapes and UNESCO World Heritage sites, respectively, using data from Copernicus missions. The appraisal of opportunities for the synergetic integration of Copernicus data and other long-running satellite missions such as Landsat in Big Earth Data analysis platforms certainly offers a new methodological shift for the systematic detection and assessment of the condition of heritage sites (see also [7,50,51,52,53]). This is also in line with the growing need for global satellite-based applications in the archaeological agenda.
2. Materials and Methods
The AgriExp workflow presented here (Figure 2) aims to provide a rapid and efficient tool for the multi-temporal detection and monitoring of threats and potential site damage by the occurrence of agricultural expansion and encroachment. The algorithm relies on a combination of standard remote sensing procedures and multi-aggregate spatial analyses that are handily integrated into a single processing flow, powered by GEE’s multi-petabyte mission catalogue and cloud-computing capabilities, as follows:
- It requires an external site location database as the main data input, in common vector formats, and calculates a buffer distance for each site.
- It calculates a spectral index over a sequence of Sentinel-2 images within an area of interest (AOI) and returns a multi-temporal aggregate of the maximum annual index values.
- It applies an index threshold to discriminate the occurrence of crops and seasonal phenology among local vegetation land cover types.
- It returns the AgriExp output classified raster, showing the first date (in years) on which each pixel within a site distance buffer was classified as being above the given threshold and has potentially been encroached by agricultural expansion.
- If any of the newly classified pixels falls within any of the site buffers, the algorithm produces aggregated spatial statistics and it outputs a list of sites in danger and in need of urgent monitoring.
- Additionally, the algorithm is set to display index-based time series for inspecting and validating land cover trends at any given location within the AOI.
The following subsections describe the workflow’s rationale and implementation in detail. The first version of AgriExp’s GEE script that accompanies this article and the other additional GEE and R materials necessary to reproduce the time series charts and paper figures are available as the Supplementary Materials.
2.1. User-Uploaded Vector Table
In this study, we used a catalogue of 337 spatial polygons (in .shp format). Each polygon marked the photo-interpreted visible boundaries of known and newly detected archaeological mounds of variable shape and size that were recently identified by the research team using Sentinel 1–2 collections in a GEE machine-learning workflow [7].
2.2. Definition of Protected Areas and Buffer Mapping
The demarcation of sites’ preservation boundaries with buffer zones is a prerequisite in many heritage conservation initiatives (see e.g., [54,55]), and it has been previously introduced as a key element in remote-based monitoring of at-risk heritage. For example, Chyla [56] identified endangered archaeological sites in Egypt located within a “hazard zone” that were delineated by image classification and detecting changes in agricultural development between two Landsat MSS and OLI scenes. User-defined buffer zones were also a critical step in a similar multi-temporal cloud-based assessment of Sentinel-2 scenes to detect modern activities and changes in land cover damaging archaeological sites that was proposed by Rayne et al. [38].
In our case, the use of a buffer area around known archaeological sites was designed to allow the detection of agricultural expansion potentially affecting the site before it expands and surpasses the site’s boundaries, as agricultural activities tend to extend over time. A predefined buffer zone of 50 m was assigned to each site inputted in the database. This buffer distance encompassed the visible extent of the site and delineated the restricted and protected areas according to standard regulations for the protection of archaeological and CH sites in Pakistan [57,58] and the broader South Asia region (Table 1, [59,60,61]). In other contexts, buffer zones can be adjusted to enclose wider boundaries of non-visible or highly eroded mounds [62], to provide an area estimate when only the points are available for the location of sites, or to directly adapt AgriExp’s outputs to distinct needs and heritage by-laws and regulations.
2.3. Sentinel-2 Image Collection
The algorithm uses the Sentinel-2 image collection from the European Space Agency and the European Commission’s Copernicus program, which operates entirely under a free and open data policy. Therefore, the entire dataset is available in GEE, and new scenes are added daily, with an average latency of 24 h from the scene acquisition time [4]. The two polar-orbiting Sentinel-2 satellites (namely Sentinel-2A and Sentinel-2-B) currently provide a revisit frequency of every 5 days at any point on the Earth’s surface, thus providing optimal systematic coverage for monitoring long- to short-term patterns globally. In particular for the algorithm presented here, we selected the Sentinel-2 L1C scenes representing the top of atmosphere (TOA) reflectance values scaled by 10,000. TOA scenes were preferred to surface reflectance L2A scenes, given the longer data availability of the former. In our case study, the L1C scenes started in November 2015 and the L2A products started only in December 2018. Since 25 January 2022, the Sentinel-2 processing baseline of 04.00 changed to a new processing baseline [63]. As a result, we used the new harmonised Sentinel-2 dataset to ensure that those newer scenes were in the same range as the older ones.
2.4. Use of Multi-Temporal NDVI Aggregates to Map Yearly Agricultural and Vegetation Trends
Numerous spectral indices based on different mathematical equations that exploit the optimal spectral window in the near-infrared part of the spectrum have been developed in recent decades, particularly to track the status of vegetation and crops’ vigour and growth [64]. One of the most widespread indices is the so-called normalised difference vegetation index (NDVI), which is estimated using the reflectance values of the near-infrared and red bands of multi-spectral images [65]. NDVI has been shown to be indicative of seasonal phenological cycles, and it commonly used in archaeological and landscape investigations [19,66,67]. In drylands and arid regions such as Cholistan, the yearly average vegetation status is highly dependent on erratic and seasonal rainfall, in contrast with the more cyclic and higher vegetation index values that might be representative of newly irrigated crops [22], particularly in regions that have not been under cultivation previously.
In this study, we examined the multi-temporal NVDI values to rapidly address changes in land cover and seasonal vegetation trends over time with minimal preprocessing and without the need for expert-based knowledge. We proposed a direct index-based function that can be applied (or mapped, if using GEE jargon) yearly over all the available scenes for a given pixel within an area of interest (AOI). The mapping workflow involves the following operations:
- Filter the harmonised Sentinel-2 collection to a specific AOI.
- Filter the image collection with a predefined date range. In our case, the starting date was set to 1 January 2017 to account for the last 5 natural years of change in agricultural land cover.
- Calculate the maximum yearly NDVI value for a given pixel along the annual maxima of the temporal collection of imagery.
- Apply a specific cut-off threshold to the yearly NDVI maximum values. In this case, a value of 0.4 was selected after a semi-automated evaluation of the local conditions and the desert’s phenology (see Section 2.7).
- Apply a morphological kernel filter to reduce the potential detection of isolated pixels classified as being above the given threshold.
- Return the AgriExp output raster.
2.5. Classified Site Database
Reducer operations in GEE produce pixel-wise computations to count, aggregate and summarise data using region-based statistics over distinct geospatial datasets in a similar way to how zonal statistics are performed in common GIS platforms. The addition of such functionalities in GEE permits minimal data transformation and a more systematic implementation of homogenous data outputs regardless of their format or region or even the table attributes completed by different users.
For each buffered input corresponding to an archaeological site, the algorithm returns a series of variables related to agricultural encroachment (Figure 3). Note that the calculation of distance buffers will work for all types of assets from GEE tables defining locations in the input database. The user might select the appropriate buffer mapping distance depending on the vectors’ typology (e.g., polygons, points or lines).
The result is a table of geolocated buffered sites with new table attributes (that can be exported using common GIS formats; see Section 2.6 below), in which this information is available and can be used to monitor the sites affected by agricultural expansion and the characteristics of these effects in almost-real time. The following seven spatial variables were extracted from the multi-temporal aggregate index:
- Area (in ha) of the buffered feature;
- Binary (yes/no) categorical classification of the impacted buffers; the algorithm recalculates if any of the pixels newly categorised as passing the threshold falls within the buffered feature;
- Endangered surface area (as a percentage, representing the total surface encroached and impacted by agricultural expansion;
- Categorical classification of the percentage of the total impacted surface according to the following endangerment levels: none (0%), low (<25%), moderate (<50%), high (<75%) and extreme impact (>75%) (see also a similar categorical definition in [68]);
- The first year of agricultural impact by buffer encroachment (note that the first year marked the start of our observations, i.e., the first date in the filtered Sentinel-2 image collection, and that, in some instances, pixels classified as “2017” might reflect agricultural trends that have been initiated previously, and the first year date was set by default to 1 January 2017);
- Most recent year (last year) of agricultural encroachment. Note that this takes into account the date, in years, of the last available Sentinel-2 scene within the AOI boundaries included in the GEE. This is an important feature of the algorithm, as the combined Sentinel-2 constellation presents revisiting times of 5–6 days [69] and therefore AgriExp’s outputs are kept updated at every new run with the constant inclusion of new scenes, unless stated otherwise (e.g., by filtering the image collection with a specific end date). In our case, the last computed scene in our Sentinel-2 collection was selected to be 4 November 2022;
- Most abundant year (mode) of agricultural encroachment (total number of buffer pixels impacted by year).
2.6. GIS Integration and Visualisation
The algorithm’s output can be exported in standard raster and vector files for visualisation and further geostatistical treatment on any standard GIS platform, notably QGIS and GRASS, or by means of R’s spatial capabilities. Data treatment and post-processing can provide multiple outputs. For instance, the rasters’ subsettings and zonal statistics can be performed to calculate the extent of yearly agricultural land cover in various AOIs at once. Data merging and evaluation of different buffer zones and yearly output variables can also provide rapid insights into multi-temporal changes affecting one particular location or region (e.g., by plotting density maps or multiple table frequencies of the endangered sites yearly). Whichever the case, the output datasets are designed to provide information that can allow the implementation of almost immediate site protection measures and are also for ready incorporation into local to large-scale heritage inventories or data gazetteers. In that regard, note that the filenames for AgriExp’s outputs are set to keep the date of the last available computed Sentinel-2 scene to facilitate data treatment and comparisons of the results acquired over time.
2.7. Time Series and Validation of the Algorithm
The inclusion of time series in the analysis provided additional information regarding the local and regional intra-annual environmental phenomena. Time series have proven to be of great value for acquiring phenological insights, as well as for describing discrete events of change and residual or noisy pixels in composite images [70]. In our approach, time series charts using MODIS and Sentinel-2 image collections were used (1) to pinpoint the threshold values for the optimal mapping results, and (2) to inspect large-scale seasonal phenology and variability within the affected site buffers as well as within distinct land cover types in the desert.
Crops’ seasonality and variability in South Asian drylands are primarily induced by the intensity of the summer monsoon rainfall, which triggers the monsoonal or kharif agricultural season (June–October). In contrast, occasional winter rainfall and irrigated cash crops determine the winter or rabi agricultural season (October–March) (see [71]). This duality in periodic crop trends is illustrated in Figure 4. It shows the average day-of-year time series of MODIS NDVI values for the period 2017–2022 in three distinct environments and vegetation cycles commonly found within the Cholistan region: (1) traditionally irrigated lands with summer and winter crops; (2) winter crops being recently developed in open mudflats in the desert, locally known as dahars, where many archaeological mounds are found [7]; and (3) desert vegetation on dunes and in interdunal depressions, such as xerophyte shrubs and seasonal plants and grasses.
Index-based time-series were complemented with the visual and radiometric inspections of changes in land cover in individual Sentinel-2 scenes and in high-resolution and the high temporal resolution (HTR) PlanetScope imagery provided by Planet Labs Inc., which provide daily coverage of any Earth location at a 3 m resolution [61]. PlanetScope’s analytic scenes produce orthorectified, 4- to 8-band BGRN imagery with geometric, radiometric and atmospheric corrections [8]. Notably, Planet imagery conveniently provides multi-temporal observations for locations where the online satellite imagery provided by WMS layers or XYZ tiles, such as Google Imagery or Bing Maps, have a limited temporal archive [38]. In our case, all affected buffers were visually photo-interpreted with the PlanetScope scenes acquired during or shortly after the first agricultural cycle that coincided with the encroachment of the site to provide a qualitative assessment and validation of changes in land cover.
3. Results
3.1. The Algorithm’s Performance
In terms of the algorithm’s performance, GEE’s Code Editor allows immediate results and visualization of the yearly aggregate AgriExp output raster. Considering that our classified AOI covered ~33,400 km2, it took ~1 h to export the AgriExp image as an 8-bit classified raster (in .tif format). This configuration is significantly lighter than int16 or 18-bit output, and it has the advantage of reducing the computational time and the image’s size. Note that 8-bit rasters use a value range of 0–255, so therefore, the yearly classified pixel values were transformed into a two-digit format (i.e., 22 instead of 2022, and so on). Concerning the performance of the vectors’ output, it took ~35 min to export the newly classified output table (n = 337 polygons in .shp format), a more than acceptable computing time considering that our buffered polygons are equivalent to ~30 km2 of archaeological mound surfaces and roughly 105,000 Sentinel-2 pixels at 10 m/px.
3.2. Large-Scale Mapping of Vegetation Trends over Time
AgriExp’s classified raster (Figure 5) shows the annual vegetation trends in the study area and allows for a rapid and quantifiable visualisation of changes in land cover. Overall, the pixels classified as having 2017 as the first year are indicative of the traditional irrigated fields in the extensive fertile alluvial plains to the east of the Indus River and its long-term encroachment of the western margins of the Cholistan Desert.
Significantly, Figure 5a shows that a large portion of the inner desert lands located within the southwestern limit of our AOI are classified as having 2022 as the first year after the desert bloom that followed the 2022 summer rainfall in Pakistan (see Section 4). This region encompasses the great dune fields and interdunal depressions characterising the southeastern boundaries of the Cholistan Desert before it merges into the Thar Desert in southeast Pakistan and western India.
Figure 5b shows two main areas within the northeastern desert boundaries that have received the most noticeable agricultural impact in recent years. The first area is located around the historic fort of Maujgarh to the northeast, and the second is concentrated towards the west of the stronghold of Derawar, one of the most iconic desert landmarks [5].
3.3. Endangered Site Buffers
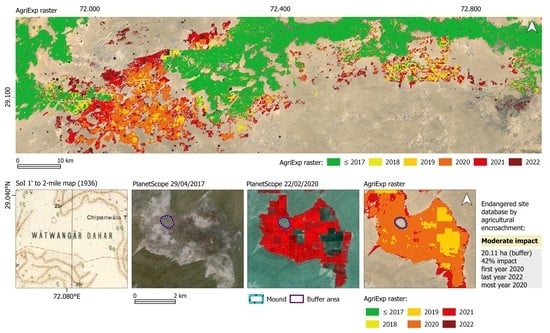
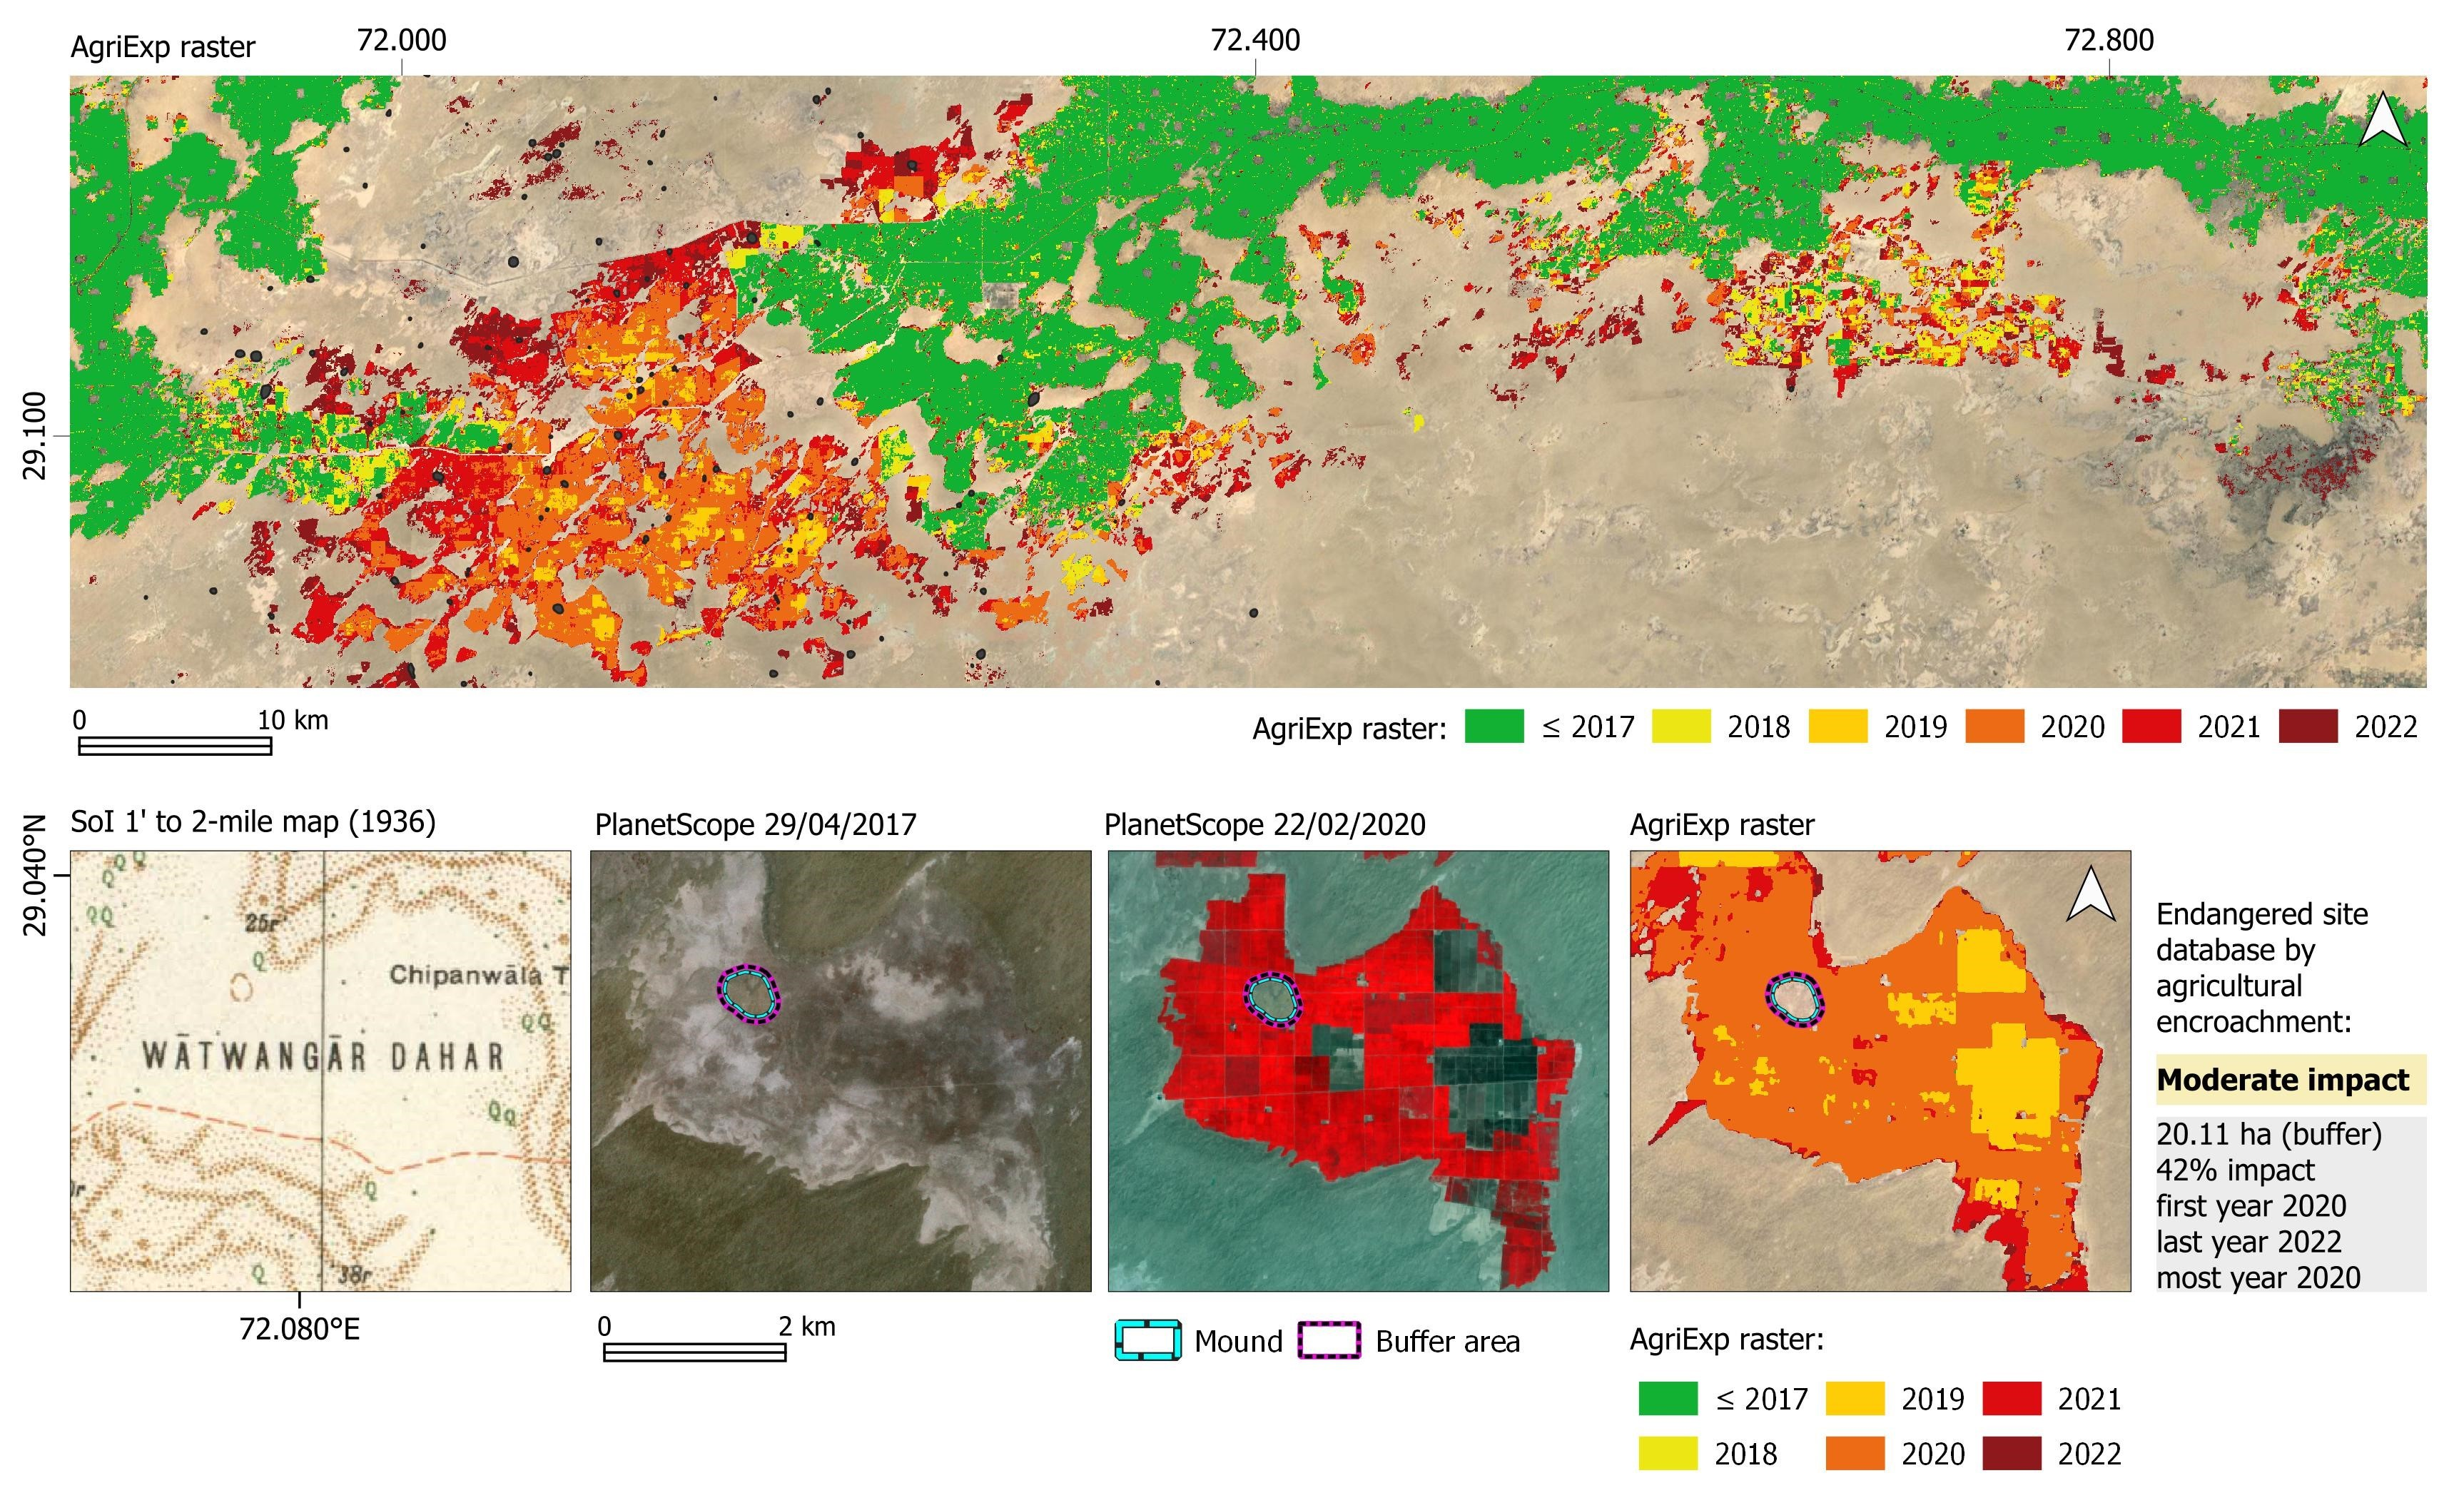
The desert rangelands encompassing the forts of Derawar and Maujgarh are dotted with abundant archaeological mounds dating to the period of the Indus Civilisation (Figure 6). A notable development of the land and transformation of the barren desert lands can be observed to the west of Derawar Fort. The development of irrigation in this area started in 2018 and has continued through to the present (Figure 6a). A more recent and severe trend can be observed in the rangelands near Maujgarh Fort. The region shows an ongoing southeasterly expansion of agricultural activities over the past three years, with particularly widespread land transformation occurring during 2020 (Figure 6b).
The buffer results exported by the algorithm showed that a sizeable number (n = 158) of the mounds in our input database are under threat by agricultural expansion, as indicated by the identification of recent agricultural land development for at least one or more cropping seasons within the buffer area. In many instances, such activities occurred within the visible extent of the mound itself. Figure 7a provides the chronology and rhythm of agricultural expansion. This shows that a large number of the endangered sites (n = 56) had already been affected before 2017, followed by an increasing pattern of agricultural expansion that culminated in 2020 and has recently increased to 31 sites being affected in 2022. These data provide important insights into the speed at which new agricultural expansion is occurring. Figure 7b shows that a large proportion of the affected mounds (n = 73) have had limited impact, primarily affecting the sites’ external boundaries. Even so, this large number of low-impact sites suggests an incipient agricultural encroachment in the years to come. Remarkably, a few sites (n = 20) have been completely occupied, and a further 29 mounds present evidence of more than the 50% of their surface being affected, followed by a similar number of mounds (n = 36) with less than 50% of their surface being affected. Additional table counts are provided in Supplemental Table S1.
4. Discussion
4.1. Evaluation of Crop Seasonality and New Agricultural Trends
Agricultural land use can substantially impact in the preservation of archaeological sites, particularly in areas where summer and winter irrigated agriculture is practised and mechanised mound flattening occurs in tandem [42].
Figure 8 shows an example of the application of the Sentinel-2 time series to inspect local crop cycles within the endangered buffers further. Many site boundaries with low to moderate surface encroachment are being progressively flattened to expand the arable land. The most predominant crop cycle in Cholistan’s recently transformed lands follows a winter pattern, supported by seasonal irrigation (Figure 8a). In 2020, in particular, many dahar mudflat areas in the northern region near Maujgarh were affected by opportunistic agricultural developments following the above-normal 2020 winter rainfall (+133%), with many eastern provinces of Pakistan reporting 2020 to be among the wettest years since 1961 (Figure 8b, see [72]). Opportunistic summer crops might also occur after heavy monsoonal rainfall (Figure 8c), which resembles the more traditional dual crop pattern that characterises the irrigated alluvial plains within the Indus River basin, such as in the fields encroaching the well-known mound of Tibba Kudwala (Figure 8d).
4.2. Effects of the Abnormally Massive Summer Monsoon of 2022
Noticeably, AgriExp’s outputs can be informative regarding unusual land cover trends, such as the ephemeral desert bloom that followed the 2022 summer rainfall in Pakistan. The abnormally massive monsoonal season produced rainfall nearly 10 times higher than the average and resulted in destructive floods across Pakistan, notably in the northwestern regions and in Sindh in the south [73]. In Cholistan, the MODIS NVDI time series show that vegetation’s vigour in August and September was well above the average desert vegetation phenology commonly found in interdunes and on sandy ridges (Figure 9). The inner desert’s ephemeral greenness resulted in a commission error characterised by many index values being above our threshold, which was adjusted to the average desert seasonality. In such instances, the nature of the abnormal greenness might be further elucidated by visual inspection of the intensity and temporality of the event in a time series, where the occasional blooming shows a pattern with a narrow temporal width that significantly differs from the vegetation cycle set at the start of the monsoonal or summer agricultural season.
4.3. Cultural Landscapes and Archaeological Mounds at Risk of Disappearance
Agricultural activities are rapidly transforming the western margins of the Cholistan Desert. Importantly, the observed expansion has been gradually taking over dahar surfaces (Figure 10a), posing a severe risk that could rapidly mutate the long-term socio-ecological dynamics in the region [74,75]. Over millennia, dahar areas have been a source of livelihood for rangeland dwellers and semi-nomadic communities. Clayey to silty dahar soils accumulate moisture after the sparse rainfall that Cholistan receives annually [76] and provide grazing vegetation for farming desert livestock [77]. In addition, ponds have traditionally been dug in dahar soils to harvest freshwater for several months after the erratic summer rains. Although vast patches of salinisation are present in dahar soils, new agricultural developments primarily benefit from their high water retention capabilities and lower elevation profile [78].
The construction of new land infrastructure is another disturbance factor directly associated with agricultural development. The canal branches built in colonial times and largely abandoned in the desert margins are being re-built and re-activated. The canal network is continuously expanding towards the inner desert, and today, a series of new canal sub-branches runs through the dahar and dunes. In many instances, canals have been built across the surfaces of archaeological mounds (Figure 10b). Moreover, systematic levelling and topsoil removal in fossilised dunes have hampered the preservation of the mounds’ surfaces and archaeological deposits that were partially covered and protected by dune sediments.
Land transformation also results in increased accessibility to barren lands due to the construction of new roads and paths leading to new fields and field maintenance infrastructure. While pillage and looting have occurred, they have not yet been a significant issue in Cholistan, but improved accessibility to archaeological locations has the potential to trigger small- to large-scale furtive actions. It is notable that news reports about looting in Sindh spread during the COVID pandemic in 2020–2021 [79], coinciding with the period that saw the widespread impact of agricultural encroachment in Cholistan.
On another note, the algorithm might complement the visual inspection and validation of automated site detection approaches. Figure 11a,b exemplifies two site locations within our study that were virtually devoid of any agricultural activity until very recent times, in clear contrast to the surrounding field crops. A pattern of vegetation and crop emptiness might reflect other land cover types, such as the presence of villages or former canal colonies, locally known as chaks [80], among others. In some instances, however, these areas might be areas of archaeological and historical interest, such as mounds, shrines and ancient cemeteries, which have not been detected previously by ground surveys or the application of automated detection algorithms. Such areas clearly require new ground truth validation.
4.4. Systematic Implementation of Protective Buffer Areas
The classification of endangered sites largely depends on the distance used to delineate the buffering zones. Buffer-zone planning is often at the heart of land use policies associated with site protection, despite some long-standing criticism that has argued for a review of the term “buffer” and its application [81,82]. In most instances, nonetheless, the combined use of buffers and remote-based monitoring provides a useful initial baseline for creating standardised spatial regulations that distinct actors can use, and they have the potential to help mitigate the perennial challenges faced by heritage administrators [83]. In Pakistan, in particular, buffer regulations exist only at a few World Heritage Sites, such as Mohenjo Daro and Taxila [84,85], though they are being developed elsewhere. At Shalamar Fort and Gardens in Lahore, for instance, the redefinition of buffer zones and the regulatory measures used to mitigate encroachment and the urban pressure that followed finally excluded the Shalamar complex from the World Heritage in Danger list [86]. Despite such successes locally, there is still a great need to adopt coordinated policies for the preservation of heritage and archaeological sites in many regions [87,88].
4.5. Adaptation and Reuse of the Algorithm
The fragile archaeological landscapes of Cholistan present many similarities to other endangered cultural landscapes, particularly in arid and semi-arid regions such as Egypt, Syria, Iraq and Iran, which hosted some of the earliest civilisations. Our approach represents a step forward in attempting to standardise satellite-based outputs to systematically and continuously monitor the condition and assess the damage to archaeological and CH locations. Its implementation in cloud-based environments aligns well with the efficient handling of Copernicus Big Earth Data in CH and archaeological studies [89]. Many other potential hazards and risks could be efficiently detected, monitored and avoided if heterogenous and multi-temporal satellite imagery is efficiently and systematically screened [12]. Simultaneously, the increased availability of advanced processing tools, coupled with reproducible processing chains and the available code, can dramatically reduce the computational costs involved in data acquisition and processing, thus leaving more time and resources for data interpretation and enabling a real impact on heritage management practices [1]. In this regard, our approach is in accordance with the growing need for user engagement beyond the academic archaeological community. For example, exploring systematic tools and policies for developing sustainable land use schemes could also make use of up-to-date endangered heritage reports in publicly available national-scale inventories [90].
While it was designed to monitor agricultural encroachment, the algorithm is flexible enough to readily adapt and modify new upcoming versions of AgriExp, which might include the following.
- The combination of one or more spectral indices (e.g., the Enhanced Vegetation Index or Normalised Difference Water Index, to name a few) to explore trends over time for distinct land cover types and hazards, such as seasonal flooding and urban expansion;
- The creation of custom-based and locally adapted multi-temporal seasonal indices, including yearly, monthly or even short spans of weekly filtered collections [91];
- The synergetic application of Copernicus data, including the use of Sentinel-2’s L2A harmonised datasets and the combined use of optical data with Sentinel-1’s radar imagery;
- The application of AgriExp in other long-term image collections included in GEE, such as the Landsat archive, or in combination with global land cover datasets, such as Dynamic World [92];
- The systematic application of the algorithm as a first exploratory step to determine the data selection and training for AgriExp’s adaptation to machine and deep learning approaches to land use and land cover classification;
- Convenient export of the original algorithm to other GEE-support platforms such as Python and other Copernicus-based cloud computing platforms.
5. Conclusions
Here, we have presented an integrated workflow that combines Big Earth Data and basic spatial analysis in Google Earth Engine for the automated detection of CH sites that are potentially endangered by new agricultural developments. Previous approaches to the automated detection of endangered heritage have focused on detecting general changes through detecting land use changes or specific focalised disruptive activities such as looting. Our algorithm focuses on the aggregated change in land cover and agricultural encroachment, which, despite its global occurrence and relevance, has not been approached using automated methods only until now. Further, the focus on one specific type of activity reduces the presence of false positives, as it does not include land use changes that can be related to innocuous activities, but it does provide the means to tackle them and understand their consequences and effects. It has the potential to deliver fast results that can be iterated and updated daily, as it uses the latest available Sentinel-2 scenes for any given location. It can be directly applied to any area and has shown optimal results in drylands.
The algorithm has potential not only for academic use, but also for heritage agencies and practitioners that need to quickly address and monitor long- to short-term threats and hazards to heritage sites. Since the algorithm performs and computes multi-temporal NDVI average bands, there is no need for training data or advanced preprocessing. The only prerequisite is the integration of a vector database that contains the geographic locations, in points or polygons, of the archaeological and heritage sites. Such files have been generated by many individuals and research projects, and also exist in state, province or national-scale heritage inventories.
Ground truth campaigns are still needed to validate the remote patterns and assess particular damage to sites. However, pedestrian or in situ monitoring of damage is not possible, and hundreds of archaeological and historical sites remain unprotected. The integration of this method with time series and high-resolution imagery acquired daily (i.e., on exactly the same day or shortly after any observed pattern) will greatly contribute to the acquisition of reliable data on site damage that otherwise could have a large computational cost. This is also a tool that, if used systematically, can provide crucial information on the most damaged or threatened sites that should be prioritized in future surveys or conservation plans and strategies. The availability of the code ensures that this and other similar methods can be rapidly integrated into cloud computing approaches for new large-scale heritage policies on site conservation.
Supplementary Materials
The following supporting information can be downloaded at https://www.mdpi.com/article/10.3390/rs15010053/s1. (1) Supplementary Table S1. Summary of the spatial counts for Cholistan’s endangered site database (.pdf). (2) Table of AgriExp’s outputs and scripts, including: (a) the GEE environment: script_AgriExp_v1.txt, script_TimeSeries.txt. and (b) the R environment to reproduce categorical counts and plot visualisations: 20221104_T0_4_AgriExp_buffers_dist50.csv and script_AgriExp_R.txt, respectively. The GEE and R scripts can also be found at GitHub: https://github.com/fconesa/AgriExp2022 (accessed on 22 November 2022).
Author Contributions
F.C.C. and H.A.O. designed and conceived the study; F.C.C. and H.A.O. wrote the paper with contributions from A.L. and C.A.P., who have all read and agreed to the submitted version of the manuscript. All authors have read and agreed to the published version of the manuscript.
Funding
F.C.C. is a Beatriu de Pinós Fellow (2020-BP-00203) and, together with H.A.O., he conceived this research as a Juan de la Cierva-Incorporación Fellow (IJC2018-038319-I, Spanish Ministry of Science, Innovation and Universities) as a result of his Marie Sklodowska-Curie Action fellowship held at the University of Cambridge (MarginScapes, no. 794711). C.A.P. coordinates the Arcadia Foundation-funded project Mapping Archaeological Heritage in South Asia (MAHSA, University of Cambridge) and was also the PI on the ERC-funded TwoRains project (no. 648609).
Data Availability Statement
All relevant material has been made available as the Supplementary Materials. Please note that the spatial details of the input database for Cholistan are not disclosed to prevent the expansion of incipient furtive activities in the region. As a result, the GEE script AgriExpt_v1.txt uses a limited subset vector table of well-known sites in the study area (n = 10, see [7]), which allows the user to implement and explore the full capabilities of the algorithm. The R script AgriExpR.txt uses all the vector data outputs (n = 337) without specific site references.
Acknowledgments
Planet imagery was generously provided thanks to a Planet Labs Inc. Research and Education grant licensed to F.C.C. (no. 487380). We also thank the Google Geo for Good community and the Earth Engine developers’ team for their useful suggestions on the original code. We are grateful to Steve Markofsky for his comments on an earlier version of the manuscript.
Conflicts of Interest
The authors declare no conflict of interest.
References
- Opitz, R.; Herrmann, J. Recent Trends and Long-Standing Problems in Archaeological Remote Sensing. J. Comput. Appl. Archaeol. 2018, 1, 19–41. [Google Scholar] [CrossRef] [Green Version]
- Tapete, D. Earth Observation, Remote Sensing, and Geoscientific Ground Investigations for Archaeological and Heritage Research. Geosciences 2019, 9, 161. [Google Scholar] [CrossRef] [Green Version]
- Tapete, D.; Cigna, F. Satellite Technologies for Monitoring Archaeological Sites at Risk. Antichistica 2021, 20, 155–168. [Google Scholar] [CrossRef]
- Gorelick, N.; Hancher, M.; Dixon, M.; Ilyushchenko, S.; Thau, D.; Moore, R. Google Earth Engine: Planetary-Scale Geospatial Analysis for Everyone. Remote Sens. Environ. 2017, 202, 18–27. [Google Scholar] [CrossRef]
- Mughal, M.R. Ancient Cholistan: Archaeology and Architecture; Ferozsons Ltd.: Lahore, Pakistan, 1997. [Google Scholar]
- Petrie, C.; Lynam, F. Revisiting Settlement Contemporaneity and Exploring Stability and Instability: Case Studies from the Indus Civilisation. J. Field Archaeol. 2018, 45, 1–15. [Google Scholar] [CrossRef] [Green Version]
- Orengo, H.A.; Conesa, F.C.; Garcia-Molsosa, A.; Lobo, A.; Green, A.S.; Madella, M.; Petrie, C.A. Automated Detection of Archaeological Mounds Using Machine-Learning Classification of Multisensor and Multitemporal Satellite Data. Proc. Natl. Acad. Sci. USA 2020, 117, 202005583. [Google Scholar] [CrossRef]
- Planet Team. Planet Application Program Interface: In Space for Life on Earth; Planet Team: San Francisco, CA, USA, 2017; Available online: https://api.planet.com (accessed on 21 November 2022).
- Agapiou, A.; Lysandrou, V.; Hadjimitsis, D.G. A European—Scale Investigation of Soil Erosion Threat to Subsurface Archaeological Remains. Remote Sens. 2020, 12, 675. [Google Scholar] [CrossRef] [Green Version]
- Marchetti, N.; Valeri, M.; Zaina, F.; Al-hussainy, A.A. Assessing Endangered Cultural Heritage in Central Iraq. Methods and Perspectives of the QADIS Survey Project. J. Archaeol. Iraq 2018, 64, 11–35. [Google Scholar]
- Liu, J.; Xu, Z.; Chen, F.; Chen, F.; Zhang, L. Flood Hazard Mapping and Assessment on the Angkor World Heritage Site, Cambodia. Remote Sens. 2019, 11, 98. [Google Scholar] [CrossRef] [Green Version]
- Tapete, D.; Cigna, F. Poorly Known 2018 Floods in Bosra UNESCO Site and Sergiopolis in Syria Unveiled from Space Using Sentinel-1/2 and COSMO-SkyMed. Sci. Rep. 2020, 10, 12307. [Google Scholar] [CrossRef]
- Fattore, C.; Abate, N.; Faridani, F.; Masini, N.; Lasaponara, R. Google Earth Engine as Multi-Sensor Open-Source Tool for Supporting the Preservation of Archaeological Areas: The Case Study of Flood and Fire Mapping in Metaponto, Italy. Sensors 2021, 21, 1791. [Google Scholar] [CrossRef] [PubMed]
- Andreou, G.M.; Nikolaus, J.; Westley, K.; el Safadi, C.; Blue, L.; Smith, A.; Breen, C. Big Data in Maritime Archaeology: Challenges and Prospects from the Middle East and North Africa. J. Field Archaeol. 2022, 47, 131–148. [Google Scholar] [CrossRef]
- Tapete, D.; Fanti, R.; Cecchi, R.; Petrangeli, P.; Casagli, N. Satellite Radar Interferometry for Monitoring and Early-Stage Warning of Structural Instability in Archaeological Sites. J. Geophys. Eng. 2012, 9, S10–S25. [Google Scholar] [CrossRef]
- Nicu, I.C. Tracking Natural and Anthropic Risks from Historical Maps as a Tool for Cultural Heritage Assessment: A Case Study. Environ. Earth Sci. 2017, 76, 330. [Google Scholar] [CrossRef]
- Lombardo, L.; Tanyas, H.; Nicu, I.C. Spatial Modeling of Multi-Hazard Threat to Cultural Heritage Sites. Eng. Geol. 2020, 277, 105776. [Google Scholar] [CrossRef]
- Pastonchi, L.; Barra, A.; Monserrat, O.; Luzi, G.; Solari, L.; Tofani, V. Satellite Data to Improve the Knowledge of Geohazards in World Heritage Sites. Remote Sens. 2018, 10, 992. [Google Scholar] [CrossRef] [Green Version]
- Agapiou, A.; Lysandrou, V.; Hadjimitsis, D.G. Earth Observation Contribution to Cultural Heritage Disaster Risk Management: Case Study of Eastern Mediterranean Open Air Archaeological Monuments and Sites. Remote Sens. 2020, 12, 1330. [Google Scholar] [CrossRef] [Green Version]
- Marchetti, N.; Curci, A.; Gatto, M.C.; Nicolini, S.; Mühl, S.; Zaina, F. A Multi-Scalar Approach for Assessing the Impact of Dams on the Cultural Heritage in the Middle East and North Africa. J. Cult. Herit. 2019, 37, 17–28. [Google Scholar] [CrossRef]
- Zaina, F.; Tapete, D. Satellite-Based Methodology for Purposes of Rescue Archaeology of Cultural Heritage Threatened by Dam Construction. Remote Sens. 2022, 14, 1009. [Google Scholar] [CrossRef]
- Rayne, L.; Bradbury, J.; Mattingly, D.; Philip, G.; Bewley, R.; Wilson, A. From above and on the Ground: Geospatial Methods for Recording Endangered Archaeology in the Middle East and North Africa. Geosciences 2017, 7, 100. [Google Scholar] [CrossRef] [Green Version]
- Zerbini, A. Developing a Heritage Database for the Middle East and North Africa. J. Field Archaeol. 2018, 43, S9–S18. [Google Scholar] [CrossRef]
- Flohr, P.; Bradbury, J.; ten Harkel, L. Tracing the Patterns: Fields, Villages, and Burial Places in Lebanon. Levant 2021, 53, 315–335. [Google Scholar] [CrossRef]
- Tapete, D.; Cigna, F. Detection of Archaeological Looting from Space: Methods, Achievements and Challenges. Remote Sens. 2019, 11, 2389. [Google Scholar] [CrossRef] [Green Version]
- Contreras, D.A.; Brodie, N. The Utility of Publicly-Available Satellite Imagery for Investigating Looting of Archaeological Sites in Jordan. J. Field Archaeol. 2010, 35, 101–114. [Google Scholar] [CrossRef]
- Lasaponara, R.; Masini, N. Facing the Archaeological Looting in Peru by Using Very High Resolution Satellite Imagery and Local Spatial Autocorrelation Statistics. Lect. Notes Comput. Sci. 2010, 6016, 254–261. [Google Scholar] [CrossRef]
- Casana, J.; Panahipour, M. Notes on a Disappearing Past Satellite-Based Monitoring of Looting and Damage to Archaeological Sites in Syria. J. East. Mediterr. Archaeol. Herit. Stud. 2014, 2, 128–151. [Google Scholar] [CrossRef]
- Tapete, D.; Cigna, F.; Donoghue, D.N.M. ‘Looting Marks’ in Space-Borne SAR Imagery: Measuring Rates of Archaeological Looting in Apamea (Syria) with TerraSAR-X Staring Spotlight. Remote Sens. Environ. 2016, 178, 42–58. [Google Scholar] [CrossRef] [Green Version]
- Caspari, G. Assessing Looting from Space: The Destruction of Early Iron Age Burials in Northern Xinjiang. Heritage 2018, 1, 320–327. [Google Scholar] [CrossRef] [Green Version]
- Agapiou, A.; Lysandrou, V.; Hadjimitsis, D. Optical Remote Sensing Potentials for Looting Detection. Geosciences 2017, 7, 98. [Google Scholar] [CrossRef] [Green Version]
- Masini, N.; Lasaponara, R. Remote and Close Range Sensing for the Automatic Identification and Characterization of Archaeological Looting. The Case of Peru. J. Comput. Appl. Archaeol. 2021, 4, 126–144. [Google Scholar] [CrossRef]
- Laugier, E.J.; Abdullatif, N.; Glatz, C. Embedding the Remote Sensing Monitoring of Archaeological Site Damage at the Local Level: Results from the “Archaeological Practice and Heritage Protection in the Kurdistan Region of Iraq” Project. PLoS ONE 2022, 17, e0269796. [Google Scholar] [CrossRef] [PubMed]
- Rayne, L.; Sheldrick, N.; Nikolaus, J. Endangered Archaeology in Libya: Tracking damage and destruction. Libyan Stud. 2017, 48, 23–49. [Google Scholar] [CrossRef] [Green Version]
- Hanson, W.S.; Oltean, I.A. Archaeology from Historical Aerial and Satellite Archives; Hanson, W.S., Oltean, I.A., Eds.; SPIE: New York, NY, USA, 2013; ISBN 9781461445050. [Google Scholar]
- Pappu, S.; Akhilesh, K.; Ravindranath, S.; Raj, U. Applications of Satellite Remote Sensing for Research and Heritage Management in Indian Prehistory. J. Archaeol. Sci. 2010, 37, 2316–2331. [Google Scholar] [CrossRef]
- Conesa, F.C.; Devanthéry, N.; Balbo, A.L.; Madella, M.; Montserrat, O. Use of Satellite SAR for Understanding Long-Term Human Occupation Dynamics in the Monsoonal Semi-Arid Plains of North Gujarat, India. Remote Sens. 2014, 6, 11420–11443. [Google Scholar] [CrossRef] [Green Version]
- Rayne, L.; Gatto, M.C.; Abdulaati, L.; Al-Haddad, M.; Sterry, M.; Sheldrick, N.; Mattingly, D. Detecting Change at Archaeological Sites in North Africa Using Open-Source Satellite Imagery. Remote Sens. 2020, 12, 3694. [Google Scholar] [CrossRef]
- Agapiou, A. Optimal Spatial Resolution for the Detection and Discrimination of Archaeological Proxies in Areas with Spectral Heterogeneity. Remote Sens. 2020, 12, 136. [Google Scholar] [CrossRef] [Green Version]
- Agapiou, A. Vegetation Extraction Using Visible-Bands from Openly Licensed Unmanned Aerial Vehicle Imagery. Drones 2020, 4, 27. [Google Scholar] [CrossRef]
- Galiatsatos, N. Assessment of the CORONA Series of Satellite Imagery for Landscape Archaeology. Ph.D. Thesis, University of Durham, Durham, UK, 2004. [Google Scholar]
- Conesa, F.C.; Madella, M.; Galiatsatos, N.; Balbo, A.L.; Rajesh, S.V.; Ajithprasad, P.; Rajesh, S.V.; Ajithprasad, P.; Rajesh, S.V.; Ajithprasad, P.; et al. CORONA Photographs in Monsoonal Semi-Arid Environments: Addressing Archaeological Surveys and Historic Landscape Dynamics over North Gujarat, India. Archaeol. Prospect. 2015, 22, 75–90. [Google Scholar] [CrossRef]
- Plekhov, D.; Levine, E.I. Assessing the Effects of Severe Weather Events through Remote Sensing on Samothrace, Greece: Applications for the Management of Cultural Resources. J. Archaeol. Sci. Rep. 2018, 21, 810–820. [Google Scholar] [CrossRef]
- Rayne, L.; Donoghue, D. A Remote Sensing Approach for Mapping the Development of Ancient Water Management in the near East. Remote Sens. 2018, 10, 2042. [Google Scholar] [CrossRef] [Green Version]
- Tapete, D.; Traviglia, A.; Delpozzo, E.; Cigna, F. Regional-Scale Systematic Mapping of Archaeological Mounds and Detection of Looting Using COSMO-SkyMed High Resolution DEM and Satellite Imagery. Remose Sens. 2021, 13, 3106. [Google Scholar] [CrossRef]
- Orengo, H.A.; Krahtopoulou, A.; Garcia-Molsosa, A.; Palaiochoritis, K.; Stamati, A. Photogrammetric Re-Discovery of the Hidden Long-Term Landscapes of Western Thessaly, Central Greece. J. Archaeol. Sci. 2015, 64, 100–109. [Google Scholar] [CrossRef]
- Hammer, E.; FitzPatrick, M.; Ur, J. Succeeding CORONA: Declassified HEXAGON Intelligence Imagery for Archaeological and Historical Research. Antiquity 2022, 96, 679–695. [Google Scholar] [CrossRef]
- Orengo, H.A.; Petrie, C.A. Large-Scale, Multi-Temporal Remote Sensing of Palaeo-River Networks: A Case Study from Northwest India and Its Implications for the Indus Civilisation. Remote Sens. 2017, 9, 735. [Google Scholar] [CrossRef] [Green Version]
- Agapiou, A. UNESCO World Heritage Properties in Changing and Dynamic Environments: Change Detection Methods Using Optical and Radar Satellite Data. Herit. Sci. 2021, 9, 64. [Google Scholar] [CrossRef]
- Liss, B.; Howland, M.D.; Levy, T.E. Testing Google Earth Engine for the Automatic Identification and Vectorization of Archaeological Features: A Case Study from Faynan, Jordan. J. Archaeol. Sci. Rep. 2017, 15, 299–304. [Google Scholar] [CrossRef] [Green Version]
- Agapiou, A. Remote Sensing Heritage in a Petabyte-Scale: Satellite Data and Heritage Earth Engine© Applications. Int. J. Digit. Earth 2017, 10, 85–102. [Google Scholar] [CrossRef] [Green Version]
- Garcia, A.; Orengo, H.A.; Conesa, F.C.; Green, A.S.; Petrie, C.A. Remote Sensing and Historical Morphodynamics of Alluvial Plains. The 1909 Indus Flood and the City of Dera Gazhi Khan (Province of Punjab, Pakistan). Geosciences 2019, 9, 21. [Google Scholar] [CrossRef] [Green Version]
- Agapiou, A. Multi-Temporal Change Detection Analysis of Vertical Sprawl over Limassol City Centre and Amathus Archaeological Site in Cyprus during 2015–2020 Using the Sentinel-1 Sensor and the Google Earth Engine Platform. Sensors 2021, 21, 1884. [Google Scholar] [CrossRef]
- Martin, O.; Piatti, G. (Eds.) 2009 World Heritage and Buffer Zones; UNESCO World Heritage Centre: Paris, France, 2009. [Google Scholar]
- Kono, T. The Significance of the Buffer Zone under the World Heritage Convention. Art Antiq. Law 2000, 5, 177–186. [Google Scholar]
- Chyla, J.M. How Can Remote Sensing Help in Detecting the Threats to Archaeological Sites in Upper Egypt? Geosciences 2017, 7, 97. [Google Scholar] [CrossRef] [Green Version]
- Jazeb Ajmal, M. Current Status of Management and Protection of Rani Ghat Buddhist Complex, Pakistan. Front. Archaeol. 2017, 10–14, 371–390. [Google Scholar]
- Mughal, M.R. Legislations for the Protection and Management of Archaeological Heritage of Pakistan; Department of Archaeology and Museums, Governtment of Pakistan: Karachi, Pakistan, 1995.
- Coningham, R.; Lewer, N. (Eds.) Archaoelogy, Cultural Heritage Protection and Comunity Engagement in South Asia; Durjam University: Durham, UK, 2019. [Google Scholar]
- Gupta, E.; Das, S.; Suganya, K.; Balan, C.; Kumar, V.; Rajani, M.B.; Balan, K.S.C.; Kumar, V.; Rajani, M.B. The Need for a National Archaeological Database. Curr. Sci. 2017, 113, 1961–1973. [Google Scholar] [CrossRef]
- Rajangam, K.; Rajani, M.B. Applications of Geospatial Technology in the Management of Cultural Heritage Sites—Potentials and Challenges for the Indian Region. Curr. Sci. 2017, 113, 1948–1960. [Google Scholar] [CrossRef]
- Lawrence, D.; Altaweel, M.; Philip, G. (Eds.) New Agendas in Remote Sensing and Landscape Archaeology in the Near East. Studies in Honour of Tony J. Wilkinson; Archaeopress Archaeology: Oxford, UK, 2020. [Google Scholar]
- ESA Deployment of Sentinel-2 Processing Baseline 04.00 and Provision of New Sample Products. Available online: https://sentinels.copernicus.eu/web/sentinel/-/deployment-of-sentinel-2-processing-baseline-04.00/1.6 (accessed on 15 September 2022).
- Segarra, J.; Buchaillot, M.L.; Araus, J.L.; Kefauver, S.C. Remote Sensing for Precision Agriculture: Sentinel-2 Improved Features and Applications. Agronomy 2020, 10, 641. [Google Scholar] [CrossRef]
- Huang, S.; Tang, L.; Hupy, J.P.; Wang, Y.; Shao, G. A Commentary Review on the Use of Normalized Difference Vegetation Index (NDVI) in the Era of Popular Remote Sensing. J. For. Res. 2021, 32, 1–6. [Google Scholar] [CrossRef]
- Caiserman, A.; Dumas, D.; Bennafla, K.; Faour, G.; Amiraslani, F. Application of Remotely Sensed Imagery Andsocioeconomic Surveys to Map Crop Choices in the Bekaa Valley (Lebanon). Agriculture 2019, 9, 57. [Google Scholar] [CrossRef] [Green Version]
- Caspari, G.; Betts, A.; Jia, P. The Bronze Age in the Western Tianshan, China: A New Model for Determining Seasonal Use of Sites. J. Archaeol. Sci. Rep. 2017, 14, 12–20. [Google Scholar] [CrossRef]
- Hammer, E.; Seifried, R.; Franklin, K.; Lauricella, A. Remote Assessments of the Archaeological Heritage Situation in Afghanistan. J. Cult. Herit. 2018, 33, 125–144. [Google Scholar] [CrossRef] [Green Version]
- Guo, H. Big Earth Data: A New Frontier in Earth and Information Sciences. Big Earth Data 2017, 1, 4–20. [Google Scholar] [CrossRef] [Green Version]
- Gómez, C.; White, J.C.; Wulder, M.A. Optical Remotely Sensed Time Series Data for Land Cover Classification: A Review. ISPRS J. Photogramm. Remote Sens. 2016, 116, 55–72. [Google Scholar] [CrossRef] [Green Version]
- Petrie, C.A.; Bates, J. ‘Multi-Cropping’, Intercropping and Adaptation to Variable Environments in Indus South Asia. J. World Prehist. 2017, 30, 81–130. [Google Scholar] [CrossRef] [PubMed]
- Department of Meteorology. State of Pakistan’s Climate in 2020; Department of Meteorology: Karachi, Pakistan, 2020. [Google Scholar]
- COPERNICUS Emergency Management Service. EMSR629: Floods in Pakistan. Available online: https://emergency.copernicus.eu/mapping/list-of-components/EMSR629 (accessed on 15 September 2022).
- Malik, S.; Rahman, F.; Ali, A. Sustainability of Subsistence Livelihoods of Agro-Pastoralists in Changing Socioeconomic Environment of Cholistan Desert-Pakistan. Pakistan J. Commer. Soc. Sci. 2017, 11, 1100–1133. [Google Scholar]
- Soharwardi, M.; Ali, K.; Arshad, M. Migration of Cholistani People from Desert Areas toward Irrigated Areas: Causes and Consequence (A Case Study of Cholistan, Pakistan). Int. J. Soc. Sci. Educ. 2011, 1, 262–271. [Google Scholar]
- Akhter, R.; Arshad, M. Arid Rangelands in the Cholistan Desert (Pakistan). Sécheresse 2006, 17, 210–217. [Google Scholar]
- Arshad, M.; Rao, A.; Akbar, G. Masters of Disaster in Cholistan Desert, Pakistan: Pattern of Nomadic Migration. Desertif. Control Bull. 1999, 35, 33–38. [Google Scholar]
- Mughal, M.R. The Harappan Nomads of Cholistan. In Living Traditions. Studies in the Ethnoarchaeology of South Asia; Allchin, B., Ed.; Oxford & IBH Publishing: New Delhi, India, 1994; pp. 53–68. [Google Scholar]
- Haq, I. Illegal Excavation Goes Unchecked at ‘Ancient Site’. Dawn. 17 February 2021. Available online: https://www.dawn.com/news/1607781 (accessed on 15 September 2022).
- Agnihotri, I. Ecology, Land Use and Colonisation: The Canal Colonies of Punjab. Indian Econ. Soc. Hist. Rev. 1996, 33, 37–58. [Google Scholar] [CrossRef]
- Gillespie, J. Buffering for Conservation at Angkor: Questioning the Spatial Regulation of a World Heritage Property. Int. J. Herit. Stud. 2012, 18, 194–208. [Google Scholar] [CrossRef]
- Foster, S.; Linge, L. World Heritage Site Buffer Zones: Statements of Fact or Aspiration? Conserv. Manag. Archaeol. Sites 2002, 5, 141–150. [Google Scholar] [CrossRef]
- Edwards, B.; Frasch, T.; Jeyacheya, J. Evaluating the Effectiveness of Land-Use Zoning for the Protection of Built Heritage in the Bagan Archaeological Zone, Myanmar—A Satellite Remote-Sensing Approach. Land Use Policy 2019, 88, 104174. [Google Scholar] [CrossRef]
- Mughal, M.R. Heritage Preservation in Pakistan. From National and International Perspectives. In State Vandalism of History in Pakistan; Zaman, M., Ed.; Vanguard Books: Lahore, Pakistan, 2011; pp. 104–127. [Google Scholar]
- Somuncu, M.; Khan, A. Current Status of Management and Protection of Taxila World Heritage Site, Pakistan. Ankara Üniv. Çevrebilimleri Derg. 2010, 2, 45–60. [Google Scholar] [CrossRef] [Green Version]
- Sayn-Wittgenstein, A.; Shams, S. Report on the Joint UNESCO-ICOMOS Reactive Monitoring Mission to Fort and Shalamar Gardens in Lahore (Pakistan); UNESCO: Paris, France, 2012. [Google Scholar]
- Glekas, E.; Ibrahim, K. Heritage and Urban Development in Pakistan. In Place Meaning and Attachment; Routledge: London, UK, 2020. [Google Scholar]
- Khan, N.A.; Nuti, C.; Monti, G.; Micheli, M. Critical Review of Pakistani Current Legislation on Sustainable Protection of Cultural Heritage. Sustainability 2022, 14, 3633. [Google Scholar] [CrossRef]
- Lasaponara, R.; Fattore, C.; Abate, N.; Masini, N. On the Use of Big Earth Data in the Copernicus Era for the Investigation and the Preservation of the Human Past. New Metrop. Perspect. 2022, 482, 2122–2131. [Google Scholar]
- Green, A.S. An Interdisciplinary Framework for Using Archaeology, History and Collective Action to Enhance India’s Agricultural Resilience and Sustainability. Environ. Res. Lett. 2019, 15, 105021. [Google Scholar] [CrossRef]
- Potapov, P.; Turubanova, S.; Hansen, M.C.; Tyukavina, A.; Zalles, V.; Khan, A.; Song, X.P.; Pickens, A.; Shen, Q.; Cortez, J. Global Maps of Cropland Extent and Change Show Accelerated Cropland Expansion in the Twenty-First Century. Nat. Food 2022, 3, 19–28. [Google Scholar] [CrossRef]
- Brown, C.F.; Brumby, S.P.; Guzder-Williams, B.; Birch, T.; Hyde, S.B.; Mazzariello, J.; Czerwinski, W.; Pasquarella, V.J.; Haertel, R.; Ilyushchenko, S.; et al. Dynamic World, Near Real-Time Global 10 m Land Use Land Cover Mapping. Sci. Data 2022, 9, 251. [Google Scholar] [CrossRef]
Figure 1.
Map location of the Cholistan Desert in eastern Pakistan, showing the extent of the archaeological mounds (after [7]). Base map: Google Imagery.
Figure 1.
Map location of the Cholistan Desert in eastern Pakistan, showing the extent of the archaeological mounds (after [7]). Base map: Google Imagery.

Figure 2.
AgriExp’s workflow scheme.

Figure 3.
Example of the categorical classification of endangered buffered areas with the newly listed levels: (1) low impact, (2) moderate impact, (3) high impact and (4) extreme impact. For each site, the algorithm also outputs a list of spatial variables: the buffer area (ha), the percentage of area with encroachment, and the first, last and most abundant yearly occurrences of agricultural encroachment within the site’s buffer. Base map: Google Imagery.

Figure 4.
Average MODIS NDVI trends across the year in three distinct environments within the Cholistan region: light green line: irrigated lands with summer and winter crops; yellow line: winter irrigation in dahar desert mudflats; dark green line: seasonal desert vegetation in desert dunes and interdune areas. The GEE code used to reproduce the time series is provided in the Supplemental Material.

Figure 5.
(a) AgriExp’s raster output for the AOI; (b) inset showing the main regions of recent agricultural development in the Cholistan Desert: the northern area of Maujgarh Fort and west of Derawar Fort.
Figure 5.
(a) AgriExp’s raster output for the AOI; (b) inset showing the main regions of recent agricultural development in the Cholistan Desert: the northern area of Maujgarh Fort and west of Derawar Fort.

Figure 6.
Critically endangered regions since 2018 onwards: (a) the lands west of Derawar Fort, and (b) the rangelands near Maujgarh Fort. The image shows three distinct AgriExp-classified outputs exported to common GIS platforms: (1) AgriExp raster with the first year of agricultural impact; (2) the classified table showing the first year of impact; and (3) categorical levels of endangered mound surfaces.

Figure 7.
(a) Bar chart showing the first year of encroachment of endangered sites; (b) lollipop chart showing endangered sites, classified by the total percentage of the affected surface area.
Figure 7.
(a) Bar chart showing the first year of encroachment of endangered sites; (b) lollipop chart showing endangered sites, classified by the total percentage of the affected surface area.

Figure 8.
Sentinel-2’s average maximum index values showing different crop cycles and the pace at which agriculture is advancing towards desert rangelands. (a,b) The occurrence of recent winter crops in dahar mudflat areas; (c,d) the occurrence of summer and winter crops in dahar areas and in the fields encircling the archaeological mound of Tibba Kudwala, respectively. Base map: Google Imagery and Bing Maps.

Figure 9.
Yearly average MODIS NDVI trends (2017–2022) in three environments within the Cholistan region. Note the peak in seasonal vegetation following the 2022 ephemeral desert bloom.
Figure 9.
Yearly average MODIS NDVI trends (2017–2022) in three environments within the Cholistan region. Note the peak in seasonal vegetation following the 2022 ephemeral desert bloom.

Figure 10.
(a) Recent agricultural expansion into desert mudflats or dahars (2019–2020) has encroached the outer boundaries of many archaeological mounds. In this example, the mound of Bathmengareh is moderately endangered by agricultural activity that started back during the 2020 winter crop season. (b) Example of the re-activation of historical canals and encroachment by new canals at Sanuwala (old Wasuwali) site, partially covered by a dune.

Figure 11.
(a,b) Newly detected potential mound surfaces in areas with long-term agricultural activities. Note that the surface of mound (b) has been encroached and severely impacted throughout 2022.
Figure 11.
(a,b) Newly detected potential mound surfaces in areas with long-term agricultural activities. Note that the surface of mound (b) has been encroached and severely impacted throughout 2022.


Table 1.
Main buffer zones and protected areas for the conservation of archaeological and cultural heritage sites in South Asia (after [60]).
Table 1.
Main buffer zones and protected areas for the conservation of archaeological and cultural heritage sites in South Asia (after [60]).
| Buffer Area | Distance | Protection Status |
|---|---|---|
| Protected area | Visible site/monument boundaries | No development and complete conservation |
| Prohibited area | 100 m | Development under strict adherence to heritage by-laws |
| Regulated area | 200 m | Slightly relaxed heritage by-laws |
Disclaimer/Publisher’s Note: The statements, opinions and data contained in all publications are solely those of the individual author(s) and contributor(s) and not of MDPI and/or the editor(s). MDPI and/or the editor(s) disclaim responsibility for any injury to people or property resulting from any ideas, methods, instructions or products referred to in the content. |
© 2022 by the authors. Licensee MDPI, Basel, Switzerland. This article is an open access article distributed under the terms and conditions of the Creative Commons Attribution (CC BY) license (https://creativecommons.org/licenses/by/4.0/).
Share and Cite
MDPI and ACS Style
Conesa, F.C.; Orengo, H.A.; Lobo, A.; Petrie, C.A. An Algorithm to Detect Endangered Cultural Heritage by Agricultural Expansion in Drylands at a Global Scale. Remote Sens. 2023, 15, 53. https://doi.org/10.3390/rs15010053
AMA Style
Conesa FC, Orengo HA, Lobo A, Petrie CA. An Algorithm to Detect Endangered Cultural Heritage by Agricultural Expansion in Drylands at a Global Scale. Remote Sensing. 2023; 15(1):53. https://doi.org/10.3390/rs15010053
Chicago/Turabian StyleConesa, Francesc C., Hector A. Orengo, Agustín Lobo, and Cameron A. Petrie. 2023. "An Algorithm to Detect Endangered Cultural Heritage by Agricultural Expansion in Drylands at a Global Scale" Remote Sensing 15, no. 1: 53. https://doi.org/10.3390/rs15010053
Note that from the first issue of 2016, this journal uses article numbers instead of page numbers. See further details here.