Article

Research on Glacier Elevation Variability in the Qilian Mountains of the Qinghai-Tibet Plateau Based on Topographic Correction by Pyramid Registration

1
School of Smart City, Chongqing Jiaotong University, Chongqing 400074, China
2
Land Satellite Remote Sensing Application Center, Ministry of Natural Resources, Beijing 100048, China
3
College of Geodesy and Geomatics, Shandong University of Science and Technology, Qingdao 266590, China
*
Author to whom correspondence should be addressed.
Remote Sens. 2023, 15(1), 62; https://doi.org/10.3390/rs15010062
Submission received: 24 October 2022 / Revised: 30 November 2022 / Accepted: 17 December 2022 / Published: 22 December 2022
(This article belongs to the Special Issue Remote Sensing of Environmental Changes in Cold Regions Ⅱ)

Abstract

:
As the ‘Third Pole’ of the world, the Qinghai-Tibet Plateau is also known as the Asian Water Tower. The glaciers covering its surface can reflect changes in the global climate and ecological environment. Therefore, the critical need for accurate information regarding the elevation changes of the glaciers on the Qinghai-Tibet Plateau is self-evident. Here we present a method for monitoring the elevation change of the glaciers on the Qinghai-Tibet Plateau that is based on pyramid registration and terrain correction techniques. The registration results show that the average elevation difference in the stable area has been improved to a considerable extent, at least 70%. The elevation difference after registration obeys a Gaussian distribution with a mean of 0. In this study, glaciers in the Qilian Mountains of the Qinghai-Tibet Plateau were used as the experimental objects, and the changes in glacier elevation in the region were monitored over the past three years. The results show that from 2019 to 2021, the glaciers in the western Qilian Mountains thinned significantly, and the glacier elevation change rate was −0.99 ± 0.34 m/year. The changes in glaciers in the southwest and north were relatively minor, with change rates of 0.09 ± 0.94 m/year and −0.08 ± 0.79 m/year, respectively. The change rates of the two glaciers in the middle were 0.74 ± 0.84 m/year and −0.16 ± 0.85 m/year, and the glacier change rate in the northeast was −0.27 ± 0.77 m/year. Finally, combined with meteorological data analysis, it is concluded that the change in glacier elevation is primarily affected by temperature and precipitation. Among these, precipitation accounts for the dominant factor impacting glacier elevation change.

1. Introduction

Glaciers are both an important part of the cryosphere and excellent indicators of climate change [1]. Glaciers are highly reflective of solar radiation. Thus, they have a substantial impact on atmospheric circulation, ocean circulation, the hydrologic cycle, and sea level changes [2]. With the rate of climate change intensifying, global glaciers have undergone considerable changes over the past few decades [3], which has caused a series of serious environmental problems, such as sea level rise and a loss of freshwater resources. These issues have attracted widespread attention [4]. Mountain glaciers are glaciers that exist outside the polar regions. They are located in high mountain areas at middle and low latitudes and have a substantial impact on the inland and even the global ecological environment [5]. Ice loss from these glaciers contributes more to sea level rise than makes ice loss from Greenland and the Antarctic Ice Sheets, and in terms of sea level rise, it is second only to ocean thermal expansion [5]. As an example of mountain glaciers, the Qinghai-Tibet Plateau, known as the “Asian Water Tower”, has a strong impact on people’s productivity and life. The Qilian Mountains are located on the northeastern edge of the Qinghai-Tibet Plateau and are considered subcontinental glaciers. These glaciers are fairly scattered throughout the region, which makes monitoring difficult. Despite being the most important glacier type in China, few people have studied their elevation changes in recent years due to this wide spatial distribution [6,7].
At present, many scholars who have researched the glaciers on the Qinghai-Tibet Plateau have focused on the changes that occur on a yearly scale. However, it is necessary to explore monthly or seasonal glacier elevation changes. The seasonal changes can only be inferred by studying the relationship between the glacier and the precipitation and temperature [8]. For example, some scholars use a clustering algorithm based on monthly precipitation data to calculate the monthly change in glacier elevation instead of using direct observations of monthly elevation [9]. Additionally, studying the monthly/seasonal changes in glaciers is critical for providing an in-depth understanding of the mechanisms that drive glacial variability as well as for identifying disaster warning signs [10]. At present, few existing studies have analyzed the changes in glacier elevation on monthly and seasonal scales for a specific glacier [11].
Topographic factors, such as slope, aspect, and elevation, also have an impact on glacier elevation changes [12]. In general, the lower the altitude becomes, the greater the loss of glacier mass. Existing studies have shown that precipitation and monsoons also affect glacier accumulation. Among them, the former is the main factor [13]. For example, due to the influence of climatic variables, glaciers with different slopes and aspects thin at different rates [14]. Therefore, it is important to consider the effects of the topography when monitoring changes in glacier elevation. Previous studies have rarely considered topographical effects when calculating glacier elevation changes. Furthermore, when using multiple datasets to jointly study glacier elevation changes, some studies use the datasets as they are without accounting for the bias between them [15,16,17]. This can lead to erroneous estimates of changes in glacier elevation.
There are multiple commonly used data sources and techniques for monitoring glacier elevation changes. High-precision differential GPS has been gradually applied to the monitoring of glacier changes due to the continuous improvement of its accuracy [18]. However, it is very difficult to conduct these field observations on a large scale. Optical satellite stereo pair data, such as from ZY-3, ASTER, and SPOT5, etc., provide large spatial coverages and is a common method for monitoring glacier elevation changes [19]. Still, some of this data must be purchased, and the accuracy of elevation measurements are low. DEM data, such as from SRTM, ALOS DEM, and GDEM, is also useful. Still, when using DEM data alone, the uncertainty in both the vertical and horizontal directions is large, which will reduce the overall accuracy [20,21]. SAR satellite data and laser altimetry satellite data, such as Sentinel-1, CryoSat-2, ICESat-1, and ICESat-2, have been widely used for the monitoring of glacier elevation changes over the last 20 years due to their high accuracy and advanced technology [22,23,24]. These data types are generally used in combination to monitor glacier elevation changes [25]. From these data sources, the following common methods for studying changes in glacier elevation have been derived: The multitemporal DEM difference method is one of the most commonly used methods for the study of glacier thickness changes [26,27]; Linear regression, using least squares fitting to obtain the annual glacier thickness change rate [28]; The application of orbital algorithms for ICESat-1 and ICESat-2 data, such as the cross orbit method, repeated orbit method and plane fitting method. However, this type of orbit algorithm is only suitable for monitoring the change of glacier elevation at the poles. It is no longer applicable in the middle and low latitudes due to the sparse distribution of laser points [29].
The ALOS DEM has higher accuracy and resolution than the SRTM DEM and can provide the flexibility to select data from between 2006 and 2011 for research. Based on the ALOS DEM data and the ICESat-2 ATLAS data, the space-borne laser altimetry data that has the highest measurement accuracy, this study uses the pyramid registration terrain correction method to register surface and point data and applies this method to some typical glaciers in the Qilian Mountains on the northeastern margin of the Qinghai-Tibet Plateau for experimental analysis. Glacier elevation changes were monitored annually and quarterly/monthly between 2019 and 2021, and the results were compared with climate data for additional analysis.

2. Study Area and Datasets
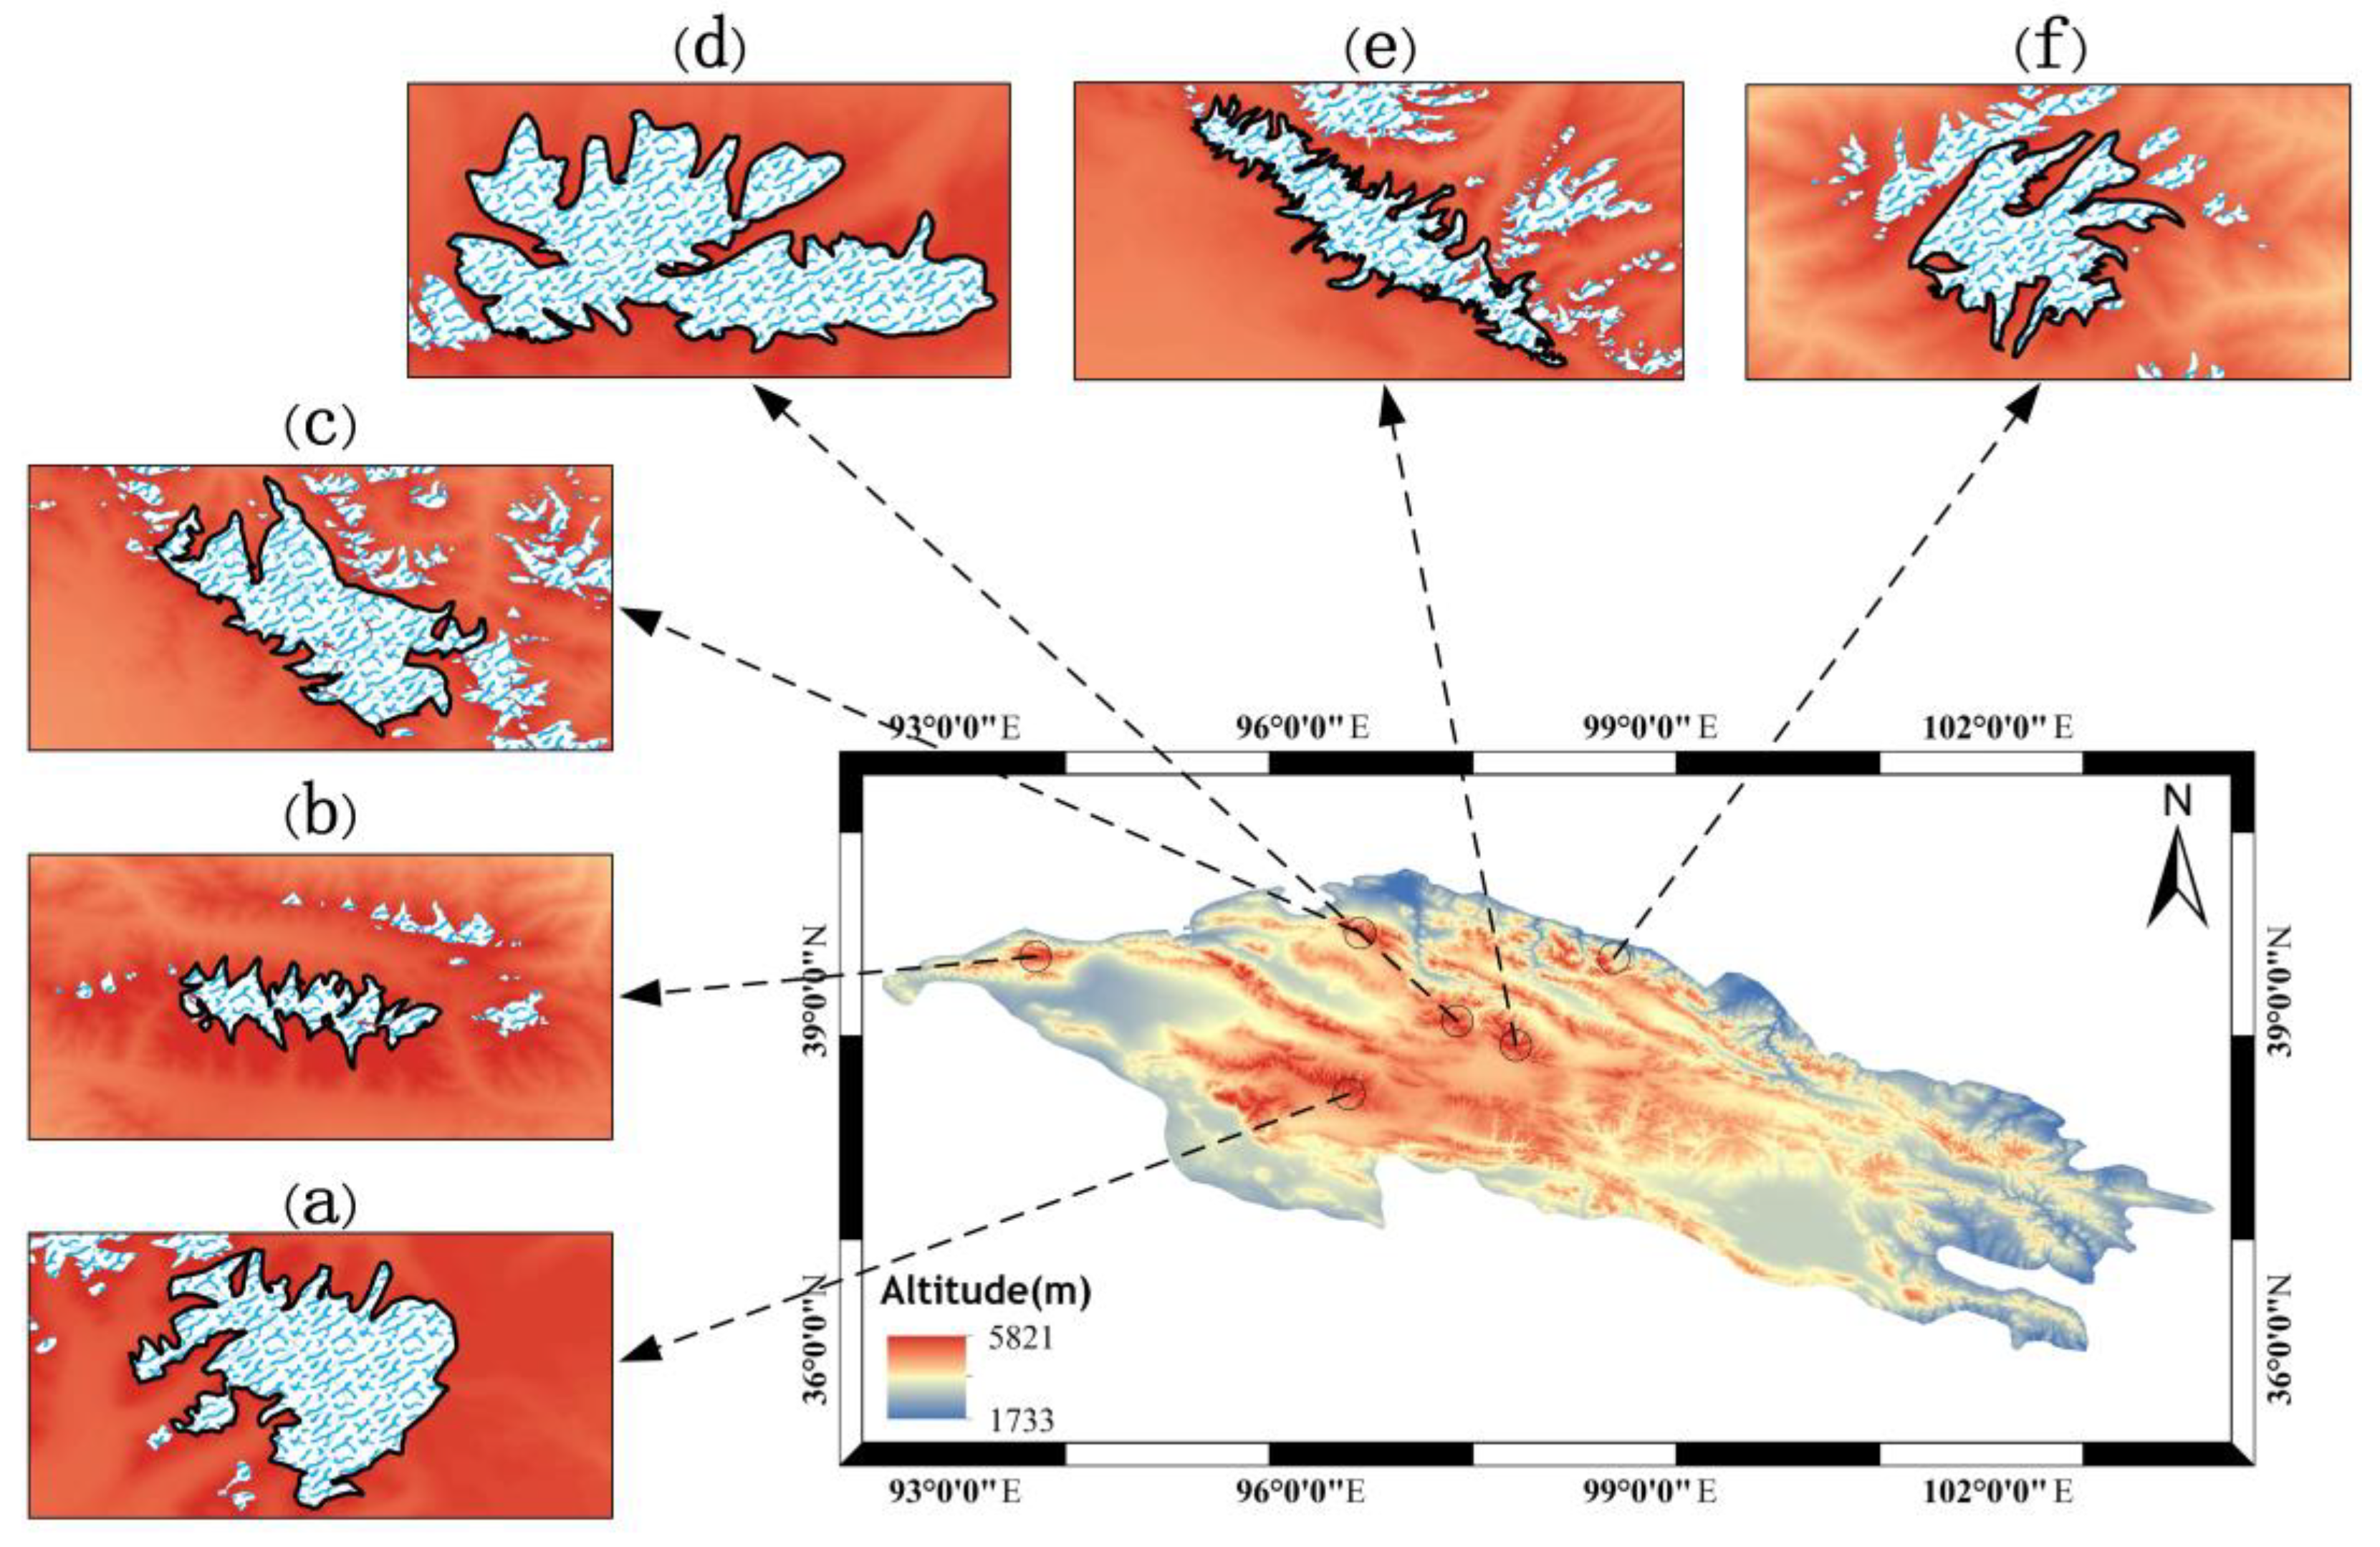
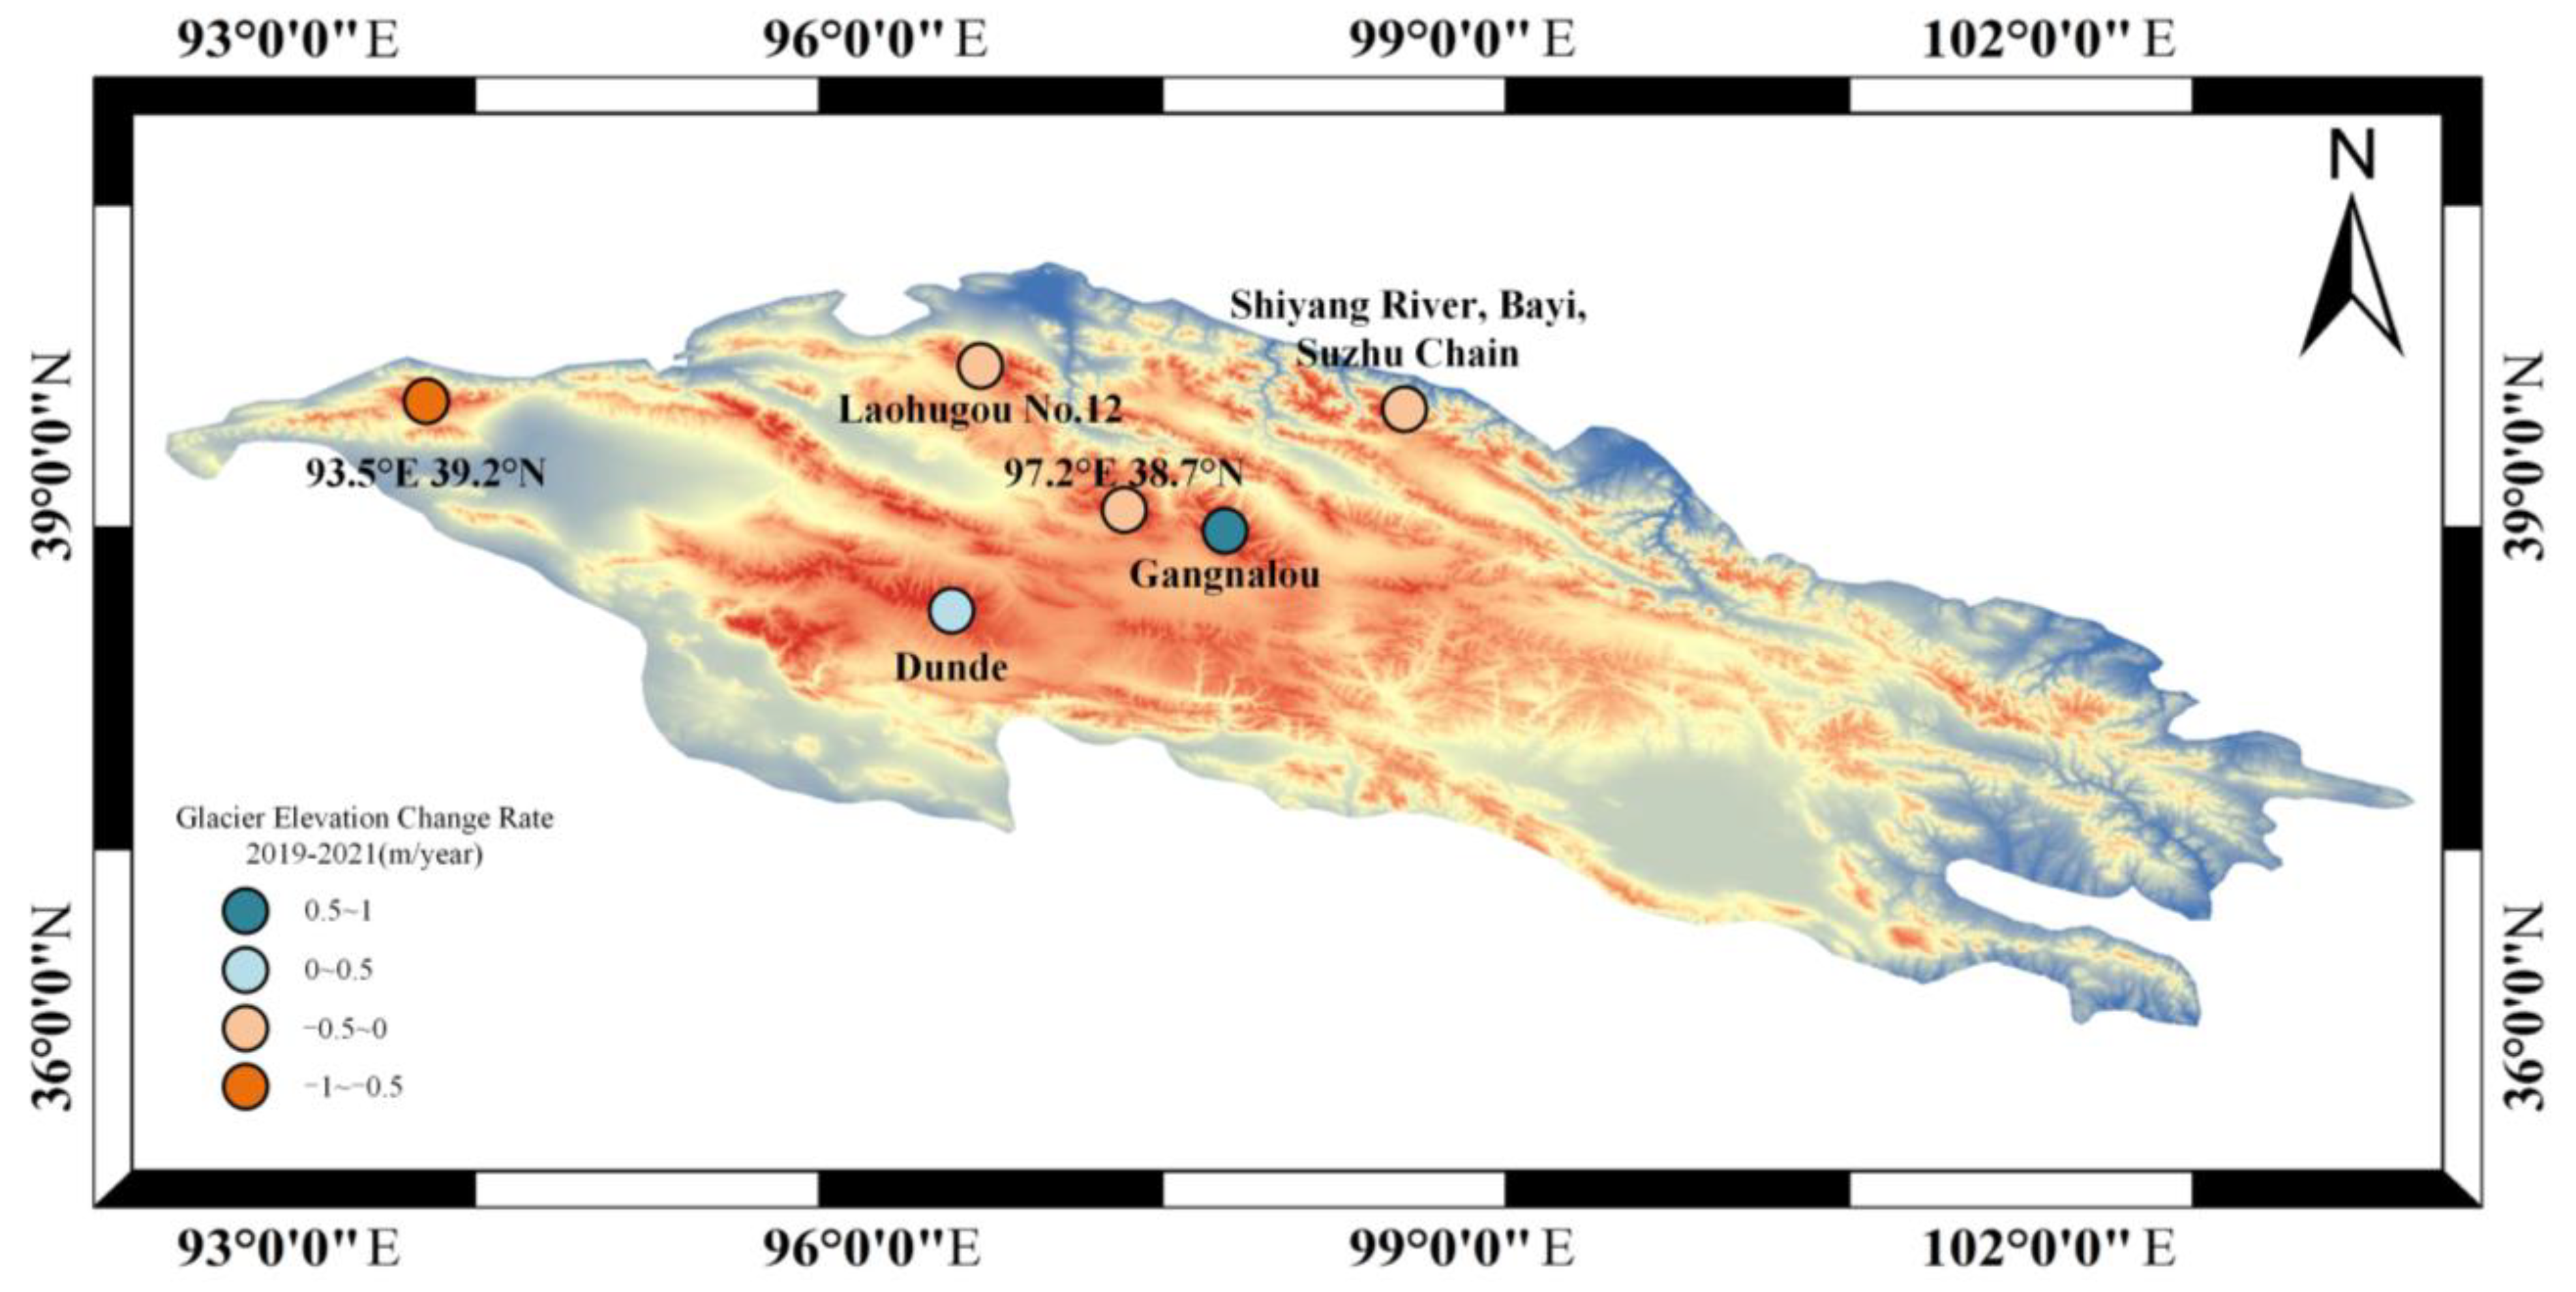
2.1. Study Area

The Qilian Mountains (36°N~40°N, 93°E~104°E) are located on the northeastern margin of the Qinghai-Tibet Plateau (Figure 1), far from the ocean at the intersection of the Qinghai-Tibet, Mongolia-Xinjiang, and Loess Plateaus. Due to the specific influence of the Qinghai-Tibet Plateau on atmospheric circulation, the humid airflow from the southeast monsoon in summer can extend northwards to the west and spread into the region. In winter, the region is affected by the dry and cold air from Inner Mongolia as well as cold air flow from the northwest, which results in a large drop in local temperatures. Most of the glaciers in the Qilian Mountains are 4000–6000 m above sea level, and the annual precipitation is mostly 500–1000 mm. They belong to subcontinental glaciers, the most important and widely distributed glacier types in China, accounting for 44% [30,31]. The western part of the Qilian Mountains is mainly affected by the western monsoon, and the eastern part is mainly affected by the East Asian monsoon. Previous studies have shown that every 1.5 °C increase in global temperature will lead to a 2.1 °C increase in the temperature of the Qinghai-Tibet Plateau. In the Qilian Mountains, the mean annual temperature is 6 °C in lowlands and −10 °C in high elevations [32]. As the altitude increases, the air temperature gradually decreases at a rate of −0.58 °C for every 100 m [33,34]. According to Randolph Glacier Inventory (RGI) 6.0, there are approximately 3306 glaciers in the Qilian Mountains region. Since these glaciers are less affected by human activities, their changes are largely driven by natural factors [35], and glacial changes are an important indicator of climate change. Therefore, it is critical to explore the changes in glaciers in the Qilian Mountains and their relationship with climate change. In this study, six representative glaciers were selected for elevation change research, and the study area was roughly distributed across the central and western Qilian Mountains.

2.2. Datasets

2.2.1. ICESat-2 Data

Approximately 10 years after ICEsat-1 ceased operations, NASA launched its successor satellite, ICESat-2. ICESat-2 also uses lasers for elevation measurement. The satellite is equipped with the Advanced Topographic Laser Altimeter System (ATLAS), which is capable of measuring the height of the glacier surface every 91 days. Unlike ICESat-1, which was equipped with the Geoscience Laser Altimeter System (GLAS) instrument, ICESat-2 is the first platform to be equipped with a photon-counting lidar. This new system has three beam pairs, and the energy ratio of the strong laser beam to the weak laser beam is approximately 4:1. The cross-track distance between each beam pair is approximately 3.3 km, and each beam in the beam pair is separated by 90 m. Since it began operation in September 2018, ICESat-2 has been able to provide a variety of laser point data and altimetry products every year that not only achieve cross-orbit measurements while maintaining high accuracy, but that also collect more data within the same time frame [36]. ATLAS collects data with a spatial sampling interval of only ~0.7 m at a higher emission frequency (10 kHz), which can monitor glacier elevation changes more effectively [37]. Which leads to this system can offer higher precision over a wider range, and it is possible to monitor the elevation changes of the glaciers over a shorter time interval. The elevation accuracy of the Qilian Mountain glacier extracted by ATLAS is 0.08 m [38]. In the Antarctic region, the accuracy can be as low as 1–2 cm [39,40]. In this study, ICESat-2 ATL06 data were collected between January 2019 and December 2021. This includes altitude, time, latitude, longitude, data confidence, along-track slope parameters, etc. ATLAS data were downloaded from NSIDC (https://nsidc.org/data/icesat-2, accessed on 14 June 2022.).

2.2.2. ALOS DEM

ALOS is the Advanced Land Observing Satellite-1 project from the Japan Aerospace Exploration Agency (JAXA). This study uses the 12.5 m resolution DEM that was generated by data from the PALSAR sensor after radiometric terrain correction (RTC). Considering that multiple ALOS DEMs in different seasons may have their own biases, ALOS DEM data from winter 2007 were used in this study, and the data were downloaded from ASF DAAC (https://search.asf.alaska.edu, accessed on 20 March 2022.). PALSAR has a variety of observation modes, including FBS, FBD, and PLR. From 2006 to 2011, PALSAR’s L-band synthetic aperture radar (SAR) produced a large number of all-weather observations. Publishing of the ALOS PALSAR RTC dataset began in October 2014 and was completed the following year. The data included in the project are FBS, FBD, and PLR data for all global land areas except Antarctica, Greenland, Iceland, and northern Eurasia. In FBS mode, the topographic resolution of the PALSAR radar can reach 10 m, and in FBD mode, it can reach 20 m. Through actual tests, the resolution of DEM data in FBS mode is approximately 12.5 m. Therefore, the effective resolution of the ALOS terrain dataset is approximately 12.5 m [41,42].

2.2.3. Auxiliary Data
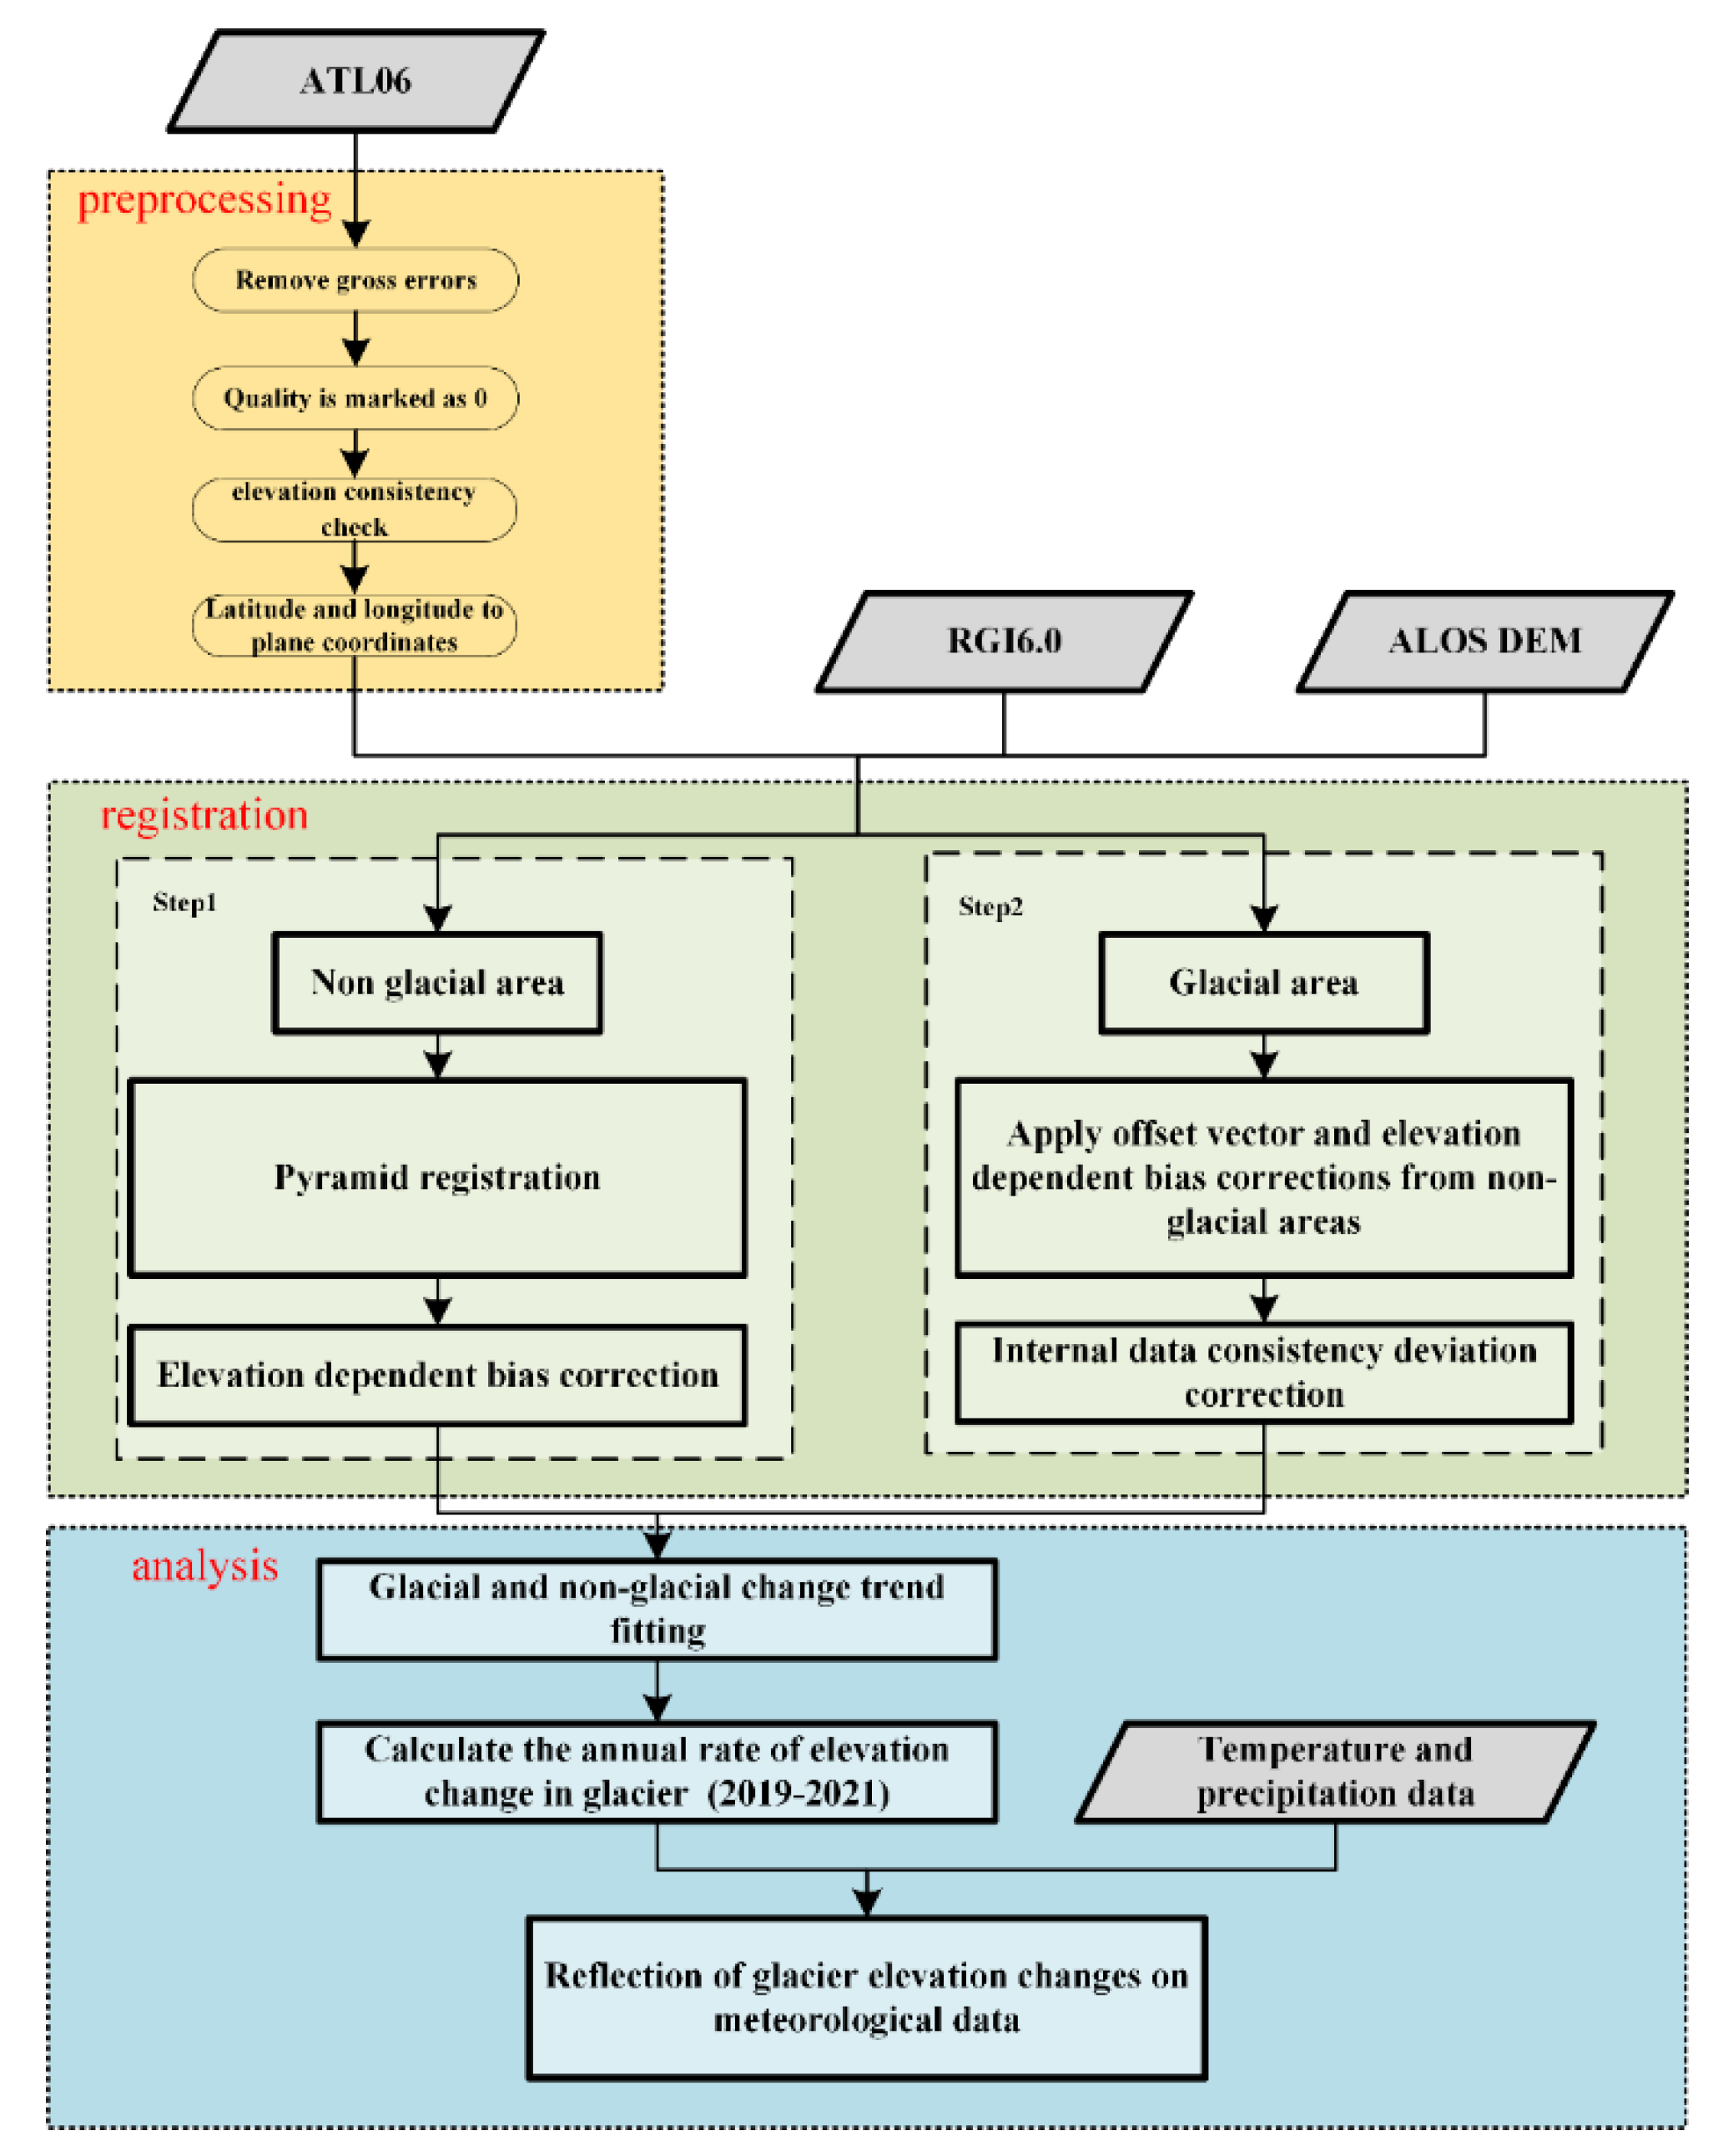
This study used Randolph Glacier Inventory (RGI) 6.0 data and GF-7 high-resolution optical imagery to determine glacier boundaries. The RGI 6.0 data provide a global list of glaciers, with Landsat TM/ETM+ images as the main data source and contains high-resolution images and topographic maps as supplementary data for interpretation, which can be downloaded from the National Qinghai-Tibet Plateau Scientific Data Centre (http://data.tpdc.ac.cn, accessed on 1 April 2022.). The precipitation data was provided by the GLDAS-Noah hydrological model, which consists of monthly data at a spatial resolution of 0.25° × 0.25°. This model is a global high-resolution land surface simulation system jointly operated by the National Center for Environmental Prediction (NCEP) and NASA Goddard Space Flight Center (GSFC). Based on multisource observations, reanalysis data, and atmospheric assimilation products, this dataset can provide land surface data from 1979 to the present, with spatial resolutions of 0.25° × 0.25° and 1.0° × 1.0° and with 3 h and monthly temporal resolutions [43]. The temperature data used in this study came from the surface temperature component of the MODIS satellite land standard product MOD11C3, which consists of monthly resolved data with a spatial resolution of 0.05° × 0.05°.

3. Methodology

The ICESat-2 data in this study consists of points not uniformly distributed in space, and the ALOS DEM consists of gridded surface data. On account of these different sources and formats, both datasets need to be registered to calculate glacier elevation changes. Both datasets are based on the geodetic height of the WGS84 ellipsoid and do not need to be corrected for elevation anomalies. Considering the influence of terrain factors such as slope and aspect, this study uses the ICESat-2 data as the true value. It adopts a pyramid registration method to register the plane position and elevation of the ALOS DEM data. After that step was complete, the elevation changes for each glacier were calculated, the annual rate of glacier elevation change from 2019 to 2021 was obtained, and the results were compared with temperature and precipitation data for further analysis.
Our research workflow includes the following steps (1) Preprocessing ATL06 data; (2) Registering ICESat-2 data and ALOS DEM data, and comparing the registration results with those of the registration method proposed by Nuth et al. [12]; (3) Extracting the elevation difference between the ICESat-2 data and the ALOS DEM data at the ICESat-2 footprint; and (4) Estimating the variable trend of glacier elevation, calculating the uncertainty in the study area, and combining the results with climate data for analysis. The flowchart is shown in Figure 2.

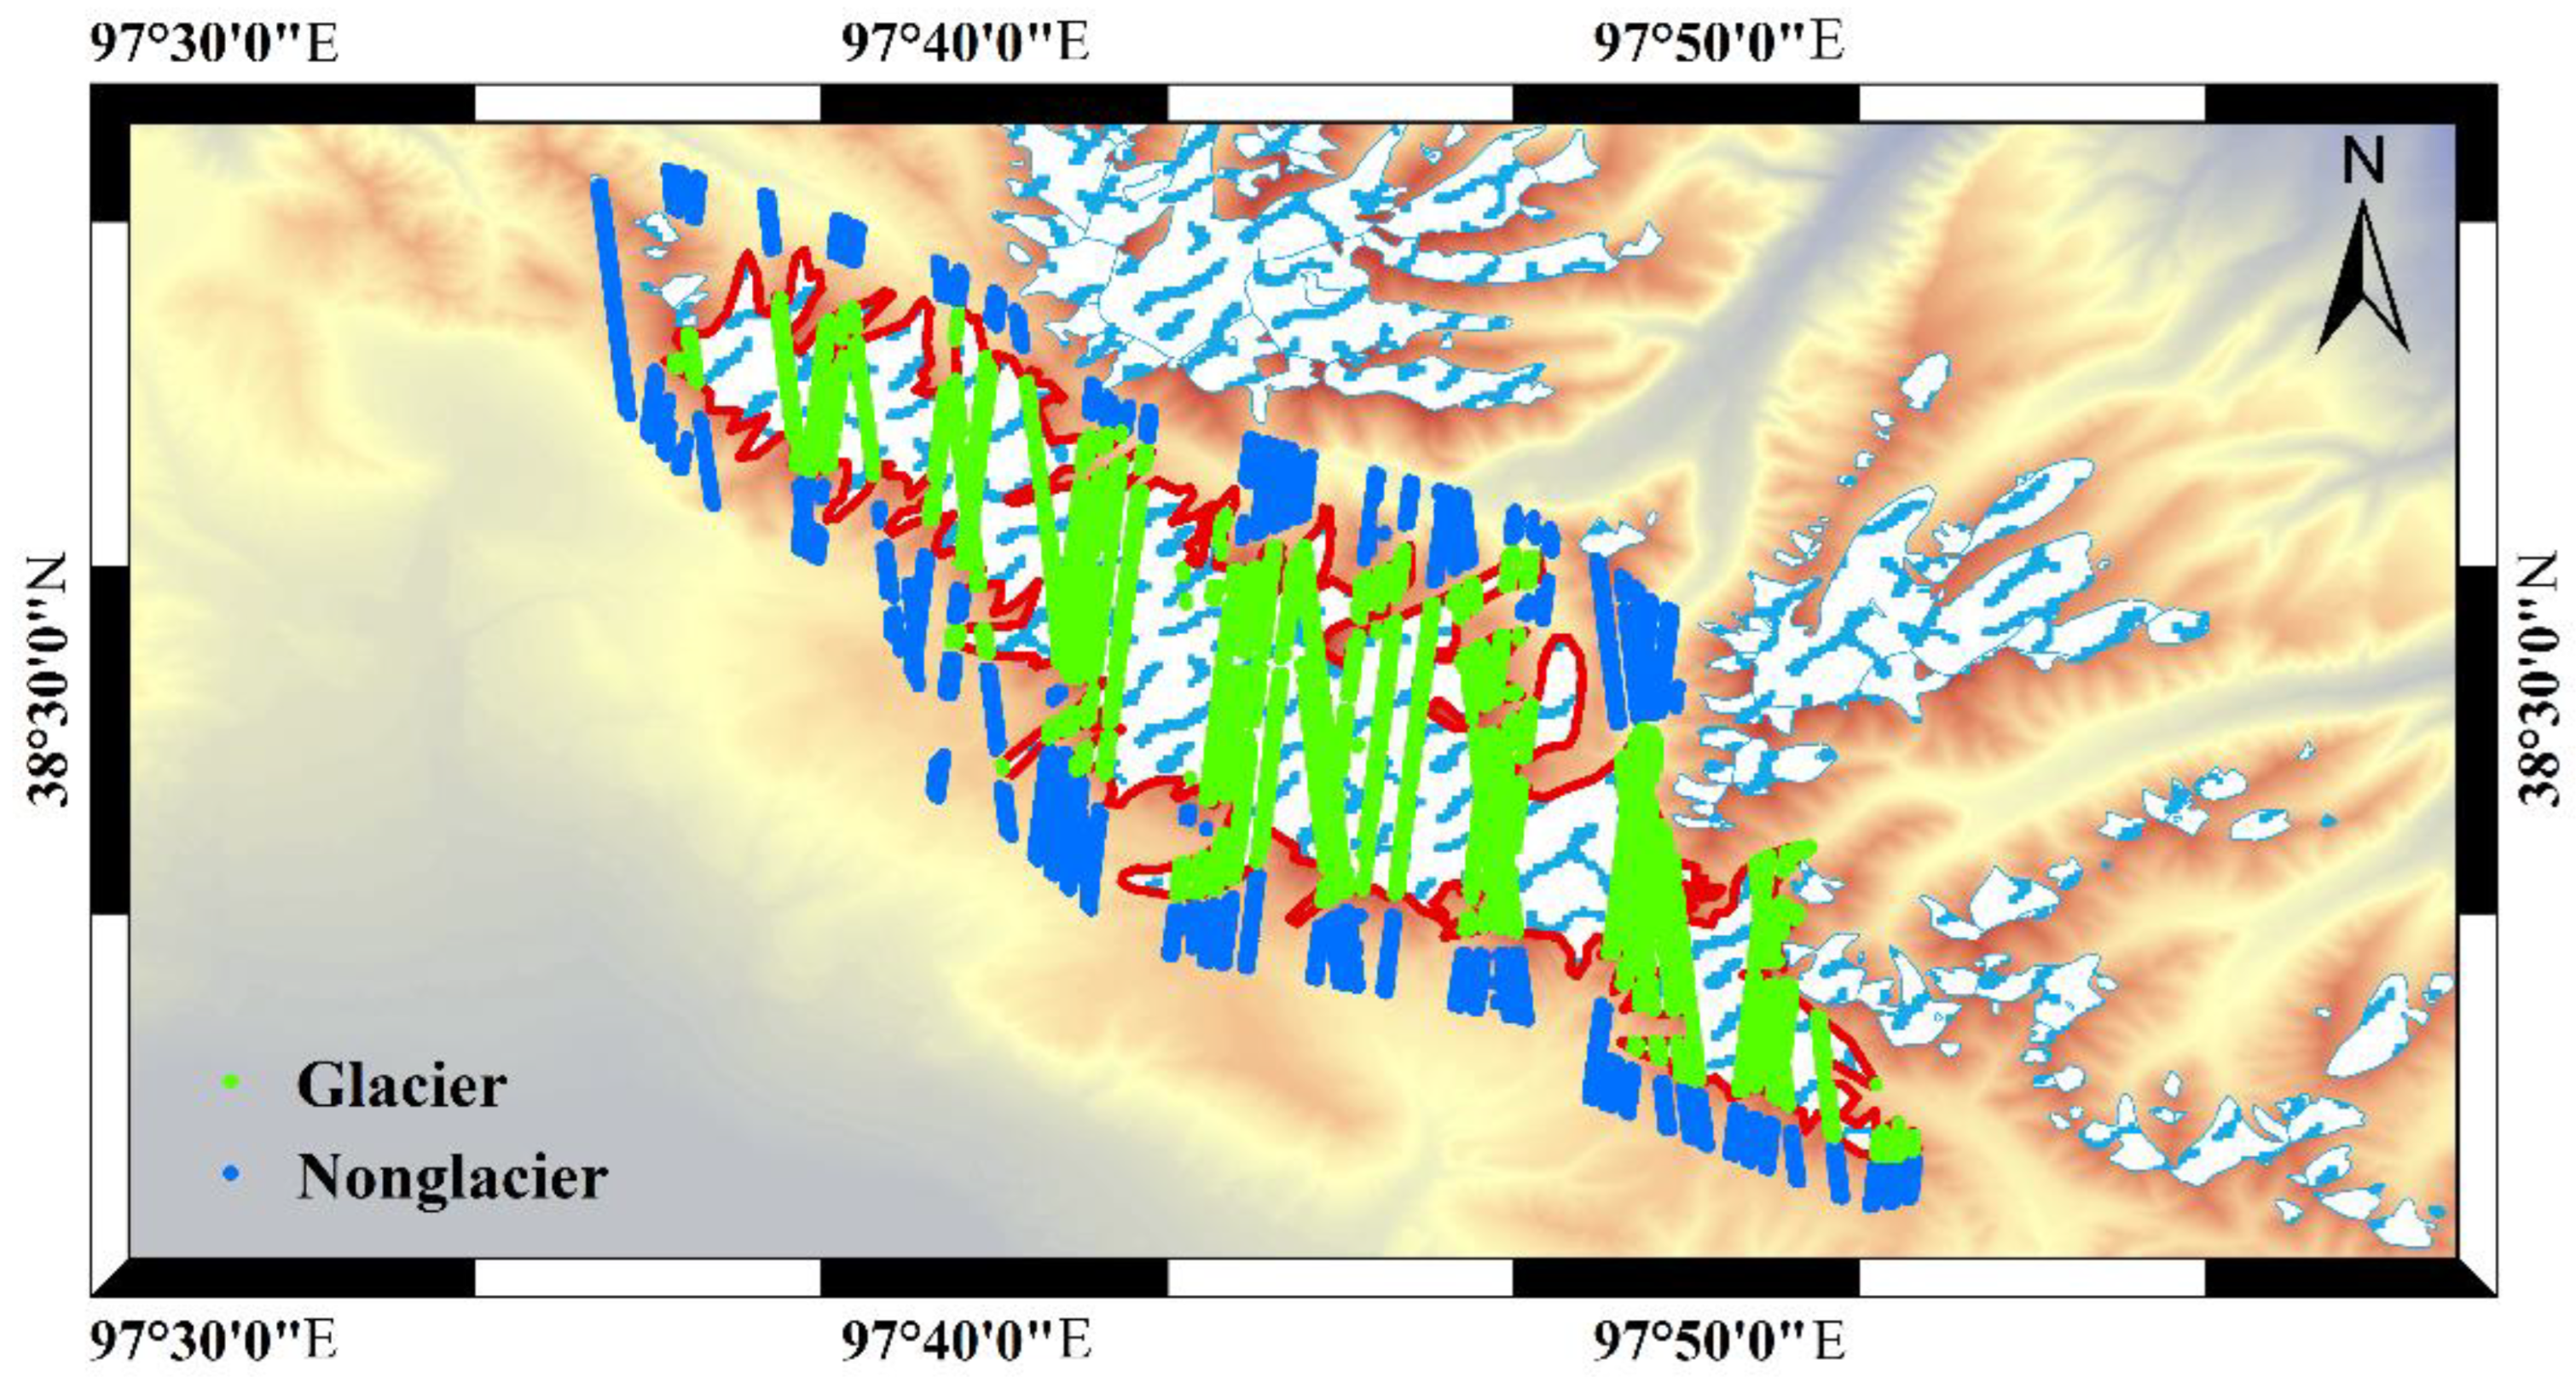
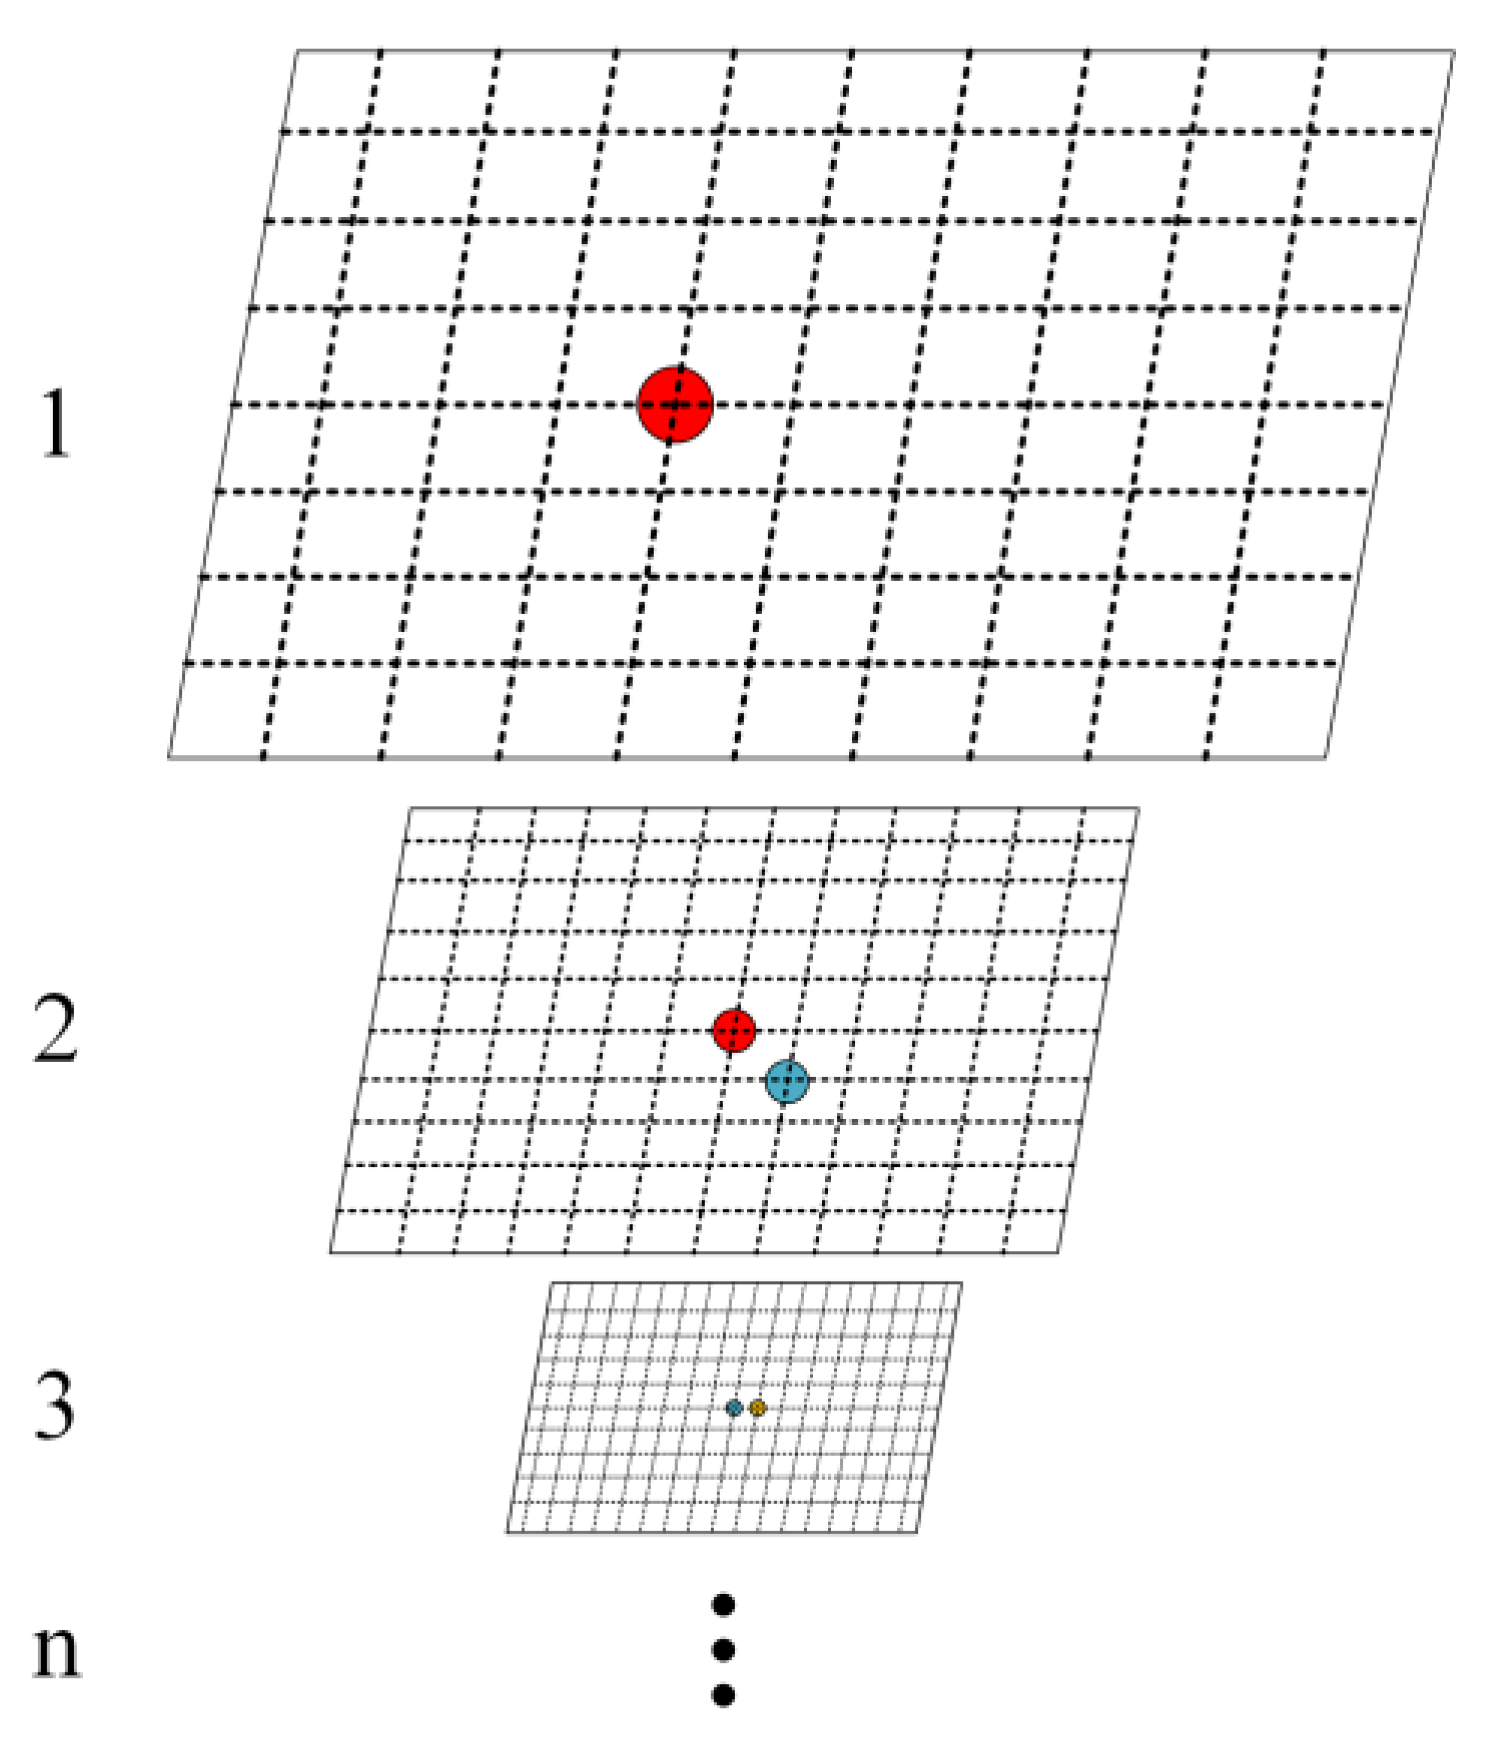
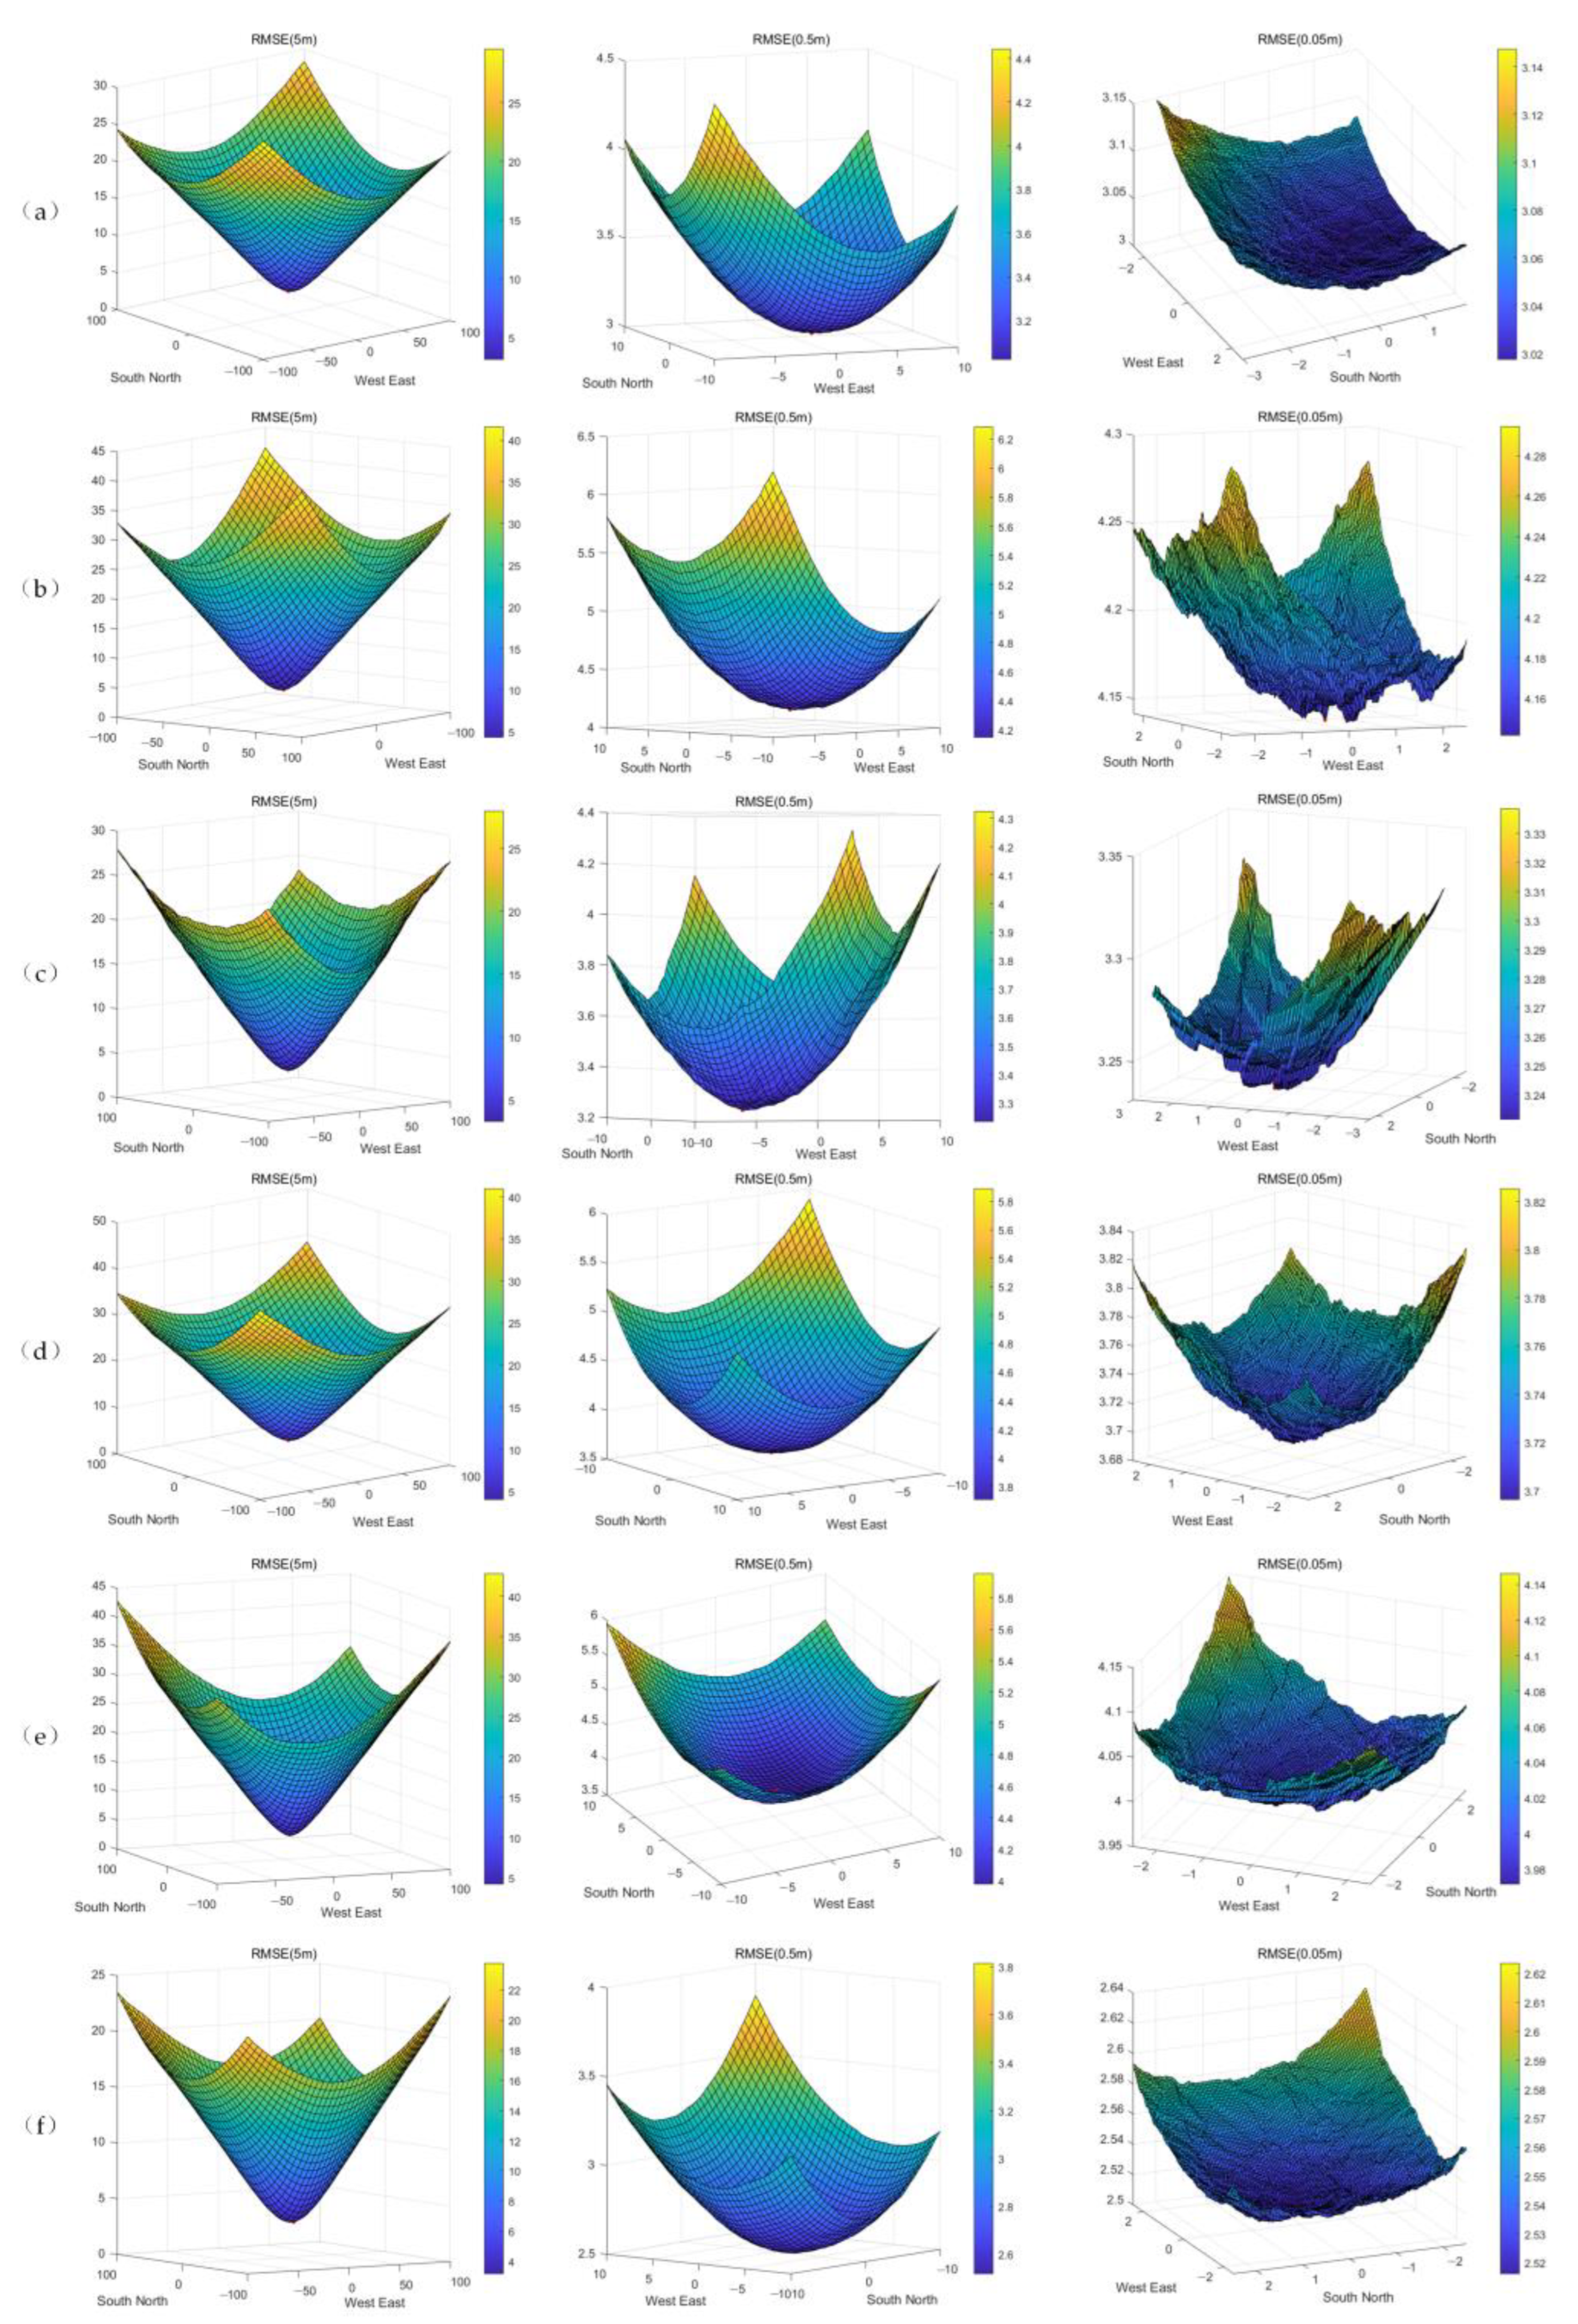
3.1. Registration of ICESat-2 Data and the ALOS DEM

In this study, a bilinear interpolation method was used to extract the elevations from the ALOS DEM that corresponded to the footprint locations of ICESat-2. The data used for the registration were located on the stable nonglacial terrain near the corresponding glacier, as shown in Figure 3. We attempted to analyze two potential biases that existed on the assumed stable terrain:
  • Geographical bias (x, y, and z directions)
  • Elevation-dependent bias
First, the ICESat-2 data where the slope along the track is less than 1 degree were filtered, and only the points with high quality (quality marked as 0) [37] that passed the elevation consistency check were selected. The elevation consistency check refers to the difference between the original elevation and the estimated elevation [44], and we only used data where that difference was less than 2 m. For the ALOS DEM data, only data with a slope less than 30 degrees were selected because the slope is often the main factor causing instability in elevation measurements. After that, the data points with an elevation difference greater than 150 m were eliminated, which was considered to be a gross error related to clouds, and 3σ filtering was performed on the elevation differences.
The pyramid translation method is used for registration, as shown in Figure 4. First, the elevation difference of nonglacial areas is calculated, and the median value of the root mean square error of this series of elevation differences is recorded as the value at the coordinate point (0, 0). Then, when the ICESat-2 data are translated by a certain step distance in the north-south and east–west directions, the root mean square error (RMSE) of the elevation difference between the two data reaches its minimum, and the terrain reflected by the two datasets is at its most similar. Simultaneously, the two displacements are recorded as (x, y) coordinates. Then the negative values of the translations in the two directions are added to ALOS DEM to achieve the plane registration effect. The mean value of the elevation difference at this coordinate is added to the ALOS DEM as the elevation correction value to complete the registration of this layer. The registration of the next layer selects (x, y) of the previous layer as the center point (0, 0) and repeats the above steps after reducing the step distance. In this experiment, a 3-layer pyramid is used for translation registration. The step distance of the first layer is 5 m, the second layer is 0.5 m, and the third layer is 0.05 m. After comparing the registration results with the results of the method proposed by Nuth et al. (to ensure consistent accuracy, the iteration termination threshold is set to 0.05 m), it is found that in the case of simpler data processing (i.e., when there is no need to input the slope and aspect and iterations proceed directly), the registration results are similar. Additionally, the mean and RMSE of the glacier area have been improved to varying degrees after registration. The formula for calculating the translation vector is shown below:
Δ x ˜ , y ˜ = i = 1 m j i × Δ d i , k i × Δ d i
Δ z ˜ = i = 1 m m e a n Δ h j i , k i
where m is the number of pyramid layers, Δ x ˜ represents the amount of translation in the east-west direction, Δ y ˜ represents the amount of translation in the north-south direction, and Δ z ˜ represents the amount of translation in the elevation direction. In addition, j i and k i represent the horizontal and vertical coordinates when the RMSE of the elevation difference takes the minimum value in each layer, respectively. Δ d i represents the step distance of each layer, and m e a n Δ h represents the average value of the elevation difference.
Furthermore, to avoid altitude-dependent bias, the ALOS DEM is adjusted by the linear relationship between the elevation difference and elevation of the stable terrain using the following expression:
d h = k H + τ
where d h is the elevation difference of the nonglacial area, k and τ are the regression parameters, and H is the DEM elevation. k and τ were obtained by least squares fitting and applied to glacial regions to counteract the elevation-dependent bias.

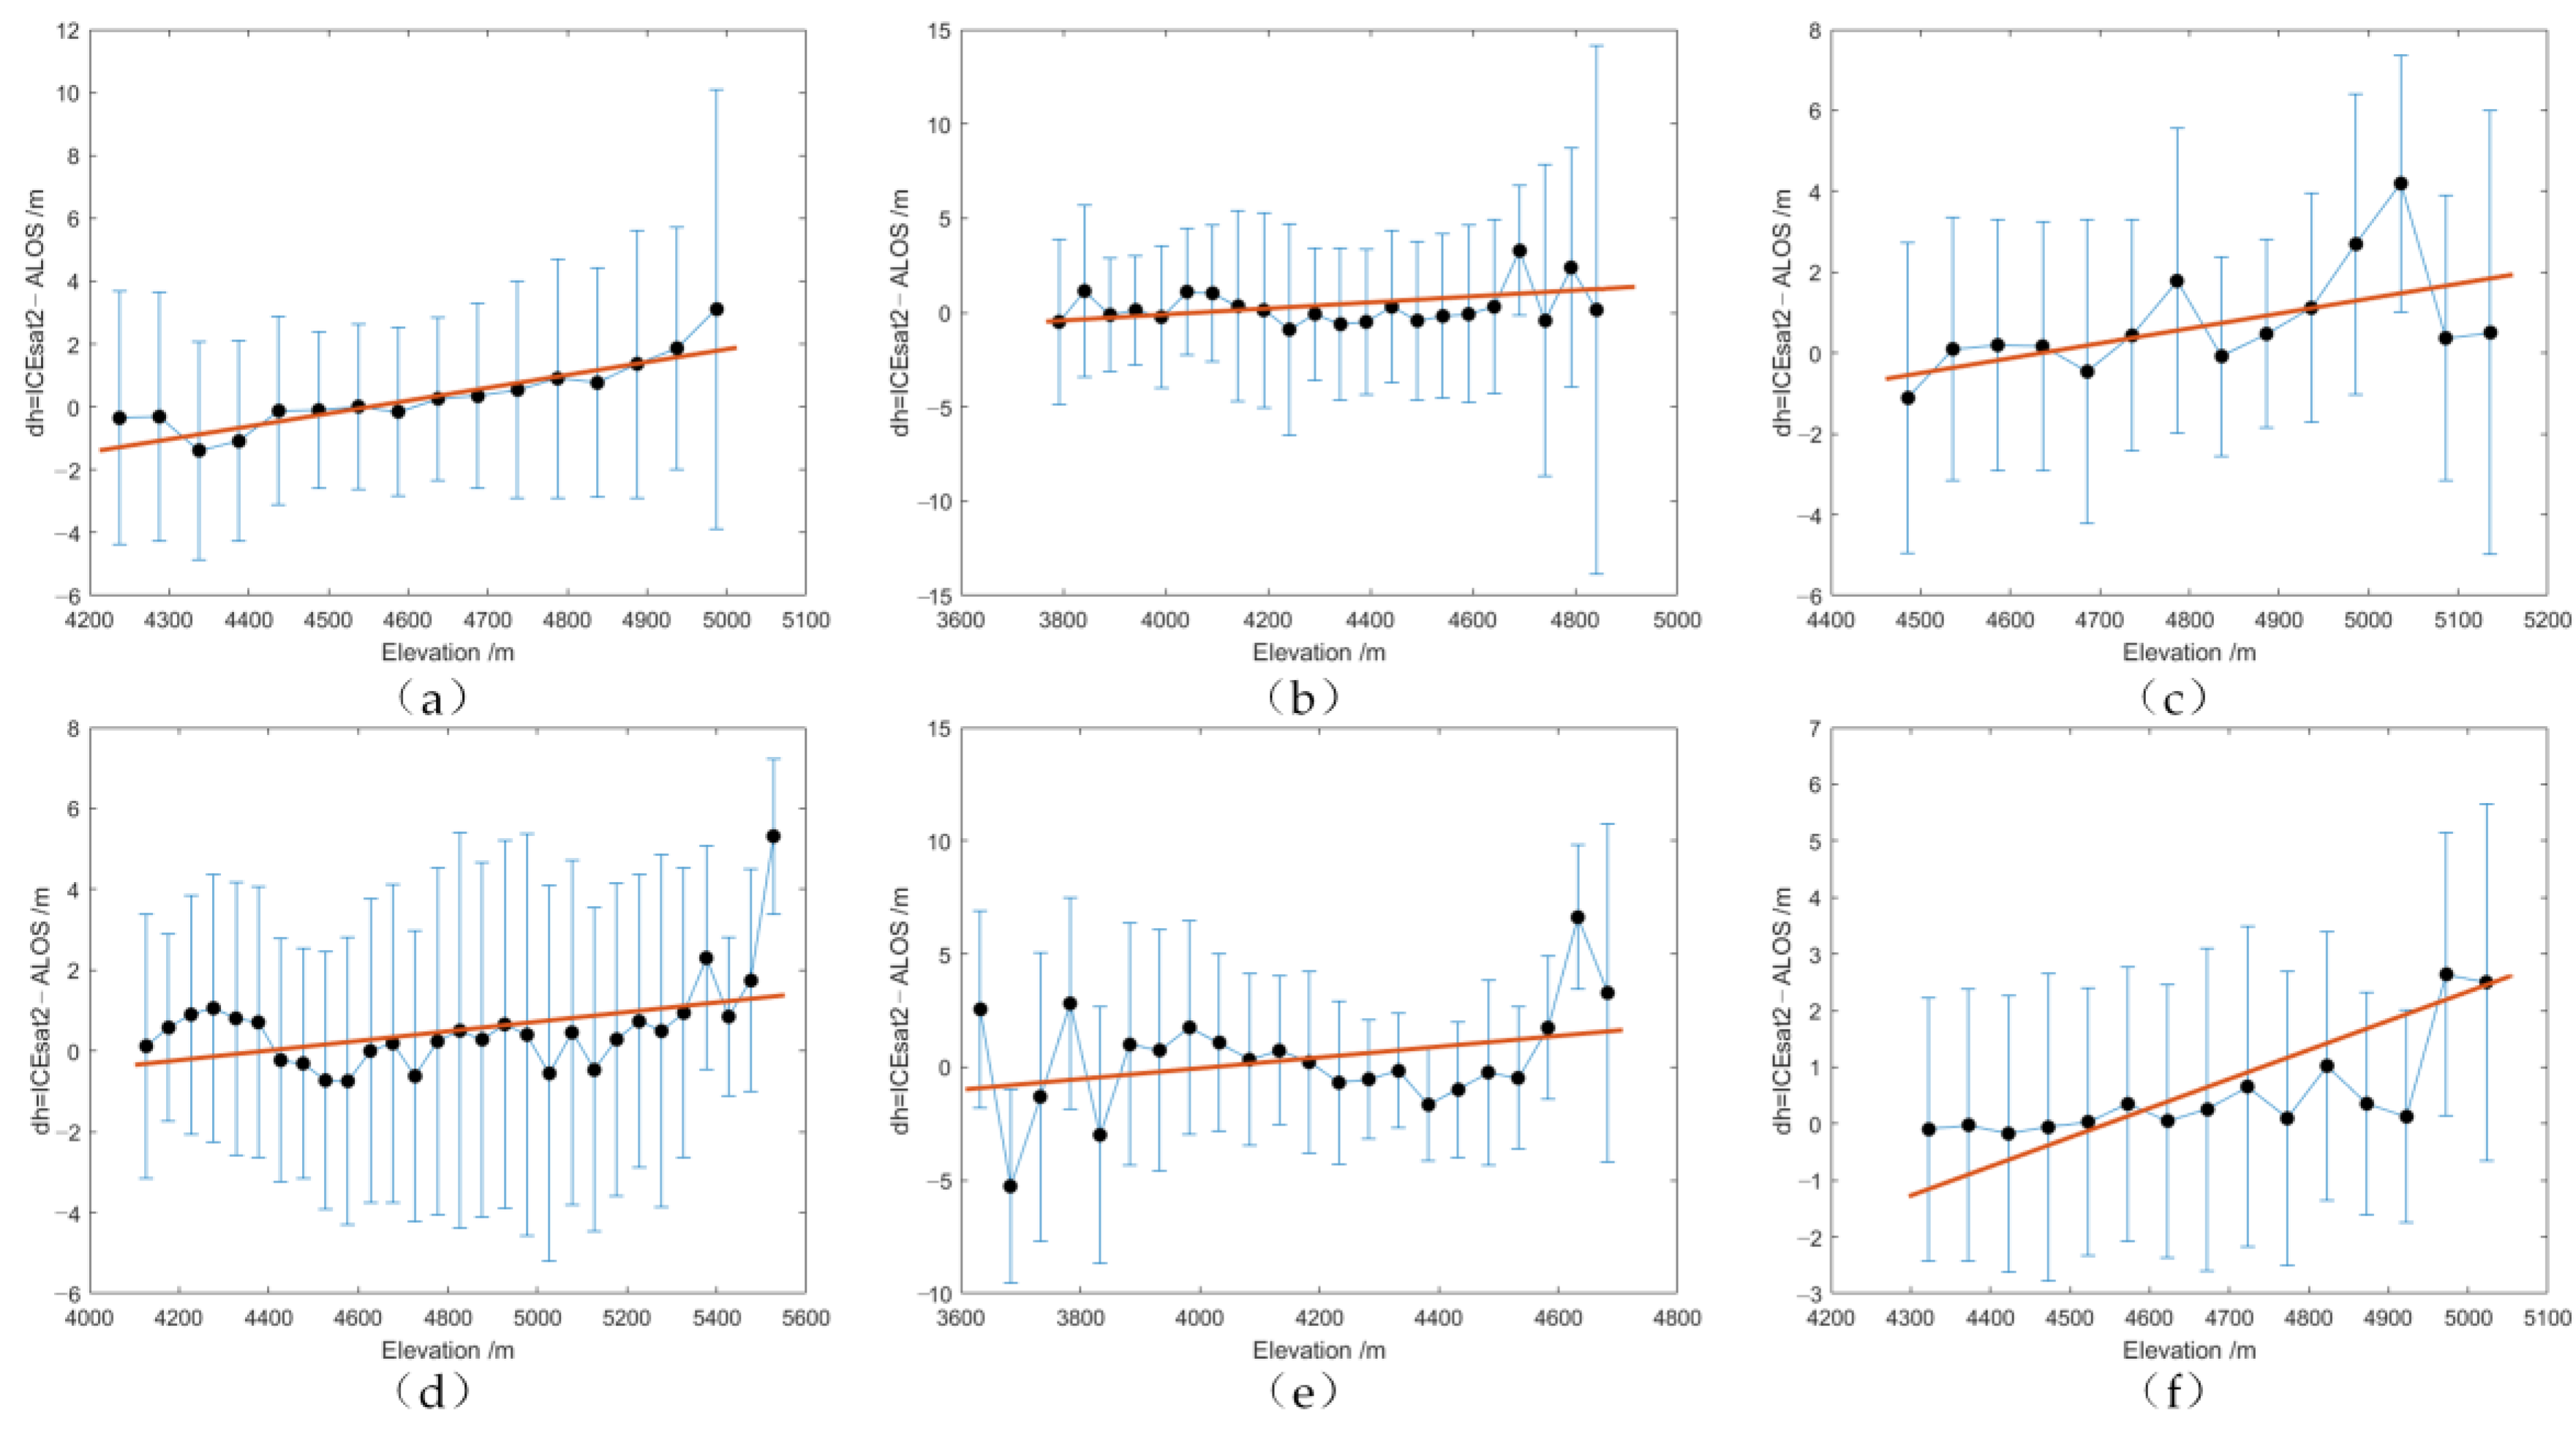
3.2. Elevation Difference Calculation and Internal Consistency

Glacial elevation change can be calculated as:
Δ h = H I C E S a t 2 H A L O S  
D H = Δ h + δ 1 + δ 2
where H I C E S a t 2 is the elevation from ICESat-2 from 2019 to 2021, and H A L O S is the DEM elevation in winter 2007. D H is the final value of the elevation change, δ 1 is the registration-related correction value, and δ 2 is the elevation-dependent correlation correction value.
The internal data consistency bias is calculated as:
ϑ = ( Δ h 1 Δ h 2 ) ( H I 1 H I 2 )
Among these, H I 1 and H I 2 are the ICESat-2 footprint points passing through the same ground point at different times, and the two nearest points are used for bilinear interpolation. Δ h 1 is the elevation difference between ICEsat-2 and ALOS when passing this point for the first time, and Δ h 2 is the elevation difference between ICEsat-2 and ALOS when passing this point for the second time. In theory, the right side of the equation should be 0, but in practice, there will be a slight deviation, which is recorded as the internal data consistency deviation ϑ .

3.3. Elevation Variation Trend Estimation and Uncertainty Analysis

Typically, the ice surface elevation obtained by ICESat-2 is the instantaneous elevation when the laser pulse reaches the ice surface, which is easily affected by short-term weather. The calculated thickness change value cannot reflect the change in thickness of the glacier with perfect accuracy, but dh/dt can accurately reflect the annual trend of glacier thickness. Since the ordinary least squares fitting method is more sensitive to anomalous data, this method easily causes instability in the fitting results. Therefore, a robust regression algorithm is used to solve the parameter vector of the changing trend in the actual calculation. This study adopts the M statistic bisquare method.
Errors in elevation data, whether from DEMs or individual points, are usually estimated by comparison with independently acquired ground control points (GCPs). These are often far more accurate than the elevation source being tested. Assuming that the GCP value is the correct value, the quantification of this error usually uses two measures of the statistical distribution of the residuals, the RMSE or the standard deviation (σ). However, suppose the mean difference of the residuals is not equal to 0. In that case, the RMSE is not a correct estimate of the statistical error distribution, and the mean and standard deviation should be used [45,46]. In this study, we do not use GCPs to determine accuracy but instead, create a residual population of differences between two independent data sources on stable terrain. These residuals represent relative errors between elevation datasets, not absolute errors. The fitting error of the glacier thickness change mainly consists of three components. (1) The first component is the thickness change trend in the nonglacial area, represented by σ1. Theoretically, variability in the thickness of the stable terrain in the nonglacial area will be 0. Still, due to real changes in the natural environment (e.g., snow cover) and systematic deviations in the ATLAS laser altimeter, there will be slight changes in thickness on the stable terrain. However, the specific reason for this is not clear, and this issue may also exist on glaciers; therefore, it is regarded as an error source; (2) The second component consists of the standard error of the rate of change parameter from the vector obtained by robust regression fitting, denoted by σ2; (3) The third components pertain to the internal data consistency deviation, ϑ , calculated in Section 3.2 which is represented by σ3 here. Therefore, the uncertainty calculation formula for the change in glacier thickness is as follows:
σ = σ 1 2 + σ 2 2 + σ 3 2

4. Result

This study analyzed the annual and monthly changes in the elevations of six glaciers in the Qilian Mountains. In Section 4.1, we compare the results of our registration method with those of Nuth et al. In Section 4.2, the elevation changes in glacial and nonglacial areas were calculated, and the annual rate of glacial elevation changes and their spatial differences were analyzed. In Section 4.3, we analyzed the changes in glacier elevation in the same months over 3 years for glaciers in the study area.

4.1. Registration Results

The registration results are shown in Table 1. The average elevation difference of the stable area near the Gangnalou Glacier is improved by 90% using the two registration methods. The average elevation difference of the stable area near the Laohugou No. 12 glacier was improved by 77% using the two registration methods. The average elevation difference of the stable area near the Dunde ice cap is increased by 70% using the method presented in this paper and by 77% using the method of Nuth et al. The average elevation difference of the stable area near the 93.5°E 39.2°N glacier is increased by 86% using the method presented in this paper and by 89% using the method of Nuth et al. The average elevation difference of the stable areas near the Shiyang River, Bayi, and Suzhulian glaciers is increased by 86% by using our proposed registration method and by 92% by using the method of Nuth et al. The mean elevation difference of the stable area near the 97.2°E 38.7°N glacier was improved by 97% using both registration methods. In summary, the two methods achieve almost the same effect, but the new method proposed here is more convenient. The improvement of the root mean square error of the two methods is not obvious because the random error existing in the DEM itself is difficult to eliminate, and its influence can only be minimized.
As shown in Figure 5, each layer selects the (x, y) coordinates of the location of the minimum point of the elevation difference RMSE (marked in red) to perform the translational registration on the ALOS DEM. The x direction is positive to the east, and the y direction is positive to the south. According to the resolution of each layer, the offset vector size can be obtained by multiplying the resolution by the coordinate scale. In the elevation direction, the correction is made by averaging the value of the elevation difference at the location of the point in each layer that indicates the minimum RMSE of elevation difference. The specific offset vector size is shown in Table 2. For example, the ALOS DEM of Gangnalou Glacier needs to be translated to the southwest and then translated 0.76 m down in the vertical direction to complete the registration. To verify whether there is an error in the registration result after the 3-layer pyramid translation registration, it is necessary to ensure that the minimum point is located in the center position, as shown in Figure 6, and that the registration is completed according to the requirements.
After completing the registration using the method outlined in this paper, it is necessary to check whether there is an elevation-dependent bias on the nonglacial terrain [47,48]. Elevation-dependent bias is important for estimating glacier volume change since glaciers and their mass balance change primarily with elevation, and elevation bias due to z-scale errors or the penetration of radar waves through snow/ice will directly affect glacier measurements and interpretation. Figure 7 shows the linear correlation between the elevation and elevation difference between ICESat-2 and ALOS in the nonglacial area near each glacier. The nonglacial area transitions from subsidence to growth with increasing altitude, although the extent of subsidence or growth varies across the regions. The ALOS DEM was linearly corrected using a first-order linear equation fitted by least squares. This equation was applied to the glacier region to eliminate the elevation-dependent bias.
After the registration and elevation-dependent bias correction are completed, the vertical biases of the ALOS DEM and ICESat-2 are eliminated. Figure 8 shows the comparison of the probability density distribution of the elevation difference before and after registration and correction. The elevation difference of the stable terrain in the non-glacier area near the six glaciers has been improved to varying degrees. By adding the abovementioned registration offset vector and altitude-dependent deviation correction to the calculation of dh in the glacier area, the elevation changes in the glacier area from 2019 to 2021 can be obtained.

4.2. Annual Change Rate of Glacier Elevation

To ensure the accuracy of the results, this experiment also calculated the elevation difference in the nonglacial area and compared it with the elevation difference in the glacial area. The experiments employ a robust least squares regression to minimize the effect of outlier data. From Figure 9, it can be seen that from 2019 to 2021, the elevation of the glaciers, except the Gangnalou Glacier, is decreasing or has no significant change, which shows the impact of climate change in recent years. The reason for choosing the median dh of each track instead of the mean for analysis is that the median is more resistant to outliers. As shown in Table 3, the average annual elevation change of the Gangnalou Glacier from 2019 to 2021 was 0.74 ± 0.84 m, and the average annual elevation change of Laohugou No. 12 Glacier was –0.08 ± 0.79 m over that same interval. From 2019 to 2021, the average annual elevation change of the Dunde Ice Cap was 0.09 ± 0.94 m. The average annual elevation change rate of the 93.5°E 39.2°N glacier was –0.99 ± 0.34 m, and the average annual elevation change rate of the Shiyang River, Bayi, and Suzhulian glaciers was –0.27 ± 0.77 m. The average annual elevation change rate of the 97.2°E 38.7°N glacier was –0.16 ± 0.85 m. Their distribution is shown in Figure 10. Among these, the calculation of the average annual rate of change may be inaccurate due to the small amount of data, which will be improved with the increase in ICESat-2 data in the future.

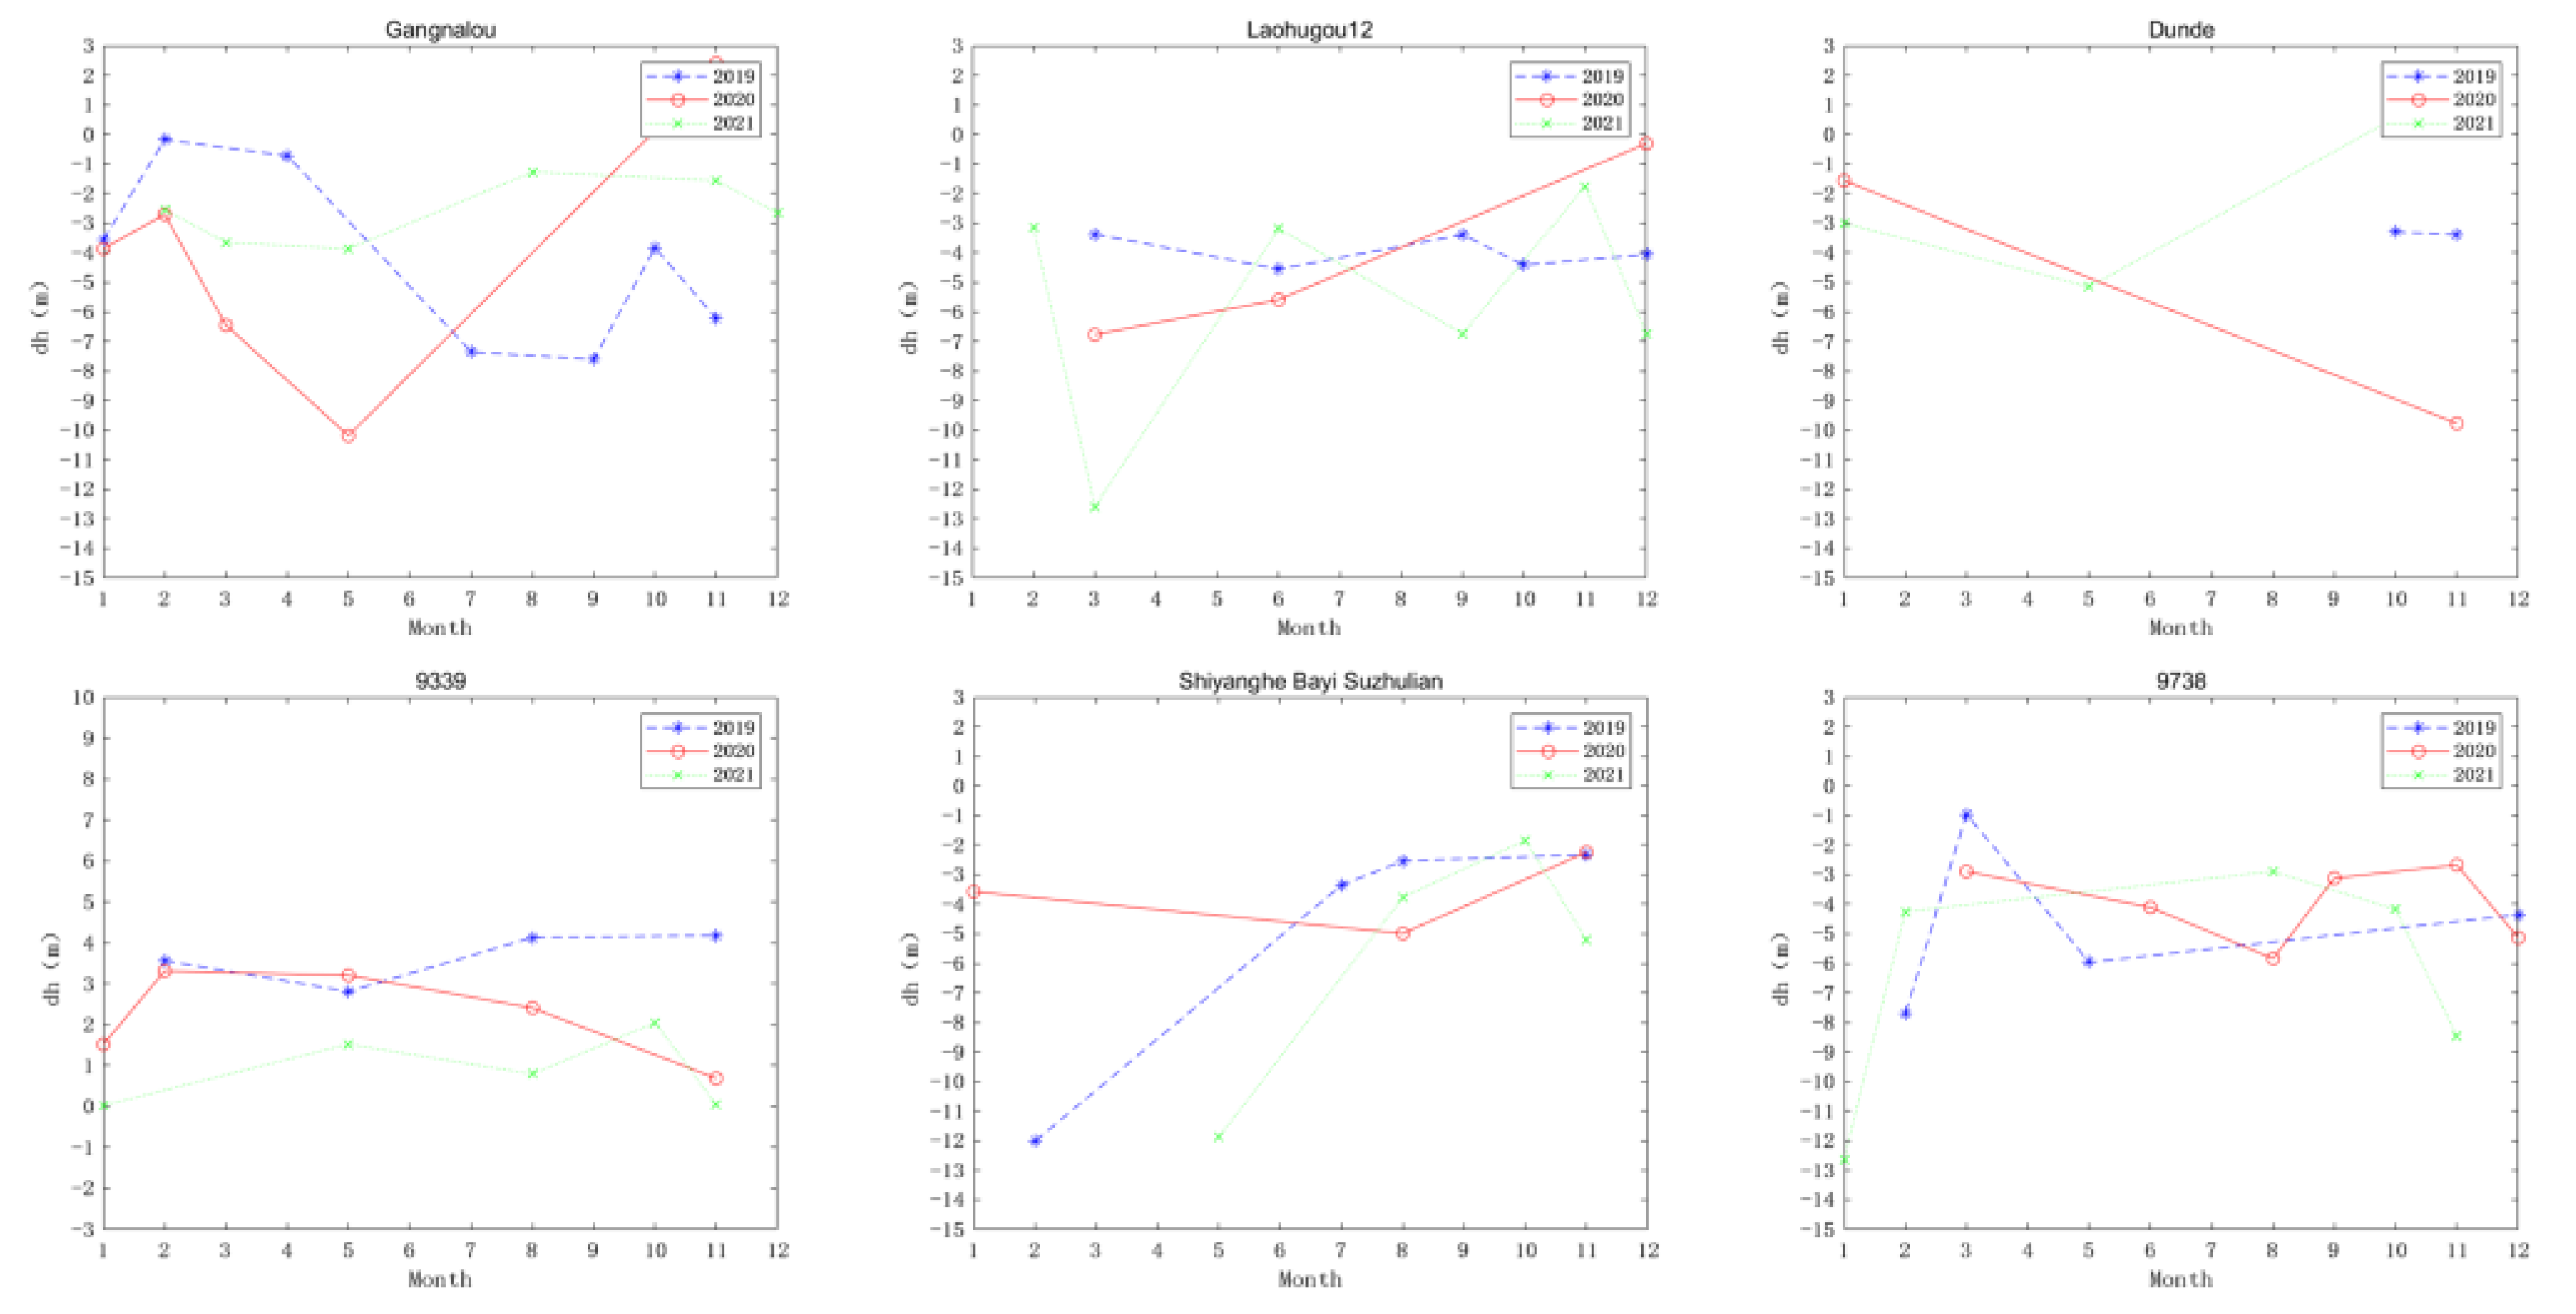
4.3. Interannual Variation in Glacier Elevation

As shown in Figure 11, each glacier change follows different patterns. For the Gangnalou Glacier, except for the lack of data in the second half of 2020, no regularity is observed. The glacier will thicken in the spring and then the glacier will thin as the summer arrives, and then the glacier will start to thicken again in the winter. For Laohugou No. 12 Glacier, the amount of data in the spring of 2019 and 2020 is insufficient. From the data in the spring of 2021, it can be seen that the glacier thins first and then thickens, but the change in the glacier in autumn and winter is basically the same (except for the lack of data in 2020). For the Dunde ice cap, due to the severe lack of data, it can only be seen that the glaciers thinned from spring to summer. For the glacier at 93.5°E 39.2°N, it can be seen that the changes throughout the year are relatively moderate. Still, there is an overall yearly decline, which also corresponds to the negative annual increase in glacier elevation presented in Section 4.2. For the Shiyang River, Bayi, and Suzhulian glaciers, in addition to the thinning phase from spring to autumn in 2020, there was a freezing trend in 2019 and 2021. For the glacier at 97.2°E 38.7°N, the results show that it thickens in spring, begins to thin in summer (except for the lack of summer 2020 data), thickens again during autumn, and thins again in winter.

5. Discussion

5.1. Factors Affecting the Change in Glacier Elevation

As shown in Figure 12, this study analyzed the monthly changes in temperature, total precipitation, and snowfall from January 2019 to December 2021. Here total precipitation includes both rainfall and snowfall. The temperature and total precipitation on the various glaciers in the Qilian Mountains mostly peaked around July. The annual temperature shows a trend of rising first and then falling, but the precipitation among the different glaciers diverges. Overall, the temperature in the Qilian Mountains has had a slightly rising trend in the past three years, but the average annual precipitation has dropped. The glaciers in the west of the Qilian Mountains may have been significantly thinned due to the influence of the western monsoon and the decrease in snowfall in the past two years. The changes in rainfall and snowfall can explain the characteristics of the change in glacier elevation during the year. The temperature contribution to the change in glacier elevation is not as dominant as that of precipitation, especially the snowfall. The entire Qilian Mountains are simultaneously affected by the western monsoon belt and the East Asian monsoon [49]. The footprint of satellite altimetry is unevenly distributed in the study area, which will lead to observation bias. Previous studies using satellite altimetry to observe glaciers also showed large intra- and inter-annual fluctuations [50]. Here we take Laohugou No. 12 Glacier as an example to analyze the response of glacier elevation changes to climate in the Qilian Mountains. For the Laohugou No. 12 Glacier, the snowfall increased, but the glacier thinned from March to June 2019, and the snowfall decreased. Still, the glacier thickened from June to September because most of the June data were located at the edge of the glacier (lower altitude). This would cause its dh value to be underestimated. Similarly, the value of dh in October is therefore underestimated. It can be seen from Figure 13 that both March and September are located in the middle of the glacier (higher altitude). Combined with snowfall data, it can be seen that from March to September 2019, the glacier thickened first and then thinned, so the dh in March and September are almost the same. Identically, from June to October 2019, the glacier first thinned and then thickened, so the dh in June and October were almost the same. Most of the data in March and June 2020 are distributed on the edge of the glacier, which has thickened due to the impact of increased snowfall. However, the data in December 2020 are more distributed in the center of the glacier. The reason for the large fluctuations in the dh value in February and March 2021 is that the data are both distributed near the glacier boundary, and the data volume is small (in Figure 13). The thinning from June to September 2021 is driven by increased rainfall. The data in November 2021 is concentrated in the middle of the glacier, resulting in a relatively large dh value. When we calculate the average annual rate of change of glaciers, the robust least squares used will minimize the error caused by the randomness of the data distribution.
When we analyzed the response of glacier elevation change to climate change using glacier areas with the same data distribution, we got the following conclusions: (1) In the Qilian Mountains, the temperature has little effect on glacier elevation change. (2) Changes in snowfall will affect the degree of glacier thickening. Every year from June to September, is the melting period of glaciers, and most of the precipitation at this time is rainfall, which will thin the glaciers. From October to around May of the following year is the accumulation period of glaciers, which is reflected in the fact that the elevation of glaciers will thicken to varying degrees depending on whether the snowfall is sufficient or not.

5.2. Comparison with Existing Research Results

The current research on the change of glaciers in the Qilian Mountains mainly focuses on the period from 2000 to 2020. Zhang et al. pointed out that the elevation of glaciers in the western Qilian Mountains changed at a rate of −0.35 m per year from 2000 to 2014 [51]. Correspondingly, we found that the elevation of the 9339 Glacier in the west is changing at a rate of −0.99 m per year from 2019 to 2021, which indicates that the rate of thinning of glaciers in the west of the Qilian Mountains has accelerated in recent years. Cai et al. analyzed the temporal and spatial characteristics of glacier changes from 1998 to 2018. They pointed out that the area and volume of glaciers have decreased by 71.12 ± 98.98 km2 and 5.59 ± 4.41 km3, respectively, in the past 20 years [31]. In addition, the area of northern glaciers (Northwest, North, and Northeast) decreased the most. Although we did not study the change in glacier volume, the general volume change and elevation change have the same trend. Our research results also show that the glaciers in the northern Qilian Mountains have thinned from 2019 to 2021. Shen et al. found that the average annual elevation change rate of 9339 Glacier and Laohugou No. 12 Glacier from 2003 to 2020 was −0.2 to 0 m/yr. The average annual change rate of the Shiyang River, Bayi, Suzhu Chain Glacier Group from 2003 to 2020 was −0.8 to −0.5 m/yr [52]. This was not significantly different from the results of our study. However, the average annual change rate of some glaciers in the central Qilian Mountains is −0.8 to −0.2 m/yr, which is different from our research results. It may be that the “elevation-aspect bin analysis method” adopted by Shen et al. is preprocessed based on a 1° × 1° grid, and the distribution of glaciers in the central Qilian Mountains is relatively scattered, which leads to differences in results.

5.3. Advantages and Disadvantages of Using the ALOS DEM with ICESat-2 Data

ICESat-2 data is commonly and reliably used to study the cryosphere due to the unique and advanced single photon counting system used by the platform that offers high vertical detection accuracy. Its 91 days repeat visit cycle allows us to obtain large amounts of data each year, especially at high latitudes, such as the North and South Poles. Large quantities of data are available every month from these regions, and this feature provides us with the opportunity to understand glacier changes at higher temporal resolution (monthly/seasonally) [35]. ICESat-2 has a transmission frequency of 10 kHz, which means that there is a footprint every 0.7 m on the ground. Due to its 6-beam lifting and lowering orbits, a large number of cross orbits can be used, and the cross points of those orbits can be used to monitor changes in glacier elevation. However, due to the operation mode of ICESat-2 itself, that satellite no longer provides consistent repeat visits in the middle and low latitudes. This leads to fluctuations in the distribution of data points in these regions. Additionally, the intersection method can no longer be used to calculate glacier elevation. In some areas, the reduction in the amount of data will increase the uncertainty of the results. This will directly affect the accuracy of the results since, for example, the data from some transects passes along the edge of the glacier rather than over the glacier itself. Although this problem cannot be avoided, the error caused by the uneven distribution of ICESat-2 data in the middle and low latitudes should be systematically analyzed in future research. Unlike the research methods based on stereo pairs and SAR, the uncertainty of ICESat-2 is difficult to eliminate.
The ALOS DEM has a higher resolution than the currently widely used SRTM DEM and capable of reaching 12.5 m. Furthermore, the ALOS DEM uses the same elevation datum as ICESat-2, which eliminates the need for elevation anomaly calculations. However, the L-band of the ALOS satellite can penetrate snow cover to a certain degree, while ICESat-2 cannot. This will inevitably lead to errors related to snow thickness. The pyramid translation registration method proposed in this work comprehensively considers terrain factors such as slope and aspect, but there are still errors related to snow cover.
Since the ICESat-2 satellite was put into use in September 2018, long-term data on glacier elevation changes are not available. However, this study attempts to use 3-years of ICESat-2 data for robust regression to infer the trend of glacier changes. With the increase in available data, the predicted trend of glacier elevation changes and their relationship with climate will be further studied and discussed.

6. Conclusions

In this study, a pyramid matching method was used to register the ALOS DEM and ICESat-2 data to estimate the elevation changes of six glaciers in the Qilian Mountains of the Qinghai-Tibet Plateau. The main conclusions are as follows: (1) The pyramid matching method can achieve the same accuracy as the registration method proposed by Nuth et al. Still, the calculation process is simpler, and the error caused by terrain and elevation can be effectively reduced after registration. (2) The annual change rate of glaciers in the Qilian Mountains is affected by precipitation, temperature, and monsoons, though the impacts of these variables differ. However, in general, the glaciers in the region are either losing ice or in equilibrium. The Gangnalou Glacier is an exception in the region, with an annual increase of 0.74 ± 0.84 m over the past three years. The changes demonstrated by these glaciers are closely related to recent climate changes. Specifically, the glacier at 93.5°E 39.2°N has the fastest rate of loss, with an annual elevation decline of −0.99 ± 0.34 m during the three years of the study, which may be related to its position in the westernmost part of the Qilian Mountains. (3) The change in glacier elevations in the Qilian Mountains have different sensitivities to precipitation and temperature. Among them, changes in precipitation will make a major contribution to the freezing (snowfall) or melting (rainfall) of glaciers.

Author Contributions

Conceptualization, J.Z.; methodology, J.X.; software, J.Z. and R.L.; validation, J.Z., J.X. and X.Y.; resources, R.L. and F.M.; data curation, J.Z.; writing—original draft preparation, J.Z.; writing—review and editing, J.Z. and J.X.; visualization, X.Y.; supervision, J.X.; funding acquisition, J.X. and F.M. All authors have read and agreed to the published version of the manuscript.

Funding

This paper was supported by the National Key R&D Program of China (2020YFE0200800); in part by the Research on Satellite Observation Systems and Application Schemes for the Fine and Fast Stereo-monitoring of Land Space Project support by the Innovative Youth Talents Program, MNR (12110600000018003930); in part by the National Natural Science Foundation of China under Project No.41971426, No.42001416 and No.41571440; in part by the Multi-beam Laser Terrain Detection Radar technology and Application Project D040105.

Data Availability Statement

No new data were created or analyzed in this study. Data sharing does not apply to this article.

Acknowledgments

The authors would like to thank the editors and reviewers for their efforts to help the publication of this work.

Conflicts of Interest

The authors declare no conflict of interest.

References

  1. Clarke, G.K.C. The Mass Balance of the Cryosphere: Observations and Modelling of Contemporary and Future Changes. EOS Trans. Am. Geophys. Union 2004, 85, 230. [Google Scholar] [CrossRef]
  2. Mernild, S.H.; Lipscomb, W.H.; Bahr, D.B.; Radić, V.; Zemp, M. Global glacier changes: A revised assessment of committed mass losses and sampling uncertainties. Cryosphere 2013, 7, 1565–1577. [Google Scholar] [CrossRef] [Green Version]
  3. Hugonnet, R.; McNabb, R.; Berthier, E.; Menounos, B.; Nuth, C.; Girod, L.; Farinotti, D.; Huss, M.; Dussaillant, I.; Brun, F.; et al. Accelerated global glacier mass loss in the early twenty-first century. Nature 2021, 592, 726–731. [Google Scholar] [CrossRef] [PubMed]
  4. Oerlemans, J.; Knap, W.H. A 1 year record of global radiation and albedo in the ablation zone of Morteratschgletscher, Switzerland. J. Glaciol. 2017, 44, 231–238. [Google Scholar] [CrossRef] [Green Version]
  5. Gardner, A.S.; Moholdt, G.; Cogley, J.G.; Wouters, B.; Arendt, A.A.; Wahr, J.; Berthier, E.; Hock, R.; Pfeffer, W.T.; Kaser, G.; et al. A reconciled estimate of glacier contributions to sea level rise: 2003 to 2009. Science 2013, 340, 852–857. [Google Scholar] [CrossRef] [Green Version]
  6. Sun, Y.; Jiang, L.; Liu, L.; Sun, Q.; Wang, H.; Hsu, H. Mapping Glacier Elevations and Their Changes in the Western Qilian Mountains, Northern Tibetan Plateau, by Bistatic InSAR. IEEE J. Sel. Top. Appl. Earth Obs. Remote Sens. 2017, 11, 68–78. [Google Scholar] [CrossRef]
  7. Liu, Y.; Qin, D.; Li, Y.; Qin, X.; Li, Z.; Wang, J.; Jin, Z.; Wang, L. Changes in the Surface Elevation of the Laohugou Glacier No. 12 in Western Qilian Mountains. Front. Earth Sci. 2022, 10, 832701. [Google Scholar] [CrossRef]
  8. Zhao, P.; He, Z. A First Evaluation of ERA5-Land Reanalysis Temperature Product Over the Chinese Qilian Mountains. Front. Earth Sci. 2022, 10, 907730. [Google Scholar] [CrossRef]
  9. Finkelnburg, R.; Curio, J.; Collier, E.; Mölg, T.; Scherer, D.; Maussion, F. Precipitation Seasonality and Variability over the Tibetan Plateau as Resolved by the High Asia Reanalysis. J. Clim. 2014, 27, 1910–1927. [Google Scholar]
  10. Wang, Q.; Yi, S.; Chang, L.; Sun, W. Large-Scale Seasonal Changes in Glacier Thickness Across High Mountain Asia. Geophys. Res. Lett. 2017, 44, 10427–10435. [Google Scholar] [CrossRef]
  11. Zhang, G.; Yao, T.; Shum, C.; Yi, S.; Yang, K.; Xie, H.; Feng, W.; Bolch, T.; Wang, L.; Behrangi, A. Lake volume and groundwater storage variations in Tibetan Plateau’s endorheic basin. Geophys. Res. Lett. 2017, 44, 5550–5560. [Google Scholar] [CrossRef]
  12. Nuth, C.; Kääb, A. Co-registration and bias corrections of satellite elevation data sets for quantifying glacier thickness change. Cryosphere 2011, 5, 271–290. [Google Scholar] [CrossRef] [Green Version]
  13. Wang, Q.; Yi, S.; Sun, W. Precipitation-driven glacier changes in the Pamir and Hindu Kush mountains. Geophys. Res. Lett. 2017, 44, 2817–2824. [Google Scholar] [CrossRef]
  14. Wang, S.; Zhang, M.; Li, Z.; Wang, F.; Li, H.; Li, Y.; Huang, X. Glacier area variation and climate change in the Chinese Tianshan Mountains since 1960. J. Geogr. Sci. 2011, 21, 263–273. [Google Scholar] [CrossRef]
  15. Muskett, R.R.; Lingle, C.S.; Sauber, J.M.; Post, A.S.; Tangborn, W.V.; Rabus, B.T.; Echelmeyer, K.A. Airborne and spaceborne DEM- and laser altimetry-derived surface elevation and volume changes of the Bering Glacier system, Alaska, USA, and Yukon, Canada, 1972–2006. J. Glaciol. 2009, 55, 316–326. [Google Scholar] [CrossRef] [Green Version]
  16. Rignot, E.; Rivera, A.; Casassa, G. Contribution of the Patagonia Icefields of South America to Sea Level Rise. Science 2003, 302, 434–437. [Google Scholar] [CrossRef] [PubMed] [Green Version]
  17. Sund, M.; Eiken, T.; Hagen, J.O.; Kaab, A. Svalbard surge dynamics derived from geometric changes. Ann. Glaciol. 2009, 50, 50–60. [Google Scholar] [CrossRef] [Green Version]
  18. Zhang, Y.; Liu, S.; Shangguan, D.; Li, J.; Zhao, J. Thinning and shrinkage of Laohugou No. 12 glacier in the Western Qilian Mountains, China, from 1957 to 2007. J. Mt. Sci. 2012, 9, 343–350. [Google Scholar] [CrossRef]
  19. Ren, S.; Li, X.; Wang, Y.; Zheng, D.; Jiang, D.; Nian, Y.; Zhou, Y. Multitemporal Glacier Mass Balance and Area Changes in the Puruogangri Ice Field during 1975–2021 Based on Multisource Satellite Observations. Remote Sens. 2022, 14, 4078. [Google Scholar] [CrossRef]
  20. Fujisada, H.; Bailey, G.B.; Kelly, G.G.; Hara, S.; Abrams, M.J. ASTER DEM performance. IEEE Trans. Geosci. Remote Sens. 2005, 43, 2707–2714. [Google Scholar] [CrossRef]
  21. Toutin, T. Three-dimensional topographic mapping with ASTER stereo data in rugged topography. IEEE Trans. Geosci. Remote Sens. 2002, 40, 2241–2247. [Google Scholar] [CrossRef]
  22. Kacimi, S.; Kwok, R. Arctic Snow Depth, Ice Thickness, and Volume From ICESat-2 and CryoSat-2: 2018–2021. Geophys. Res. Lett. 2022, 49, e2021GL097448. [Google Scholar] [CrossRef]
  23. Lai, Y.-R.; Wang, L. Monthly Surface Elevation Changes of the Greenland Ice Sheet From ICESat-1, CryoSat-2, and ICESat-2 Altimetry Missions. IEEE Geosci. Remote Sens. Lett. 2022, 19, 1–5. [Google Scholar] [CrossRef]
  24. Michaelides, R.J.; Bryant, M.B.; Siegfried, M.R.; Borsa, A.A. Quantifying Surface-Height Change Over a Periglacial Environment With ICESat-2 Laser Altimetry. Earth Space Sci. 2021, 8, e2020EA001538. [Google Scholar] [CrossRef] [PubMed]
  25. Yue, L.; Shen, H.; Zhang, L.; Zheng, X.; Zhang, F.; Yuan, Q. High-quality seamless DEM generation blending SRTM-1, ASTER GDEM v2 and ICESat/GLAS observations. ISPRS J. Photogramm. Remote Sens. 2017, 123, 20–34. [Google Scholar] [CrossRef] [Green Version]
  26. Nuimura, T.; Fujita, K.; Yamaguchi, S.; Sharma, R.R. Elevation changes of glaciers revealed by multitemporal digital elevation models calibrated by GPS survey in the Khumbu region, Nepal Himalaya, 1992–2008. J. Glaciol. 2017, 58, 648–656. [Google Scholar] [CrossRef] [Green Version]
  27. Gardelle, J.; Berthier, E.; Arnaud, Y. Slight mass gain of Karakoram glaciers in the early twenty-first century. Nat. Geosci. 2012, 5, 322–325. [Google Scholar] [CrossRef]
  28. Kaab, A.; Berthier, E.; Nuth, C.; Gardelle, J.; Arnaud, Y. Contrasting patterns of early twenty-first-century glacier mass change in the Himalayas. Nature 2012, 488, 495–498. [Google Scholar] [CrossRef]
  29. Moholdt, G.; Nuth, C.; Hagen, J.O.; Kohler, J. Recent elevation changes of Svalbard glaciers derived from ICESat laser altimetry. Remote Sens. Environ. 2010, 114, 2756–2767. [Google Scholar] [CrossRef]
  30. Sun, M.; Ma, W.; Yao, X.; Zhao, L.; Li, Z.; Qin, D. Evaluation and spatiotemporal characteristics of glacier service value in the Qilian Mountains. J. Geogr. Sci. 2020, 30, 1233–1248. [Google Scholar] [CrossRef]
  31. Cai, X.; Li, Z.; Xu, C. Glacier wastage and its vulnerability in the Qilian Mountains. J. Geogr. Sci. 2022, 32, 117–140. [Google Scholar] [CrossRef]
  32. Xu, Z.; Zhao, C.; Feng, Z.; Zhang, F.; Sher, H.; Wang, C.; Peng, H.; Wang, Y.; Zhao, Y.; Wang, Y. Estimating realized and potential carbon storage benefits from reforestation and afforestation under climate change: A case study of the Qinghai spruce forests in the Qilian Mountains, northwestern China. Mitig. Adapt. Strateg. Glob. Chang. 2013, 18, 1257–1268. [Google Scholar] [CrossRef]
  33. Kraaijenbrink, P.D.; Bierkens, M.; Lutz, A.; Immerzeel, W. Impact of a global temperature rise of 1.5 degrees Celsius on Asia’s glaciers. Nature 2017, 549, 257–260. [Google Scholar] [CrossRef] [PubMed]
  34. Webster, P.J.; Magaña, V.O.; Palmer, T.N.; Shukla, J.; Tomas, R.A.; Yanai, M.; Yasunari, T. Monsoons: Processes, predictability, and the prospects for prediction. J. Geophys. Res. Ocean. 1998, 103, 14451–14510. [Google Scholar] [CrossRef]
  35. Guo, S.; Chen, R.; Li, H. Surface Sublimation/Evaporation and Condensation/Deposition and Their Links to Westerlies During 2020 on the August-One Glacier, the Semi-Arid Qilian Mountains of Northeast Tibetan Plateau. J. Geophys. Res. Atmos. 2022, 127, e2022JD036494. [Google Scholar] [CrossRef]
  36. Markus, T.; Neumann, T.; Martino, A.; Abdalati, W.; Brunt, K.; Csatho, B.; Farrell, S.; Fricker, H.; Gardner, A.; Harding, D. The Ice, Cloud, and land Elevation Satellite-2 (ICESat-2): Science requirements, concept, and implementation. Remote Sens. Environ. 2017, 190, 260–273. [Google Scholar] [CrossRef]
  37. Neumann, T.A.; Martino, A.J.; Markus, T.; Bae, S.; Bock, M.R.; Brenner, A.C.; Brunt, K.M.; Cavanaugh, J.; Fernandes, S.T.; Hancock, D.W. The Ice, Cloud, and Land Elevation Satellite-2 mission: A global geolocated photon product derived from the Advanced Topographic Laser Altimeter System. Remote Sens. Environ. 2019, 233, 111325. [Google Scholar] [CrossRef] [PubMed]
  38. Zhang, Y.; Pang, Y.; Cui, D.; Ma, Y.; Chen, L. Accuracy Assessment of the ICESat-2/ATL06 Product in the Qilian Mountains Based on CORS and UAV Data. IEEE J. Sel. Top. Appl. Earth Obs. Remote Sens. 2021, 14, 1558–1571. [Google Scholar] [CrossRef]
  39. Li, R.; Li, H.; Hao, T.; Qiao, G.; Cui, H.; He, Y.; Hai, G.; Xie, H.; Cheng, Y.; Li, B. Assessment of ICESat-2 ice surface elevations over the Chinese Antarctic Research Expedition (CHINARE) route, East Antarctica, based on coordinated multi-sensor observations. Cryosphere 2021, 15, 3083–3099. [Google Scholar] [CrossRef]
  40. Brunt, K.M.; Neumann, T.A.; Smith, B.E. Assessment of ICESat-2 Ice Sheet Surface Heights, Based on Comparisons Over the Interior of the Antarctic Ice Sheet. Geophys. Res. Lett. 2019, 46, 13072–13078. [Google Scholar] [CrossRef] [Green Version]
  41. Kawata, Y.; Funatsu, Y.; Yoshii, S.; Takemata, K. Accuracy analysis of DEM extraction over Japan using ALOS PRISM stereo images. In Proceedings of the Earth Resources and Environmental Remote Sensing/GIS Applications II, Prague, Czech Republic, 20–22 September 2011; pp. 13–21. [Google Scholar]
  42. Yan, S.; Guo, H.; Liu, G.; Ruan, Z. Mountain glacier displacement estimation using a DEM-assisted offset tracking method with ALOS/PALSAR data. Remote Sens. Lett. 2013, 4, 494–503. [Google Scholar] [CrossRef]
  43. Yang, S.; Li, R.; Wu, T.; Hu, G.; Xiao, Y.; Du, Y.; Zhu, X.; Ni, J.; Ma, J.; Zhang, Y. Evaluation of reanalysis soil temperature and soil moisture products in permafrost regions on the Qinghai-Tibetan Plateau. Geoderma 2020, 377, 114583. [Google Scholar] [CrossRef]
  44. Li, T.; Dawson, G.J.; Chuter, S.J.; Bamber, J.L. A high-resolution Antarctic grounding zone product from ICESat-2 laser altimetry. Earth Syst. Sci. Data 2022, 14, 535–557. [Google Scholar] [CrossRef]
  45. Fisher, P. Improved modeling of elevation error with geostatistics. Geoinformatica 1998, 2, 215–233. [Google Scholar] [CrossRef]
  46. Li, Z. On the measure of digital terrain model accuracy. Photogramm. Rec. 1988, 12, 873–877. [Google Scholar] [CrossRef]
  47. Berthier, E.; Arnaud, Y.; Vincent, C.; Rémy, F. Biases of SRTM in high-mountain areas: Implications for the monitoring of glacier volume changes. Geophys. Res. Lett. 2006, 33, 8502-1–8502-5. [Google Scholar] [CrossRef]
  48. Surazakov, A.B.; Aizen, V.B. Estimating volume change of mountain glaciers using SRTM and map-based topographic data. IEEE Trans. Geosci. Remote Sens. 2006, 44, 2991–2995. [Google Scholar] [CrossRef]
  49. Guo, X.; Feng, Q.; Si, J.; Zhang, X. Considerable influences of recycled moistures and summer monsoons to local precipitation on the northeastern Tibetan Plateau. J. Hydrol. 2022, 605, 127343. [Google Scholar] [CrossRef]
  50. Wang, Q.; Yi, S.; Sun, W. Continuous estimates of glacier mass balance in high mountain Asia based on ICESat-1, 2 and GRACE/GRACE follow-on data. Geophys. Res. Lett. 2021, 48, e2020GL090954. [Google Scholar] [CrossRef]
  51. Zhang, Q.; Kang, S. Glacier elevation change in the Western Qilian mountains as observed by TerraSAR-X/TanDEM-X images. Geocarto Int. 2021, 36, 1365–1377. [Google Scholar] [CrossRef]
  52. Shen, C.; Jia, L.; Ren, S. Inter- and Intra-Annual Glacier Elevation Change in High Mountain Asia Region Based on ICESat-1&2 Data Using Elevation-Aspect Bin Analysis Method. Remote Sens. 2022, 14, 1630. [Google Scholar]
Figure 1. An overview of the Qilian Mountains on the northeastern edge of the Qinghai-Tibet Plateau. (a) Dunde Ice Cap (b) Glacier at 93.5°E 39.2°N (c) Laohugou No. 12 Glacier (and its surrounding glaciers) (d) Glacier at 97.2°E 38.7°N (e) Gangnalou Glacier (and its surrounding glaciers) (f) Shiyang River, Bayi, Suzhu Chain Glacier Group.
Remotesensing 15 00062 g001
Figure 2. Technical flow chart.
Remotesensing 15 00062 g002
Figure 3. Schematic diagram of the registration data distribution. The blue and green points are the ICESat-2 data points located on nonglacial and glacial terrains, respectively.
Remotesensing 15 00062 g003
Figure 4. Schematic diagram of the principle of the pyramid registration method. The center of each layer represents the RMSE value of the elevation difference without translation, and each layer defines its own required step distance (the translation distance is represented by each grid). As the step distance decreases, the registration becomes increasingly accurate. The red, blue and yellow point represent the position of the minimum point during the registration of the first layer, second layer and third layer respectively, which is taken as the center point of the second layer, third layer and of the fourth layer.
Remotesensing 15 00062 g004
Figure 5. Schematic diagram of the pyramid registration result. (a) Gangnalou Glacier, (b) Laohugou No. 12 Glacier, (c) Dunde Ice Cap, (d) the 93.5°E 39.2°N Glacier, (e) Shiyang River, Bayi, and Suzhulian Glacier Group, and (f) the 97.2°E 38.7°N Glacier. The values in the squares represent the dh RMSE, where ICESat-2 and the ALOS DEM are located on stable terrain. Each axis scale unit represents the resolution of the corresponding layer. For example, the first column is the first layer registration (5 m resolution), that is, one grid represents 5 m. The second column is the second layer registration (0.5 m resolution), that is, one grid represents 0.5 m.
Remotesensing 15 00062 g005
Figure 6. Pyramid registration result check. Using the same resolution as the third-level pyramid registration, the minimum point is marked in red, and the center point means that translation registration is no longer needed. (a) Gangnalou Glacier, (b) Laohugou No. 12 Glacier, (c) Dunde Ice Cap, (d) the 93.5°E 39.2°N Glaci-er, (e) Shiyang River, Bayi, and Suzhulian Glacier Group, and (f) the 97.2°E 38.7°N Glacier.
Remotesensing 15 00062 g006
Figure 7. Altitude-dependent related bias correction. (af) represent Gangnalou Glacier, Laohugou No. 12 Glacier, Dunde Ice Cap, the 93.5°E 39.2°N Glacier, Shiyang River, Bayi, Suzhulian Glacier Group and the 97.2°E 38.7°N Glacier, respectively. The black dots represent the mean value of all elevation differences within every 50 m in the nonglacial elevation interval, the error bar represents the standard deviation of the elevation differences in this bin, and the red line is the related elevation difference trend fitted by the least squares.
Remotesensing 15 00062 g007
Figure 8. Probability density distribution of elevation difference before and after registration and correction. Blue represents the distribution prior to registration and correction, and red indicates the distribution after registration and correction. (af) represent Gangnalou Glacier, Laohugou No. 12 Glacier, Dunde Ice Cap, the 93.5°E 39.2°N Glacier, Shiyang River, Bayi, Suzhulian Glacier Group and the 97.2°E 38.7°N Glacier, respectively.
Remotesensing 15 00062 g008
Figure 9. Average annual rate of change of glaciers from 2019 to 2021, where each point represents the median difference of dh between the ICESat-2 data and the ALOSDEM data for that day, and the error bars represent the standard deviation of dh. Red is the nonglacial area, blue is the glacial area, and the dashed line is the annual glacier change rate fitted using the robust least squares regression.
Remotesensing 15 00062 g009
Figure 11. Yearly change in glacier elevation. The blue line is 2019, the red line is 2020, and the green line is 2021. dh is the elevation difference between the current year and 2007. Each point corresponds to the corresponding glacier point in Figure 9, which is the median value of dh.
Remotesensing 15 00062 g011
Figure 10. Distribution of annual average change rate of glacier elevation.
Remotesensing 15 00062 g010
Figure 12. Monthly average temperature, monthly average total precipitation, and monthly average snowfall (mm of water equivalent) in six glacial regions from 2019 to 2021.
Remotesensing 15 00062 g012
Figure 13. The distribution of some ICESat-2 data on Laohugou No. 12 Glacier. Redder background colors indicate higher elevations, and higher elevations (the middle of the glacier) are more likely to thicken than lower elevations (the glacier’s edge).
Remotesensing 15 00062 g013
Table 1. Comparison of registration results.
RegionBefore RegistrationPyramid MethodMethod of Nuth et al. [12] Number of Foot Points
Mean (m)RMSE (m)Mean (m)RMSE (m)Mean (m)RMSE (m)
Gangnalou−0.383.630.0352.88−0.042.9415,178
Laohugou No. 12−0.794.65−0.184.14−0.184.098861
Dunde−0.263.63−0.083.210.063.185155
93.5°E
39.2°N
−1.324.43−0.183.690.143.729986
Shiyang River, Bayi, Suzhulian−1.144.62−0.163.910.093.945965
97.2°E 38.7°N−1.993.56−0.062.510.062.5110,883
Table 2. Offset vector size. X direction offsets to the east are positive, and Y direction offsets to the south are positive.
Glacier AreaX DirectionY DirectionZ Direction
Gangnalou−6.2 m−0.1 m−0.76 m
Laohugou No. 12−2.45 m0.2 m−1.01 m
Dunde−3.45 m1.25 m−0.35 m
93.5°E
39.2°N
−6.5 m−2 m−1.72 m
Shiyang River, Bayi, Suzhulian−4.45 m1.35 m−1.16 m
97.2°E
38.7°N
−7.7 m−1.1 m−1.85 m
Table 3. Average annual rate of change in glacier elevation.
Glacier NameChange Rate of Elevation per Year
Gangnalou0.74 ± 0.84 m
Laohugou No. 12−0.08 ± 0.79 m
Dunde0.09 ± 0.94 m
93.5°E
39.2°N
−0.99 ± 0.34 m
Shiyang River, Bayi, Suzhulian−0.27 ± 0.77 m
97.2°E
38.7°N
−0.16 ± 0.85 m
Disclaimer/Publisher’s Note: The statements, opinions and data contained in all publications are solely those of the individual author(s) and contributor(s) and not of MDPI and/or the editor(s). MDPI and/or the editor(s) disclaim responsibility for any injury to people or property resulting from any ideas, methods, instructions or products referred to in the content.

