Article

A Prediction Model of Maize Field Yield Based on the Fusion of Multitemporal and Multimodal UAV Data: A Case Study in Northeast China

1
College of Engineering, Northeast Agricultural University, Harbin 150030, China
2
School of Water Conservancy & Civil Engineering, Northeast Agricultural University, Harbin 150030, China
3
Department of Industrial and Manufacturing Systems Engineering, The University of Hong Kong, LG-108, Composite Building, Pokfulam Road, Hong Kong 999077, China
*
Author to whom correspondence should be addressed.
Remote Sens. 2023, 15(14), 3483; https://doi.org/10.3390/rs15143483
Submission received: 16 June 2023 / Revised: 8 July 2023 / Accepted: 9 July 2023 / Published: 11 July 2023
(This article belongs to the Special Issue Crop Quantitative Monitoring with Remote Sensing)

Abstract

:
The prediction of crop yield plays a crucial role in national economic development, encompassing grain storage, processing, and grain price trends. Employing multiple sensors to acquire remote sensing data and utilizing machine learning algorithms can enable accurate, fast, and nondestructive yield prediction for maize crops. However, current research heavily relies on single-type remote sensing data and traditional machine learning methods, resulting in the limited robustness of yield prediction models. To address these limitations, this study introduces a field-scale maize yield prediction model named the convolutional neural network–attention–long short-term memory network (CNN-attention-LSTM) model, which utilizes multimodal remote sensing data collected by multispectral and light detection and ranging (LIDAR) sensors mounted on unmanned aerial vehicles (UAVs). The model incorporates meteorological data throughout the crop reproductive stages and employs the normalized difference vegetation index (NDVI), normalized difference red edge (NDRE), soil-adjusted vegetation index (SAVI), and enhanced vegetation index (EVI) for the initial part of the vegetative stage (initial part of the V period), the later part of the vegetative stage (later part of the V period), the reproductive stage (R period), and the maturity stage (M period), along with LIDAR data for Point75–100 in the later part of the V period, Point80–100 in the R period, and Point50–100 in the M period, complemented by corresponding meteorological data as inputs. The resulting yield estimation demonstrates exceptional performance, with an R2 value of 0.78 and an rRMSE of 8.27%. These results surpass previous research and validate the effectiveness of multimodal data in enhancing yield prediction models. Furthermore, to assess the superiority of the proposed model, four machine learning algorithms—multiple linear regression (MLR), random forest regression (RF), support vector machine (SVM), and backpropagation (BP)—are compared to the CNN-attention-LSTM model through experimental analysis. The outcomes indicate that all alternative models exhibit inferior prediction accuracy compared to the CNN-attention-LSTM model. Across the test dataset within the study area, the R2 values for various nitrogen fertilizer levels consistently exceed 0.75, illustrating the robustness of the proposed model. This study introduces a novel approach for assessing maize crop yield and provides valuable insights for estimating the yield of other crops.

Graphical Abstract

1. Introduction

Yield, as the ultimate goal of agricultural cultivation, serves as the most direct economic parameter for evaluating field productivity [1]. Maize, one of the world’s major cereal crops, holds significant value in terms of food consumption, feed processing, and industrial production [2]. Monitoring of the early stages of maize growth can improve crop fertility management. Correct yield estimation using UAV remote sensing technology is not only valuable for the economic decision-making and marketing layout of corn crop in that year but can also play a vital role in agricultural development [3,4]. Traditional monitoring of maize crops during reproductive stages typically involves destructive field sampling, while yield assessment relies on on-site information surveys conducted during the harvest season. However, these conventional methods are characterized by time-consuming and labor-intensive procedures, high costs, and the need for data reliability assessment, particularly when dealing with multitemporal data. Consequently, optimizing maize crop monitoring methods and establishing highly accurate yield prediction models for maize crops have emerged as pressing issues.
The advent of remote sensing technology has made the continuous monitoring of crop reproductive stages and yield assessment feasible [5]. Currently, remote sensing monitoring methods can be classified into satellite remote sensing and unmanned aerial vehicle (UAV) remote sensing. Satellite remote sensing provides broad coverage and low costs; however, it is susceptible to weather conditions and suffers from limitations such as lower spatial resolution compared to UAV imagery, which restricts its capacity for the high-frequency monitoring of crops at smaller spatial scales [6]. UAVs equipped with diverse sensor types enable the rapid acquisition of crop growth information, leading to their extensive application in crop yield assessment, nutrient diagnosis, growth characteristic evaluation, and more [7]. Presently, various UAV sensors, including light detection and ranging (LIDAR), multispectral, and RGB cameras, have demonstrated immense potential in crop monitoring [8]. Multispectral imagery allows for the calculation of vegetation indices (VIs) that reflect crop growth conditions and facilitate yield estimation [9]. Onboard LIDAR systems accurately capture three-dimensional vegetation information, thereby improving the accuracy of vegetation parameter estimation during different crop reproductive stages. For instance, Liang et al. [10] predicted rice yield in small-scale fields in southern China by integrating RGB and multispectral imagery while monitoring leaf chlorophyll content (LCC) during reproductive stages using the normalized difference yellow index (NDYI). Patricia et al. [11] predicted grape yield using RGB spectral data and improved the linear relationship through spectral data integration. Gong et al. [12] estimated canola seed yield by utilizing canopy information and abundance data derived from UAV multispectral imagery, demonstrating that the product of normalized VI and short-stem leaf abundance provided the most accurate estimate of canola yield under varying nitrogen treatments. Yi et al. [13] collected multitemporal soybean remote sensing data using hyperspectral, LIDAR, and multispectral sensors, and estimated the leaf area index (LAI) through machine learning techniques. Luo et al. [14] predicted the height of maize and soybean crops using LIDAR point cloud data and compared the accuracy of height prediction at different point densities. The aforementioned studies confirm that, compared to other methods, UAV remote sensing enables the more effective monitoring of crop growth and yield prediction across diverse crop types.
In recent research, the integration of remote sensing data with various machine learning algorithms has been employed for crop yield prediction and analysis, considering the influence of nonlinear growth characteristics of crops across multiple temporal phases [15]. Nonlinear machine learning models have demonstrated superior performance compared to traditional linear regression models. For instance, Tian et al. [16] integrated two remote sensing indicators with meteorological data using LSTM networks to estimate wheat yield. Tian et al. [17] developed an IPSO-BP neural network that assigned different weights to VIs and LAI during different reproductive stages to establish a yield regression model for yield estimation. Yang et al. [18] trained a convolutional neural network (CNN) classification model using hyperspectral imagery to extract spectral and RGB information relevant to maize characteristics, enabling maize yield estimation.
However, previous yield prediction models predominantly relied on UAV remote sensing data from a single sensor, failing to effectively utilize multimodal crop information. The fusion of multimodal data can overcome the limitations of unimodal features primarily based on one-dimensional spectral information or two-dimensional RGB imagery. It allows for the effective extraction of multidimensional structural features of crops, thereby enhancing yield prediction accuracy. Multimodal data fusion has attracted significant attention and has been widely applied in various fields. For instance, Mou et al. [19] employed CNN and long short-term memory (LSTM) models to fuse nonintrusive data and develop a driver stress detection model. Multimodal data fusion has also been applied to yield prediction. Ma et al. [20] proposed a novel winter wheat yield prediction model based on multimodal imagery, demonstrating superior performance compared to individual modes. Fei et al. [21] fused data from multiple sensors on UAVs using machine learning methods to enhance crop prediction accuracy. Although these studies effectively integrated multimodal remote sensing data, they did not fully incorporate the multitemporal information of crops.
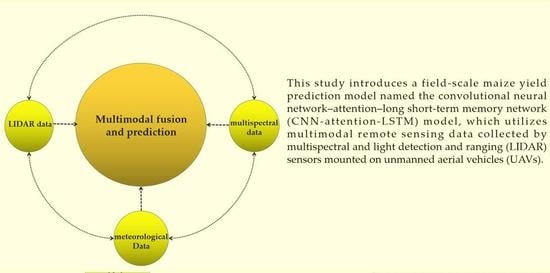
The main objective of this study is to predict maize yield through an innovative fusion model based on multitemporal and multimodal UAV data. To effectively capture the nonlinear features of different data modalities, this study combines the attention mechanism with the CNN-LSTM model to integrate multispectral, LIDAR, and meteorological data. Based on the above issues, the specific objectives of this study are as follows:
  • Build the CNN-attention-LSTM network model. The model is used to fuse relevant growth parameters and climate data for multiple fertility stages of maize and to make yield predictions.
  • Provide a comparison of the effects of different reproductive stages and sensor combinations on the yield prediction model. An evaluation of optimal multitemporal and multimodal maize yield predictor combinations is performed.
  • Evaluate the model robustness using data collected in the test area; the adaptability of the proposed CNN-attention-LSTM model to predict maize yield under different fertilization treatments is also verified.

2. Materials and Methods

2.1. Study Area and Field Experimental Design

Field experiments were conducted from May to October 2022 at Xiangyang Farm (45°72′N, 126°68′E) in Harbin, Heilongjiang Province, China, to collect multimodal and multitemporal growth data of maize under different nitrogen fertilizer conditions (Figure 1a). The study area is located in the northeastern part of China and experiences a cold temperate climate, with an average effective accumulated temperature of 2800 °C and an annual average precipitation of 400–600 mL. The soil in the experimental area is classified as a Mollisol (i.e., black soil) by the United States Department of Agriculture, with a pH of 6.11 and a thickness of the humus layer of approximately 50 cm.
Maize was sown in the experimental area on 7 May 2022. To enhance the generalizability of the model developed in this study, the experimental area was divided into a training zone (Figure 1b) and a validation zone (Figure 1c). The training zone adopted a complete randomized block design, with 6 different nitrogen fertilizer treatments replicated 3 times. Each experimental plot in the training zone had an area of 3.5 × 15 m2, resulting in a total of 18 experimental blocks (Figure 1b). During the V3–V6 phenological periods, 5 rounds of liquid nitrogen fertilizer and 1 round of solid nitrogen fertilizer were applied. Based on the soil conditions in the experimental area and regional recommendations, the 5 rounds of liquid nitrogen fertilizer (45% N in liquid urea solution) had the following application rates: 0, 50, 100, 150, and 200 kg/ha. The solid nitrogen fertilizer (45% N in solid urea mixture) was applied at a rate of 150 kg/ha. The same N fertilizer treatments were used in the validation zone, and five replicate trials were conducted for each group of N fertilizer. Each experimental plot in the training zone had an area of 5 × 20 m2.

2.2. Data Collection

This study conducted data collection for maize yield, field information during key phenological stages, meteorological data, and remote sensing data including multispectral and LIDAR data obtained from UAVs.

2.2.1. UAV Data Collection

The remote sensing data were acquired using the DJI M300RTK UAV platform throughout the maize growth period in 2022, specifically during clear and cloudless weather conditions between 10:00 and 14:00 (Table 1). Vi is the i-th stage of the vegetative stage, and Ri is the i-th stage of the reproductive stage. The UAV platform was equipped with both a multispectral sensor and a LIDAR sensor.
The multispectral data were collected using a Changguang Yuchen MS600pro sensor (Changchun, China), which has a spectral range of 400–900 nm and a ground spatial resolution of 8.6 cm at flying height. The sensor had an 80% side overlap rate and an 80% forward overlap rate. LIDAR data were captured using a DJI L1 sensor (China), with a flight altitude set at 30 m and a point cloud density of 300 m2. The sampling was performed at a frequency of 160 Hz (Figure 2), and the spatial separation rate is about 1500 pixels/m. All flight missions were autonomously conducted, maintaining a flight altitude of 30 m and a flight speed of 1.2 m/s.

2.2.2. Field Data Collection

Field measurements were conducted on the same day as the completion of UAV flight missions during key phenological stages.
During the nutritional growth and early reproductive stages of maize, 15 sample plants were randomly selected and sampled in each experimental block. The coordinates of the sampling points were recorded to determine the location information. The natural plant height (PH) of the sample plants was measured using a measuring tape [22]. The relative chlorophyll content of the sample plants with fully expanded leaves during the corresponding period was nondestructively measured using a soil plant analysis development (SPAD) chlorophyll meter. Equation (1) was employed to convert SPAD values into LCC. Following the measurement of SPAD values, the corresponding maize leaf samples were collected and placed in self-sealing bags, which were then transported to the laboratory. The nitrogen content of the samples was analyzed using an elemental analyzer (EuroVector, Italy, Model: EA3000).
y = 1.02008 x 1
In Equation (1), y represents the LCC of maize leaves, and x represents the SPAD value of maize leaves [23].
In this study, the LAI of maize was determined using destructive sampling. The sampled leaves were collected and brought to the laboratory for the measurement of leaf area in m2. LAI was then calculated using Equation (2).
L A I = L A i × D
The average value of three samples was considered as the individual plant leaf area (LAi). D is the planting density of maize, and LAI is the leaf area index of maize leaves.
In addition, representative plants were selected from each plot at various reproductive stages. The roots were pruned, and the aboveground parts were cleaned. The samples were then dried at 105 °C for desiccation and further dried at 80 °C until a constant weight was achieved. The aboveground biomass (AGB) of each sample was measured using a balance and converted to plot-level AGB (g/m2) based on the planting density.
In this study, the actual yield of maize was measured in the field at the finishing stage of maturity (R6). During the R6 of maize, a designated area measuring 10 m × 2.2 m (4 rows in the middle of the plot) was manually harvested in each plot to determine the actual yield [24]. The harvested maize crops were transported to the laboratory, threshed, and adjusted to a standard moisture content of 14%. The number of rows, number of grains per row, and weight of 500 grains were measured from the harvested maize ears. The maize yield was calculated by weighing the grains from the sampled area and applying a weightage factor (Figure 2). Additionally, this study assessed the impact of different nitrogen application rates on maize yield by evaluating the apparent nitrogen use efficiency (aNUE) using Equation (3).
aNUE = ( C N i C N 0 ) / N i
where CNi represents the maize yield at the ith nitrogen level, CN0 represents the maize yield without nitrogen application, and Ni represents the nitrogen content at the ith level.

2.2.3. Meteorological Data

Daily meteorological data for the experimental area during the 2022 growing season were obtained from the website of the China National Meteorological Science Data Center [25]. The dataset included 6 meteorological variables: daily total precipitation (mm/day), daily average temperature (°C), daily maximum temperature (°C), daily minimum temperature (°C), vapor pressure (hPa), and daily total solar radiation (KJ m−2 day−1). These variables were collected and used as input variables for yield prediction.

2.3. Data Processing and Dataset Construction

This study involved 4 main processes: data preprocessing, feature extraction, multimodal feature fusion, and yield prediction. This section focuses on the data preprocessing process.

2.3.1. Point Cloud Data Processing

LIDAR point cloud data were processed using Pix4D Mapper software to remove noise and generate a LAS dataset. Additionally, a digital surface model (DSM) and a dense point cloud with a resolution of 0.1 m × 0.1 m were obtained.
Based on the results of the acquired field data, this study extracted maize structural information by means of further hierarchical extraction of the processed point cloud data using Agisoft and selecting the optimal parameters. The point cloud data were divided into different levels (i.e., five-level, four-level, and two-level) based on their heights, starting from lower levels to higher levels. Specifically, the five-level point cloud data were labeled as Point0–20, Point20–40, Point40–60, Point60–80, and Point80–100. The four-level point cloud data were labeled as Point0–25, Point25–50, Point50–75, and Point75–100. The two-level point cloud data were labeled as Point0–50 and Point50–100.
To obtain a digital elevation model (DEM), the point cloud data were classified into ground points and crop points using the cloth simulation filter (CSF) algorithm. The CSF algorithm assumes the natural fall of a cloth onto the terrain, and the resulting shape represents the terrain. By fitting the ground points, a DEM was generated. The basic equation of the CSF algorithm is shown in Equation (4).
m X ( t ) t 2 = F e x t ( X , t ) + F int ( X , t )
where X represents the position of particles on the surface of the “fabric” at time t, which is influenced by the external driving factor Fext (X,t) and the internal driving factor Fint (X,t). Assuming that only the external factor has an influence, the internal driving factor is set to 0, and their relationship is described by Equation (5).
X ( t + Δ t ) = 2 X ( t ) X ( t Δ t ) + G m Δ t 2
where m represents the weight of fabric particles and ∆t represents the time step used to calculate the iterative position of particles. Additionally, the internal factor Fint (X,t) can control the issue of particle inversion in blank areas (Equation (6)). By incorporating both the internal and external factors, the height differences between the LIDAR point cloud and particles are calculated, resulting in the classification of ground points.
d = 1 2 b ( p i p 0 ) n
where d represents the displacement of particles and n represents the unit vector normalized in the vertical direction.
DSM and DEM models are imported into ArcGIS (ArcGIS, Esri.Inc., Redlands, CA, USA) and processed using raster tools to generate the canopy height model (CHM) as described in Equation (7). It is crucial to ensure that the grids of the DSM and DEM are properly aligned during the calculation process.
C H M = D S M D E M
The CHM contains information about the natural height and canopy coverage of maize crops. The highest point of the individual maize crop’s canopy can be obtained by applying the local maximum method to the CHM. To achieve this, an appropriate window size is selected to traverse the statistical area. The first raster position is determined, and the local maximum value is computed by considering its neighborhood. The maximum value within each crop corresponds to the highest point of the individual plant [26].

2.3.2. Multispectral Image Processing

In order to facilitate accurate maize growth monitoring and yield prediction, the multispectral images were processed in this study. Yusense Map software was utilized for image registration and stitching to generate a TIF image. The TIF image has a recorded format of digital numbers (DN) without any physical significance. Therefore, ENVI 5.3 software was employed to convert the DN of the multispectral data into surface reflectance through radiometric calibration. According to Equation (8), DN can be transformed into reflectance values.
R i = ( a i × D N i + b ) × d 2 × E 0 × cos θ
where ai × DNi + b represents radiance and E0 denotes the solar irradiance, which varies for different spectral bands. Typically, d is set to 1.
In the visible band, the reflectance thresholds were set to 0.05–0.12 for weeds and 0.17–0.25 for soil, and the average reflectance of the corn canopy was obtained by eliminating the effect of background reflectance based on the set reflectance thresholds. Additionally, in order to evaluate the impact of chlorophyll and nitrogen content on maize growth and yield, various VIs were computed using the calibrated reflectance images from different spectral bands. The VIs calculated in this study include the normalized difference vegetation index (NDVI); the difference vegetation index (DVI); the green normalized difference vegetation index (GNDVI); the red difference vegetation index (RDVI); the ratio vegetation index (RVI); the enhanced vegetation index (EVI), which is more sensitive to biomass; the soil conditioning vegetation index (SAVI); and the green chlorophyll index (GCI) for assessing light use efficiency. The specific calculations for these VIs are provided in Table 2.

2.4. CNN-Attention-LSTM for Maize Yield Prediction

To effectively monitor the entire growth period of maize and accurately assess its yield, this study utilized laser LIDAR point cloud data, multispectral data, and meteorological data as variables. These multimodal data were integrated using an improved CNN-attention-LSTM model for yield prediction. The specific architecture of the model is depicted in Figure 3. The dataset was divided into training, validation, and test sets. The training set comprised data collected from the training zone mentioned in Section 2.1, while the validation zone data were equally split to form the validation and test sets at a 1:1 ratio. The dataset was labeled based on field-collected data.
Firstly, the different sensor data were normalized, and any outliers were eliminated from the dataset. The multimodal and multitemporal features were segmented using a sliding time window with an overlap rate of 85%. The resulting time windows served as input variables, ensuring alignment with the original feature tags [27].
Secondly, considering the distinctive characteristics of three-dimensional vector structural information derived from the point cloud at different reproductive stages, the spectral information obtained from the multispectral images, and the meteorological information during the growth period, separate feature extraction branches were created for each data type. The preprocessed data were fed into 3 branches of the CNN-attention-LSTM model, where adaptive convolutional kernels in 3 convolutional layers extracted the relevant data features. These convolutional layers traversed the dataset, generating feature matrices through convolutional kernel weighting and local sequence convolution operations. Each convolutional layer was linked to a max-pooling layer, which reduced the dimensionality of the extracted features. A dropout layer was then connected to the max-pooling layer to prevent overfitting. Through multiple iterations of convolution and pooling, high-dimensional feature maps were obtained, allowing the CNN model to effectively extract structural and spectral information from multiple time periods. In the data fusion stage, the extracted features were computed via stepwise summation of the information for each branch, and finally, a new feature map was generated. The feature maps resulting from the convolutional layers maintained the original sequence order and were subsequently input into two consecutive LSTM layers. Each LSTM unit consisted of input, forget, and output gates, as well as internal state variables. LSTM layers transformed the feature maps into hidden states [28]. The feature maps processed using the LSTM layers were fused to generate new feature maps. These hierarchical feature maps encompassed m hidden states xt, and their representation of y is denoted in Equation (9):
y = f ( x 1 , x 2 , x 3 , x m )
where xt denotes the i-th hidden state and y is the corresponding feature map mapping.
The different hidden states of the feature maps mentioned above have an influence on yield indicators. To address this, this study employed a self-attention mechanism to calculate the hidden states, which produces a feature vector z. The feature vector is obtained by applying the tanh() activation function to the hidden states, resulting in the representation Ct (Equation (10)). In Equation (10), W denotes the weight matrix and b represents the bias vector. The weights, αt, are obtained by normalizing using the softmax function (Equation (12)). Ultimately, the vector z represents the weighted sum of the hidden states.
C t = tanh ( W x t + b )
e t = Q u e r y K e y t T / d k
α t = exp ( e t ) t = 0 n exp ( e t )
z = t α t V a l u e t
After computing the features using the attention mechanism, the process of multimodal feature fusion was accomplished. The combination of CNN and LSTM features allows for the effective handling of long-term sequences, mitigating the issue of reduced accuracy associated with longer sequences [29]. Moreover, the introduced self-attention module assigns distinct weights to various modalities, facilitating the capture of the relationship between multimodal data and yield.
Subsequently, the fused multimodal features were transformed in the output section. The feature samples were fed into the ElasticNet regression layer (ElasticNet) [30] for training, yielding predictions of yield outcomes.

2.5. Modelling and Evaluation Indices

The model uses the coefficient of determination (R2), root mean square error (RMSE), relative root mean square error (rRMSE), and relative percentage difference (RPD) to evaluate the yield prediction results of the model in a comprehensive manner [31]. Usually, models are considered to have better prediction when they have a higher R2 and lower rRMSE. The relevant equations are shown in Table 3.

3. Results

This section evaluates the variations in parameters such as VIs resulting from maize growth under different nitrogen levels and identifies the optimal parameter combination for yield prediction. Additionally, comparative experiments were designed to investigate the performance of the CNN-attention-LSTM model in multimodal data fusion and maize yield prediction. The performance of this model was compared with other prediction models to assess its effectiveness.

3.1. Analysis of Growth Characteristics and Yield Prediction under Different Nitrogen Levels

This study conducted a comparison of grain yield and aNUE among different plots to investigate the effect of nitrogen levels on maize yield. The experimental results are presented in Figure 4 [32], which illustrates the average grain yield and aNUE in both the experimental and validation zones under varying nitrogen levels. Figure 4 demonstrates that the yield exhibits a significant increasing trend with higher nitrogen levels in the N1 to N4 range, while a decrease in yield is observed at the N5 level. The yield at the N5 level is similar to that at the N3 level. In contrast, the distribution pattern of aNUE shows an opposite trend to yield. Within the N1 to N4 range, aNUE decreases as nitrogen levels increase, but it increases at the N5 level. These findings indicate a correlation between maize yield and nitrogen content, underscoring the importance of monitoring maize growth under different nitrogen levels and predicting yield. Moreover, the measured data from the experimental and validation zones exhibit similar distribution patterns, indicating the suitability of the selected validation plots for the experiment and the usability of the extracted data for the subsequent evaluation of yield prediction models.
Since the characteristics of multimodal data vary under different nitrogen levels, the CNN-attention-LSTM model can learn the weights of different parameters based on the features acquired at each nitrogen level. To further investigate the sensitivity of different parameters to nitrogen levels, this study analyzed the multispectral data and laser LIDAR data of maize at multiple reproductive stages. The correlations between multispectral data, LIDAR data, and yield under different nitrogen levels were examined throughout the reproductive stages, as depicted in Figure 5a,b.
The results indicate the importance of both multispectral data and three-dimensional vector feature information for maize yield prediction. While the spectral data and LIDAR data exhibit significant differences at various reproductive stages under six different nitrogen treatments, the influence of nitrogen levels on the correlation between yield and multimodal data is relatively small. Additionally, for feature extraction under different nitrogen levels, the proposed model demonstrates consistent yield prediction results. Consequently, the CNN-attention-LSTM model is capable of adaptive yield prediction for different reproductive stages and nitrogen levels.

3.2. Results of Maize Grain Yield Prediction Based on Different Reproductive-Stage Remote Sensing Data

3.2.1. Maize Grain Yield Prediction Results Based on Different Reproductive-Stage Multispectral Data

VIs play a crucial role in extracting maize growth parameters. This study utilized multispectral imagery data collected using UAVs at various time periods to calculate four VIs: NDVI, normalized difference red edge (NDRE), soil-adjusted vegetation index (SAVI), and EVI. The correlation between these VIs and field-collected data was computed. Subsequently, these indices were used as input variables in the CNN-attention-LSTM model for maize grain yield prediction experiments.
By analyzing the selected VIs, we assessed the correlation between each index and maize grain yield at different reproductive stages. The correlation coefficients between different VIs and yield varied across the different time periods. These correlations were visualized using a correlation coefficient heat map, as depicted in Figure 6.
As depicted in Figure 6, the x axis of the correlation coefficient heat map represents different VIs, while the y axis represents different reproductive stages of maize. Each square in the heat map represents the correlation between the corresponding VI and yield for a specific reproductive stage. The saturation of colors in the squares indicates the strength of the correlation, with fuller colors indicating stronger correlations. Based on the image, it can be observed that NDRE exhibits the highest correlation during the M period, while EVI shows strong correlations with yield in both the initial part of the V period and the later part of the V period. SAVI exhibits the fullest color saturation during the R period, indicating its greater potential for estimating maize yield during that period. NDVI demonstrates high correlations throughout the entire growth period, with the highest correlation occurring in the later part of the V period.
To determine the optimal combination of multispectral VIs from which data can be analyzed for yield prediction, this study selected multitemporal data from NDVI, NDRE, SAVI, and EVI as input variables for the CNN-attention-LSTM model. The branches corresponding to the other two modalities were frozen, and comparative experiments were conducted for yield prediction. The experimental results are summarized in Table 4.
The results indicate that as the number of reproductive stages increases, the R2 value shows a clear increasing trend. Using the full growth period as input variables yields better prediction results compared to using data from only two or three stages of the growth period. When utilizing the full growth period’s multispectral data as input variables, the model achieves an R2 value of 0.67 and an rRMSE of 15.7%. As more reproductive stages are included, the prediction performance improves. Additionally, including data from the initial part of the R period as input variables significantly enhances the yield prediction. Among the experiments using three reproductive stages as input variables, the combination of the later parts of the V, R, and M periods demonstrates the best performance, with an R2 value of 0.65 and an rRMSE of 19.4%. Conversely, excluding R period data from the reproductive stage combination (specifically using the initial part of the V period, the later part of the V period, and the M period) leads to the worst performance, with an R2 value of 0.51 and an rRMSE of 23.9%.
Overall, utilizing the data from the full growth period’s multispectral VIs as input variables yields significant improvements compared to using data from only two or three reproductive stages.

3.2.2. Maize Growth Parameter Extraction and Yield Prediction Results Based on LIDAR Data

LIDAR point cloud data provide valuable structural information about maize [13]. In this study, we applied the method described in Section 2.3.1 to extract crop structural features in the initial part of the V period and the later parts of the V, R, and M periods.
To investigate the relationship between point cloud parameters and maize characteristics, we calculated the correlation coefficients between different levels of point cloud data with both LAI and CHM. The correlation coefficients showed significant variations. The point cloud data in the initial part of the V period exhibited relatively low correlation coefficients with LAI and CHM. Among them, Point50–100 had the highest correlation coefficient with CHM, reaching 0.52, and a correlation coefficient of 0.49 with LAI. In the later part of the V period, Point75–100 showed a correlation coefficient of 0.65 with LAI and 0.71 with CHM. For the R period, Point80–100 was selected for parameter extraction, and for the M period, Point50–100 was selected. To conduct yield prediction experiments, this research work extracted three-dimensional features from the selected point cloud data.
Based on the calculated correlation coefficients, this study used different point cloud data as input variables in the CNN-attention-LSTM model for yield prediction. When using single-time-period point cloud data as input variables, the R period yielded the best results, with an R2 value of 0.48 and an rRMSE of 29.1%. When using point cloud data for two time periods as input variables, the combination of the later parts of the V and R periods showed the best training performance, with an R2 value of 0.54 and an rRMSE of 24.3%. When using point cloud data for three time periods as input variables, the combination of the later parts of the V, R, and M periods yielded the best training performance, with an R2 value of 0.62 and an rRMSE of 19.6%. These results showed only a slight difference compared to the prediction results using the full growth period’s LIDAR data. The experimental results demonstrated that the point cloud data for the later parts of the V, R, and M periods achieved higher accuracy and stability. Therefore, this study selected the combination of these three reproductive stages as the model parameters for LIDAR data. The experimental results are presented in Table 5. Better yield prediction results can provide more accurate and detailed information on productivity crops in the field while allowing for more significant yield variation at different N levels.

3.3. Yield Prediction Results Based on CNN-Attention-LSTM Model

This section presents the results of yield prediction using the CNN-attention-LSTM model for multimodal variable fusion. Additionally, this study compares the model’s performance under different window intervals.

3.3.1. Impact of Attention Mechanism on Yield Prediction Results

To assess the influence of the attention mechanism on different features, comparative experiments were conducted. The preprocessed multimodal feature vectors were input into two models: the CNN-LSTM model and the CNN-attention-LSTM model with an attention mechanism. The experiments were performed using window intervals of 5, 10, and 15 s to examine the effect of the attention mechanism on yield prediction. The results are illustrated in Figure 7.
For the CNN-LSTM model, the R2 values for window intervals of 5, 10, and 15 s were 0.62, 0.73, and 0.59, respectively. In contrast, the CNN-attention-LSTM model with an attention mechanism achieved R2 values of 0.69, 0.78, and 0.64 for the respective window intervals. Notably, the CNN-attention-LSTM model demonstrated an improvement of 0.05 in R2 for the 10 s window interval compared to the CNN-LSTM model. The experimental results consistently demonstrated the superior performance of the CNN-attention-LSTM model with an attention mechanism. The attention mechanism effectively fused the multimodal data by assigning different weights to different features, leading to positive impacts on the prediction results. Based on these findings, the 10 s window interval was selected for subsequent data processing.

3.3.2. Comparative Analysis of Yield Prediction Using Different Regression Methods

In order to explore the potential of the CNN-attention-LSTM model in yield prediction using alternative regression methods, this study conducted comparative experiments by replacing the ElasticNet layer with multiple linear regression (MLR), random forest regression (RF), support vector machine (SVM), and backpropagation (BP) [33].
Among these models, MLR exhibited the lowest R2 value of 0.42 when using the data from the initial part of the V period and the later parts of the V, R, and M periods as inputs in the training area. RF achieved the highest R2 value of 0.71 and an rRMSE of 13.4%, demonstrating higher stability and accuracy. However, the CNN-attention-LSTM model with an ElasticNet layer outperformed all the other models, achieving an R2 value of 0.78 and an rRMSE of 8.27%. The comparative results of the multiple regression models are presented in Table 6.
When an ElasticNet layer was used, the CNN-attention-LSTM model consistently showed superior performance in yield prediction compared to the other methods throughout the entire growth period. This suggests that the combination of ElasticNet and the fused multimodal data leads to better adaptability and improved yield prediction results.

3.4. Yield Prediction Results of Multimodal Data Fusion

Building upon the findings from Section 3.2.1 and Section 3.2.2, this study incorporated NDVI, NDRE, SAVI, and EVI data from the entire growth period, as well as point cloud data from the later parts of the V, R, and M periods. Furthermore, meteorological data were integrated as input variables in the yield prediction model. The fusion of these three modalities yielded an R2 value of 0.78 and an rRMSE of 8.27% for yield prediction. These results demonstrate the strong predictive capability of the multimodal yield prediction model, making it an effective tool for maize yield estimation. The fusion of multiple datasets significantly improved the R2 value compared to using single-type remote sensing data alone. Additionally, the multimodal fusion outperformed the combination of single-type remote sensing data with meteorological data, highlighting the complementary nature of different modalities when fused together.
Table 7 illustrates the yield prediction results obtained by combining different modalities of data. The training outcomes indicate that fusing multitemporal VI data with meteorological data produces superior results compared to fusing LIDAR point cloud data with meteorological data. Moreover, the prediction accuracy using single multitemporal VIs data surpasses that of using single LIDAR point cloud data. This discrepancy arises because multitemporal VI data influence various yield-related indicators such as SPAD, LAI, and AGB, thereby exerting a greater impact on yield prediction. In contrast, LIDAR point cloud data have a relatively smaller influence on yield prediction, as they primarily affect LAI and CHM. Meteorological data, on the other hand, affect the crop’s growth status during the growing season, providing an advantage to yield predictions that incorporate both meteorological and corresponding remote sensing data. The multimodal fusion of multispectral, LIDAR, and meteorological data surpasses any single modality or combination, underscoring the enhanced predictive capabilities of multimodal data fusion. Hence, this study selected the multimodal fusion of multispectral, LIDAR, and meteorological data for maize yield prediction. Figure 8 illustrates the maize yield prediction results based on the CNN-attention-LSTM model using the fusion of multispectral, LIDAR, and meteorological data, achieving an impressive R2 value of 0.78.

4. Discussion

4.1. Correlation Analysis between UAV Remote Sensing Data and Maize Growth

UAV remote sensing data have demonstrated significant potential in crop growth monitoring and yield prediction, offering a more convenient data acquisition process compared to field-collected data. However, it is crucial to investigate whether UAV data can accurately reflect the growth status of maize crops. Previous studies have shown that VI features extracted from multispectral data can effectively characterize crop growth [34]. Additionally, LIDAR point cloud data have been utilized to describe changes in crop canopy structure [14,35]. VI features exhibit distinct characteristics as maize progresses through different reproductive stages, with each VI reflecting specific physiological conditions. NDVI, for instance, exhibits more pronounced changes during the vegetative reproductive stage. Its nonlinear stretch enhances the contrast and reflectance between the near-infrared and red bands, resulting in reduced sensitivity as canopy coverage increases. On the other hand, NDRE uses the red-edge band to reflect chlorophyll levels, making it more sensitive during critical reproductive stages and transition periods. SAVI incorporates a soil adjustment factor L to correct the sensitivity of NDVI to changes in vegetation coverage at various reproductive stages. EVI, with narrower red and near-infrared bands, demonstrates higher detection capability during the early stages of the vegetative growth period. While previous studies have relied on single VIs for yield prediction, these indices are susceptible to variations in physiological indicators and soil backgrounds across different reproductive stages. They also exhibit higher saturation levels only during specific periods. Therefore, combining multiple VIs provides a more comprehensive overview of crop reproductive stages. LIDAR point cloud data provide valuable structural information at different stages of maize development. The point density and distribution of the point cloud data impact the determination of canopy structure, with increased point density enabling more specific descriptions of structural characteristics [36]. Notably, within a certain range, the accuracy of canopy height prediction is influenced by the density of point clouds. Therefore, in this study, a point density of 300 points/m2 was selected as the standard for point cloud extraction to fulfill the requirements of feature extraction throughout the entire reproductive period.
The comparative experiments conducted in Section 3.2 revealed that single-modality data can only provide specific dimensional feature information for maize yield prediction. However, the fusion of multispectral VI data, LIDAR point cloud data, and meteorological information significantly improves the accuracy of maize yield prediction [37]. The differences in maize yield are reflected not only in the changes in VIs but also in the structural characteristics derived from point cloud analysis. Therefore, the integration of multiple data modalities is crucial for enhancing the accuracy of maize yield prediction.

4.2. Analysis of the Impact of Different Reproductive Stages on Maize Yield Prediction

In this study, multiple time periods of UAV data were selected and fused to evaluate maize yield. However, it is important to analyze the specific influence of each reproductive stage on grain yield prediction [38].
Figure 9a presents the yield prediction results for different blocks during four individual reproductive stages. The initial part of the V period yielded an R2 of 0.36 and an rRMSE of 40.2%. The R2 value significantly increased during the later part of the V period, reaching 0.59 during the R period. The R2 value slightly decreased to 0.54 during the M period, with an rRMSE of 26.1%. These experimental results indicate that the R period is the optimal reproductive stage for yield prediction, and assigning more weight to features from the R period can improve the accuracy of yield prediction. The overall R2 for yield prediction across the entire experimental area was 0.78, which is 0.19 higher than the R period alone. These findings, combined with the results from Section 3.2, demonstrate that a single reproductive stage cannot fully capture crop growth characteristics, and the fusion of multiple time-period features is the optimal approach for yield prediction.
To further investigate the impact of fusing different reproductive stages on yield prediction, this study conducted comparative experiments using three reproductive stages. The results, shown in Figure 9b, indicate that the highest R2 value of 0.75 was achieved when the independent variables included the later parts of the V, R, and M periods. The lowest R2 value of 0.62 and the highest rRMSE of 21.3% were observed when the independent variables included the initial part of V, the later part of the V period, and the M period. These experimental results confirm that the R period is the optimal stage for yield prediction, while the initial part of the V period has the least impact on yield prediction. These findings are consistent with the results obtained from the single-reproductive-stage experiments. The yield prediction results are closely related to the monitored parameters during the selected reproductive stages in this study. As the maize growth cycle progresses, the acquired multispectral data and LIDAR point cloud data also undergo changes. Therefore, the accuracy of the proposed CNN-attention-LSTM yield prediction model may vary accordingly. During the R period, the yield prediction performance in the validation area is optimal and aligns with the results from the training area. However, the prediction accuracy in the validation area is slightly lower, indicating the need to further enhance the robustness of the model. During the later part of the V period, the rapid changes in canopy coverage and maize pH result in the point cloud data receiving more attention from the attention mechanism in the yield prediction model. As the maize crop enters the R period, the emergence of tassels can alter the canopy structure, thereby increasing the correlation between spectral features and various maize growth parameters. Consequently, this modification in the relationship between the response characteristics of remote sensing data, such as VIs, and maize growth parameters enhances the impact on yield prediction [39].

4.3. Correlation Analysis between UAV Remote Sensing Data and Maize Growth

The results of previous experiments clearly indicate that different spectral features and three-dimensional point cloud vector features have distinct effects on maize yield prediction. While remote sensing data are widely used in yield prediction, there are challenges in selecting the optimal parameter variables due to issues such as single modality and finding the best parameter combinations for accurate maize yield prediction. Therefore, it is crucial to analyze the impact of different-dimensional data on yield prediction to guide the rational selection of multimodal remote sensing data [6]. The experimental findings from Section 3.2 demonstrate that different reproductive stages exhibit diverse correlations between VIs, three-dimensional structural information, and yield. Notably, the transition from the initial part of the V period to the later part of the R period introduces significant changes in maize tassel structures that directly influence the representation of the maize canopy. The use of UAV imagery enables the effective monitoring of the impact of VIs and three-dimensional structural changes in the maize canopy on yield.
To summarize, the correlation between remotely sensed information obtained from multiple sensors and maize growth parameters surpasses that obtained from a single sensor acquiring image features [40]. Additionally, considering the influence of meteorological variations on captured image features, it is necessary to incorporate key meteorological information as input variables in the model [41].

4.4. Potential of Multimodal Data Integration with Deep Learning for Maize Yield Prediction

This study proposes the field-scale CNN-attention-LSTM model for maize yield prediction by integrating multispectral data, LIDAR point cloud data, and meteorological data from the initial part of the V period, the later part of the V period, the initial part of the R period, the later part of the R period, and the M period of maize growth. The experimental results demonstrate the accurate prediction capability of the CNN-attention-LSTM model for maize yield. Furthermore, the results verify that the fusion of multimodal data outperforms any single-modality data in terms of prediction accuracy, which is consistent with the findings of Fei et al. [21] and Sun et al. [42]. Compared to other methods such as MLR, RF, SVM, and BP, the CNN-attention-LSTM model based on deep learning achieves higher accuracy in yield prediction and demonstrates better generalization ability (Table 7). Additionally, deep learning techniques effectively capture the impact of canopy structure changes in yield prediction. Ziliani et al. [6] used high-resolution satellite imagery to determine the linear regression between simulated LAI and simulated yield using APSIM, resulting in optimal yield prediction. Xiuliang Jin et al. [43] were able to achieve maize yield estimation at the county level in China by combining multiple remote sensing metrics and machine learning algorithms. The estimated R2 reached 0.78 in the first 24 days of harvest. However, the multimodal fusion estimation of UAV remote sensing data is more applicable to yield prediction at the field scale. Previous studies have often relied on manual feature extraction methods for multimodal feature fusion, which require large-window data and do not align with the practicality of field-scale crop information collection. Moreover, large-window data are less compatible with small-scale variations in data, and can only be effectively utilized when there are significant changes in multidimensional features due to substantial differences in nitrogen content. However, the CNN-attention-LSTM model, which enables the automatic extraction of multimodal features, simultaneously processes different modalities using CNN, allowing the use of relatively smaller window data to improve yield prediction performance under different nitrogen treatments. The finer feature extraction and fusion techniques facilitate a more effective utilization of multidimensional maize structures [44].
In summary, the extraction of multimodal and multitemporal crop features, along with the adaptive assignment of weights to different modalities using self-attention mechanisms, enables the organic fusion of multimodal data, resulting in more accurate yield prediction. Therefore, the combination of multimodal data and deep learning has become an important approach for field-scale maize yield prediction.

5. Conclusions

This study presents the development of a CNN-attention-LSTM network that integrates multitemporal and multimodal UAV data for field-scale maize yield prediction. This model exhibits high accuracy and robustness in predicting yield. Field experiments were conducted to validate the model’s performance, considering different nitrogen fertilizer treatments. The experimental results demonstrate that the CNN-attention-LSTM model outperforms existing models in maize yield prediction, achieving an R2 value of 0.78 and an rRMSE of 8.27% [18,45]. The fusion of multimodal data also outperforms individual modalities. The self-attention mechanism in the model allows for the assignment of varying weights to different features. In comparison, the CNN-LSTM model without self-attention achieves an R2 value of 0.73 and an rRMSE of 13.2%. These results indicate that self-attention effectively balances the information from multiple dimensions.
Based on these findings, this study enables the accurate monitoring and yield prediction of maize at the field scale, contributing to the advancement of precision agriculture. However, there are certain limitations in practical field operations to consider. Firstly, the field experiments focused on a single crop variety, and the collected data exhibited a degree of randomness. Secondly, this study utilized multispectral and LIDAR UAV sensors, neglecting the potential of hyperspectral technology, which has proven valuable in yield prediction [46].
Future research should focus on improving the training dataset to enhance the generalizability of the model. Additionally, given the demonstrated feasibility of multimodal fusion in yield prediction, further investigation into different fusion methods for various modalities is warranted. Despite its limitations, this study holds practical significance for field-scale maize yield prediction.

Author Contributions

Conceptualization, W.Z.; methodology, C.S.; software, C.S.; validation, N.W.; formal analysis, C.L.; investigation, T.A.; resources, Y.W.; data curation, Q.F.; writing—original draft preparation, W.Z.; writing—review and editing, Y.W.; visualization, H.T.; supervision, X.S.; project administration, Q.W.; funding acquisition, Y.W. All authors have read and agreed to the published version of the manuscript.

Funding

This research was financially supported by the National Key R&D Program of China (No. 2022YFD2001401-02), Heilongjiang Provincial Natural Science Foundation of China (No. YQ2022E004), Hei Long Jiang Postdoctoral Foundation (No. LBH-TZ2211), and Northeast Agricultural University 2023 Young Leading Talent Support Program (No. NEAU2023QNLJ-018).

Data Availability Statement

Not applicable.

Acknowledgments

The authors would like to thank their schools and colleges, as well as the funding providers of the project. All support and assistance is sincerely appreciated.

Conflicts of Interest

The authors declare no conflict of interest.

References

  1. van Dijk, M.; Morley, T.; Rau, M.-L.; Saghai, Y. A meta-analysis of projected global food demand and population at risk of hunger for the period 2010–2050. Nat. Food 2021, 2, 494–501. [Google Scholar] [CrossRef]
  2. De Schutter, O. The political economy of food systems reform. Eur. Rev. Agric. Econ. 2017, 44, 705–731. [Google Scholar] [CrossRef]
  3. Ranum, P.; Peña-Rosas, J.P.; Garcia-Casal, M.N. Global maize production, utilization, and consumption. Ann. N. Y. Acad. Sci. 2014, 1312, 105–112. [Google Scholar] [CrossRef]
  4. Zhou, X.; Zheng, H.B.; Xu, X.Q.; He, J.Y.; Ge, X.K.; Yao, X.; Cheng, T.; Zhu, Y.; Cao, W.X.; Tian, Y.C.; et al. Predicting grain yield in rice using multi-temporal vegetation indices from UAV-based multispectral and digital imagery. SPRS J. Photogramm. Remote Sens. 2017, 130, 246–255. [Google Scholar] [CrossRef]
  5. Jin, X.; Li, Z.; Yang, G.; Yang, H.; Feng, H.; Xu, X.; Wang, J.; Li, X.; Luo, J.J. Winter wheat yield estimation based on multi-source medium resolution optical and radar imaging data and the AquaCrop model using the particle swarm optimization algorithm. ISPRS J. Photogramm. Remote Sens. 2017, 126, 24–37. [Google Scholar] [CrossRef]
  6. Ziliani, M.G.; Altaf, M.; Aragon, B.; Houborg, R.; Franz, T.E.; Lu, Y.; Sheffield, J.; Hoteit, I.; McCabe, M.F. Early season prediction of within-field crop yield variability by assimilating CubeSat data into a crop model. Agric. For. Meteorol. 2022, 313, 108736. [Google Scholar] [CrossRef]
  7. Huang, J.; Tian, L.; Liang, S.; Ma, H.; Becker-Reshef, I.; Huang, Y.; Su, W.; Zhang, X.; Zhu, D.; Wu, W.J.A.; et al. Improving winter wheat yield estimation by assimilation of the leaf area index from Landsat TM and MODIS data into the WOFOST model. Agric. For. Meteorol. 2015, 204, 106–121. [Google Scholar] [CrossRef]
  8. Nakajima, K.; Tanaka, Y.; Katsura, K.; Yamaguchi, T.; Watanabe, T.; Tatsuhiko, S. Biomass estimation of World rice (Oryza sativa L.) core collection based on the convolutional neural network and digital images of canopy. Plant Prod. Sci. 2023, 26, 187–196. [Google Scholar] [CrossRef]
  9. Hassan, M.A.; Yang, M.; Rasheed, A.; Yang, G.; Reynolds, M.; Xia, Z.; Xiao, Y.; He, Z. A rapid monitoring of NDVI across the wheat growth cycle for grain yield prediction using a multi-spectral UAV platform. Plant Sci. 2019, 282, 95–103. [Google Scholar] [CrossRef]
  10. Wan, L.; Cen, H.; Zhu, J.; Zhang, J.; Zhu, Y.; Sun, D.; Du, X.; Zhai, L.; Weng, H.; Li, Y.; et al. Grain yield prediction of rice using multi-temporal UAV-based RGB and multispectral images and model transfer—A case study of small farmlands in the South of China. Agric. For. Meteorol. 2020, 291, 108096. [Google Scholar] [CrossRef]
  11. López García, P.; Ortega, J.; Pérez-Álvarez, E.; Moreno, M.; Ramírez, J.; Intrigliolo, D.; Ballesteros, R. Yield estimations in a vineyard based on high-resolution spatial imagery acquired by a UAV. Biosyst. Eng. 2022, 224, 227–245. [Google Scholar] [CrossRef]
  12. Gong, Y.; Duan, B.; Fang, S.; Zhu, R.; Wu, X.; Ma, Y.; Peng, Y. Remote estimation of rapeseed yield with unmanned aerial vehicle (UAV) imaging and spectral mixture analysis. Plant Methods 2018, 14, 70. [Google Scholar] [CrossRef]
  13. Zhang, Y.; Yang, Y.; Zhang, Q.; Duan, R.; Liu, J.; Qin, Y.; Wang, X. Toward Multi-Stage Phenotyping of Soybean with Multimodal UAV Sensor Data: A Comparison of Machine Learning Approaches for Leaf Area Index Estimation. Remote Sens. 2023, 15, 7. [Google Scholar] [CrossRef]
  14. Luo, S.; Liu, W.; Zhang, Y.; Wang, C.; Xi, X.; Nie, S.; Ma, D.; Lin, Y.; Zhou, G. Maize and soybean heights estimation from unmanned aerial vehicle (UAV) LiDAR data. Comput. Electron. Agric. 2021, 182, 106005. [Google Scholar] [CrossRef]
  15. Klompenburg, T.V.; Kassahun, A.; Catal, C. Crop yield prediction using machine learning: A systematic literature review. Comput. Electron. Agric. 2020, 177, 105709. [Google Scholar] [CrossRef]
  16. Hta, B.; Pwa, B.; Kt, C.; Jza, B.; Sz, D.; Hl, D.J.A.; Meteorology, F. An LSTM neural network for improving wheat yield estimates by integrating remote sensing data and meteorological data in the Guanzhong Plain, PR China. Agric. For. Meteorol. 2021, 310, 108629. [Google Scholar]
  17. Tian, H.; Wang PTansey, K.; Zhang, S.; Zhang, J.; Li, H. An IPSO-BP neural network for estimating wheat yield using two remotely sensed variables in the Guanzhong Plain, PR China. Comput. Electron. Agric. 2020, 169, 105180. [Google Scholar] [CrossRef]
  18. Yang, W.; Nigon, T.; Hao, Z.; Paiao, G.D.; Fernandez, F.G.; Mulla, D.; Yang, C. Estimation of corn yield based on hyperspectral imagery and convolutional neural network. Comput. Electron. Agric. 2021, 184, 106092. [Google Scholar] [CrossRef]
  19. Mou, L.; Zhou, C.; Zhao, P.; Nakisa, B.; Gao, W. Driver Stress Detection via Multimodal Fusion Using Attention-based CNN-LSTM. Expert Syst. Appl. 2020, 173, 114693. [Google Scholar] [CrossRef]
  20. Ma, J.; Liu, B.; Ji, L.; Zhu, Z.; Wu, Y.; Jiao, W. Field-scale yield prediction of winter wheat under different irrigation regimes based on dynamic fusion of multimodal UAV imagery. Int. J. Appl. Earth Obs. Geoinf. 2023, 118, 103292. [Google Scholar] [CrossRef]
  21. Fei, S.; Hassan, M.A.; Xiao, Y.; Su, X.; Chen, Z.; Cheng, Q.; Duan, F.; Chen, R.; Ma, Y. UAV-based multi-sensor data fusion and machine learning algorithm for yield prediction in wheat. Precis. Agric. 2023, 24, 187–212. [Google Scholar] [CrossRef]
  22. Lou, Z.; Quan, L.; Sun, D.; Li, H.; Xia, F. Hyperspectral remote sensing to assess weed competitiveness in maize farmland ecosystems. Sci. Total Environ. 2022, 844, 157071. [Google Scholar] [CrossRef] [PubMed]
  23. Li, D.; Cheng, T.; Zhou, K.; Zheng, H.; Yao, X.; Tian, Y.; Zhu, Y.; Cao, W. WREP: A wavelet-based technique for extracting the red edge position from reflectance spectra for estimating leaf and canopy chlorophyll contents of cereal crops. ISPRS J. Photogramm. Remote Sens. 2017, 129, 103–117. [Google Scholar] [CrossRef]
  24. Li, R.; Zheng, J.; Xie, R.; Ming, B.; Peng, X.; Luo, Y.; Zheng, H.; Sui, P.; Wang, K.; Hou, P.; et al. Potential mechanisms of maize yield reduction under short-term no-tillage combined with residue coverage in the semi-humid region of Northeast China. Soil Tillage Res. 2022, 217, 105289. [Google Scholar] [CrossRef]
  25. Meteorological Data Network in China. Available online: http://www.nmic.cn/ (accessed on 12 November 2022).
  26. Cao, L.; Coops, N.C.; Sun, Y.; Ruan, H.; She, G. Estimating canopy structure and biomass in bamboo forests using airborne LiDAR data. ISPRS J. Photogramm. Remote Sens. 2019, 148, 114–129. [Google Scholar] [CrossRef]
  27. Elsayed, S.; Thyssens, D.; Rashed, A.; Schmidt-Thieme, L.; Jomaa, H.S. Do We Really Need Deep Learning Models for Time Series Forecasting? arXiv 2021, arXiv:2101.02118. [Google Scholar]
  28. Shi, X.; Chen, Z.; Wang, H.; Yeung, D.Y.; Wong, W.K.; Woo, W.C. Convolutional LSTM Network: A Machine Learning Approach for Precipitation Nowcasting. In Proceedings of the Advances in Neural Information Processing Systems 28 (NIPS 2015), Montreal, QC, Canada, 7–12 December 2015. [Google Scholar]
  29. Saini, P.; Nagpal, B.; Garg, P.; Kumar, S. CNN-BI-LSTM-CYP: A deep learning approach for sugarcane yield prediction. Sustain. Energy Technol. Assess. 2023, 57, 103263. [Google Scholar] [CrossRef]
  30. Enwere, K.; Ogoke, U. A Comparative Approach on Bridge and Elastic Net Regressions. Afr. J. Math. Stat. Stud. 2023, 6, 67–79. [Google Scholar] [CrossRef]
  31. Tabrizchi, H.; Razmara, J.; Mosavi, A. Thermal prediction for energy management of clouds using a hybrid model based on CNN and stacking multi-layer bi-directional LSTM. Energy Rep. 2023, 9, 2253–2268. [Google Scholar] [CrossRef]
  32. Fitzgerald, G.J.; Rodriguez, D.; Christensen, L.K.; Belford, R.; Sadras, V.O.; Clarke, T.R. Spectral and thermal sensing for nitrogen and water status in rainfed and irrigated wheat environments. Precis. Agric. 2006, 7, 233–248. [Google Scholar] [CrossRef]
  33. Siegmann, B.; Jarmer, T. Comparison of different regression models and validation techniques for the assessment of wheat leaf area index from hyperspectral data. Int. J. Remote Sens. 2015, 36, 4519–4534. [Google Scholar] [CrossRef]
  34. Martins, G.D.; Sousa Santos, L.C.; dos Santos Carmo, G.J.; da Silva Neto, O.F.; Castoldi, R.; Machado, A.I.M.R.; de Oliveira Charlo, H.C. Multispectral images for estimating morphophysiological and nutritional parameters in cabbage seedlings. Smart Agric. Technol. 2023, 4, 100211. [Google Scholar] [CrossRef]
  35. ten Harkel, J.; Bartholomeus, H.; Kooistra, L. Biomass and Crop Height Estimation of Different Crops Using UAV-Based Lidar. Remote Sens. 2020, 12, 17. [Google Scholar] [CrossRef]
  36. García, M.; Saatchi, S.; Ustin, S.; Balzter, H. Modelling forest canopy height by integrating airborne LiDAR samples with satellite Radar and multispectral imagery. Int. J. Appl. Earth Obs. Geoinf. 2018, 66, 159–173. [Google Scholar] [CrossRef]
  37. Maimaitijiang, M.; Sagan, V.; Sidike, P.; Hartling, S.; Fritschi, F.B. Soybean yield prediction from UAV using multimodal data fusion and deep learning. Remote Sens. Environ. 2019, 237, 111599. [Google Scholar] [CrossRef]
  38. Jin, X.; Liu, S.; Baret, F.; Hemerlé, M.; Comar, A. Estimates of plant density of wheat crops at emergence from very low altitude UAV imagery. Remote Sens. Environ. 2017, 198, 105–114. [Google Scholar] [CrossRef]
  39. Sagan, V.; Maimaitijiang, M.; Bhadra, S.; Maimaitiyiming, M.; Brown, D.R.; Sidike, P.; Fritschi, F.B. Field-scale crop yield prediction using multi-temporal World View-3 and PlanetScope satellite data and deep learning. ISPRS J. Photogramm. Remote Sens. 2021, 174, 265–281. [Google Scholar] [CrossRef]
  40. Xia, F.; Lou, Z.; Sun, D.; Li, H.; Quan, L. Weed resistance assessment through airborne multimodal data fusion and deep learning: A novel approach towards sustainable agriculture. Int. J. Appl. Earth Obs. Geoinf. 2023, 120, 103352. [Google Scholar] [CrossRef]
  41. Ju, S.; Lim, H.; Ma, J.; Kim, S.; Lee, K.; Zhao, S.; Heo, J. Optimal county-level crop yield prediction using MODIS-based variables and weather data: A comparative study on machine learning models. Agric. For. Meteorol. 2021, 307, 108530. [Google Scholar] [CrossRef]
  42. Sun, Z.; Li, Q.; Jin, S.; Song, Y.; Xu, S.; Wang, X.; Cai, J.; Zhou, Q.; Ge, Y.; Zhang, R.; et al. Simultaneous Prediction of Wheat Yield and Grain Protein Content Using Multitask Deep Learning from Time-Series Proximal Sensing. Plant Phenomics 2022, 2022, 1–13. [Google Scholar] [CrossRef]
  43. Cheng, M.; Penuelas, J.; McCabe, M.F.; Atzberger, C.; Jiao, X.; Wu, W.; Jin, X. Combining multi-indicators with machine-learning algorithms for maize yield early prediction at the county-level in China. Agric. For. Meteorol. 2022, 323, 109057. [Google Scholar] [CrossRef]
  44. Rischbeck, P.; Elsayed, S.; Mistele, B.; Barmeier, G.; Heil, K.; Schmidhalter, U. Data fusion of spectral, thermal and canopy height parameters for improved yield prediction of drought stressed spring barley. Eur. J. Agron. 2016, 78, 44–59. [Google Scholar] [CrossRef]
  45. Ma, Y.; Zhang, Z.; Kang, Y.; Özdoğan, M. Corn yield prediction and uncertainty analysis based on remotely sensed variables using a Bayesian neural network approach. Remote Sens. Environ. 2021, 259, 112408. [Google Scholar] [CrossRef]
  46. Jiang, Y.; Wei, H.; Hou, S.; Yin, X.; Wei, S.; Jiang, D. Estimation of Maize Yield and Protein Content under Different Density and N Rate Conditions Based on UAV Multi-Spectral Images. Agronomy 2023, 13, 421. [Google Scholar] [CrossRef]
Figure 1. Experimental area overview: (a) geographic location of the study area; (b) experimental layout of the test blocks; and (c) experimental layout of the validation blocks.
Remotesensing 15 03483 g001
Figure 2. Data acquisition and remote sensing data preprocessing workflow.
Remotesensing 15 03483 g002
Figure 3. Structure of CNN-attention-LSTM.
Remotesensing 15 03483 g003
Figure 4. (a) Yield variation under different nitrogen levels. (b) Difference in aNUE under different nitrogen levels, with aNUE being 0 under N1 treatment.
Remotesensing 15 03483 g004
Figure 5. Correlation between remote sensing data and field yield at different nitrogen levels. (a) Correlation between multispectral data at different nitrogen levels and field yield during various reproductive stages. (b) Correlation between LIDAR point cloud data at different nitrogen levels and field yield during various reproductive stages.
Remotesensing 15 03483 g005
Figure 6. Heat map of correlation coefficients between VIs and yield across multiple reproductive stages.
Remotesensing 15 03483 g006
Figure 7. Comparison of predictions with and without an attention mechanism at different window intervals.
Remotesensing 15 03483 g007
Figure 8. Maize yield prediction results based on the fusion of multispectral, LIDAR, and meteorological data using the CNN-attention-LSTM model.
Remotesensing 15 03483 g008
Figure 9. Maize yield prediction results at different reproductive stages. (a) Maize yield prediction results for individual reproductive stages. (b) Maize yield prediction results for combinations of three reproductive stages.
Remotesensing 15 03483 g009
Table 1. Flight time records throughout the growth period.
DatesPhenological Stages
15 June 2022V3–V4
29 June 2022V6–V7 (plucking stage)
13 July 2022V9 (growth rate rapidly increases)
18 July 2022V12 (trumpeting stage)
24 July 2022V12 (trumpeting stage)
1 August 2022VT (tasseling stage)
8 August 2022R1 (silking stage)
16 August 2022R3 (milk stage)
12 September 2022R4–R5 (dough stage)
6 October 2022R6 (physiological maturity)
Table 2. Computation of VIs using multispectral images.
IndexFormulas
NDVI ( R N I R R R E D ) / ( R N I R + R R E D )
DVIRNIR − RRED
GNDVI(RNIR − RRED)/(RNIR + RGRE)
RDVI ( R N I R R R E D ) / R N I R + R R E D
RVI R N I R / R R E D
EVI 2.5 × ( R N I R R R E D ) / ( R N I R + 6.0 × R R E D 7.5 × R B L U E + 1 )
SAVI ( ( R N I R R R E D ) / ( R N I R + R R E D + 0.16 ) ) × ( 1 + 0.5 )
GCI N I R G R E 1
NDRE N D R E = ( R N I R R R E D _ E D G E ) / ( R N I R + R R E D _ E D G E )
Note: RED, GRE, BLUE, and NIR represent the surface reflectance of the red channel, green channel, blue channel, and near-infrared channel, respectively.
Table 3. Accuracy evaluation indices of maize yield estimation model.
Evaluation MetricCalculation Formula
R2 1 i = 1 n ( Y i X i ) 2 i = 1 n ( Y i Y ¯ ) 2
RMSE i = 1 n ( Y i X i ) 2 n
r R M S E R M S E y ¯
RPD S T D R M S E
Table 4. Maize yield prediction results based on different VI combinations at various reproductive stages.
Different Fertility CombinationsThe Reproductive PeriodR2RPDrRMSE
Two reproductive stagesLater part of V period, R period0.331.2037.9%
Later part of V period, M period0.451.3615.7%
R period, M period0.611.4720.1%
Three reproductive stagesInitial part of V period, Later part of V period, R period0.561.4521.7%
Initial part of V period, Later part of V period, M period0.511.3423.9%
Later part of V period, R period, M period0.651.7119.4%
All reproductive stagesInitial part of V period, Later part of V period, R period, M period0.671.8315.7%
Table 5. Maize yield prediction results based on different LIDAR data combinations at various reproductive stages.
Different Fertility CombinationsR2RPDrRMSE
One reproductive stage (R period)0.481.3829.1%
Two reproductive stages (later part of V period, R period)0.541.6624.3%
Three reproductive stages (later part of V period, R period, M period)0.621.8719.6%
Table 6. Yield prediction results of different models.
Yield Forecasting ModelsR2RPDrRMSE
ElasticNet0.78 2.318.27%
MLR0.421.2634.6%
RF0.711.8913.4%
SVM0.631.6419.7%
BP0.531.4725.6%
Table 7. Yield prediction results from different modal fusion methods.
Different Modal CombinationsR2RPDrRMSE
Multispectral data0.67 1.8315.7%
LIDAR data0.621.8719.6%
Multispectral data, LIDAR data0.742.2310.1%
Multispectral data, meteorological data0.712.0513.5%
LIDAR data, meteorological data0.661.9816.6%
Multispectral data, LIDAR data, meteorological data0.782.318.27%
Disclaimer/Publisher’s Note: The statements, opinions and data contained in all publications are solely those of the individual author(s) and contributor(s) and not of MDPI and/or the editor(s). MDPI and/or the editor(s) disclaim responsibility for any injury to people or property resulting from any ideas, methods, instructions or products referred to in the content.

