
Google Earth Engine: A Global Analysis and Future Trends
by
 , , ,
, , ,
Andrés Velastegui-Montoya
1,2,* ,
,
Néstor Montalván-Burbano
2,3 ,
,
Paúl Carrión-Mero
1,2 ,
,
Hugo Rivera-Torres
1,
Luís Sadeck
4 and
Marcos Adami
5 1
Facultad de Ingeniería en Ciencias de la Tierra, ESPOL Polytechnic University, Guayaquil P.O. Box 09-01-5863, Ecuador
2
Centro de Investigación y Proyectos Aplicados a las Ciencias de la Tierra (CIPAT), ESPOL Polytechnic University, Guayaquil P.O. Box 09-01-5863, Ecuador
3
Department of Business and Economics, University of Almería, 04120 Almería, Spain
4
Geoscience Institute, Federal University of Pará, Belém 66075-110, Brazil
5
Earth Observation and Geoinformatics Division, National Institute for Space Research (INPE), Sao Jose dos Campos 12227-010, Brazil
*
Author to whom correspondence should be addressed.
Remote Sens. 2023, 15(14), 3675; https://doi.org/10.3390/rs15143675
Submission received: 31 May 2023
/
Revised: 5 July 2023
/
Accepted: 12 July 2023
/
Published: 23 July 2023
(This article belongs to the Special Issue Google Earth Engine for Geo-Big Data Applications)
Abstract
:The continuous increase in the volume of geospatial data has led to the creation of storage tools and the cloud to process data. Google Earth Engine (GEE) is a cloud-based platform that facilitates geoprocessing, making it a tool of great interest to the academic and research world. This article proposes a bibliometric analysis of the GEE platform to analyze its scientific production. The methodology consists of four phases. The first phase corresponds to selecting “search” criteria, followed by the second phase focused on collecting data during the 2011 and 2022 periods using Elsevier’s Scopus database. Software and bibliometrics allowed to review the published articles during the third phase. Finally, the results were analyzed and interpreted in the last phase. The research found 2800 documents that received contributions from 125 countries, with China and the USA leading as the countries with higher contributions supporting an increment in the use of GEE for the visualization and processing of geospatial data. The intellectual structure study and knowledge mapping showed that topics of interest included satellites, sensors, remote sensing, machine learning, land use and land cover. The co-citations analysis revealed the connection between the researchers who used the GEE platform in their research papers. GEE has proven to be an emergent web platform with the potential to manage big satellite data easily. Furthermore, GEE is considered a multidisciplinary tool with multiple applications in various areas of knowledge. This research adds to the current knowledge about the Google Earth Engine platform, analyzing its cognitive structure related to the research in the Scopus database. In addition, this study presents inferences and suggestions to develop future works with this methodology.
1. Introduction
Google Earth Engine (GEE) is a cloud-based computing platform that uses Google’s infrastructure to facilitate access to geospatial data and its processing [1]. This platform requires an account to access, and it is free for educational and research purposes. GEE’s goals are: (i) to have a dynamic platform that facilitates the development of algorithms on a large scale; (ii) to promote high-impact research by providing free and open access; and (iii) to be part of the progress and solutions to the global demand and management of big data [2,3].
GEE has a vast catalog on a petabyte scale. It gathers information from Landsat, Sentinel, and MODIS satellites and data on climate models, temperature, and geophysical characteristics [1,4]. Its intuitive interface has a code editor (https://code.earthengine.google.com/, accessed on 30 January 2023), which is an integrated development environment (IDE) for the elaboration of algorithms using JavaScript programming language [5,6]. It also has a graphic window for the user to see the processes conducted. In addition, it can also work in Phyton, and others through the Earth Engine library [7,8], and R [9,10]. Finally, it also has a version with a simple interface known as “Explorer” (https://explorer.earthengine.google.com/#workspace, accessed on 30 January 2023) for users with little experience in programming languages. Both options allow the entry of local data and the export of information for subsequent processing or visualization within geographic information systems (GIS) software, such as QGIS (Version 3.28), and ArcGIS Pro (Version 3.1.2), among others [11,12].
Research methodologies are constantly changing and innovated to construct knowledge [13]. In the area of geoscience and remote sensing, GEE has become a powerful tool for remote sensing, given its multiple applications in fields such as agricultural productivity [14], vegetation monitoring [15], grassland monitoring [16], mangrove mapping [17], land use and cover [18,19], risk and disaster management [20], islands of heat [21], surface temperature [22], forest fires [23], bathymetry [24], surface water [25], built-up area [26], mining [27], among others. Its multiple applications show the GEE platform’s potential to manage large data sets and contribute to the development of scientific research [28].
Many researchers have analyzed GEE’s potential multiple applications in recent years. Kumar and Mutanga [2] studied the literature published between 2011 and 2017 to present the platform’s uses, trends, and potential since its inception. On the other hand, Tamiminia et al. [29] conducted a systematic review of GEE in geographic big data applications. Likewise, Zhao et al. [30] used articles from the Web of Science (WoS) Science Citation Index Expanded (SCIE) and Social Citation Index (SSCI) to study the development of the scientific production of the Google Earth (GE) and GEE platforms through a scientometric analysis. The studies above provide relevant information while focusing on systematic and scientometric literature reviews of the different GEE applications.
Bibliometric analysis helps identify gaps and directions of research in a particular area [31]. Moreover, it offers objective results, which help understand the knowledge area’s impact and influence while identifying the publications’ evolution [32]. The methodology used the processing of bibliographic information, elaborating structure maps of the fields, and the quantitative analysis of the existing academic literature [31,33].
In recent years, the number of publications that implement the use of GEE has increased. Given this background and its relevance, this research focuses on producing knowledge using the GEE platform from a bibliometric approach to obtain a quantitative and general estimate of the topic regarding citation, co-citation, and co-occurrence analysis. Furthermore, it seeks to help researchers understand the advances in this field, identify proposed works and innovate in future applications.
In this context, the following research questions were raised: What is the impact and evolution of scientific production related to the Google Earth Engine platform? What applications and studies have been developed using the Google Earth Engine platform?
The present study aims to evaluate the intellectual structure of the GEE platform through a bibliometric analysis using the Scopus (launched by Elsevier, Amsterdam, Netherlands) database to determine its evolution, performance, and patterns. The article’s organization is as follows: Section 1 introduces the research field. Section 2 indicates obtaining data sets, methodologies, and software. Section 3 presents the results obtained. Section 4 analyzes and discusses the results. Finally, the most important conclusions are in Section 5. Moreover, limitations and future research directions are in Section 6.
2. Materials and Methods
A rigorous and transparent methodological process is used during the systematic literature reviews to reduce bias in the treatment of information and provide critical contributions to the field of study [32,34]. Similarly, bibliometric studies give a broad understanding of the field of study by analyzing scientific production through quantitative applications, thus increasing the knowledge of its characteristics, evolution, and trends [35].
Bibliometric mapping, a two-dimensional graphic representation of the field of study made of networks that examine its intellectual structure, elements, and connections, complemented the analysis [36,37]. Bibliometrics has become an essential tool for researchers and is widely accepted in academia [38]. The bibliometric allowed these studies in different academic disciplines, such as medicine [39], management [40], earth sciences [41,42], disasters [43], groundwater [44], sustainability and environment [45,46], and computer science [47], among others.
A methodological process of four phases allowed (see Figure 1) for obtaining the proposed bibliometric analysis: (i) search criteria, (ii) search procedure, (iii) software selection and data acquisition, and (iv) data analysis and trends.
2.1. Search Criteria
This paper analyzes the structure and conceptual evolution of the field of study of Google Earth Engine through bibliometric analysis. We based our selection on considering GEE as an online digital processing platform for satellite images on a large scale [1,2,29]. Therefore, the search term used was “Google Earth Engine”, as this is the platform’s name.
2.2. Search Procedure
Bibliometric studies require a database that provides quality information and is reliable for the researcher [48]. The selected database was Scopus for the following reasons: (i) it is one of the largest databases for abstracts and citations of peer-reviewed literature [49,50]; (ii) it has broad coverage in terms of quantity and time [51]; (iii) it has quality indicators and standards [52]; (iv) it facilitates the download of information in different formats [53,54] y (v) it is considered by other bibliometric studies [55,56].
The search was conducted on 15 February 2023, using the descriptor “Google Earth Engine” and a combination of widely accepted variables “titles, abstract and keywords” for the search. The initial search obtained 2971 documents. Additionally, eliminating the years before the launch of GEE (2010) and the year 2023, as it is the current year—setting the search equation TITLE-ABS-KEY (“Google Earth Engine”) AND (EXCLUDE (PUBYEAR, 2023) OR EXCLUDE (PUBYEAR, 2010) OR EXCLUDE (PUBYEAR, 2009)). Finally, the final search obtained 2822 documents.
2.3. Software Selection and Data Acquisition
The bibliographic information was exported from the Scopus database as a comma-separated value (CSV) file, with information related to documents by year, sources, authors, types, study area, sponsor, affiliation, journals, and other parameters. This bibliometric study used three software:
- Microsoft Excel (Version 2304): Pre-processing to organize and review the information, eliminating records without an author, duplicate files, and incomplete data [57]. The result obtained 2800 records. This software also analyzed large data sets, made calculations, and created tables and graphs to estimate the performance of scientific production [58,59].
- ArcGIS Pro Software (Version 3.1.2): It is an outstanding computer program in GIS that organizes, analyzes, visualizes, and shares geographic information [60]. The software facilitates the elaboration of a map that displays the countries’ contributions to this subject of study. Other bibliometric studies include the same software [61,62].
- VOSviewer Software (Version 1.6.19): Developed by the University of Leiden (Leiden, Netherlands) researchers Nes Van Eck and Ludo Waltman. The software builds and makes it possible to visualize two-dimensional bibliographic networks, called bibliometric maps or science maps [63,64]. Furthermore, the program facilitates the handling of large amounts of data, thus revealing the structure of the field of study and analyzing its central (co-occurrence of keywords), middle (co-citation of cited authors), and peripheral parts (co-citation of cited journals) [65]. Various academic disciplines used the software [66,67].
2.4. Data Analysis and Trends
This study applied two approaches during data analysis; the first consists of the performance analysis and the second of the study of intellectual structure through science mapping [37,68].
The first relates to scientific production analysis, which considers the growth patterns of publications and bibliometric indicators, highlighting the contribution of countries, universities, and authors [34,69]. The second approach deals with bibliometric maps, which focus on visualizing the existing relationships within the study area using keywords, authors, and journals [41,70].
3. Results
3.1. Performance Analysis
3.1.1. Document Type and Language
Most of the research on GEE comes from journal articles (77.25%). Journals are preferred as they are considered higher-quality publications that go through blind peer review [71]. In second place is the research presented at conferences (18.57%), considered equally important as journal articles, particularly in computer science, more than other academic disciplines [72]. Other documents (4.18%) correspond to data papers, reviews, letters, book chapters, notes, erratums, letters, short surveys, editorials, and books (see Table 1).
In the academic world, the English language is predominant in its various academic disciplines [73]. The field of study of GEE is not an exception. Despite containing research in ten languages, 93.57% of the research available is in English (see Table 2). This majority choice of English as an academic language is because English is essential for establishing scientific communication and international collaboration. In addition, many journals are published in this language [74,75].
3.1.2. Scientific Production
According to the database obtained, Figure 2 shows the growth trend of publications (2011–2022). This field of study shows a growing trend for 12 years, of 2800 publications that have received 39,228 citations. The first document mentioning GEE was an article on the historical modeling of a city in 4D through the automation of GEE [76]. In this same year, the findings of the first results of investigations in GEE were at conferences. The first, published in “Lecture Notes in Business Information Processing”, addresses the success stories of GIS applications [77]. The second was presented at “Proceedings—2011 4th International Conference on Information Management, Innovation Management and Industrial Engineering, ICIII 2011”, exhibiting GEE as a graphical interface for surface mining mapping and system-assisted truck driving [78].
This field of study divides into two periods for analysis: Introduction (2011–2016) and Growth (2017–2022). Period I corresponds to a stage with fewer publications per year, which refers to the learning curve of the use and applications of GEE. On the other hand, period II presents a higher number of documents and citations per year, which is related to the development of the various applications of this platform.
Period I—Introduction (2011–2016): The 37 initial publications in this field of study are equivalent to 1.32% of the total. In 2012, no publications on GEE were registered, revealing the natural curve of learning and adaptation to the new GEE platform. The most cited document was published by Dong et al. [79] in the journal Remote Sensing of Environment with 462 citations. This paper uses GEE algorithms and Landsat 8 imagery to map paddy rice. This mapping provides details of a product that has become widespread over the past decades in Northwest Asia and thus contributes to food security assessment. Other studies addressed vegetation clearing [80], crop mapping [81], seawater level monitoring [82], risk analysis [83], urban planning [84], multi-temporal analyses [84], and other applications.
Period II—Growth (2017–2022): The largest amount of scientific literature in the field of study has developed in these last six years, with 2763 publications (98.68%). They were showing significant and constant growth in scientific production. During this period, studies published are on land use and land cover [18,85], agriculture [86], climate change [87], land cover change [88], and hydrology [89]. As well as theoretical literature review studies [1,2]. In the last year (2022), a considerable number of publications focused on land use/cover [90], classification [91], forest fires [92], predictions [93], and climatic changes [94], among others.
In Figure 2, we can also observe a decrease in citations between 2020 and 2022. The lower number of citations in recent years may be related to the “sleeping beauty” effect, where these recent documents have not reached their potential impact, lacked visibility, or have little current relevance [95]. Therefore, they are in a period of latency before receiving wider recognition.
3.1.3. Contributions by Country
According to the data collected, the publications correspond to 125 countries across five continents (see Figure 3). Asia has the majority of publications (46.80%), with China, India, Indonesia, Iran, and Japan standing out. Next, we find the American continent (25.12%), with a majority contribution from The United States, Brazil, and Canada. Finally, other continents such as Europe, Africa, and Oceania participated in 19.20%, 5.14%, and 3.74%, respectively.
China leads the scientific production in the area with 994 publications, followed by The United States with 623. These countries have collaborated on 145 publications. Some of their collaborative work includes mapping rice crops using Landsat 8 satellite data [79]. In addition, analyzing land cover changes due to different human activities [85], and creating global maps of an artificial impervious area to identify human settlements and their possible environmental impact [96]. In addition, China maintains a strong relationship with Canada, collaborating in research related to wetland inventory [97], flood monitoring using algorithms based on multi-temporal SAR statistics [98], and monitoring fallow fields as a product of agricultural activities [99]. The UK also has a strong relationship with China, where they have worked together on monitoring and mapping the Himalayas [100], land use change [101], and other applications.
Being the second most prominent country in GEE publications, The United States has collaborated with Canada on 40 papers. Collaboration has focused on monitoring and inventorying wetlands [102,103], GEE review articles [29,104], and mapping irrigated areas [105]. Germany also collaborated with The United States in 23 studies. In some of these collaborations, they mapped plantations [106], estimated biophysical variables such as canopy water content (CWC), fraction of absorbed photosynthetically active radiation (FAPAR), fraction vegetation cover (FVC), and leaf area index (LAI) [107]. Additionally, Australia has carried out 15 studies with the USA. We find the application of algorithms for crop mapping [108], and the analysis of the severity of fires in North American forests [109].
Other countries, such as India, have also presented important publications on Google Earth Engine. India occupies third place as the country with the most publications, with 231 papers. The most notable publications include: conducting research in cropland mapping [110,111], wet and dry snow mapping [112], and analysis of river avulsions [113]. Brazil ranks fourth on the list of countries with the highest publication contribution, with 138 publications and 1582 citations. Brazil has also published papers on topics such as monitoring of livestock activity and pastures [114], analysis of spatio-temporal patterns of road mortality with roadkill data of seven mammals [115], and monitoring of the Amazon [18]. Finally, Italy ranks fifth globally with 133 publications, reaching 1916 citations. Some of the topics of said publications relate to human population settlement analysis [84], land use and cover evaluation [116], and other applications.
The VOSviewer software allows the construction of a bibliometric map of bibliographic coupling, where each node represents a country linked to those countries it has collaborated. Figure 4 shows the collaboration network between countries, with 71 nodes, 11 clusters, and 2485 links, with a link strength of 3,621,427. China has strong ties with The United States (link strength 369,292), Canada (link strength 75,189), The United Kingdom (link strength 60,221), Brazil (link strength 57,690), Germany (link strength 62,637), Australia (link strength 57,139), India (link strength 72,829), Italy (link strength 60,461), and The Netherlands (link strength 37,644), indicating significant collaboration between these countries.
3.1.4. Journals Performance
Analyzing journals provided a general overview of the use and application of GEE and its various disciplines as presented in their intellectual structure. The analysis concluded that are 404 journals linked to this field of study. Table 3 shows the 15 journals with the highest contribution of articles (1108), representing 39.57%. In addition, the table shows performance indicators, such as CiteScore, Scimago Journal Rank (SJR), and H-Index.
Based on the number of published articles, the journal remote sensing ranked first with 535 papers (24.73%) and 9276 citations, making it the second most cited journal in this category. Remote Sensing of Environment ranked second, with 106 articles (4.90%), and stands out as the most-cited journal, with 10,864 citations. International Journal of Applied Earth Observation and Geoinformation ranked third, with 60 articles (2.77%). Finally, Sustainability (Switzerland), Land, and ISPRS Journal of Photogrammetry and Remote Sensing ranked fourth, fifth, and sixth, accounting for 2.03%, 1.99%, and 1.99%, respectively.
According to the Citescore and SJR performance indicators for the top 15, Remote Sensing of Environment, ISPRS Journal of Photogrammetry, and Science of the Total Environment are first. Based on the H-index indicator, Remote Sensing of Environment, ISPRS Journal of Photogrammetry and Remote Sensing, and Science of the Total Environment ranked first, second, and third, respectively.
In Table 3, the first, second, sixth, seventh, eighth, and fourteenth journals have the theme of remote sensing in common. The journals in the third, eighth, tenth, and fifteenth places present the theme of geosciences. The rest of the journals correspond to multidisciplinary categories, such as Science of the Total Environment, and specific areas, such as sustainability, land, ecological indicator, water, and forest. They revealed the importance of the GEE in these areas of knowledge and encompassing the earth sciences.
3.1.5. Areas of Knowledge
The scientific production of this subject of study covers 25 areas of knowledge. Figure 5 shows these main areas. According to the nature of the study, a publication can address more than one area of knowledge. The results indicate that earth and planetary sciences are the most outstanding area of knowledge, with publications that represent 30.23%, followed by environmental science with 16.81% share, computer science (11.53%), agricultural and biological sciences (9.39%), social sciences (8.47%), engineering (7.30%) and physics and astronomy (4.22%). The diversity in areas of knowledge demonstrates the multidisciplinary applications of GEE. In addition, the remaining 12.05% are from other areas of knowledge, such as mathematics, energy, decision sciences, biochemistry, genetics, molecular biology, materials science, multidisciplinary, medicine, business, management and accounting, chemistry, chemical engineering, economics, econometrics, and finance, arts and humanities, neuroscience, veterinary, dentistry, immunology and microbiology, health professions, pharmacology, toxicology, and pharmaceutics.
3.1.6. Frequently Cited Documents
Table 4 shows the top 15 most cited documents. Five studies perform algorithms and analysis for cropland monitoring [79,108,110,117,118], four articles deal with multitemporal mapping and analysis of land use and land cover [18,85,119,120], three papers are review articles of the GEE platform [1,2,29], one study maps impervious areas [96], one paper analyzes mangroves [121], and another article focuses on the estimation of terrestrial evapotranspiration [122]. However, these documents represent only 0.54% of the scientific production, with 8964 citations (22.85%).
The article by Gorelick et al. [1], published in the journal Remote Sensing of Environment, ranked first, with 4792 citations, representing 53.46% of the top 15. This publication studies the GEE platform’s characteristics, structure, applications, and advantages. The second place corresponds to the article by Dong et al. [79], published in the journal Remote Sensing of Environment, which has 462 citations. This study mapped the paddy rice planting area in Northeast Asia to analyze the characteristics of its geographical distribution using Landsat 8 images, the phenology-based algorithm, and the GEE platform. In third place is the study by Liu et al. [119], published in the journal Remote Sensing of Environment, with 377 citations. Finally, the study by Gong et al. [96] ranked fourth, with 362 citations, published in the journal Remote Sensing of Environment. The other articles presented various applications and content variations related to remote sensing; the same is in Table 4 with their respective authors and citation numbers.
3.1.7. Satellites and Sensors Used Frequently
GEE contains a catalog of large-scale satellite images. Figure 6 shows the most used satellites and sensors in the analyzed publications. The Landsat satellite was the most used, appearing in 1283 studies, followed by the Sentinel satellite, with 933 documents. ASTER, MODIS, and SAR sensors rank third, fourth, and fifth, respectively. Some studies have combined different satellite data sets, such as Landsat and Sentinel [111,118]; Landsat and MODIS [123]; Landsat, Sentinel, and MODIS [124]; Landsat, MODIS, and ASTER [125]; Landsat, Sentinel, ASTER, and MODIS [126]; among other combinations of data. In addition, few studies included other satellites and sensors such as LiDAR, AVHRR, ALOS PALSAR, WorldView, NOAA, and PROBA-V.
3.1.8. Remote Sensing Applications over Time
Figure 7 shows the main remote sensing applications developed in GEE during the years analyzed. This analysis allows identifying cropland and vegetation topics, land use and land cover, climate change, cartography and GIS, and flood mapping, which are the five main uses of GEE. Furthermore, these show a continuous growth of studies.
3.2. Science Mapping
3.2.1. Author Keywords Co-Occurrence Network
This analysis characterized the study area by visualization in two dimensions, using a semantic map to observe its intellectual structure, topics, and relevant themes [70]. Figure 8 shows the co-occurrence network of author keywords, where 301 out of 5815 were analyzed, the same ones repeated at least five times. The network structure is 10 clusters, 301 nodes, 3610 links, and a total link strength of 10,816. Each node represents a research topic (keyword), and the set of nodes (cluster of the same color) represents a research area. The size of each node is related to the number of times it appears in the documents.
Cluster 1, called “land use and land cover” (red), has 47 nodes and 2245 occurrences. This cluster’s topics focus on applying GEE in land use and land cover mapping of different areas [127]. Likewise, the use of this platform to identify land use and land cover changes (LULCC) in a reservoir catchment allows for observing if there is any climate impact [101]. LULCC has also been used to identify subsurface drainage [128]. Furthermore, there are applications in urban areas using population mapping [84].
Cluster 2, labeled “cloud computing” (green), has 38 nodes and 513 occurrences. This group research includes using the Google Earth Engine Cloud Computing Platform [79,103] and developing GEE algorithms for flood monitoring and mapping locally and globally [98,129]. Other topics include land cover changes [130], and identifying possible affected mangrove areas to prevent their loss [17,131]. In addition, other studies have integrated in situ data, satellite data, and linear regression and machine learning models to estimate the volume of forest areas [132].
Cluster 3, called “machine learning” (blue), has 37 nodes and 997 occurrences. Studies in this cluster focus on processed and curated datasets for deep learning [133,134] and spatial and temporal pattern mapping [135]. It also includes wetland change detection using GEE algorithms [136], the presentation of automatic dataset generators for Earth observation [137], and soil surface moisture mapping focusing on machine learning in GEE [138]. Also, applied unsupervised deep learning was also used to identify flood-affected areas [139].
Cluster 4, called “sustainability” (yellow), has 45 nodes and 854 occurrences. It contains studies on data from physical geography and Earth observation to address sustainability challenges [140]. Furthermore, these studies include research on land use and land cover [141], land degradation [142], croplands [143], and others. In addition, this cluster includes an analysis of wildfires in Australia through machine learning [144].
Cluster 5, labeled “spectral index” (purple), has 31 nodes and 776 occurrences. This group’s research focused on constructing high-resolution maps using satellite data and spectral indices. The studies in this cluster made estimates of global land surface temperature [125], identified areas affected by climate change and possible reasons for climate change [145,146], and reconstructed NDVI time series data with information from sensors such as MODIS [147]. Other research combined spectral indices such as NDVI, EVI, NDWI, and algorithms for crop identification [148], and analysis of temporal patterns and effects on vegetation indices [149].
Cluster 6, called “classification” (turquoise), has 29 nodes and 845 occurrences. This cluster includes studies on procedures used in image classification for crop mapping [150] and land cover [151]. In addition, there is a study on land use change assessment using Sentinel 2 products [152]. It also included the analysis of the GEE classifier’s performance, among which are the minimum distance (MD), support vector machine (SVM), classification and regression trees (CART), random forest (RF), and Naive Bayes (NB) [153].
Cluster 7, called “remote sensing applications” (orange), has 26 nodes and 794 occurrences. Publications in this cluster focused on the use of big data in land cover delineation and quantification using computer platforms [154], as well as forest fire mapping [155], land cover changes, and air quality [156]. Publications in this cluster also analyzed ecosystem services using population data, meteorological data, terrain characteristics, and data from the Food and Agriculture Organization (FAO) [86]. This cluster includes a study on data processing in the cloud for remote sensing of seas and oceans [157].
Cluster 8, labeled “multi-temporal analysis” (brown), has 23 nodes and 255 occurrences. This group includes multitemporal analysis of satellite images [158] and multitemporal mapping of population distribution in China [159]. Other studies focus on identifying LULC changes [160], coastline monitoring [161], and others.
Cluster 9, called “satellite imagery” (pink), has 21 nodes and 264 occurrences. The studies included in this group focus on using satellite images and employing GEE for their respective geoprocessing [162]. Also, a study that estimates sub-hydro flattened water surfaces [163] uses spectral unmixing techniques for habitat remote sensing for migratory shorebird conservation [164], among others.
Cluster 10, labeled “vegetation index” (very light red), has 14 nodes and 226 occurrences on the use of vegetation indices in cropland mapping [124]. Other topics include flood influence assessment [165] and the development of phenological and GEE-based algorithms [166]. It also provides automation methods for mapping paddy rice production [167]. Other studies focused on evaluating the annual dynamics of vegetation cover and its climatic impact [168].
3.2.2. Co-Authorship Network Analysis
The country/author co-authorship network (Figure 9) indicates the relationship and degree of collaboration between countries/authors in the field of GEE research [169]. The lines linking the nodes indicate the co-authorship between countries/authors; the distance between clusters shows their strength and how much the countries and authors publish in co-authorship [170]. Figure 9a shows the co-authorship by the country network, comprised of 71 countries (nodes) distributed in eight clusters. Furthermore, Figure 9b shows the co-authorship by the authors’ network, with a structure is 16 clusters and 397 nodes.
USA and China are the countries with the highest productivity and present a strong co-authorship relationship (link strength 146); Gong, P. and Liu, X., with affiliations from China and USA, respectively, present different collaborations; two of them are the most cited articles and refer to the creation of global maps of an artificial impervious zone to identify human settlements and their possible environmental impact (362 citations) [96] and satellite remote sensing of changes in human settlements in China as reflected by impervious surfaces (247 citations) [120]. Iran and Canada have a strong co-authorship relationship (link strength 34); Moghimi, A. (Iran) y Amani, M. (Canada) developed a method for assessing flood damage in different types of land use and land cover [171]. Likewise, USA and India present co-authorship (link strength 27), where Kumar, V. (India) and Ellenburg, W.L. (USA) used Sentinel-1 data and the Otsu method to map flooded areas [172]. China and Australia also have a close relationship (link strength 20), where Zhang, Y (China) and Kong, D. (Australia) have developed analyses on global evapotranspiration and gross primary production [122].
3.2.3. Co-Citation Network of Cited Authors
This analysis highlights which authors have been considered in scientific publications to form the knowledge base (reference documents) of the intellectual structure studied [173,174,175]. Figure 10 shows this co-citation network of cited authors, where a structure of 5 clusters and 1000 authors, considering a minimum of 20 citations. The network has 465,623 links and a link strength of 11,147,647.
Cluster 1 (red) is called “Spatio-temporal analysis and time series” and has 397 authors. This cluster contains topics related to space–time analysis applied in various contexts and time series to measure the development of a specific factor. The group is led by Li X., with 1631 citations, presenting papers on mapping coasts, plains, and phenological elements using the time series of Landsat images and observing space–time dynamics [176,177,178]. Wang J. (with 1533 citations) has also been prominent with studies on vegetation indices’ annual mapping and temporal responses [96,179]. Another notable author is Zhang Y., who analyzes satellite images to measure spatial and temporal variations [180].
Cluster 2 (green) is called “GEE capacities” and has 230 authors and 48,353 citations. These studies are related to showing the potential of the GEE platform and its different applications. This group includes Thau D. (1964), Hancher M. (1714), Moore R. (1709), Dixon M. (1384), and Ilyuschenko S. (1326), who have worked together on feature-related studies and GEE research [1]. Also, they worked on papers using the GEE methodology on topics such as forest cover change [181], remote sensing [182], and more.
Cluster 3 (blue), called “Cropland”, comprises 171 authors and has 29,109 citations. The studies are related to the mapping and monitoring of crop fields, agriculture, and the expansion or reduction of vegetation. In this group, we find Xiao X.M. (1363), Dong J. (1120), and Qin Y. (808) with research mapping rice, deciduous rubber plantations, and forests [79,183]. Gong P. (1034) has also excelled in the geospatial estimation of ecosystem services at the global level [86].
Cluster 4 (yellow), called “Cloud computing and big data”, has 155 authors and 23,089 citations. This cluster’s studies cover geoprocessing in the cloud and big data management. The most prominent author is Gorelick N. (2194), who has worked on a review of GEE, a platform for large-scale geoprocessing of data [1]. Huang C.Q. (657) used GEE applications in flood studies using large datasets on this platform [98]. Breiman L. (593) has worked on papers in machine learning and random forest [184]. Also, there is Brisco B. (574) with the automation of surface water mapping [185].
Cluster 5 (purple), called “Land use/cover and temperature”, has 77 authors and 6106 citations. The studies of this cluster are related to the classification of land use and land cover and the monitoring of the Earth’s surface temperature. Huang H.B. (464) and Clinton N. (401) have carried out a mapping of land occupation and identified its major dynamics [85]. Also, Clinton N. has presented papers on urban heat islands [186]. Weng Q.H. (345) has presented papers where they analyze the surface temperature through satellite images [187].
3.2.4. Journal’s Co-Citation Network
This analysis determines the research accumulated over time in this field of study based on various disciplines reflected in the journals found in the references [188,189]. Figure 11 shows the journal co-citation network, comprised of 398 journals (nodes) with at least 20 citations, distributed in 6 clusters.
Cluster 1 (red), “Hydrology and geophysical”, has 99 nodes and a total of 14,972 citations, including Journal of Hydrology (The Netherlands, with 1016 citations), Journal of Geophysical Research (The United States, 974), Geophysical Research Letters (The United States, 798), Scientific Reports (The United Kingdom, 758), Water Resources Research (The United States, 627), among others.
Cluster 2 (green), “Science and Nature”, contains 94 nodes with 14,120 citations. In this group, the following stand out; Science (The United States, 1341), Nature (The United Kingdom, 1335), Environmental Research Letters (The United Kingdom, 789), PLoS ONE (The United States, 779), Proceedings of the National Academy of Sciences of The United States of America (The United States, 773), among others.
Cluster 3 (blue), “Environment and sustainability”, has 72 nodes and a total of 11,205 citations, including Science of the Total Environment (The Netherlands, 1849 citations), Sustainability (Switzerland, 680), Environmental Monitoring and Assessment (The Netherlands, 506), Journal of Environmental Management (The United States, 458), Land Use Policy (The United Kingdom, 428), among others.
Cluster 4 (yellow), “Remote sensing”, presents 49 nodes with 46,212 citations. In this cluster, the following stand out: Remote Sensing of Environment (The United States, 16,188), Remote Sensing (Switzerland, 11,122), International Journal of Remote Sensing (The United Kingdom, 4389), ISPRS Journal of Photogrammetry and Remote Sensing (The Netherlands, 3143), International Journal of Applied Earth Observation and Geoinformation (The Netherlands, 2184), IEEE Transactions on Geoscience and Remote Sensing (The United States, 1501), IEEE Journal of Selected Topics in Applied Earth Observations and Remote Sensing (The United States, 941), Photogrammetric Engineering and Remote Sensing (The United States, 712), among others.
Cluster 5 (purple), “agriculture”, has 45 nodes and 4620 citations. In this group, there are journals such as Agricultural and Forest Meteorology (The Netherlands, 619), Scientific Data (The United Kingdom, 453), Geoderma (The Netherlands, 367), Environmental Modeling and Software (The Netherlands, 339), Catena (The Netherlands, 319), among others.
Cluster 6 (turquoise), “Ecological”, has 39 nodes and 4134 citations. In this group, we find Ecological Indicators (The Netherlands, 1092), Acta Ecologica Sinica (China, 234), Science Bulletin (The Netherlands, 217), Journal of Geographical Sciences (China, 216), Journal of Remote Sensing (China, 216), among others.
4. Discussion
Research and applications in GEE began 12 years ago, with a relevant increase in scientific production (see Figure 2), highlighting articles (77.25%) and conference papers (18.57%). Most of the scientific output is in papers. Remote Sensing of Environment and Remote Sensing are the journals with more publications. On the other hand, among the conference papers with more publications in the area are the International Archives of the Photogrammetry, Remote Sensing and Spatial Information Sciences—ISPRS Archives; and the International Geoscience and Remote Sensing Symposium (IGARSS). Furthermore, these journals and conference papers receive and publish articles mainly in English. The first contribution is modeling a 4D city with GEE [76]. As of 2017, a growing publication trend demonstrates researchers’ interest in this field of study.
This scientific production has received the collaboration of 125 countries. China (1st) and The United States (2nd) correspond to the countries with the most contributions of documents on the subject, with 994 and 623 publications, respectively. Likewise, these countries have the highest number of collaborative works in which at least one of the authors belongs to a different country, and their main topics of study have been cropland mapping [79], land use and land cover [85]. These countries also collaborate with Canada, The United Kingdom, and Brazil (see Figure 3 and Figure 4). Highlighting the impact of developed countries in knowledge production using the GEE platform [2]. These studies were published in nine languages, with English being the most predominant (93.57%).
The results showed that most of the projects have focused on earth and planetary sciences (with 1639 publications), which indicates the potential of GEE in applying solutions for earth sciences, as corroborated by Mutanga and Kumar [28]. The main use of GEE is to obtain and process images. Other subject areas are environmental science (911), computer science (625), agricultural and biological sciences (509), social sciences (459), engineering (396), physics and astronomy (229), among others. This variety in subject areas shows that GEE is a multi-disciplinary tool for solving environmental problems and is essential to achieving the millennium’s development goals [21,28].
The importance of Landsat and Sentinel data is highlighted in the analysis of satellites and sensors used in the GEE research. Landsat is the most used because it is the satellite mission with the most significant historical and continuous data, facilitating multi-temporal studies since 1972 [190,191]. At the same time, Sentinel made satellite images available in 2015 with higher spatial (10 m) and temporal (every five days) resolution [192].
The study’s intellectual structure analysis used three bibliometric maps as relevant graphic representations of the topic. The author’s keywords co-occurrence was analyzed in the first place (see Figure 9), where the presence of overlapping clusters is observed, with a central element called “Google Earth Engine”. The co-occurrence demonstrates that the research focused on the elaboration of machine learning algorithms (blue cluster) and remote sensing applications (orange cluster) based on cloud computing (green cluster). The co-occurrence shows a focus on the use of satellite imagery (pink cluster), which through classification algorithms, can perform multi-temporal analysis (turquoise and brown clusters), employ spectral and vegetation indices (purple and very light red clusters), as is commonly conducted in land use and land cover (red cluster).
Second, the bibliometric map presents the co-citation analysis of the authors, which evidences the relationship between researchers who have spoken or have implemented the GEE platform in their papers (see Figure 11). Gorelick, N., Thau, D., Moore, R., and Hancher, M. (yellow and green clusters) were the authors with the most relevant papers on research and applications of GEE [1,116,193], standing out with the substantial number of citations they have acquired in their publications. In addition, there were important contributions by Li, X., Wang, J, and Zhang, Y. in the spatio-temporal analysis and elaboration of time series [177,178,179,180]. Xiao, X.M. and Dong, J. have contributed publications related to vegetation [194,195], while Gong, P., Clinton, N., and Weng, Q.H. presented LULC and temperature monitoring [196,197].
Third, according to the analysis of the co-citation network. The red cluster contains the most significant number of journals with themes related to hydrology and geophysical. The yellow cluster stood out by its number of relevant citations and the journals with the highest number of publications on GEE (Remote Sensing, Remote Sensing of Environment) and citations in papers related to remote sensing. The other clusters (green, blue, and purple) deal with multidisciplinary issues.
5. Conclusions
This study analyzed and evaluated the intellectual structure of 2800 documents related to the Google Earth Engine platform, the same ones indexed in the Scopus database, between 2011 and 2022. The results showed that scientific evolution is a growing trend, as evident by the contribution of 125 countries and 398 journals.
The most significant publications and citations came from two journals, (i) Remote Sensing and (ii) Remote Sensing of Environment. Scientific production mainly focused on developed countries like China and The United States. In addition, the co-occurrence analysis of author keywords revealed GEE research topics related to land use, land cover, cloud computing, machine learning, sustainability, spectral index, classification, remote sensing, multi-temporal, satellite imagery, and vegetation index, among others.
GEE has proven to be an emergent web platform with the potential to manage big satellite data easily. Furthermore, GEE is considered a multidisciplinary tool with multiple applications in various areas of knowledge, such as earth and planetary science, environmental sciences, computing, agriculture, biology, and engineering, among others. These qualities made it easier for researchers worldwide to create, replicate, analyze, and share algorithms in the cloud using remote sensing applications.
The research identified the relatively new platform application in different geographical scales and areas of knowledge. Furthermore, the present study seeks to facilitate access to relevant information about a given study area, identify emerging topics, and facilitate collaboration among countries and authors. Finally, this study can serve as a guide for researchers and their future research projects.
6. Limitations and Future Research Directions
The study has some limitations related to (i) bias in the analysis, given that the number of citations or documents is not the only quality criteria; (ii) some important documents may be excluded when only considering the Scopus database since there are also other databases such as Web of Science, Dimensions, Scielo, among others; (iii) it is not possible to combined database in the VOSviewer software; (iv) the information collected only includes documents up to February 2023, so the current year presents incomplete information in this study.
Research using the Google Earth Engine platform has shown rapid growth in recent years, promoting the emergence of new research topics and the need to expand knowledge. As a result, the following topics are recommended for future research:
- Studies in developing countries. The most significant contribution of publications on GEE corresponds to developed countries. Advantageously, GEE is free, and the GEE algorithms facilitate replicating these studies in different regions by changing variables and parameters. In this way, developing countries can have the opportunity to collaborate with the generation of knowledge.
- Remote sensing applications. GEE has shown its potential in disaster mapping. However, it can delve into: droughts [198,199], earthquakes [200], floods [201,202], fires [203,204], and landslides [205,206]. Likewise, environmental monitoring [207] and mangrove mapping [208] have become very important in recent years.
- Global maps. Land cover and land use maps have been studied and elaborated in specific areas [85]. However, only some studies approach the application of GEE from a global perspective [96,119]. With the constant increase in satellite images and geoprocessing in the cloud, the production of high-precision global maps on land use and cover, vegetation indices, and geophysical and climatic data, among others, is expected.
- Monitoring of migration of animal species. With high-resolution images, knowledge of animal species, and the use of GEE, it is possible to identify the ecosystems where animal species live.
- Studies showing innovative methodologies and algorithms. Cloud processing facilitates research in terms of time and resources. An example is the inclusion of new algorithms that can combine indexes and classify images.
Author Contributions
Conceptualization, A.V.-M., N.M.-B. and P.C.-M.; methodology, A.V.-M., N.M.-B. and H.R.-T.; software, N.M.-B. and H.R.-T.; validation, A.V.-M., N.M.-B., P.C.-M. and H.R.-T.; formal analysis, A.V.-M., N.M.-B., P.C.-M., H.R.-T., L.S. and M.A.; investigation, A.V.-M., N.M.-B., P.C.-M., H.R.-T., L.S. and M.A.; resources, A.V.-M. and P.C.-M.; data curation, N.M.-B. and H.R.-T.; writing—original draft preparation, A.V.-M., N.M.-B., P.C.-M., H.R.-T., L.S. and M.A.; writing—review and editing, A.V.-M., N.M.-B., P.C.-M., H.R.-T., L.S. and M.A.; visualization, N.M.-B. and H.R.-T.; supervision, A.V.-M.; project administration, A.V.-M. and P.C.-M. All authors have read and agreed to the published version of the manuscript.
Funding
This research received no external institutional funding.
Data Availability Statement
Not applicable.
Acknowledgments
This study was supported by the research projects of the ESPOL University (Escuela Superior Politécnica del Litoral): (a) ILCA: Impact of Land Cover change in the Amazon with code no. FICT-7-2023; (b) “Proyecto de Gestión y Evaluación de la Investigación Científica en Ciencias de la Tierra, Economía, Administración y sus vínculos con la Sociedad” (Project on Management and Evaluation of Scientific Research in Earth Sciences, Economics, Administration and their links with Society) with the code no. CIPAT-7-2022. Marcos Adami acknowledges the Brazilian National Council for Scientific and Technological Development (CNPq) for the fellowship [306334/2020-8]. We also would like to thank four anonymous reviewers for their constructive comments and the editorial office for the editorial handling. The authors would like to thank the Brazilian Space Agency for the paper’s support.
Conflicts of Interest
The authors declare no conflict of interest.
References
- Gorelick, N.; Hancher, M.; Dixon, M.; Ilyushchenko, S.; Thau, D.; Moore, R. Google Earth Engine: Planetary-scale geospatial analysis for everyone. Remote Sens. Environ. 2017, 202, 18–27. [Google Scholar] [CrossRef]
- Kumar, L.; Mutanga, O. Google Earth Engine applications since inception: Usage, trends, and potential. Remote Sens. 2018, 10, 1509. [Google Scholar] [CrossRef] [Green Version]
- Parente, L.; Taquary, E.; Silva, A.P.; Souza, C.; Ferreira, L. Next Generation Mapping: Combining Deep Learning, Cloud Computing, and Big Remote Sensing Data. Remote Sens. 2019, 11, 2881. [Google Scholar] [CrossRef] [Green Version]
- Padarian, J.; Minasny, B.; McBratney, A.B. Using Google’s cloud-based platform for digital soil mapping. Comput. Geosci. 2015, 83, 80–88. [Google Scholar] [CrossRef]
- Xulu, S.; Peerbhay, K.; Gebreslasie, M.; Ismail, R. Drought Influence on Forest Plantations in Zululand, South Africa, Using MODIS Time Series and Climate Data. Forests 2018, 9, 528. [Google Scholar] [CrossRef] [Green Version]
- Mbatha, N.; Xulu, S. Time Series Analysis of MODIS-Derived NDVI for the Hluhluwe-Imfolozi Park, South Africa: Impact of Recent Intense Drought. Climate 2018, 6, 95. [Google Scholar] [CrossRef] [Green Version]
- Vos, K.; Splinter, K.D.; Harley, M.D.; Simmons, J.A.; Turner, I.L. CoastSat: A Google Earth Engine-enabled Python toolkit to extract shorelines from publicly available satellite imagery. Environ. Model. Softw. 2019, 122, 104528. [Google Scholar] [CrossRef]
- Stromann, O.; Nascetti, A.; Yousif, O.; Ban, Y. Dimensionality Reduction and Feature Selection for Object-Based Land Cover Classification based on Sentinel-1 and Sentinel-2 Time Series Using Google Earth Engine. Remote Sens. 2019, 12, 76. [Google Scholar] [CrossRef] [Green Version]
- Aybar, C.; Wu, Q.; Bautista, L.; Yali, R.; Barja, A. rgee: An R package for interacting with Google Earth Engine. J. Open Source Softw. 2020, 5, 2272. [Google Scholar] [CrossRef]
- Crego, R.; Masolele, M.; Connette, G.; Stabach, J. Enhancing Animal Movement Analyses: Spatiotemporal Matching of Animal Positions with Remotely Sensed Data Using Google Earth Engine and R. Remote Sens. 2021, 13, 4154. [Google Scholar] [CrossRef]
- Li, H.; Wan, W.; Fang, Y.; Zhu, S.; Chen, X.; Liu, B.; Hong, Y. A Google Earth Engine-enabled software for efficiently generating high-quality user-ready Landsat mosaic images. Environ. Model. Softw. 2019, 112, 16–22. [Google Scholar] [CrossRef]
- Panidi, E.; Rykin, I.; Kikin, P.; Kolesnikov, A. Cloud-Desktop remote sensing data management to ensure time series analysis, integration of QGIS and Google Earth Engine. Int. Arch. Photogramm. Remote Sens. Spat. Inf. Sci. 2020, XLIII-B4-2020, 553–558. [Google Scholar] [CrossRef]
- Fischer, G. Seeding, Evolutionary Growth and Reseeding: Constructing, Capturing and Evolving Knowledge in Domain-Oriented Design Environments. Autom. Softw. Eng. 1998, 5, 447–464. [Google Scholar] [CrossRef]
- He, M.; Kimball, J.; Maneta, M.; Maxwell, B.; Moreno, A.; Beguería, S.; Wu, X. Regional Crop Gross Primary Productivity and Yield Estimation Using Fused Landsat-MODIS Data. Remote Sens. 2018, 10, 372. [Google Scholar] [CrossRef] [Green Version]
- Tsai, Y.; Stow, D.; Chen, H.; Lewison, R.; An, L.; Shi, L. Mapping Vegetation and Land Use Types in Fanjingshan National Nature Reserve Using Google Earth Engine. Remote Sens. 2018, 10, 927. [Google Scholar] [CrossRef] [Green Version]
- Parente, L.; Ferreira, L. Assessing the Spatial and Occupation Dynamics of the Brazilian Pasturelands Based on the Automated Classification of MODIS Images from 2000 to 2016. Remote Sens. 2018, 10, 606. [Google Scholar] [CrossRef] [Green Version]
- Diniz, C.; Cortinhas, L.; Nerino, G.; Rodrigues, J.; Sadeck, L.; Adami, M.; Souza-Filho, P. Brazilian Mangrove Status: Three Decades of Satellite Data Analysis. Remote Sens. 2019, 11, 808. [Google Scholar] [CrossRef] [Green Version]
- Souza, C.M.; Z. Shimbo, J.; Rosa, M.R.; Parente, L.L.; A. Alencar, A.; Rudorff, B.F.T.; Hasenack, H.; Matsumoto, M.; G. Ferreira, L.; Souza-Filho, P.W.M.; et al. Reconstructing Three Decades of Land Use and Land Cover Changes in Brazilian Biomes with Landsat Archive and Earth Engine. Remote Sens. 2020, 12, 2735. [Google Scholar] [CrossRef]
- Velastegui-Montoya, A.; Rivera-Torres, H.; Herrera-Matamoros, V.; Sadeck, L.; Quevedo, R.P. Application of Google Earth Engine for land Cover Classification in Yasuni National Park, Ecuador. In Proceedings of the IGARSS 2022—2022 IEEE International Geoscience and Remote Sensing Symposium, Kuala Lumpur, Malaysia, 17–22 July 2022; pp. 6376–6379. [Google Scholar]
- Liu, C.-C.; Shieh, M.-C.; Ke, M.-S.; Wang, K.-H. Flood Prevention and Emergency Response System Powered by Google Earth Engine. Remote Sens. 2018, 10, 1283. [Google Scholar] [CrossRef] [Green Version]
- Ravanelli, R.; Nascetti, A.; Cirigliano, R.; Di Rico, C.; Leuzzi, G.; Monti, P.; Crespi, M. Monitoring the Impact of Land Cover Change on Surface Urban Heat Island through Google Earth Engine: Proposal of a Global Methodology, First Applications and Problems. Remote Sens. 2018, 10, 1488. [Google Scholar] [CrossRef] [Green Version]
- Ermida, S.L.; Soares, P.; Mantas, V.; Göttsche, F.M.; Trigo, I.F. Google earth engine open-source code for land surface temperature estimation from the landsat series. Remote Sens. 2020, 12, 1471. [Google Scholar] [CrossRef]
- Parks, S.A.; Holsinger, L.M.; Voss, M.A.; Loehman, R.A.; Robinson, N.P. Mean composite fire severity metrics computed with google earth engine offer improved accuracy and expanded mapping potential. Remote Sens. 2018, 10, 879. [Google Scholar] [CrossRef] [Green Version]
- Traganos, D.; Poursanidis, D.; Aggarwal, B.; Chrysoulakis, N.; Reinartz, P. Estimating satellite-derived bathymetry (SDB) with the Google Earth Engine and sentinel-2. Remote Sens. 2018, 10, 859. [Google Scholar] [CrossRef] [Green Version]
- Souza, C.; Kirchhoff, F.; Oliveira, B.; Ribeiro, J.; Sales, M. Long-Term Annual Surface Water Change in the Brazilian Amazon Biome: Potential Links with Deforestation, Infrastructure Development and Climate Change. Water 2019, 11, 566. [Google Scholar] [CrossRef] [Green Version]
- Xu, J.; Xiao, W.; He, T.; Deng, X.; Chen, W. Extraction of built-up area using multi-sensor data—A case study based on Google earth engine in Zhejiang Province, China. Int. J. Remote Sens. 2021, 42, 389–404. [Google Scholar] [CrossRef]
- Xiao, W.; Deng, X.; He, T.; Chen, W. Mapping Annual Land Disturbance and Reclamation in a Surface Coal Mining Region Using Google Earth Engine and the LandTrendr Algorithm: A Case Study of the Shengli Coalfield in Inner Mongolia, China. Remote Sens. 2020, 12, 1612. [Google Scholar] [CrossRef]
- Mutanga, O.; Kumar, L. Google earth engine applications. Remote Sens. 2019, 11, 591. [Google Scholar] [CrossRef] [Green Version]
- Tamiminia, H.; Salehi, B.; Mahdianpari, M.; Quackenbush, L.; Adeli, S.; Brisco, B. Google Earth Engine for geo-big data applications: A meta-analysis and systematic review. ISPRS J. Photogramm. Remote Sens. 2020, 164, 152–170. [Google Scholar] [CrossRef]
- Zhao, Q.; Yu, L.; Li, X.; Peng, D.; Zhang, Y.; Gong, P. Progress and Trends in the Application of Google Earth and Google Earth Engine. Remote Sens. 2021, 13, 3778. [Google Scholar] [CrossRef]
- Wang, Y.; Lu, Z.; Sheng, Y.; Zhou, Y. Remote Sensing Applications in Monitoring of Protected Areas. Remote Sens. 2020, 12, 1370. [Google Scholar] [CrossRef]
- Fahimnia, B.; Sarkis, J.; Davarzani, H. Green supply chain management: A review and bibliometric analysis. Int. J. Prod. Econ. 2015, 162, 101–114. [Google Scholar] [CrossRef]
- Md Khudzari, J.; Kurian, J.; Tartakovsky, B.; Vijaya Raghavan, G.S. Bibliometric analysis of global research trends on microbial fuel cells using Scopus database. Biochem. Eng. J. 2018, 136, 51–60. [Google Scholar] [CrossRef]
- Montalván-Burbano, N.; Velastegui-Montoya, A.; Gurumendi-Noriega, M.; Morante-Carballo, F.; Adami, M. Worldwide Research on Land Use and Land Cover in the Amazon Region. Sustainability 2021, 13, 6039. [Google Scholar] [CrossRef]
- Ma, R.; Ho, Y.S. Comparison of environmental laws publications in Science Citation Index Expanded and Social Science Index: A bibliometric analysis. Scientometrics 2016, 109, 227–239. [Google Scholar] [CrossRef]
- Herrera-Franco, G.; Montalván-Burbano, N.; Mora-Frank, C.; Bravo-Montero, L. Scientific Research in Ecuador: A Bibliometric Analysis. Publications 2021, 9, 55. [Google Scholar] [CrossRef]
- Cobo, M.J.; López-Herrera, A.G.; Herrera-Viedma, E.; Herrera, F. An approach for detecting, quantifying, and visualizing the evolution of a research field: A practical application to the Fuzzy Sets Theory field. J. Informetr. 2011, 5, 146–166. [Google Scholar] [CrossRef]
- Donthu, N.; Kumar, S.; Mukherjee, D.; Pandey, N.; Lim, W.M. How to conduct a bibliometric analysis: An overview and guidelines. J. Bus. Res. 2021, 133, 285–296. [Google Scholar] [CrossRef]
- Faust, O.; Hagiwara, Y.; Hong, T.J.; Lih, O.S.; Acharya, U.R. Deep learning for healthcare applications based on physiological signals: A review. Comput. Methods Programs Biomed. 2018, 161, 1–13. [Google Scholar] [CrossRef] [PubMed]
- Rey-Martí, A.; Ribeiro-Soriano, D.; Palacios-Marqués, D. A bibliometric analysis of social entrepreneurship. J. Bus. Res. 2016, 69, 1651–1655. [Google Scholar] [CrossRef]
- Duan, P.; Wang, Y.; Yin, P. Remote Sensing Applications in Monitoring of Protected Areas: A Bibliometric Analysis. Remote Sens. 2020, 12, 772. [Google Scholar] [CrossRef] [Green Version]
- Herrera-Franco, G.; Carrión-Mero, P.; Montalván-Burbano, N.; Caicedo-Potosí, J.; Berrezueta, E. Geoheritage and Geosites: A Bibliometric Analysis and Literature Review. Geosciences 2022, 12, 169. [Google Scholar] [CrossRef]
- Solórzano, J.; Morante-Carballo, F.; Montalván-Burbano, N.; Briones-Bitar, J.; Carrión-Mero, P. A Systematic Review of the Relationship between Geotechnics and Disasters. Sustainability 2022, 14, 12835. [Google Scholar] [CrossRef]
- Herrera-Franco, G.; Carrión-Mero, P.; Montalván-Burbano, N.; Mora-Frank, C.; Berrezueta, E. Bibliometric Analysis of Groundwater’s Life Cycle Assessment Research. Water 2022, 14, 1082. [Google Scholar] [CrossRef]
- Della Corte, V.; Del Gaudio, G.; Sepe, F.; Luongo, S. Destination Resilience and Innovation for Advanced Sustainable Tourism Management: A Bibliometric Analysis. Sustainability 2021, 13, 12632. [Google Scholar] [CrossRef]
- de Sousa, F.D.B. Management of plastic waste: A bibliometric mapping and analysis. Waste Manag. Res. J. Sustain. Circ. Econ. 2021, 39, 664–678. [Google Scholar] [CrossRef]
- Aldás-Onofre, J.; Cordero, B. Bibliometric Analysis of Web of Science Database STEM Fields in Engineering and Mathematics. Ecuador’s Case Study. In Applied Technologies; Botto-Tobar, M., Zambrano Vizuete, M., Montes León, S., Torres-Carrión, P., Durakovic, B., Eds.; Springer: Cham, Switzerland, 2023; pp. 255–270. ISBN 978-3-031-24985-3. [Google Scholar]
- Andrés, A. Measuring Academic Research: How to Undertake a Bibliometric Study; Chandos Publishing: Oxford, UK, 2009; ISBN 9781843345282. [Google Scholar]
- Baas, J.; Schotten, M.; Plume, A.; Côté, G.; Karimi, R. Scopus as a curated, high-quality bibliometric data source for academic research in quantitative science studies. Quant. Sci. Stud. 2020, 1, 377–386. [Google Scholar] [CrossRef]
- Martín-Martín, A.; Thelwall, M.; Orduna-Malea, E.; Delgado López-Cózar, E. Google Scholar, Microsoft Academic, Scopus, Dimensions, Web of Science, and OpenCitations’ COCI: A multidisciplinary comparison of coverage via citations. Scientometrics 2021, 126, 871–906. [Google Scholar] [CrossRef]
- Singh, V.K.; Singh, P.; Karmakar, M.; Leta, J.; Mayr, P. The journal coverage of Web of Science, Scopus and Dimensions: A comparative analysis. Scientometrics 2021, 126, 5113–5142. [Google Scholar] [CrossRef]
- del Río-Rama, M.; Maldonado-Erazo, C.; Álvarez-García, J.; Durán-Sánchez, A. Cultural and Natural Resources in Tourism Island: Bibliometric Mapping. Sustainability 2020, 12, 724. [Google Scholar] [CrossRef] [Green Version]
- Meseguer-Sánchez, V.; Abad-Segura, E.; Belmonte-Ureña, L.J.; Molina-Moreno, V. Examining the Research Evolution on the Socio-Economic and Environmental Dimensions on University Social Responsibility. Int. J. Environ. Res. Public Health 2020, 17, 4729. [Google Scholar] [CrossRef]
- Morante-Carballo, F.; Montalván-Burbano, N.; Carrión-Mero, P.; Jácome-Francis, K. Worldwide Research Analysis on Natural Zeolites as Environmental Remediation Materials. Sustainability 2021, 13, 6378. [Google Scholar] [CrossRef]
- Faruk, M.; Rahman, M.; Hasan, S. How digital marketing evolved over time: A bibliometric analysis on scopus database. Heliyon 2021, 7, e08603. [Google Scholar] [CrossRef] [PubMed]
- Chàfer, M.; Cabeza, L.F.; Pisello, A.L.; Tan, C.L.; Wong, N.H. Trends and gaps in global research of greenery systems through a bibliometric analysis. Sustain. Cities Soc. 2021, 65, 102608. [Google Scholar] [CrossRef]
- Taşkın, Z.; Aydinoglu, A.U. Collaborative interdisciplinary astrobiology research: A bibliometric study of the NASA Astrobiology Institute. Scientometrics 2015, 103, 1003–1022. [Google Scholar] [CrossRef]
- Aqlan, F.; Nwokeji, J.C.; Shamsan, A. Teaching an Introductory Data Analytics Course Using Microsoft Access® and Excel®. In Proceedings of the 2020 IEEE Frontiers in Education Conference (FIE), Uppsala, Sweden, 21–24 October 2020; pp. 1–10. [Google Scholar]
- Kalantari, A.; Kamsin, A.; Kamaruddin, H.S.; Ale Ebrahim, N.; Gani, A.; Ebrahimi, A.; Shamshirband, S. A bibliometric approach to tracking big data research trends. J. Big Data 2017, 4, 30. [Google Scholar] [CrossRef] [Green Version]
- Environmental Systems Research Institute ArcGIS Pro. Available online: https://www.esri.com/en-us/arcgis/products/arcgis-pro/overview (accessed on 5 December 2021).
- Demiroglu, O.; Hall, C. Geobibliography and Bibliometric Networks of Polar Tourism and Climate Change Research. Atmosphere 2020, 11, 498. [Google Scholar] [CrossRef]
- Souza, L.; Bueno, C. City Information Modelling as a support decision tool for planning and management of cities: A systematic literature review and bibliometric analysis. Build. Environ. 2022, 207, 108403. [Google Scholar] [CrossRef]
- van Eck, N.J.; Waltman, L. Software survey: VOSviewer, a computer program for bibliometric mapping. Scientometrics 2010, 84, 523–538. [Google Scholar] [CrossRef] [Green Version]
- van Eck, N.J.; Waltman, L. Citation-based clustering of publications using CitNetExplorer and VOSviewer. Scientometrics 2017, 111, 1053–1070. [Google Scholar] [CrossRef] [Green Version]
- Chandra, Y. Mapping the evolution of entrepreneurship as a field of research (1990–2013): A scientometric analysis. PLoS ONE 2018, 13, e0190228. [Google Scholar] [CrossRef] [Green Version]
- Payán-Sánchez, B.; Belmonte-Ureña, L.J.; Plaza-Úbeda, J.A.; Vazquez-Brust, D.; Yakovleva, N.; Pérez-Valls, M. Open Innovation for Sustainability or Not: Literature Reviews of Global Research Trends. Sustainability 2021, 13, 1136. [Google Scholar] [CrossRef]
- Abad-Segura, E.; Cortés-García, F.J.; Belmonte-Ureña, L.J. The Sustainable Approach to Corporate Social Responsibility: A Global Analysis and Future Trends. Sustainability 2019, 11, 5382. [Google Scholar] [CrossRef] [Green Version]
- Noyons, E.C.M.; Moed, H.F.; Van Raan, A.F.J. Integrating research performance analysis and science mapping. Scientometrics 1999, 46, 591–604. [Google Scholar] [CrossRef]
- Baier-Fuentes, H.; Merigó, J.M.; Amorós, J.E.; Gaviria-Marín, M. International entrepreneurship: A bibliometric overview. Int. Entrep. Manag. J. 2019, 15, 385–429. [Google Scholar] [CrossRef]
- Zupic, I.; Čater, T. Bibliometric Methods in Management and Organization. Organ. Res. Methods 2015, 18, 429–472. [Google Scholar] [CrossRef]
- Mesdaghinia, A.; Younesian, M.; Nasseri, S.; Nodehi, R.N.; Hadi, M. Analysis of the microbial risk assessment studies from 1973 to 2015: A bibliometric case study. Scientometrics 2015, 105, 691–707. [Google Scholar] [CrossRef]
- Thelwall, M. Mendeley reader counts for US computer science conference papers and journal articles. Quant. Sci. Stud. 2020, 1, 347–359. [Google Scholar] [CrossRef]
- Martín-Martín, A.; Orduna-Malea, E.; Thelwall, M.; Delgado López-Cózar, E. Google Scholar, Web of Science, and Scopus: A systematic comparison of citations in 252 subject categories. J. Informetr. 2018, 12, 1160–1177. [Google Scholar] [CrossRef] [Green Version]
- Vera-Baceta, M.-A.; Thelwall, M.; Kousha, K. Web of Science and Scopus language coverage. Scientometrics 2019, 121, 1803–1813. [Google Scholar] [CrossRef]
- Moed, H.F.; de Moya-Anegon, F.; Guerrero-Bote, V.; Lopez-Illescas, C. Are nationally oriented journals indexed in Scopus becoming more international? The effect of publication language and access modality. J. Informetr. 2020, 14, 1803–1813. [Google Scholar] [CrossRef] [Green Version]
- Keller, F.; Sänger, J.; Kersten, T.; Schiewe, J. Historisches 4D-Stadtmodell der Freien und Hansestadt Hamburg—Automatisierte Generierung und Darstellung innerhalb der Google Earth Engine. Photogramm.-Fernerkund.-Geoinf. 2011, 2011, 155–169. [Google Scholar] [CrossRef] [PubMed]
- Kisilevich, S.; Keim, D.; Lasry, A.; Bam, L.; Rokach, L. Developing Analytical GIS Applications with GEO-SPADE: Three Success Case Studies. In Lecture Notes in Business Information Processing; Filipe, J., Cordeiro, J., Eds.; Springer: Berlin/Heidelberg, Germany, 2011; pp. 495–511. [Google Scholar]
- Sun, E.; Zhang, X.; Li, Z. Internet of Things Based 3D Assisted Driving System for Trucks in Mines. In Proceedings of the 2011 International Conference on Information Management, Innovation Management and Industrial Engineering, Shenzhen, China, 26–27 November 2011; pp. 510–513. [Google Scholar]
- Dong, J.; Xiao, X.; Menarguez, M.A.; Zhang, G.; Qin, Y.; Thau, D.; Biradar, C.; Moore, B. Mapping paddy rice planting area in northeastern Asia with Landsat 8 images, phenology-based algorithm and Google Earth Engine. Remote Sens. Environ. 2016, 185, 142–154. [Google Scholar] [CrossRef] [PubMed] [Green Version]
- Johansen, K.; Phinn, S.; Taylor, M. Mapping woody vegetation clearing in Queensland, Australia from Landsat imagery using the Google Earth Engine. Remote Sens. Appl. Soc. Environ. 2015, 1, 36–49. [Google Scholar] [CrossRef]
- Lemoine, G.; Leo, O. Crop Mapping Applications at Scale: Using Google Earth Engine to Enable Global Crop Area and Status Monitoring Using Free and Open Data Sources. In Proceedings of the 2015 IEEE International Geoscience and Remote Sensing Symposium (IGARSS), Milan, Italy, 26–31 July 2015; pp. 1496–1499. [Google Scholar]
- Ghatasheh, N.A.; Abu-Faraj, M.M.; Faris, H. Dead sea water level and surface area monitoring using spatial data extraction from remote sensing images. Int. Rev. Comput. Softw. 2013, 8, 2892–2897. [Google Scholar]
- Ndidi, N.F.; Nduka, O.V. Flood Risks Analysis in a Littoral African City: Using Geographic Information System. In Geographic Information Systems (GIS): Techniques, Applications and Technologies; Nielson, D., Ed.; Nova Science Publishers, Inc.: New York, NY, USA, 2014; pp. 279–316. ISBN 978-163321294-7/978-163321293-0. [Google Scholar]
- Patel, N.N.; Angiuli, E.; Gamba, P.; Gaughan, A.; Lisini, G.; Stevens, F.R.; Tatem, A.J.; Trianni, G. Multitemporal settlement and population mapping from Landsat using Google Earth Engine. Int. J. Appl. Earth Obs. Geoinf. 2015, 35, 199–208. [Google Scholar] [CrossRef] [Green Version]
- Huang, H.; Chen, Y.; Clinton, N.; Wang, J.; Wang, X.; Liu, C.; Gong, P.; Yang, J.; Bai, Y.; Zheng, Y.; et al. Mapping major land cover dynamics in Beijing using all Landsat images in Google Earth Engine. Remote Sens. Environ. 2017, 202, 166–176. [Google Scholar] [CrossRef]
- Clinton, N.; Stuhlmacher, M.; Miles, A.; Uludere Aragon, N.; Wagner, M.; Georgescu, M.; Herwig, C.; Gong, P. A Global Geospatial Ecosystem Services Estimate of Urban Agriculture. Earth’s Futur. 2018, 6, 40–60. [Google Scholar] [CrossRef]
- Workie, T.G.; Debella, H.J. Climate change and its effects on vegetation phenology across ecoregions of Ethiopia. Glob. Ecol. Conserv. 2018, 13, e00366. [Google Scholar] [CrossRef]
- Sidhu, N.; Pebesma, E.; Câmara, G. Using Google Earth Engine to detect land cover change: Singapore as a use case. Eur. J. Remote Sens. 2018, 51, 486–500. [Google Scholar] [CrossRef]
- Shao, Z.; Fu, H.; Li, D.; Altan, O.; Cheng, T. Remote sensing monitoring of multi-scale watersheds impermeability for urban hydrological evaluation. Remote Sens. Environ. 2019, 232, 111338. [Google Scholar] [CrossRef]
- Long, X.; Lin, H.; An, X.; Chen, S.; Qi, S.; Zhang, M. Evaluation and analysis of ecosystem service value based on land use/cover change in Dongting Lake wetland. Ecol. Indic. 2022, 136, 108619. [Google Scholar] [CrossRef]
- Zhao, Y.; Zhu, W.; Wei, P.; Fang, P.; Zhang, X.; Yan, N.; Liu, W.; Zhao, H.; Wu, Q. Classification of Zambian grasslands using random forest feature importance selection during the optimal phenological period. Ecol. Indic. 2022, 135, 108529. [Google Scholar] [CrossRef]
- Talucci, A.C.; Loranty, M.M.; Alexander, H.D. Siberian taiga and tundra fire regimes from 2001–2020. Environ. Res. Lett. 2022, 17, 025001. [Google Scholar] [CrossRef]
- Zarinmehr, H.; Tizro, A.T.; Fryar, A.E.; Pour, M.K.; Fasihi, R. Prediction of groundwater level variations based on gravity recovery and climate experiment (GRACE) satellite data and a time-series analysis: A case study in the Lake Urmia basin, Iran. Environ. Earth Sci. 2022, 81, 180. [Google Scholar] [CrossRef]
- Yang, Z.; Dai, X.; Wang, Z.; Gao, X.; Qu, G.; Li, W.; Li, J.; Lu, H.; Wang, Y. The dynamics of Paiku Co lake area in response to climate change. J. Water Clim. Chang. 2022, 13, 2725–2746. [Google Scholar] [CrossRef]
- Thor, A.; Bornmann, L.; Marx, W.; Mutz, R. Identifying single influential publications in a research field: New analysis opportunities of the CRExplorer. Scientometrics 2018, 116, 591–608. [Google Scholar] [CrossRef] [Green Version]
- Gong, P.; Li, X.; Wang, J.; Bai, Y.; Chen, B.; Hu, T.; Liu, X.; Xu, B.; Yang, J.; Zhang, W.; et al. Annual maps of global artificial impervious area (GAIA) between 1985 and 2018. Remote Sens. Environ. 2020, 236, 111510. [Google Scholar] [CrossRef]
- Amani, M.; Mahdavi, S.; Afshar, M.; Brisco, B.; Huang, W.; Mohammad Javad Mirzadeh, S.; White, L.; Banks, S.; Montgomery, J.; Hopkinson, C. Canadian Wetland Inventory using Google Earth Engine: The First Map and Preliminary Results. Remote Sens. 2019, 11, 842. [Google Scholar] [CrossRef] [Green Version]
- DeVries, B.; Huang, C.; Armston, J.; Huang, W.; Jones, J.W.; Lang, M.W. Rapid and robust monitoring of flood events using Sentinel-1 and Landsat data on the Google Earth Engine. Remote Sens. Environ. 2020, 240, 111664. [Google Scholar] [CrossRef]
- Tong, X.; Brandt, M.; Hiernaux, P.; Herrmann, S.; Rasmussen, L.V.; Rasmussen, K.; Tian, F.; Tagesson, T.; Zhang, W.; Fensholt, R. The forgotten land use class: Mapping of fallow fields across the Sahel using Sentinel-2. Remote Sens. Environ. 2020, 239, 111598. [Google Scholar] [CrossRef]
- Anderson, K.; Fawcett, D.; Cugulliere, A.; Benford, S.; Jones, D.; Leng, R. Vegetation expansion in the subnival Hindu Kush Himalaya. Glob. Chang. Biol. 2020, 26, 1608–1625. [Google Scholar] [CrossRef] [Green Version]
- Hao, B.; Ma, M.; Li, S.; Li, Q.; Hao, D.; Huang, J.; Ge, Z.; Yang, H.; Han, X. Land Use Change and Climate Variation in the Three Gorges Reservoir Catchment from 2000 to 2015 Based on the Google Earth Engine. Sensors 2019, 19, 2118. [Google Scholar] [CrossRef] [Green Version]
- Mahdianpari, M.; Salehi, B.; Mohammadimanesh, F.; Homayouni, S.; Gill, E. The First Wetland Inventory Map of Newfoundland at a Spatial Resolution of 10 m Using Sentinel-1 and Sentinel-2 Data on the Google Earth Engine Cloud Computing Platform. Remote Sens. 2018, 11, 43. [Google Scholar] [CrossRef] [Green Version]
- Mahdianpari, M.; Salehi, B.; Mohammadimanesh, F.; Brisco, B.; Homayouni, S.; Gill, E.; DeLancey, E.R.; Bourgeau-Chavez, L. Big Data for a Big Country: The First Generation of Canadian Wetland Inventory Map at a Spatial Resolution of 10-m Using Sentinel-1 and Sentinel-2 Data on the Google Earth Engine Cloud Computing Platform. Can. J. Remote Sens. 2020, 46, 15–33. [Google Scholar] [CrossRef]
- Amani, M.; Ghorbanian, A.; Ahmadi, S.A.; Kakooei, M.; Moghimi, A.; Mirmazloumi, S.M.; Moghaddam, S.H.A.; Mahdavi, S.; Ghahremanloo, M.; Parsian, S.; et al. Google Earth Engine Cloud Computing Platform for Remote Sensing Big Data Applications: A Comprehensive Review. IEEE J. Sel. Top. Appl. Earth Obs. Remote Sens. 2020, 13, 5326–5350. [Google Scholar] [CrossRef]
- Deines, J.M.; Kendall, A.D.; Crowley, M.A.; Rapp, J.; Cardille, J.A.; Hyndman, D.W. Mapping three decades of annual irrigation across the US High Plains Aquifer using Landsat and Google Earth Engine. Remote Sens. Environ. 2019, 233, 111400. [Google Scholar] [CrossRef]
- Poortinga, A.; Tenneson, K.; Shapiro, A.; Nquyen, Q.; San Aung, K.; Chishtie, F.; Saah, D. Mapping Plantations in Myanmar by Fusing Landsat-8, Sentinel-2 and Sentinel-1 Data along with Systematic Error Quantification. Remote Sens. 2019, 11, 831. [Google Scholar] [CrossRef] [Green Version]
- Campos-Taberner, M.; Moreno-Martínez, Á.; García-Haro, F.; Camps-Valls, G.; Robinson, N.; Kattge, J.; Running, S. Global Estimation of Biophysical Variables from Google Earth Engine Platform. Remote Sens. 2018, 10, 1167. [Google Scholar] [CrossRef] [Green Version]
- Teluguntla, P.; Thenkabail, P.S.; Oliphant, A.; Xiong, J.; Gumma, M.K.; Congalton, R.G.; Yadav, K.; Huete, A. A 30-m landsat-derived cropland extent product of Australia and China using random forest machine learning algorithm on Google Earth Engine cloud computing platform. ISPRS J. Photogramm. Remote Sens. 2018, 144, 325–340. [Google Scholar] [CrossRef]
- Parks; Holsinger; Koontz; Collins; Whitman; Parisien; Loehman; Barnes; Bourdon; Boucher; et al. Giving Ecological Meaning to Satellite-Derived Fire Severity Metrics across North American Forests. Remote Sens. 2019, 11, 1735. [Google Scholar] [CrossRef] [Green Version]
- Xiong, J.; Thenkabail, P.S.; Gumma, M.K.; Teluguntla, P.; Poehnelt, J.; Congalton, R.G.; Yadav, K.; Thau, D. Automated cropland mapping of continental Africa using Google Earth Engine cloud computing. ISPRS J. Photogramm. Remote Sens. 2017, 126, 225–244. [Google Scholar] [CrossRef] [Green Version]
- Xiong, J.; Thenkabail, P.; Tilton, J.; Gumma, M.; Teluguntla, P.; Oliphant, A.; Congalton, R.; Yadav, K.; Gorelick, N. Nominal 30-m Cropland Extent Map of Continental Africa by Integrating Pixel-Based and Object-Based Algorithms Using Sentinel-2 and Landsat-8 Data on Google Earth Engine. Remote Sens. 2017, 9, 1065. [Google Scholar] [CrossRef] [Green Version]
- Snapir, B.; Momblanch, A.; Jain, S.K.; Waine, T.W.; Holman, I.P. A method for monthly mapping of wet and dry snow using Sentinel-1 and MODIS: Application to a Himalayan river basin. Int. J. Appl. Earth Obs. Geoinf. 2019, 74, 222–230. [Google Scholar] [CrossRef] [Green Version]
- Edmonds, D.A.; Hajek, E.A.; Downton, N.; Bryk, A.B. Avulsion flow-path selection on rivers in foreland basins. Geology 2016, 44, 695–698. [Google Scholar] [CrossRef]
- Parente, L.; Mesquita, V.; Miziara, F.; Baumann, L.; Ferreira, L. Assessing the pasturelands and livestock dynamics in Brazil, from 1985 to 2017: A novel approach based on high spatial resolution imagery and Google Earth Engine cloud computing. Remote Sens. Environ. 2019, 232, 111301. [Google Scholar] [CrossRef]
- Ascensão, F.; Yogui, D.; Alves, M.; Medici, E.P.; Desbiez, A. Predicting spatiotemporal patterns of road mortality for medium-large mammals. J. Environ. Manag. 2019, 248, 109320. [Google Scholar] [CrossRef]
- Bey, A.; Sánchez-Paus Díaz, A.; Maniatis, D.; Marchi, G.; Mollicone, D.; Ricci, S.; Bastin, J.-F.; Moore, R.; Federici, S.; Rezende, M.; et al. Collect Earth: Land Use and Land Cover Assessment through Augmented Visual Interpretation. Remote Sens. 2016, 8, 807. [Google Scholar] [CrossRef] [Green Version]
- Lobell, D.B.; Thau, D.; Seifert, C.; Engle, E.; Little, B. A scalable satellite-based crop yield mapper. Remote Sens. Environ. 2015, 164, 324–333. [Google Scholar] [CrossRef]
- Shelestov, A.; Lavreniuk, M.; Kussul, N.; Novikov, A.; Skakun, S. Exploring Google Earth Engine Platform for Big Data Processing: Classification of Multi-Temporal Satellite Imagery for Crop Mapping. Front. Earth Sci. 2017, 5, 17. [Google Scholar] [CrossRef] [Green Version]
- Liu, X.; Hu, G.; Chen, Y.; Li, X.; Xu, X.; Li, S.; Pei, F.; Wang, S. High-resolution multi-temporal mapping of global urban land using Landsat images based on the Google Earth Engine Platform. Remote Sens. Environ. 2018, 209, 227–239. [Google Scholar] [CrossRef]
- Gong, P.; Li, X.; Zhang, W. 40-Year (1978–2017) human settlement changes in China reflected by impervious surfaces from satellite remote sensing. Sci. Bull. 2019, 64, 756–763. [Google Scholar] [CrossRef]
- Chen, B.; Xiao, X.; Li, X.; Pan, L.; Doughty, R.; Ma, J.; Dong, J.; Qin, Y.; Zhao, B.; Wu, Z.; et al. A mangrove forest map of China in 2015: Analysis of time series Landsat 7/8 and Sentinel-1A imagery in Google Earth Engine cloud computing platform. ISPRS J. Photogramm. Remote Sens. 2017, 131, 104–120. [Google Scholar] [CrossRef]
- Zhang, Y.; Kong, D.; Gan, R.; Chiew, F.H.S.; McVicar, T.R.; Zhang, Q.; Yang, Y. Coupled estimation of 500 m and 8-day resolution global evapotranspiration and gross primary production in 2002–2017. Remote Sens. Environ. 2019, 222, 165–182. [Google Scholar] [CrossRef]
- Azzari, G.; Jain, M.; Lobell, D.B. Towards fine resolution global maps of crop yields: Testing multiple methods and satellites in three countries. Remote Sens. Environ. 2017, 202, 129–141. [Google Scholar] [CrossRef]
- Liu, L.; Xiao, X.; Qin, Y.; Wang, J.; Xu, X.; Hu, Y.; Qiao, Z. Mapping cropping intensity in China using time series Landsat and Sentinel-2 images and Google Earth Engine. Remote Sens. Environ. 2020, 239, 111624. [Google Scholar] [CrossRef]
- Parastatidis, D.; Mitraka, Z.; Chrysoulakis, N.; Abrams, M. Online Global Land Surface Temperature Estimation from Landsat. Remote Sens. 2017, 9, 1208. [Google Scholar] [CrossRef] [Green Version]
- Shrestha, S.; Miranda, I.; Kumar, A.; Pardo, M.L.E.; Dahal, S.; Rashid, T.; Remillard, C.; Mishra, D.R. Identifying and forecasting potential biophysical risk areas within a tropical mangrove ecosystem using multi-sensor data. Int. J. Appl. Earth Obs. Geoinf. 2019, 74, 281–294. [Google Scholar] [CrossRef]
- Yu, Z.; Di, L.; Tang, J.; Zhang, C.; Lin, L.; Yu, E.G.; Rahman, M.S.; Gaigalas, J.; Sun, Z. Land Use and Land Cover Classification for Bangladesh 2005 on Google Earth Engine. In Proceedings of the 2018 7th International Conference on Agro-Geoinformatics (Agro-Geoinformatics), Hangzhou, China, 6–9 August 2018; pp. 1–5. [Google Scholar]
- Cho, E.; Jacobs, J.M.; Jia, X.; Kraatz, S. Identifying Subsurface Drainage using Satellite Big Data and Machine Learning via Google Earth Engine. Water Resour. Res. 2019, 55, 8028–8045. [Google Scholar] [CrossRef]
- Uddin, K.; Matin, M.A.; Meyer, F.J. Operational Flood Mapping Using Multi-Temporal Sentinel-1 SAR Images: A Case Study from Bangladesh. Remote Sens. 2019, 11, 1581. [Google Scholar] [CrossRef] [Green Version]
- Mugiraneza, T.; Nascetti, A.; Ban, Y. Continuous Monitoring of Urban Land Cover Change Trajectories with Landsat Time Series and LandTrendr-Google Earth Engine Cloud Computing. Remote Sens. 2020, 12, 2883. [Google Scholar] [CrossRef]
- Yancho, J.; Jones, T.; Gandhi, S.; Ferster, C.; Lin, A.; Glass, L. The Google Earth Engine Mangrove Mapping Methodology (GEEMMM). Remote Sens. 2020, 12, 3758. [Google Scholar] [CrossRef]
- Hu, Y.; Xu, X.; Wu, F.; Sun, Z.; Xia, H.; Meng, Q.; Huang, W.; Zhou, H.; Gao, J.; Li, W.; et al. Estimating Forest Stock Volume in Hunan Province, China, by Integrating In Situ Plot Data, Sentinel-2 Images, and Linear and Machine Learning Regression Models. Remote Sens. 2020, 12, 186. [Google Scholar] [CrossRef] [Green Version]
- Cao, J.; Zhang, Z.; Tao, F.; Zhang, L.; Luo, Y.; Zhang, J.; Han, J.; Xie, J. Integrating Multi-Source Data for Rice Yield Prediction across China using Machine Learning and Deep Learning Approaches. Agric. For. Meteorol. 2021, 297, 108275. [Google Scholar] [CrossRef]
- Schmitt, M.; Hughes, L.H.; Qiu, C.; Zhu, X.X. SEN12MS—A curated dataset of georeferenced multi-spectral Sentinel-1/2 imagery for deep learning and data fusion. ISPRS Ann. Photogramm. Remote Sens. Spat. Inf. Sci. 2019, IV-2/W7, 153–160. [Google Scholar] [CrossRef] [Green Version]
- Collins, L.; Griffioen, P.; Newell, G.; Mellor, A. The utility of Random Forests for wildfire severity mapping. Remote Sens. Environ. 2018, 216, 374–384. [Google Scholar] [CrossRef]
- Amani, M.; Mahdavi, S.; Kakooei, M.; Ghorbanian, A.; Brisco, B.; DeLancey, E.; Toure, S.; Reyes, E.L. Wetland Change Analysis in Alberta, Canada Using Four Decades of Landsat Imagery. IEEE J. Sel. Top. Appl. Earth Obs. Remote Sens. 2021, 14, 10314–10335. [Google Scholar] [CrossRef]
- Sebastianelli, A.; Del Rosso, M.P.; Ullo, S.L. Automatic dataset builder for Machine Learning applications to satellite imagery. SoftwareX 2021, 15, 100739. [Google Scholar] [CrossRef]
- Greifeneder, F.; Notarnicola, C.; Wagner, W. A Machine Learning-Based Approach for Surface Soil Moisture Estimations with Google Earth Engine. Remote Sens. 2021, 13, 2099. [Google Scholar] [CrossRef]
- Jiang, X.; Liang, S.; He, X.; Ziegler, A.D.; Lin, P.; Pan, M.; Wang, D.; Zou, J.; Hao, D.; Mao, G.; et al. Rapid and large-scale mapping of flood inundation via integrating spaceborne synthetic aperture radar imagery with unsupervised deep learning. ISPRS J. Photogramm. Remote Sens. 2021, 178, 36–50. [Google Scholar] [CrossRef]
- Lehmann, A.; Chaplin-Kramer, R.; Lacayo, M.; Giuliani, G.; Thau, D.; Koy, K.; Goldberg, G.; Sharp, R., Jr. Lifting the Information Barriers to Address Sustainability Challenges with Data from Physical Geography and Earth Observation. Sustainability 2017, 9, 858. [Google Scholar] [CrossRef] [Green Version]
- Liang, J.; Xie, Y.; Sha, Z.; Zhou, A. Modeling urban growth sustainability in the cloud by augmenting Google Earth Engine (GEE). Comput. Environ. Urban Syst. 2020, 84, 101542. [Google Scholar] [CrossRef]
- Akinyemi, F.O.; Ghazaryan, G.; Dubovyk, O. Assessing UN indicators of land degradation neutrality and proportion of degraded land for Botswana using remote sensing based national level metrics. Land Degrad. Dev. 2021, 32, 158–172. [Google Scholar] [CrossRef]
- Mananze, S.; Pôças, I.; Cunha, M. Mapping and Assessing the Dynamics of Shifting Agricultural Landscapes Using Google Earth Engine Cloud Computing, a Case Study in Mozambique. Remote Sens. 2020, 12, 1279. [Google Scholar] [CrossRef] [Green Version]
- Sulova, A.; Jokar Arsanjani, J. Exploratory Analysis of Driving Force of Wildfires in Australia: An Application of Machine Learning within Google Earth Engine. Remote Sens. 2020, 13, 10. [Google Scholar] [CrossRef]
- Berner, L.T.; Jantz, P.; Tape, K.D.; Goetz, S.J. Tundra plant above-ground biomass and shrub dominance mapped across the North Slope of Alaska. Environ. Res. Lett. 2018, 13, 035002. [Google Scholar] [CrossRef] [Green Version]
- Orusa, T.; Borgogno Mondino, E. Exploring Short-Term Climate Change Effects on Rangelands and Broad-Leaved Forests by Free Satellite Data in Aosta Valley (Northwest Italy). Climate 2021, 9, 47. [Google Scholar] [CrossRef]
- Chen, Y.; Cao, R.; Chen, J.; Liu, L.; Matsushita, B. A practical approach to reconstruct high-quality Landsat NDVI time-series data by gap filling and the Savitzky–Golay filter. ISPRS J. Photogramm. Remote Sens. 2021, 180, 174–190. [Google Scholar] [CrossRef]
- Kumari, N.; Srivastava, A.; Dumka, U.C. A Long-Term Spatiotemporal Analysis of Vegetation Greenness over the Himalayan Region Using Google Earth Engine. Climate 2021, 9, 109. [Google Scholar] [CrossRef]
- Martín-Ortega, P.; García-Montero, L.G.; Sibelet, N. Temporal Patterns in Illumination Conditions and Its Effect on Vegetation Indices Using Landsat on Google Earth Engine. Remote Sens. 2020, 12, 211. [Google Scholar] [CrossRef] [Green Version]
- Felegari, S.; Sharifi, A.; Moravej, K.; Amin, M.; Golchin, A.; Muzirafuti, A.; Tariq, A.; Zhao, N. Integration of Sentinel 1 and Sentinel 2 Satellite Images for Crop Mapping. Appl. Sci. 2021, 11, 10104. [Google Scholar] [CrossRef]
- Zurqani, H.A.; Post, C.J.; Mikhailova, E.A.; Schlautman, M.A.; Sharp, J.L. Geospatial analysis of land use change in the Savannah River Basin using Google Earth Engine. Int. J. Appl. Earth Obs. Geoinf. 2018, 69, 175–185. [Google Scholar] [CrossRef]
- Anokye, M.; Twumasi, Y.A.; Ning, Z.H.; Apraku, C.Y.; Armah, R.N.D.; Frimpong, D.B.; Asare-Ansah, A.B.; Loh, P.M.; Owusu, F. Assessing land cover change around bayou perot-little lake, new orleans using sentinel 2 satellite imagery. Int. Arch. Photogramm. Remote Sens. Spat. Inf. Sci. 2022, XLVI-M-2–2, 15–20. [Google Scholar] [CrossRef]
- Clemente, J.P.; Fontanelli, G.; Ovando, G.G.; Roa, Y.L.B.; Lapini, A.; Santi, E. Google Earth Engine: Application of algorithms for remote sensing of crops in Tuscany (Italy). Int. Arch. Photogramm. Remote Sens. Spat. Inf. Sci. 2020, XLII-3/W12, 291–296. [Google Scholar] [CrossRef]
- Wang, S.; Azzari, G.; Lobell, D.B. Crop type mapping without field-level labels: Random forest transfer and unsupervised clustering techniques. Remote Sens. Environ. 2019, 222, 303–317. [Google Scholar] [CrossRef]
- Arruda, V.L.S.; Piontekowski, V.J.; Alencar, A.; Pereira, R.S.; Matricardi, E.A.T. An alternative approach for mapping burn scars using Landsat imagery, Google Earth Engine, and Deep Learning in the Brazilian Savanna. Remote Sens. Appl. Soc. Environ. 2021, 22, 100472. [Google Scholar] [CrossRef]
- Matci, D.K.; Kaplan, G.; Avdan, U. Changes in air quality over different land covers associated with COVID-19 in Turkey aided by GEE. Environ. Monit. Assess. 2022, 194, 762. [Google Scholar] [CrossRef]
- Zamshin, V.; Matrosova, E.; Chvertkova, O. Satellite Remote Sensing of Seas and Oceans: The Cloud Paradigm. In Proceedings of the 20th International Multidisciplinary Scientific GeoConference SGEM 2020, Albena, Bulgaria, 18–24 August 2020; STEF92 Technology: Sofia, Bulgaria, 2020; pp. 259–266. [Google Scholar]
- Sagawa, T.; Yamashita, Y.; Okumura, T.; Yamanokuchi, T. Satellite Derived Bathymetry Using Machine Learning and Multi-Temporal Satellite Images. Remote Sens. 2019, 11, 1155. [Google Scholar] [CrossRef] [Green Version]
- Zhuang, H.; Liu, X.; Yan, Y.; Ou, J.; He, J.; Wu, C. Mapping Multi-Temporal Population Distribution in China from 1985 to 2010 Using Landsat Images via Deep Learning. Remote Sens. 2021, 13, 3533. [Google Scholar] [CrossRef]
- Shafizadeh-Moghadam, H.; Khazaei, M.; Alavipanah, S.K.; Weng, Q. Google Earth Engine for large-scale land use and land cover mapping: An object-based classification approach using spectral, textural and topographical factors. GISci. Remote Sens. 2021, 58, 914–928. [Google Scholar] [CrossRef]
- Pham Van, C.; Nguyen-Van, G. Long-Term Coastline Monitoring in the Tra Vinh Province Using Landsat Images. In APAC 2019: Proceedings of the 10th International Conference on Asian and Pacific Coasts; Trung Viet, N., Xiping, D., Thanh Tung, T., Eds.; Springer: Singapore, 2020; pp. 509–515. [Google Scholar]
- Dersseh, M.G.; Tilahun, S.A.; Worqlul, A.W.; Moges, M.A.; Abebe, W.B.; Mhiret, D.A.; Melesse, A.M. Spatial and Temporal Dynamics of Water Hyacinth and Its Linkage with Lake-Level Fluctuation: Lake Tana, a Sub-Humid Region of the Ethiopian Highlands. Water 2020, 12, 1435. [Google Scholar] [CrossRef]
- Weekley, D.; Li, X. Tracking lake surface elevations with proportional hypsometric relationships, Landsat imagery, and multiple DEMs. Water Resour. Res. 2021, 57, e2020WR027666. [Google Scholar] [CrossRef]
- Lathrop, R.G.; Merchant, D.; Niles, L.; Paludo, D.; Santos, C.D.; Larrain, C.E.; Feigin, S.; Smith, J.; Dey, A. Multi-Sensor Remote Sensing of Intertidal Flat Habitats for Migratory Shorebird Conservation. Remote Sens. 2022, 14, 5016. [Google Scholar] [CrossRef]
- Ghosh, S.; Kumar, D.; Kumari, R. Assessing the influence of floods over selected states of Eastern India with cloud-based geo-computing platforms. Geocarto Int. 2022, 37, 11190–11208. [Google Scholar] [CrossRef]
- Pan, L.; Xia, H.; Zhao, X.; Guo, Y.; Qin, Y. Mapping Winter Crops Using a Phenology Algorithm, Time-Series Sentinel-2 and Landsat-7/8 Images, and Google Earth Engine. Remote Sens. 2021, 13, 2510. [Google Scholar] [CrossRef]
- Thorp, K.R.; Drajat, D. Deep machine learning with Sentinel satellite data to map paddy rice production stages across West Java, Indonesia. Remote Sens. Environ. 2021, 265, 112679. [Google Scholar] [CrossRef]
- Sharma, V.; Ghosh, S.K. Impact of Climate Parameters on Vegetation Using Different Indices in Hardiwar District, India. In Proceedings of the 21st International Multidisciplinary Scientific GeoConference SGEM 2021, Albena, Bulgaria, 16–22 August 2021; Trofymchuk, O., Rivza, B., Eds.; STEF92 Technology: Sofia, Bulgaria, 2021; pp. 133–142. [Google Scholar]
- Peng, C.; He, M.; Cutrona, S.L.; Kiefe, C.I.; Liu, F.; Wang, Z. Theme Trends and Knowledge Structure on Mobile Health Apps: Bibliometric Analysis. JMIR Mhealth Uhealth 2020, 8, e18212. [Google Scholar] [CrossRef]
- Cavalcante, W.Q.d.F.; Coelho, A.; Bairrada, C.M. Sustainability and Tourism Marketing: A Bibliometric Analysis of Publications between 1997 and 2020 Using VOSviewer Software. Sustainability 2021, 13, 4987. [Google Scholar] [CrossRef]
- Sharifipour, M.; Amani, M.; Moghimi, A. Flood Damage Assessment Using Satellite Observations within the Google Earth Engine Cloud Platform. J. Ocean Technol. 2022, 27, 64–75. [Google Scholar]
- Tiwari, V.; Kumar, V.; Matin, M.A.; Thapa, A.; Ellenburg, W.L.; Gupta, N.; Thapa, S. Flood inundation mapping- Kerala 2018; Harnessing the power of SAR, automatic threshold detection method and Google Earth Engine. PLoS ONE 2020, 15, e0237324. [Google Scholar] [CrossRef]
- White, H.D.; Griffith, B.C. Author cocitation: A literature measure of intellectual structure. J. Am. Soc. Inf. Sci. 1981, 32, 163–171. [Google Scholar] [CrossRef]
- Small, H. Co-citation in the scientific literature: A new measure of the relationship between two documents. J. Am. Soc. Inf. Sci. 1973, 24, 265–269. [Google Scholar] [CrossRef]
- Herrera-Franco, G.; Montalván-Burbano, N.; Mora-Frank, C.; Moreno-Alcívar, L. Research in Petroleum and Environment: A Bibliometric Analysis in South America. Int. J. Sustain. Dev. Plan. 2021, 16, 1109–1116. [Google Scholar] [CrossRef]
- Cao, W.; Zhou, Y.; Li, R.; Li, X. Mapping changes in coastlines and tidal flats in developing islands using the full time series of Landsat images. Remote Sens. Environ. 2020, 239, 111665. [Google Scholar] [CrossRef]
- Li, X.; Gong, P.; Liang, L. A 30-year (1984–2013) record of annual urban dynamics of Beijing City derived from Landsat data. Remote Sens. Environ. 2015, 166, 78–90. [Google Scholar] [CrossRef]
- Li, X.; Zhou, Y.; Asrar, G.R.; Meng, L. Characterizing spatiotemporal dynamics in phenology of urban ecosystems based on Landsat data. Sci. Total Environ. 2017, 605–606, 721–734. [Google Scholar] [CrossRef]
- Wang, J.; Rich, P.M.; Price, K.P. Temporal responses of NDVI to precipitation and temperature in the central Great Plains, USA. Int. J. Remote Sens. 2003, 24, 2345–2364. [Google Scholar] [CrossRef]
- Zhou, C.; Li, F.; Zhang, J.; Zhao, J.; Zhang, Y.; Wang, J. Analysis of Spatial and Temporal Variations of Vegetation Index in Liaodong Bay in the last 30 years based on the GEE Platform. IOP Conf. Ser. Earth Environ. Sci. 2020, 502, 012037. [Google Scholar] [CrossRef]
- Hansen, M.C.; Potapov, P.V.; Moore, R.; Hancher, M.; Turubanova, S.A.; Tyukavina, A.; Thau, D.; Stehman, S.V.; Goetz, S.J.; Loveland, T.R.; et al. High-Resolution Global Maps of 21st-Century Forest Cover Change. Science 2013, 342, 850–853. [Google Scholar] [CrossRef] [PubMed] [Green Version]
- Zhang, Q.; Li, B.; Thau, D.; Moore, R. Building a Better Urban Picture: Combining Day and Night Remote Sensing Imagery. Remote Sens. 2015, 7, 11887–11913. [Google Scholar] [CrossRef] [Green Version]
- Dong, J.; Xiao, X.; Chen, B.; Torbick, N.; Jin, C.; Zhang, G.; Biradar, C. Mapping deciduous rubber plantations through integration of PALSAR and multi-temporal Landsat imagery. Remote Sens. Environ. 2013, 134, 392–402. [Google Scholar] [CrossRef]
- Breiman, L. Random Forests. Mach. Learn. 2001, 45, 5–32. [Google Scholar] [CrossRef] [Green Version]
- Brisco, B.; Short, N.; Sanden, J.v.d.; Landry, R.; Raymond, D. A semi-automated tool for surface water mapping with RADARSAT-1. Can. J. Remote Sens. 2009, 35, 336–344. [Google Scholar] [CrossRef]
- Clinton, N.; Gong, P. MODIS detected surface urban heat islands and sinks: Global locations and controls. Remote Sens. Environ. 2013, 134, 294–304. [Google Scholar] [CrossRef]
- Weng, Q.; Fu, P. Modeling annual parameters of clear-sky land surface temperature variations and evaluating the impact of cloud cover using time series of Landsat TIR data. Remote Sens. Environ. 2014, 140, 267–278. [Google Scholar] [CrossRef]
- Wong, A.K.F.; Köseoglu, M.A.; Kim, S. The intellectual structure of corporate social responsibility research in tourism and hospitality: A citation/co-citation analysis. J. Hosp. Tour. Manag. 2021, 49, 270–284. [Google Scholar] [CrossRef]
- Peng, X.; Dai, J. A bibliometric analysis of neutrosophic set: Two decades review from 1998 to 2017. Artif. Intell. Rev. 2020, 53, 199–255. [Google Scholar] [CrossRef] [Green Version]
- USGS Landsat Missions Timeline|U.S. Geological Survey. Available online: https://www.usgs.gov/media/images/landsat-missions-timeline (accessed on 5 March 2022).
- Velastegui-Montoya, A.; De Lima, A.; Adami, M.; de Lima, A.; Adami, M. Multitemporal Analysis of Deforestation in Response to the Construction of the Tucuruí Dam. ISPRS Int. J. Geo-Inf. 2020, 9, 583. [Google Scholar] [CrossRef]
- Copernicus Copernicus Open Access Hub. Available online: https://scihub.copernicus.eu/ (accessed on 5 March 2022).
- Hancher, M. Planetary-Scale Geospatial Data Analysis Techniques in Google’s Earth Engine Platform. AGU Fall Meet. Abstr. 2013, 2013, IN52A-07. [Google Scholar]
- Dong, J.; Xiao, X.; Sheldon, S.; Biradar, C.; Duong, N.D.; Hazarika, M. A comparison of forest cover maps in Mainland Southeast Asia from multiple sources: PALSAR, MERIS, MODIS and FRA. Remote Sens. Environ. 2012, 127, 60–73. [Google Scholar] [CrossRef]
- Dong, J.; Xiao, X. Evolution of regional to global paddy rice mapping methods: A review. ISPRS J. Photogramm. Remote Sens. 2016, 119, 214–227. [Google Scholar] [CrossRef]
- Gong, P.; Liu, H.; Zhang, M.; Li, C.; Wang, J.; Huang, H.; Clinton, N.; Ji, L.; Li, W.; Bai, Y.; et al. Stable classification with limited sample: Transferring a 30-m resolution sample set collected in 2015 to mapping 10-m resolution global land cover in 2017. Sci. Bull. 2019, 64, 370–373. [Google Scholar] [CrossRef] [PubMed]
- Fu, P.; Weng, Q. Consistent land surface temperature data generation from irregularly spaced Landsat imagery. Remote Sens. Environ. 2016, 184, 175–187. [Google Scholar] [CrossRef]
- Bell, W.D.; Hoffman, M.T.; Visser, V. Regional land degradation assessment for dryland environments: The Namaqualand Hardeveld bioregion of the Succulent Karoo biome as a case-study. Land Degrad. Dev. 2021, 32, 2287–2302. [Google Scholar] [CrossRef]
- Pham, T.T.M.; Nguyen, T.-D.; Tham, H.T.N.; Truong, T.N.K.; Lam-Dao, N.; Nguyen-Huy, T. Specifying the relationship between land use/land cover change and dryness in central Vietnam from 2000 to 2019 using Google Earth Engine. J. Appl. Remote Sens. 2021, 15, 024503. [Google Scholar] [CrossRef]
- Martinez, S.N.; Schaefer, L.N.; Allstadt, K.E.; Thompson, E.M. Evaluation of Remote Mapping Techniques for Earthquake-Triggered Landslide Inventories in an Urban Subarctic Environment: A Case Study of the 2018 Anchorage, Alaska Earthquake. Front. Earth Sci. 2021, 9, 673137. [Google Scholar] [CrossRef]
- Singha, M.; Dong, J.; Sarmah, S.; You, N.; Zhou, Y.; Zhang, G.; Doughty, R.; Xiao, X. Identifying floods and flood-affected paddy rice fields in Bangladesh based on Sentinel-1 imagery and Google Earth Engine. ISPRS J. Photogramm. Remote Sens. 2020, 166, 278–293. [Google Scholar] [CrossRef]
- Venkatappa, M.; Sasaki, N.; Han, P.; Abe, I. Impacts of droughts and floods on croplands and crop production in Southeast Asia—An application of Google Earth Engine. Sci. Total Environ. 2021, 795, 148829. [Google Scholar] [CrossRef]
- Tariq, A.; Shu, H.; Gagnon, A.S.; Li, Q.; Mumtaz, F.; Hysa, A.; Siddique, M.A.; Munir, I. Assessing Burned Areas in Wildfires and Prescribed Fires with Spectral Indices and SAR Images in the Margalla Hills of Pakistan. Forests 2021, 12, 1371. [Google Scholar] [CrossRef]
- da Silva, R.M.; Lopes, A.G.; Santos, C.A.G. Deforestation and fires in the Brazilian Amazon from 2001 to 2020: Impacts on rainfall variability and land surface temperature. J. Environ. Manag. 2023, 326, 116664. [Google Scholar] [CrossRef]
- Singh, P.; Maurya, V.; Dwivedi, R. Pixel based landslide identification using Landsat 8 and GEE. Int. Arch. Photogramm. Remote Sens. Spat. Inf. Sci. 2021, XLIII-B3-2, 721–726. [Google Scholar] [CrossRef]
- Morales, B.; Lizama, E.; Somos-Valenzuela, M.A.; Lillo-Saavedra, M.; Chen, N.; Fustos, I. A comparative machine learning approach to identify landslide triggering factors in northern Chilean Patagonia. Landslides 2021, 18, 2767–2784. [Google Scholar] [CrossRef]
- Abijith, D.; Saravanan, S. Assessment of land use and land cover change detection and prediction using remote sensing and CA Markov in the northern coastal districts of Tamil Nadu, India. Environ. Sci. Pollut. Res. 2022, 29, 86055–86067. [Google Scholar] [CrossRef] [PubMed]
- Baloloy, A.B.; Blanco, A.C.; Sta. Ana, R.R.C.; Nadaoka, K. Development and application of a new mangrove vegetation index (MVI) for rapid and accurate mangrove mapping. ISPRS J. Photogramm. Remote Sens. 2020, 166, 95–117. [Google Scholar] [CrossRef]
Figure 1.
Scheme of the methodology applied in this research.

Figure 2.
Evolution of scientific production on GEE, considering (i) annual publications: number of publications per year, and (ii) cited documents: number of citations registered per year.
Figure 2.
Evolution of scientific production on GEE, considering (i) annual publications: number of publications per year, and (ii) cited documents: number of citations registered per year.

Figure 3.
Map of countries that have conducted studies using the GEE platform, according to the number of publications.
Figure 3.
Map of countries that have conducted studies using the GEE platform, according to the number of publications.

Figure 4.
Countries network.

Figure 5.
Main subject areas of GEE research in Scopus.

Figure 6.
Satellites and sensors most mentioned in publications about GEE from 2011 to 2022.

Figure 7.
Main remote sensing applications studied in GEE and their evolution over time.

Figure 8.
Co-occurrence author keyword network.

Figure 9.
Co-authorship network. (a) Co-authorship by country. (b) Co-authorship by author.

Figure 10.
Co-citation network of cited authors.

Figure 11.
Journal co-citation network.


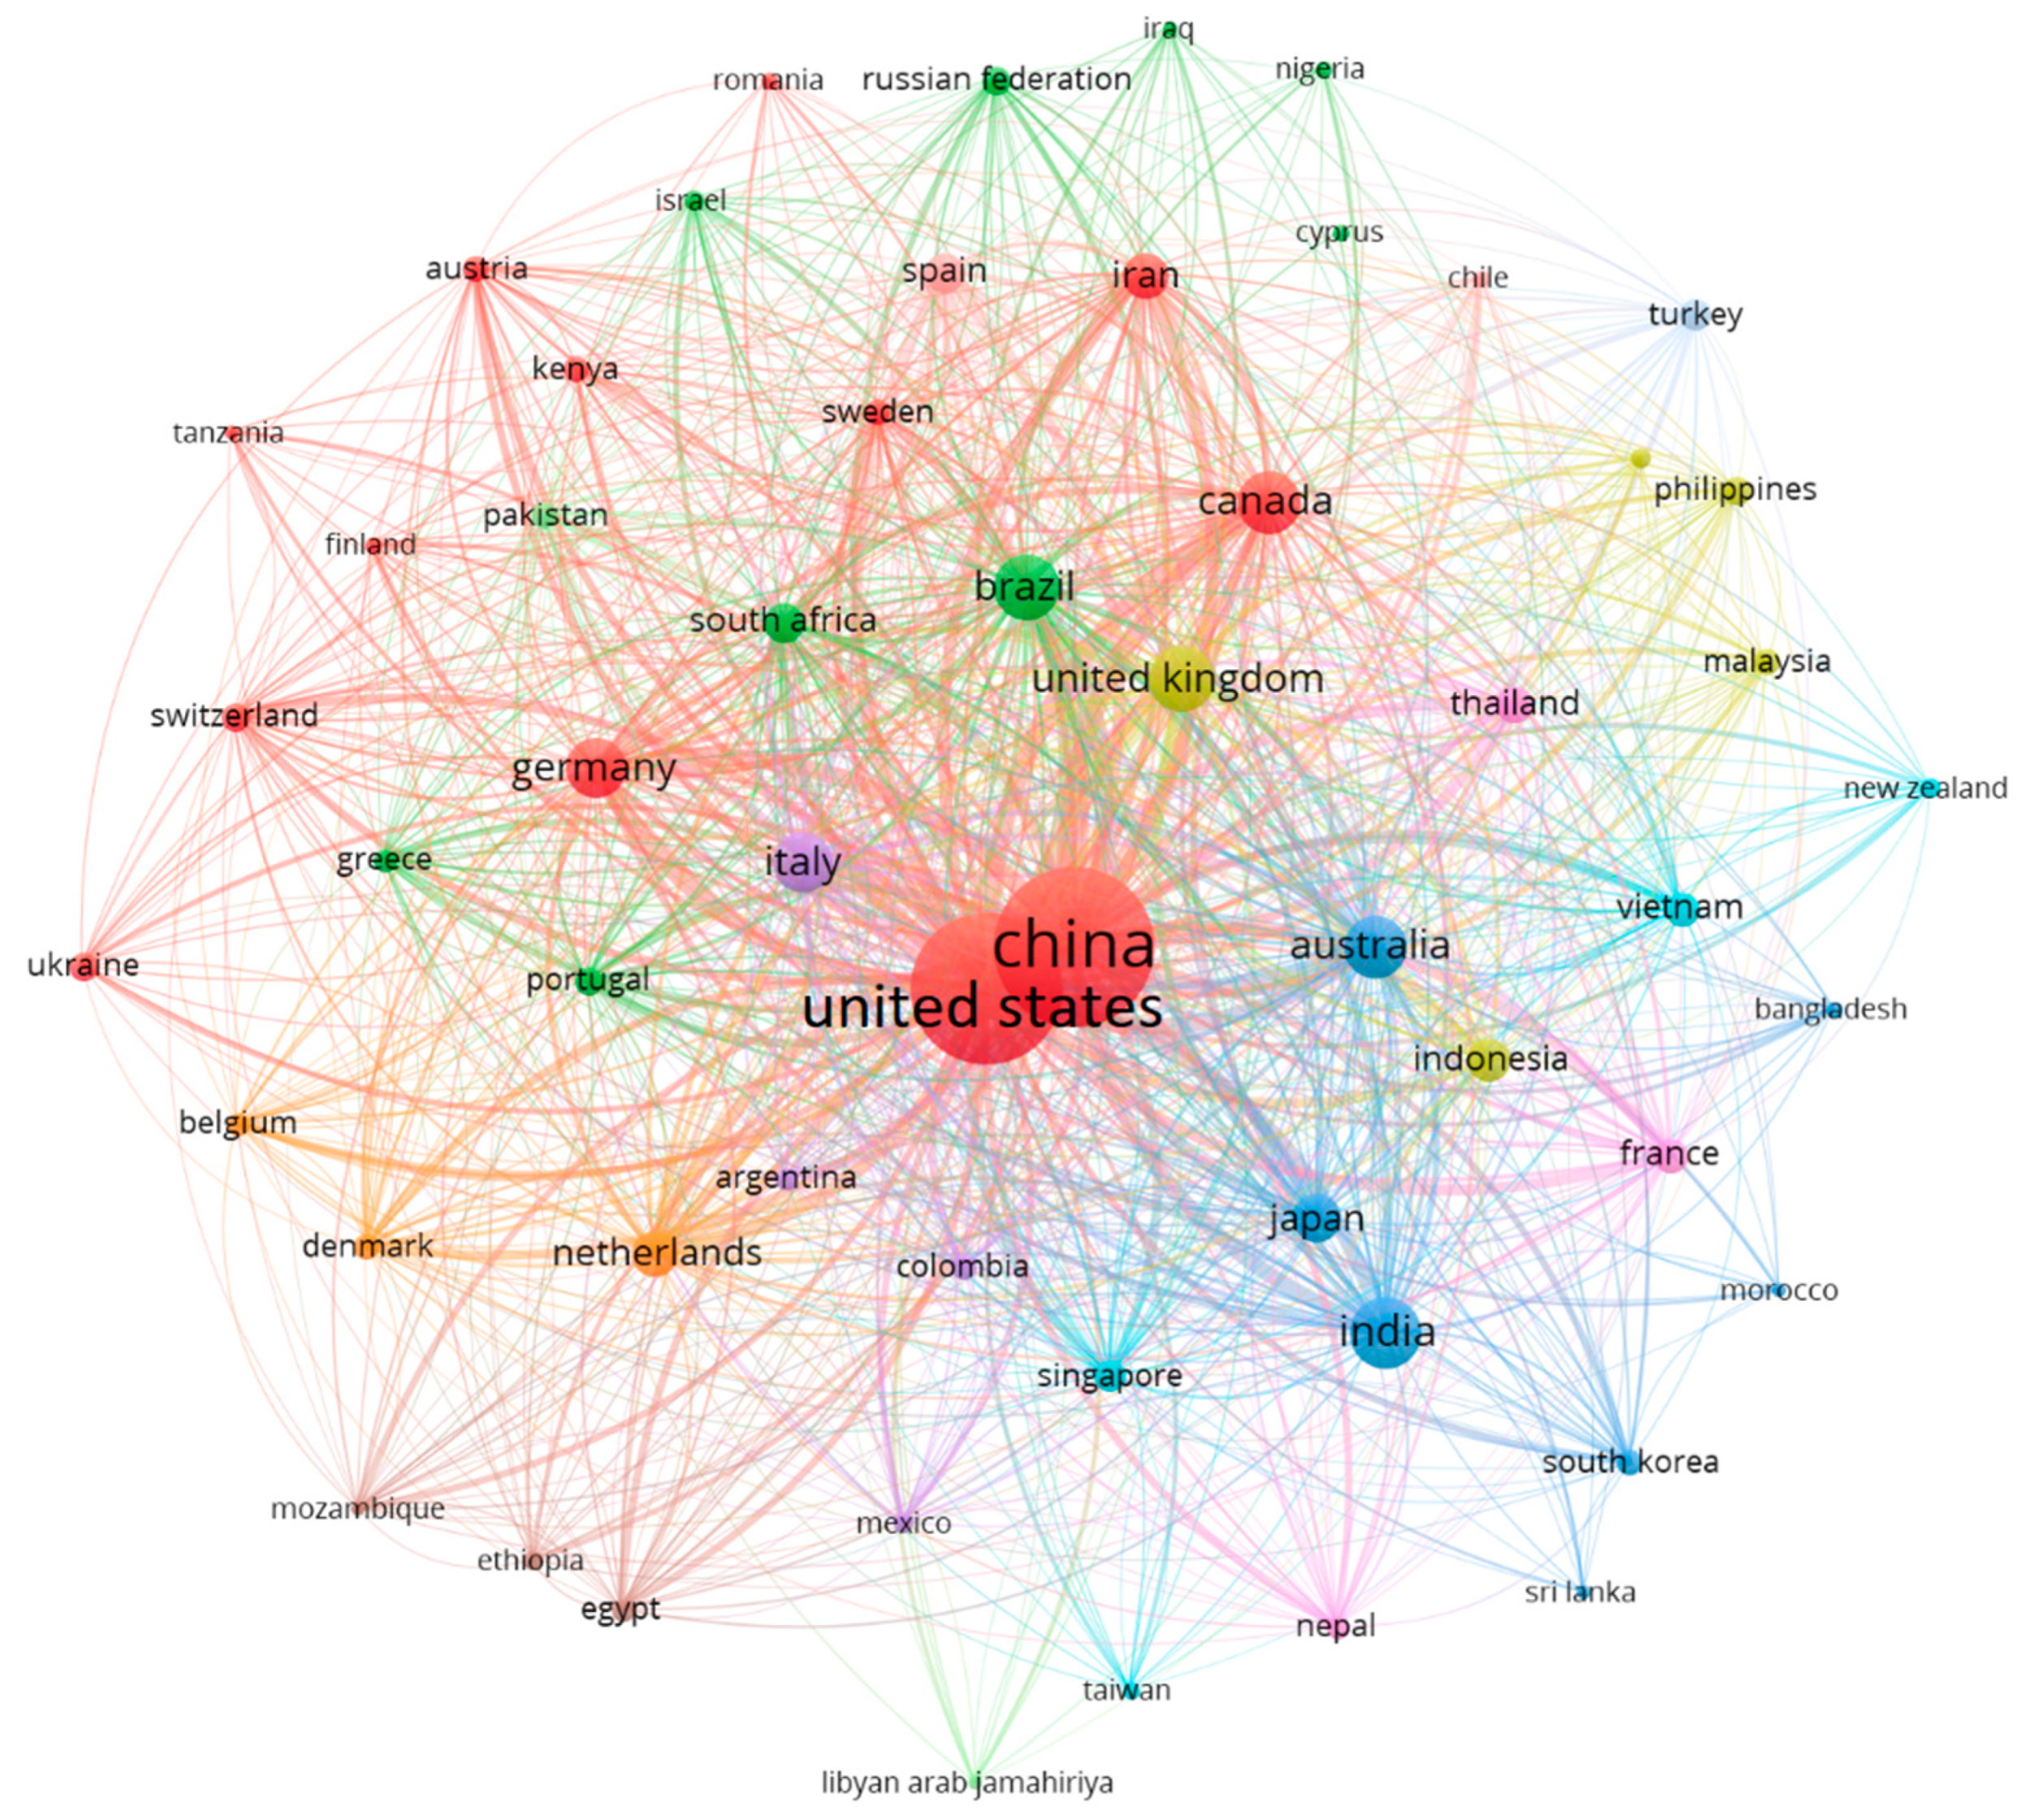
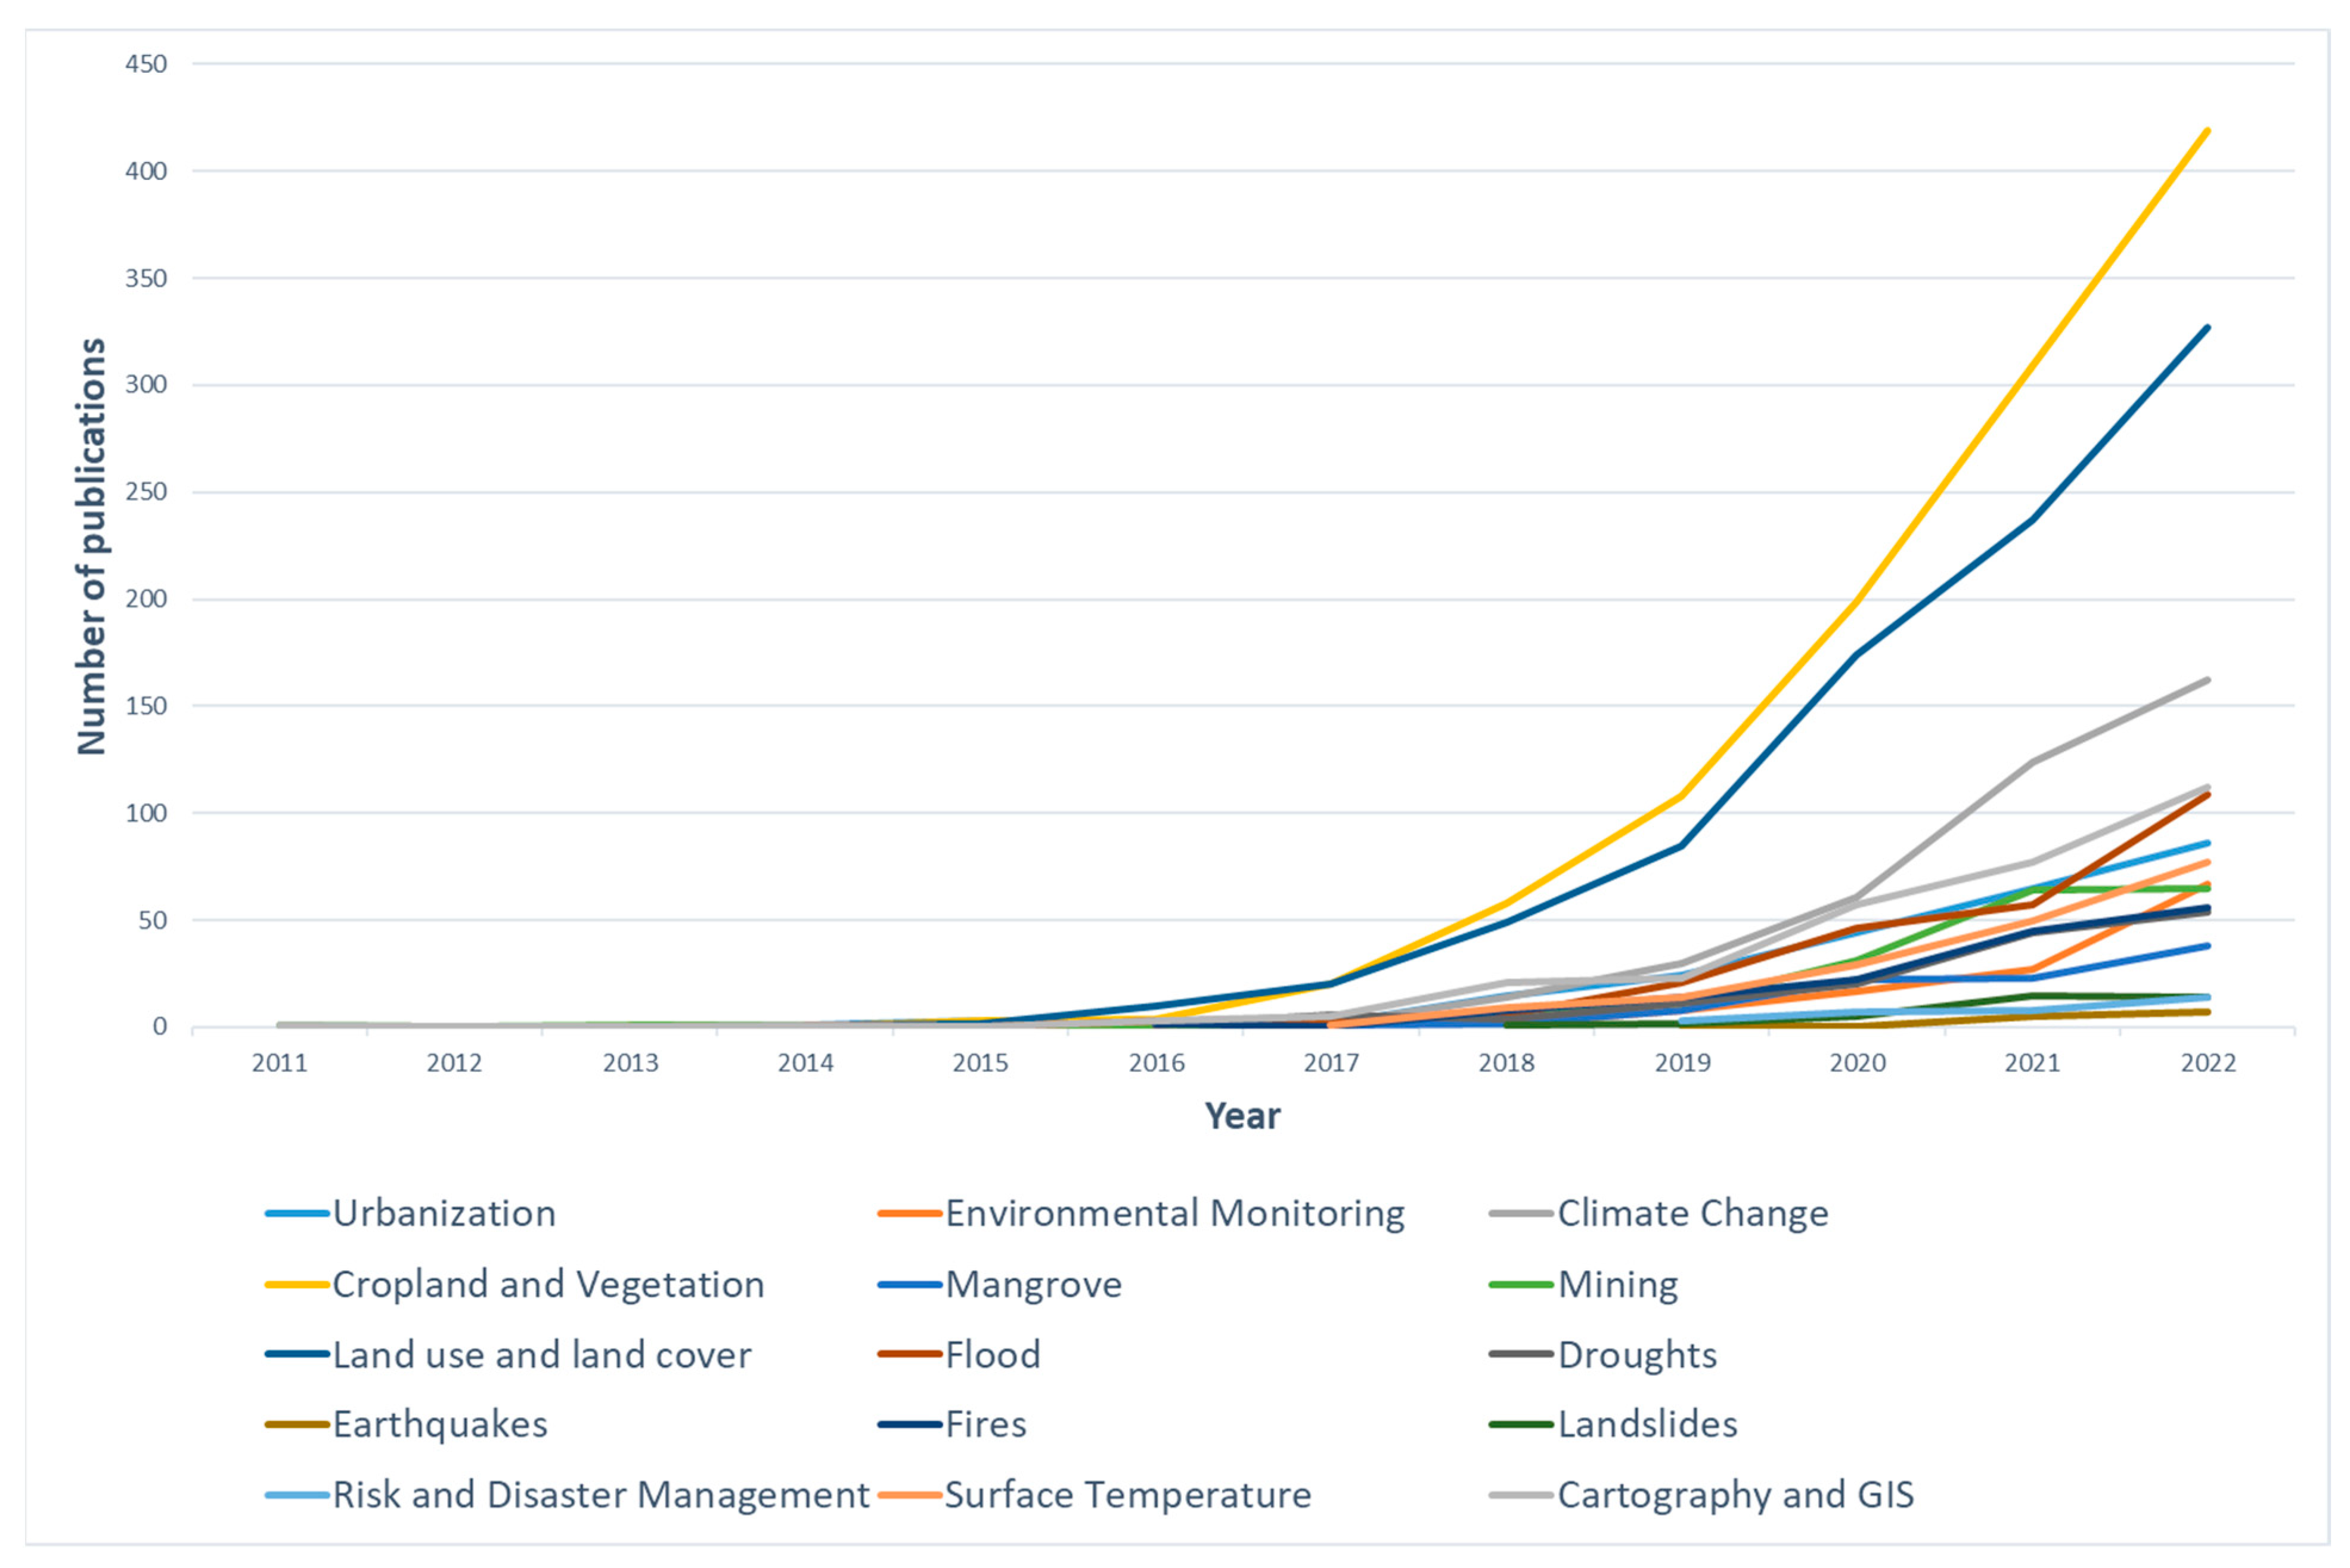
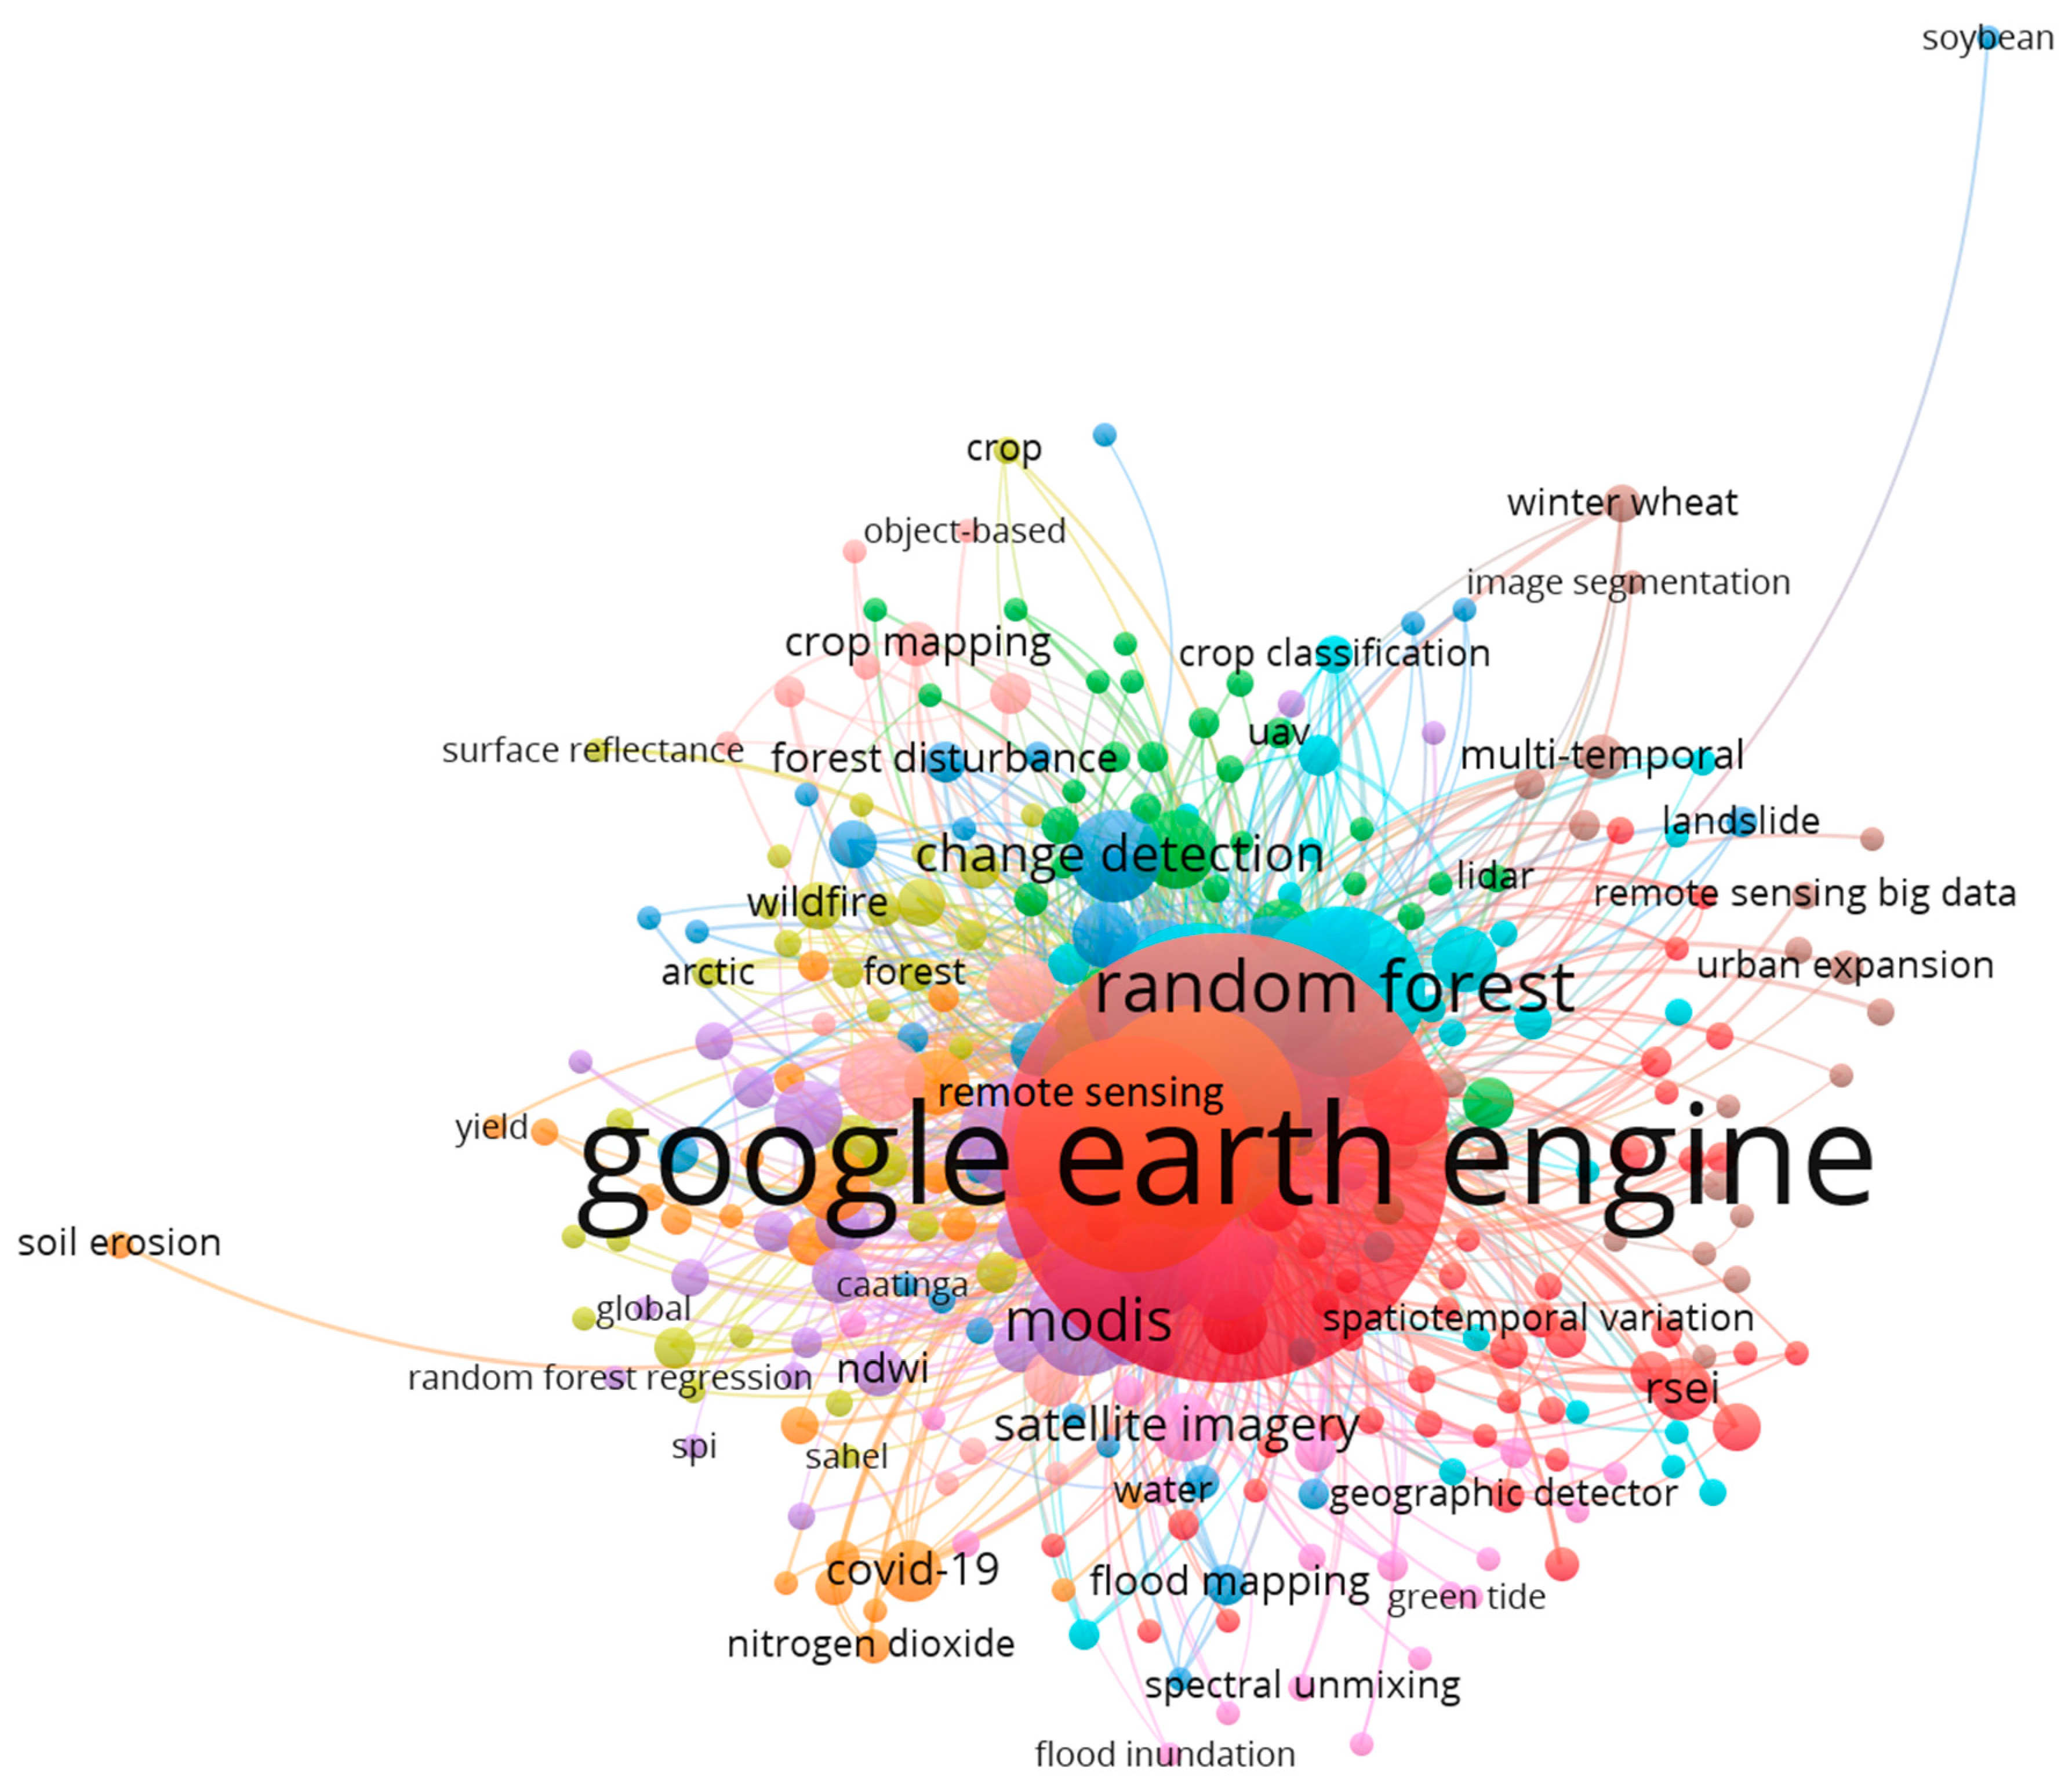
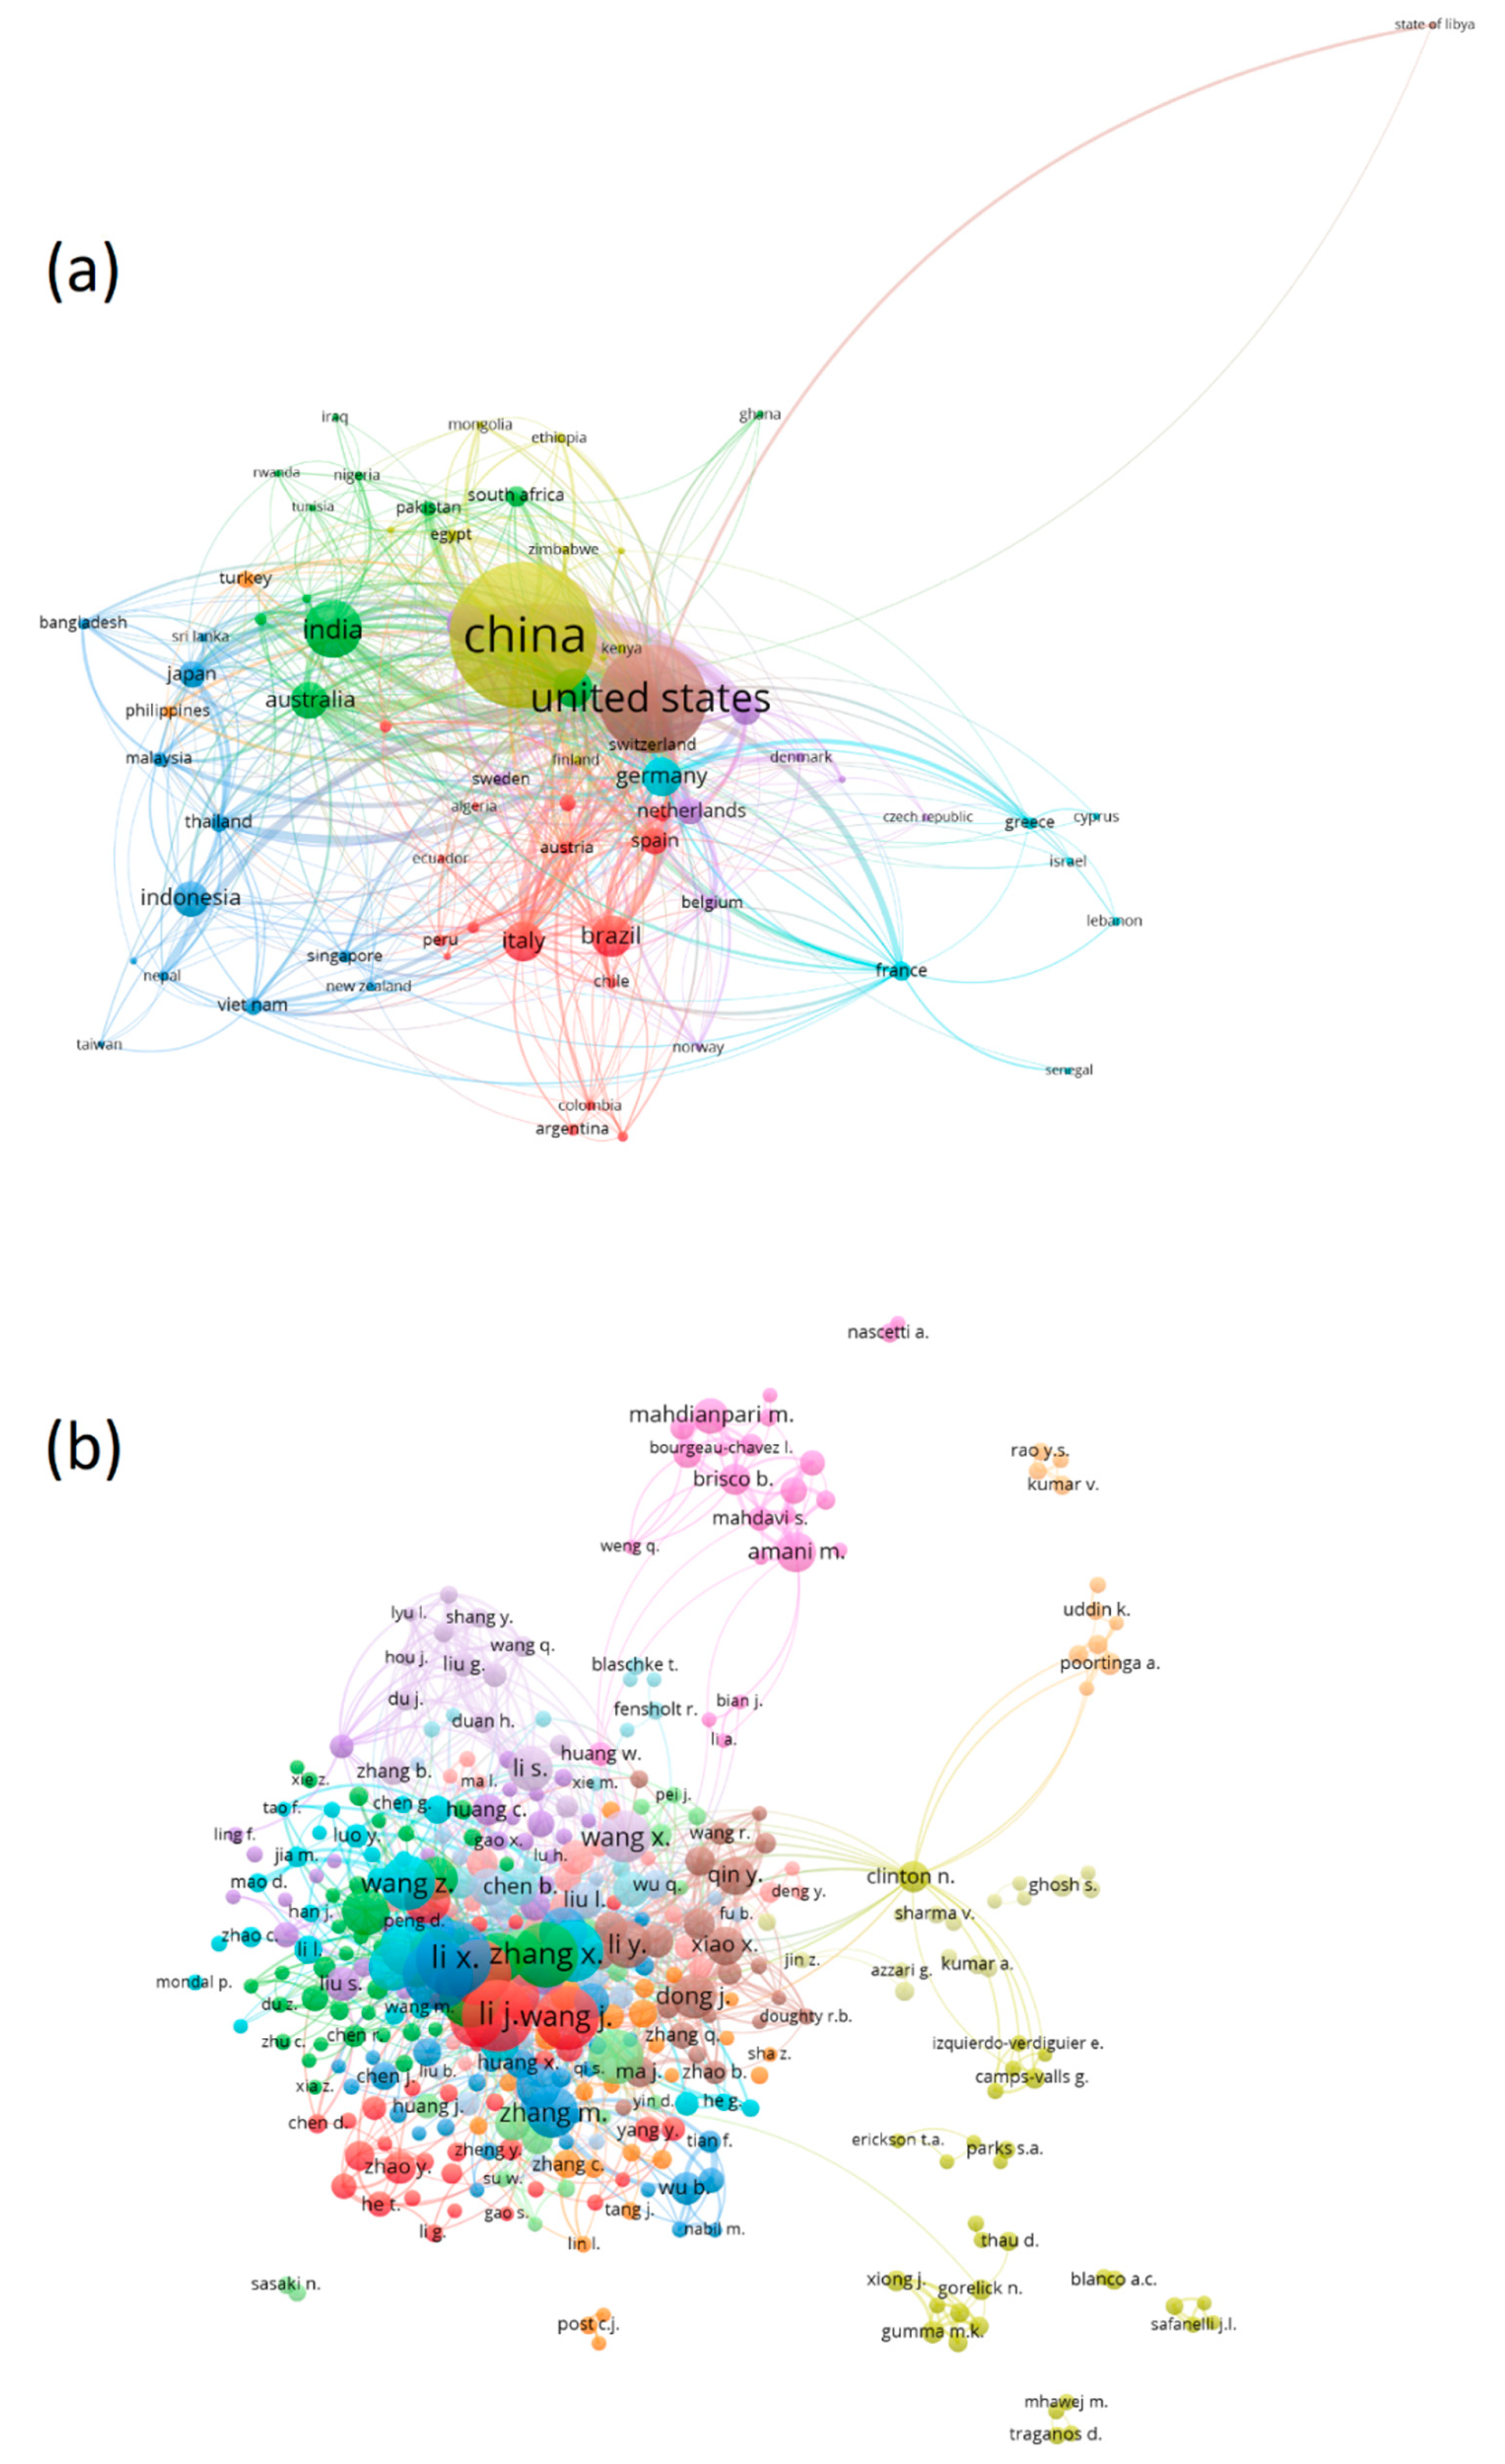
Table 1.
Types of documents on GEE.
| Rank | Language of Original Document | Document |
|---|---|---|
| 1 | Article | 2163 |
| 2 | Conference paper | 520 |
| 3 | Data paper | 30 |
| 4 | Review | 30 |
| 5 | Book chapter | 27 |
| 6 | Note | 11 |
| 7 | Erratum | 7 |
| 8 | Letter | 7 |
| 9 | Short survey | 2 |
| 10 | Editorial | 2 |
| 11 | Book | 1 |
Table 2.
Language of published documents.
| Rank | Language of Original Document | Document | Citations |
|---|---|---|---|
| 1 | English | 2620 | 38,790 |
| 2 | Chinese | 119 | 384 |
| 3 | Portuguese | 20 | 13 |
| 4 | Spanish | 20 | 19 |
| 5 | Russian | 13 | 12 |
| 6 | Korean | 2 | 4 |
| 7 | French | 2 | 2 |
| 8 | Japanese | 2 | 2 |
| 9 | German | 1 | 2 |
| 10 | Italian | 1 | 0 |
Table 3.
Scientific production for the top 15 journals.
| Rank | Journals | Country | Articles | Citations | Citescore | SJR | H-Index |
|---|---|---|---|---|---|---|---|
| 1 | Remote Sensing | Switzerland | 535 | 9276 | 7.4 | 1.283 | 144 |
| 2 | Remote Sensing of Environment | United States | 106 | 10,864 | 20.7 | 3.862 | 303 |
| 3 | International Journal of Applied Earth Observation and Geoinformation | Netherlands | 60 | 1183 | 10.5 | 1.844 | 108 |
| 4 | Sustainability (Switzerland) | Switzerland | 44 | 208 | 5.0 | 0.664 | 109 |
| 5 | Land | Switzerland | 43 | 174 | 3.2 | 0.685 | 32 |
| 6 | ISPRS Journal of Photogrammetry and Remote Sensing | Netherlands | 43 | 1951 | 17.6 | 3.481 | 155 |
| 7 | Remote Sensing Applications: Society and Environment | Netherlands | 42 | 427 | 5.0 | 0.840 | 27 |
| 8 | IEEE Journal of Selected Topics in Applied Earth Observations and Remote Sensing | United States | 41 | 664 | 6.4 | 1.335 | 101 |
| 9 | Science of the Total Environment | Netherlands | 38 | 509 | 14.1 | 1.806 | 275 |
| 10 | ISPRS International Journal of Geo-Information | Switzerland | 30 | 283 | 5.0 | 0.721 | 52 |
| 11 | Ecological Indicators | Netherlands | 29 | 318 | 8.4 | 1.284 | 145 |
| 12 | Water (Switzerland) | Switzerland | 26 | 288 | 4.8 | 0.716 | 69 |
| 13 | Forests | Switzerland | 25 | 134 | 4.0 | 0.623 | 52 |
| 14 | International Journal of Remote Sensing | United Kingdom | 24 | 146 | 6.5 | 0.873 | 185 |
| 15 | Geocarto International | United Kingdom | 22 | 62 | 7.2 | 0.644 | 47 |
Table 4.
Top 15 most cited documents.
| Rank | Authors | Year | Document Title | Citations | Document Type |
|---|---|---|---|---|---|
| 1 | Gorelick et al. [1] | 2017 | Google Earth Engine: planetary-scale geospatial analysis for everyone | 4792 | Article |
| 2 | Dong et al. [79] | 2016 | Mapping paddy rice planting area in Northeastern Asia with Landsat 8 images, phenology-based algorithm, and Google Earth Engine | 462 | Article |
| 3 | Liu et al. [119] | 2018 | High-resolution multi-temporal mapping of global urban land using Landsat images based on the Google Earth Engine Platform | 377 | Article |
| 4 | Gong et al. [96] | 2020 | Annual maps of global artificial impervious area (GAIA) between 1985 and 2018 | 362 | Article |
| 5 | Souza et al. [18] | 2020 | Reconstructing three decades of land use and land cover changes in Brazilian biomes with Landsat archive and earth engine | 324 | Article |
| 6 | Tamiminia et al. [29] | 2020 | Google Earth Engine for geo-big data applications: a meta-analysis and systematic review | 313 | Short Survey |
| 7 | Lobell et al. [117] | 2015 | A scalable satellite-based crop yield mapper | 305 | Article |
| 8 | Xiong et al. [110] | 2017 | Automated cropland mapping of continental Africa using Google Earth Engine cloud computing | 298 | Article |
| 9 | Kumar et al. [2] | 2018 | Google Earth Engine applications since inception: usage, trends, and potential | 280 | Article |
| 10 | Huang et al. [85] | 2017 | Mapping major land cover dynamics in Beijing using all Landsat images in Google Earth Engine | 258 | Article |
| 11 | Gong et al. [120] | 2019 | 40-Year (1978–2017) human settlement changes in China reflected by impervious surfaces from satellite remote sensing | 247 | Article |
| 12 | Chen et al. [121] | 2017 | A mangrove forest map of China in 2015: analysis of time series Landsat 7/8 and Sentinel-1A imagery in Google Earth Engine cloud computing platform | 240 | Article |
| 13 | Shelestov et al. [118] | 2017 | Exploring Google Earth Engine platform for big data processing: classification of multi-temporal satellite imagery for crop mapping | 237 | Article |
| 14 | Zhang et al. [122] | 2019 | Coupled estimation of 500 m and 8-day resolution global evapotranspiration and gross primary production in 2002–2017 | 236 | Article |
| 15 | Teluguntla et al. [108] | 2018 | A 30 m Landsat-derived cropland extent product of Australia and China using random forest machine learning algorithm on Google Earth Engine cloud computing platform | 233 | Article |
| SUM OF TOP 15 CITATIONS | 8964 | ||||
| TOTAL CITATIONS (2800 DOCUMENTS) | 39,228 | ||||
Disclaimer/Publisher’s Note: The statements, opinions and data contained in all publications are solely those of the individual author(s) and contributor(s) and not of MDPI and/or the editor(s). MDPI and/or the editor(s) disclaim responsibility for any injury to people or property resulting from any ideas, methods, instructions or products referred to in the content. |
© 2023 by the authors. Licensee MDPI, Basel, Switzerland. This article is an open access article distributed under the terms and conditions of the Creative Commons Attribution (CC BY) license (https://creativecommons.org/licenses/by/4.0/).
Share and Cite
MDPI and ACS Style
Velastegui-Montoya, A.; Montalván-Burbano, N.; Carrión-Mero, P.; Rivera-Torres, H.; Sadeck, L.; Adami, M. Google Earth Engine: A Global Analysis and Future Trends. Remote Sens. 2023, 15, 3675. https://doi.org/10.3390/rs15143675
AMA Style
Velastegui-Montoya A, Montalván-Burbano N, Carrión-Mero P, Rivera-Torres H, Sadeck L, Adami M. Google Earth Engine: A Global Analysis and Future Trends. Remote Sensing. 2023; 15(14):3675. https://doi.org/10.3390/rs15143675
Chicago/Turabian StyleVelastegui-Montoya, Andrés, Néstor Montalván-Burbano, Paúl Carrión-Mero, Hugo Rivera-Torres, Luís Sadeck, and Marcos Adami. 2023. "Google Earth Engine: A Global Analysis and Future Trends" Remote Sensing 15, no. 14: 3675. https://doi.org/10.3390/rs15143675
Note that from the first issue of 2016, this journal uses article numbers instead of page numbers. See further details here.