Article

Combined Characterization of Airborne Saharan Dust above Sofia, Bulgaria, during Blocking-Pattern Conditioned Dust Episode in February 2021

1
Institute of Electronics, Bulgarian Academy of Sciences, 72 Tsarigradsko Chaussee Blvd, 1784 Sofia, Bulgaria
2
I. Stepanov Institute of Physics, National Academy of Sciences of Belarus, 68-2 Nezavisimosti Av., 220072 Minsk, Belarus
*
Author to whom correspondence should be addressed.
Remote Sens. 2023, 15(15), 3833; https://doi.org/10.3390/rs15153833
Submission received: 26 May 2023 / Revised: 12 July 2023 / Accepted: 14 July 2023 / Published: 1 August 2023

Abstract

:
The wintertime outbreaks of Saharan dust, increasing in intensity and frequency over the last decade, have become an important component of the global dust cycle and a challenging issue in elucidating its feedback to the ongoing climate change. For their adequate monitoring and characterization, systematic multi-instrument observations and multi-aspect analyses of the distribution and properties of desert aerosols are required, covering the full duration of dust events. In this paper, we present observations of Saharan dust in the atmosphere above Sofia, Bulgaria, during a strong dust episode over the whole of Europe in February 2021, conditioned by a persistent blocking weather pattern over the Mediterranean basin, providing clear skies and constant measurement conditions. This study was accomplished using different remote sensing (lidar, satellite, and radiometric), in situ (particle analyzing), and modeling/forecasting methods and resources, using real measurements and data (re)analysis. A wide range of columnar and range/time-resolved optical, microphysical, physical, topological, and dynamical characteristics of the detected aerosols dominated by desert dust are obtained and profiled with increased accuracy and reliability by combining the applied approaches and instruments in terms of complementarity, calibration, and normalization. Vertical profiles of the aerosol/dust total and mode volume concentrations are presented and analyzed using the LIRIC-2 inversion code joining lidar and sun-photometer data. The results show that interactive combining and use of various relevant approaches, instruments, and data have a significant synergistic effect and potential for verifying and improving theoretical models aimed at complete aerosol/dust characterization.

1. Introduction

The Sahara is the largest non-polar desert on Earth, with an area of more than 9 × 10⁶ km2, emitting hundreds of millions of tons of mineral dust into the atmosphere annually [1,2,3,4,5]. This makes it a very important component of the global dust cycle, particularly in the northern hemisphere [6,7,8,9,10]. Thanks to regional and global-scale air circulation systems, huge amounts of Saharan airborne particulate matter undergo long-range transport over thousands of kilometers downwind, reaching the Caribbean to the west and covering the Mediterranean basin and all of Europe to the east–northeast [1,11,12,13,14,15,16,17]. Filling such vast atmospheric areas with dust aerosols carried by warm and normally dry air masses has a substantial effect on the thermal regime and radiative balance of the atmosphere. This makes desert dust one of the key climatological factors, with a relative weight comparable to that of greenhouse gases [18,19,20,21,22,23,24]. Dust-treating models are better parameterized and more accurate and reliable when related to dust events in regions near the dust sources, but less so for remote regions [25]. To compensate for model parameterization deficiency, a multitude of systematic remote sensing and in situ measurements for monitoring atmospheric desert dust properties with appropriate approaches and tools are needed, especially in regions far from the dust sources.
Regional and global air circulation systems drive the spread of desert aerosols with strong seasonal dependence, with specific patterns and manifestations varying throughout the year [5,26,27]. In terms of intensity and frequency, emissions and long-range transport of Saharan dust over Europe, including the Balkans, exhibit a pronounced maximum in spring and summer and a minimum in winter, the latter being considered for a long time atypical [12,28,29,30,31]. For this reason, observations of Saharan dust at mid-latitudes are most frequent during the spring-summer period, while during the winter, they are quite rare [13,32,33,34,35,36]. However, in the last decade, a marked trend has been observed toward an increase in the frequency and strength of winter dust episodes at mid-latitudes [37,38,39,40,41,42]. In this regard, there is a growing need for more in-depth observations and relevant characterization of the wintertime events of Saharan dust outbreaks spreading to the north–northeast over the Mediterranean, Europe, and the Balkans, in particular.
An obstacle hindering the achievement of the above objectives is that in most remote measurements of airborne desert dust, these measurements are often fragmentary, not covering the full cycle of events due to adverse weather conditions. Periods of prolonged stable meteorological conditions in the absence of significant amounts of other aerosol types during the dust events are most favorable for better monitoring, characterization and parameterization of airborne desert dust. In particular, such conditions could be provided by blocking weather patterns. These are synoptic-scale situations in which the normal zonal flow has been temporarily suppressed in a sector by the strong, persistent meridional flow. This blocks the normal west-to-east progress of extratropical migratory cyclone systems [43]. Such blocking patterns are stationary ridges, omega blocks, dipole (Rex) blocks, Rosby wave breaking, etc. [44,45,46,47].
Due to the natural spreading of dust aerosols over large atmospheric domains and the high spatial and temporal dynamics of their distribution, remote sensing using ground-based, airborne, and spaceborne active and passive sensors has been recognized as the primary approach for their monitoring and research [14,48,49,50,51]. Lidars of different types are established and traditional tools for active remote aerosol observations. They offer great capabilities for recording, measuring, and height profiling a range of optical, microphysical, topological, and dynamical characteristics of atmospheric aerosols, including desert dust, in near real-time over large areas with high spatial and temporal accuracy and resolution [52,53,54,55,56,57,58,59,60,61,62].
Given its significant impact on climate, ecosystems, and human health [63,64,65], desert dust is recognized as a crucial climatological factor. It is one of the main types of aerosols being extensively monitored and studied within the lidar networks around the world, in particular the European Aerosol Research Lidar Network (EARLINET) [66] and the pan-European Aerosol, Clouds, and Trace Gases Research Infrastructure (ACTRIS) [67]. Despite the serious merits noted above, lidars have some limitations. They are mainly related to the impossibility of using pure lidar data to directly determine essential aerosol characteristics, such as aerosol mass concentration, particle size distribution, and other climatically important parameters determining their positive or negative radiative effect.
Sun photometers are multi-channel passive sensors that detect direct solar radiation at discrete spectral lines from the UV to the near IR regions [68]. Most of them are incorporated in ground-based networks for coordinated automatic measurements, the largest of which is AERONET (AErosol RObotic NETwork) established by NASA and PHOTONS (PHOtométrie pour le Traitement Opérationnel de Normalisation Satellitaire) [69]. Sun photometers provide several significant columnar atmospheric optical and microphysical parameters, but their disadvantage is the lack of range/height resolution. Since the two lidar and radiometric methods mutually compensate for their shortcomings, the combined use of both provides additional information on atmospheric aerosol properties. This is implemented in the theoretical algorithms and inversion codes developed, such as LIRIC [70], GARRLiC [71], POLIFON [72], and GRASP [73]. These allow a much more complete characterization of atmospheric aerosols, providing determination and range/height-resolved profiling of their important physical characteristics, such as volume and/or mass concentration, and distinguishing between aerosol size/shape modes.
Another approach for passive remote detection and monitoring of atmospheric aerosols is satellite aerosol imagery [74,75]. A highly sensitive and powerful tool for imaging and monitoring the course and dynamics of atmospheric processes over land and oceans and in the lower atmosphere (including the transport of aerosols and desert dust) is the Moderate Resolution Imaging Spectroradiometer (MODIS) onboard NASA’s Terra and Aqua satellites [76].
Along with the active (lidar) and passive (radiometric and satellite) remote sensing approaches, local (in situ) measurements play an important role in aerosol monitoring for tracking and environmental control of near-ground aerosol contaminants [77,78]. They allow automated and permanent data acquisition for the aerosol mass concentrations (PM10 and PM2.5) and ecologically significant molecular atmospheric constituents.
Web-accessible online resources for air transport modeling [79,80] and dust forecasting [81,82,83,84,85,86] play a significant role in identifying the type and origin of registered atmospheric aerosols. Consequently, these resources contribute to a more complete and adequate characterization of aerosols in the atmosphere. In order to better reveal the impacts and interrelationships of the dust episodes with components of the global and regional climate systems, the online availability of resources for reanalysis of climatological datasets using data assimilation is of great benefit and importance [87,88,89,90].
During mid- and high-latitude dust load events, especially in winter, the transport of warm, dry air masses to typically seasonally colder areas can seriously perturb the local weather and the vertical aerosol stratification [42]. To clarify the effects of dust loads on the latter, vertical profiles of basic meteorological parameters (temperature, pressure, relative humidity, etc.) obtained using local radiosondes or from modeling/forecasting sources are important for direct comparisons and analyses and calibrating lidar profiles of aerosol parameters [80,91].
In this work, we present a comprehensive multi-instrumental study and characterization of a six-day Saharan dust load event in the atmosphere above Sofia, Bulgaria. This event was part of a larger dust episode observed over Europe in February 2021 [92] conditioned by a sustained synoptic-scale blocking weather pattern taking place over North Africa, the Mediterranean, and Europe. This is conducted by combining data from remote (lidar, radiometric, satellite) and in situ (PM10) measurements with data from modeling/forecasting and reanalysis resources. To the best of our knowledge, this work is the only such study of the dust episode in question in the Balkan region.
The main objective of the work is to follow, examine, and characterize the strong wintertime dust event observed above Sofia, Bulgaria, as a part of a larger synoptic-scale dust episode, throughout its entire period of presence, using active and passive remote, in-situ, and modelling instruments and approaches.
The specific objectives of this study are listed below:
(i) Using data reanalysis to characterize the dust episode in question, taking into account the global and regional meteorological and air-circulation processes and mechanisms (in particular blocking patterns) conditioning its formation and manifestations; (ii) identifying the areas of origin of the detected Saharan dust layers and defining the general and specific features and effects of the dust plume’s long-range transport to the region of measurements; (iii) obtaining a broad set of data that describes, profiles, and characterizes the physical, optical, microphysical, geometrical, and dynamical parameters of the dust aerosols and layers observed through remote, in situ, and modeling instruments and approaches. Aerosol/dust concentration profiling using the LIRIC-2 inversion code; (iv) examining the impacts of the dust-carrying warm and dry desert air masses on basic parameters of the winter weather in the Sofia region, as well as on the structure (layering) and aerosol content of the local troposphere during the dust event; (v) concluding the effects of the studied dust episode/event on the regional and local climate and air quality based on a systematic analysis of the experimental and modeling results obtained.
The paper content is organized as follows:
In Section 2, the methods and instruments used are described and briefly characterized. The main results obtained are reported and discussed in Section 3. The basic conclusions of the work are summarized in Section 4.

2. Instrumentation and Methods

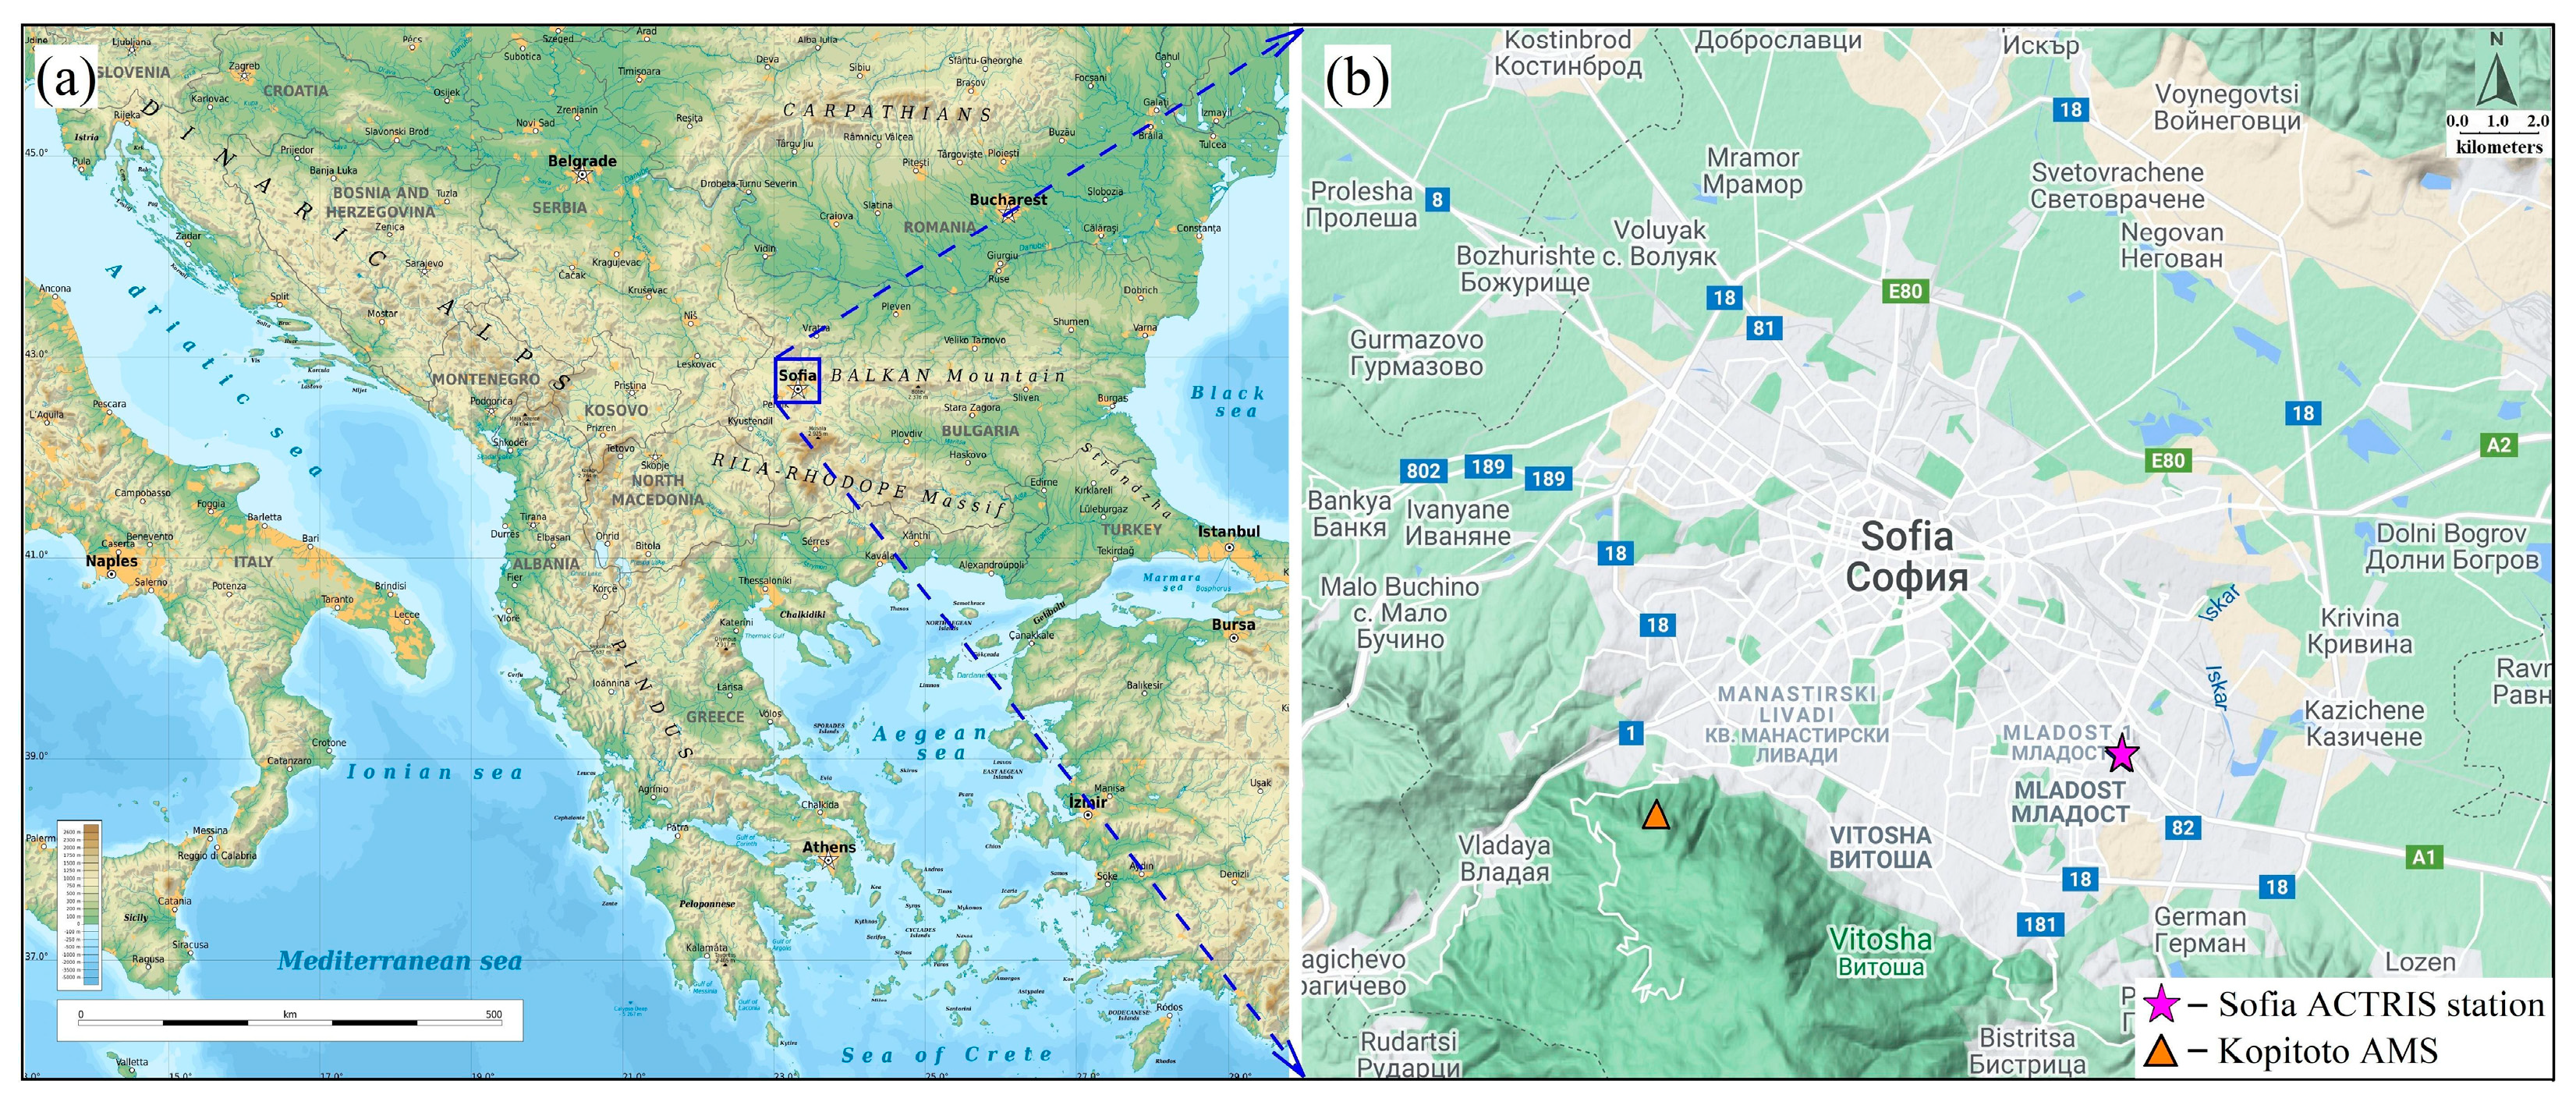
2.1. Measurement Site Description

Bulgaria is a country in Southeast Europe located on the eastern flank of the Balkan Peninsula (Figure 1a). Sofia is the capital and largest city of Bulgaria. It is situated in the western part of the country, in Sofia Valley, surrounded by nearly high mountains on all sides, with the Vitosha Mountain to the south and the Balkan Mountains to the north (Figure 1b). The valley has an average altitude of about 550 m above sea level (ASL).
Sofia has a humid continental climate, with an average annual temperature of 10 °C, a mean annual precipitation of 576 mm, and a mean annual relative humidity of 68% [93]. Winters in Sofia are cold and snowy. On the coldest days, temperatures can drop below −15 °C, most notably in January and February. Summers are quite warm and sunny, whereas springs and autumns are usually short with variable and dynamic weather.
The remote aerosol measurements described in this work were performed mainly at the Sofia lidar station of EARLINET and the sun-photometer station of AERONET. Both stations deployed in the Laser Radars Laboratory of the Institute of Electronics, Bulgarian Academy of Sciences (IE-BAS)—42°39′14″N, 23°23′14″E—represent the Sofia ACTRIS station together (see Figure 1b).

2.2. Remote Sensing Observational Instruments and Methods

2.2.1. Lidar System and Methodology

The lidar measurements during the dust load event were carried out using a lidar system developed at IE-BAS with three operational channels (two elastic-scatter channels at 1064 nm and 532 nm and a Raman channel at 607 nm).
The lidar transmitter is a flashlamp-pumped frequency-doubled/tripled pulsed Nd:YAG laser LOTIS TII model LS-2147N(MH). The laser emits at 1064/532/355 nm with maximum output energies of 850/500/270 mJ, separately in a single-wavelength regime (pulse duration: 16–18 ns (FWHM), pulse repetition rate: up to 10 Hz; beam divergence: Θ0.86 ≤ 0.8 mrad). For multiwavelength lidar measurements, the laser is operated in a frequency conversion configuration in which all three wavelengths are emitted simultaneously in a single output beam. In such a configuration, it produces a maximum output energy of about 200 mJ at each wavelength, depending on the variable pumping energy.
The radiation backscattered by the atmospheric aerosols and molecules (lidar signal) is received by a Cassegrain telescope with a clear aperture of 35 cm and a focal distance of 200 cm, with an adjustable iris field-stop diaphragm (up to 1 mm).
After the telescope, the lidar signals pass through a multi-channel optomechanical wavelength separator. They are further received and digitized by compact, noise-resistant photo-electronic modules connected to the PC-controlled lidar acquisition system. The modules comprise 10 Hz, 14-bit analog-to-digital converters providing a time/range resolution of 100 ns/15 m. The photosensitive elements in the lidar channels for the UV and visible spectral ranges are photomultiplier tubes; in the IR region (at 1064 nm), such an element is an avalanche photodiode with cascade amplification. As during the dust episode described the lidar spectral block was in partial reconstruction and upgrading, the lidar measurements were performed using only two aerosol lidar channels at 1064 nm and 532 nm.
The lidar system is arranged in a monostatic biaxial disposition with a laser beam pointing at a slope angle of 30° with respect to the horizon determined by its location in the laboratory. Thus, the system registers lidar signals with a reachable range/height limit of 30/15 km.
For retrieving profiles of the aerosol/dust backscatter coefficient (BSC), the widely recognized and adopted Klett–Fernald’s inversion algorithm [94,95] was applied. Specifically, the version of the algorithm used in this study assumes a constant lidar ratio (the ratio of aerosol extinction to backscattering coefficients) applied for the entire lidar pathway.
The aerosol BSC profiles were calibrated utilizing pure-molecular reference ones obtained by standard procedures from atmospheric pressure and temperature height profiles, using data from meteorological radiosondes and/or modeling data [80,91]. The calibration altitude intervals of nearly pure molecular atmospheric content were determined applying the standard Rayleigh fitting procedure [96,97].
The spatial distribution and temporal dynamics of the aerosol fields detected are displayed as colormap diagrams in height–time coordinates using series of consecutively recorded profiles of time-resolved range-corrected lidar signals (RCS).
In order to estimate qualitatively the dominant particle size fractions in the aerosol layers registered, backscatter-related Ångström exponent (BAE) profiling was conducted based on the time-averaged BSC profiles at the two laser wavelengths (532 nm and 1064 nm) [98,99,100], using the following expression:
BAE(z) = ln[BSC(z,λ2)/BSC(z,λ1]/ln(λ12),
where λ1 = 1064 nm, λ2 = 532 nm, and z is the lidar distance.

2.2.2. Sun Photometer

A Cimel CE318-TS9 sun/sky/lunar photometer, the standard instrument of AERONET [68,69,101], was installed at the IE-BAS in May 2020, and the AERONET site Sofia_IEBAS was established [102]. It has nine channels with central wavelengths at 340, 380, 440, 500, 675, 870, 937, 1020, and 1640 nm and a field of view of about 1.3°. The instrument automatically performs direct sun irradiance measurements every 3 or 5 min at the above-mentioned wavelengths and direct moon irradiance measurements at wavelengths ≥ 440 nm. Sky radiances in almucantar and hybrid scenarios are generally measured once per hour at the following wavelengths: 380, 440, 500, 675, 870, 1020, and 1640 nm. The instrument is being annually calibrated at AERONET-EUROPE, operating within the ACTRIS Center for Aerosol Remote Sensing at Laboratoire d’Optique Atmosphérique, Université de Lille, France (CARS-ASP-CNRS), following the AERONET protocol.
The raw data are regularly transferred to the AERONET and processed to obtain the columnar aerosol optical and microphysical characteristics. These characteristics are derived by direct measurements, the AERONET spectral deconvolution algorithm (SDA) [103,104], and the inversion algorithm [105,106,107] and include spectrally dependent aerosol optical depth (AOD), Ångström exponent (AE), fine and coarse mode AOD, particle depolarization ratio (DR), lidar ratio (LR), particle volume size distribution (PSD), single scattering albedo (SSA), complex refractive index, phase functions, (in)direct radiative forcing (RF), etc. The estimated uncertainty in the AOD is less than 0.01 for wavelengths longer than 440 nm and less than 0.02 for those shorter than 440 nm, while the relative uncertainty in measuring sky radiance is assumed to be about 5% [69,106,108,109]. Inversion parameters’ uncertainties are discussed in [106,109]. The set of retrieved parameters used in this work is provided in Section 3.5.

2.2.3. MODIS-Terra Imaging of the Aerosol/Dust Plume Spread

The MODIS instrument operates in a total of 36 spectral bands, covering the wavelength range 0.4–14.4 µm, with varying spatial resolutions in those bands, as follows: 250 m (Bands 1–2), 500 m (Bands 3–7), and 1000 m (Bands 8–36) [76]. The first seven bands in the wavelength range from 0.46 to 2.16 µm are used for retrieving the aerosol properties. Two MODIS sensors operating on the NASA Earth Observing System (EOS) Terra (EOS AM-1) and Aqua (EOS PM-1) satellites are widely used for earth and climate measurements [76,110]. The EOS satellites’ orbit is 705 km in descending (Terra) or ascending (Aqua) mode. The swath dimensions are 2330 km across the track by 10 km along the track at the nadir. The global coverage ranges from one to two days.
In this work, we use the MODIS Corrected Reflectance imagery visualized on the NASA Worldview website (https://worldview.earthdata.nasa.gov/, accessed on 29 April 2021), part of the NASA Earth Observing System Data and Information System (EOSDIS). The imaginary resolution is 250 m, while the temporal one is daily.
Combining satellite imagery, such as the one provided by MODIS, with data from other air-transport tracking web resources, such as HYSPLIT backward trajectories [79,80], makes it possible to determine whether the detected aerosol pollutions of the atmosphere are caused by local sources or by ones external to the region.

2.3. In Situ PM10 Measurements

The ambient air quality in Bulgaria is monitored by the National System for Environmental Monitoring (NSEM), which is supervised by the Ministry of Environment and Water (MoEW) via the Executive Environmental Agency (ExEA). ExEA also administers the National Automated System for Environmental Monitoring (NASEM) for the whole country, providing the technical, methodological, and software resources necessary for its operation and development. All measurements and observations are carried out by the structures of the ExEA using common, unified methods for sampling and analysis in accordance with the procedures ensuring the quality of measurements and data. All ExEA laboratories are accredited under the BS EN ISO/IEC 17025-General requirements for competence in testing and calibration from Executive Agency “Bulgarian Accreditation Service” (EA BAS).
In this paper, we use time series data of hourly mean values for the PM10 mass concentration obtained by the air quality automated measuring stations (AMSs) in Sofia, part of the NASEM [111]. All the AMSs operate continuously (24 h), and the data on the air quality from them are received in real-time in the National Air Quality Database at the ExEA. There are six stationary air quality AMSs on the territory of Sofia. Five stations are located in the city (at 550–600 m ASL). The sixth station, Kopitoto AMS, is located about 800 m above the other stations (1321 m ASL, 42°38′13.2″N, 23°14′38.4″E) in Vitosha Mountain (see Figure 1b). Thus, this is classified as an elevated rural reference station for aerosol background measurements. The height of the winter atmospheric boundary layer (ABL) top above Sofia is estimated to vary in the range of 950–1200 m ASL [112,113], so the anthropogenic aerosol contribution to the PM10 data provided by this station in winter can be neglected. The distance between Kopitoto AMS and Sofia IE-BAS station is about 11.8 km.

2.4. Modeling/Forecasting and Reanalysis Data Provision

Specialized online resources for quantifying and mapping the spread of desert dust are available via the Barcelona Dust Regional Center [114], allowing interactive access to different dust forecasts and dust-related observational platforms and products. Similar possibilities are provided by the SKIRON Dust modeling system of the Atmospheric Modeling and Weather Forecasting Group (AM and WFG) of the Department of Physics of the National and Kapodistrian University of Athens (NKUA) [81,82]. Important information on the transport history of the detected aerosols/dust is accessible via the Real-time Environmental Applications and Display System (READY) of the National Oceanic and Atmospheric Administration (NOAA) Air Resources Laboratory (ARL). This information is made available through the online-operated interactive Hybrid Single-Particle Lagrangian Integrated Trajectory (HYSPLIT) transport and dispersion model [79,80]. The latter provides backward trajectories ending above the measurement site at a given height and time, thus tracking the pathway of the air masses prior to their appearance over the study area.
To make assumptions about both the type and origin of the aerosols in the layers detected by the lidar, we use data and images provided by the Barcelona Supercomputing Center Dust Model BSC-DREAM8b [83,84], the SKIRON, and the HYSPLIT.
Data from the National Centers for Environmental Prediction/National Center for Atmospheric Research (NCEP/NCAR) Reanalysis [88,89] provided by the NOAA Physical Sciences Laboratory [90] are also used for synoptic (re)analyses.

2.5. LIRIC Inversion Code Analysis and Data

An essential component of the results presented here on characterizing the atmospheric aerosols dominated by Saharan dust is the height profiling of their volume concentrations by applying the Lidar-Radiometer Inversion Code (LIRIC) [70].
LIRIC is designed to implement a combined lidar and radiometric aerosol sounding (LRS) technique at joint EARLINET and AERONET stations. It is a statistically optimized inversion algorithm that retrieves the parameters of an aerosol model optimized for minimizing the residuals of measured and calculated result datasets from LRS experiments. LIRIC employs the AERONET aerosol model [105,107], assuming that the aerosol modes’ volume concentrations change over altitude.
Note that LIRIC is an inversion approach providing simultaneous height profiling of the volume concentration for fine and coarse aerosol fractions, with possibilities (upon the availability of depolarization measurement data) of distinguishing between the spherical and non-spherical modes of the latter [70]. The LIRIC input lidar dataset consists of backscatter signals at the wavelengths 532 nm and 1064 nm (mandatory), and 355 nm (optimally) with both cross- and parallel polarization components of the lidar signal at 532 nm wavelength (optimally). The column parameters of the aerosol layer from radiometric measurements are loaded into the LIRIC using AERONET Level 1.5 or 2.0 data.
The LIRIC-2 code [115] is an evolution of LIRIC. Also, it includes new program modules for processing data of LRS measurements when Cloud-Aerosol Lidar with Orthogonal Polarization (CALIOP) of NASA’s Cloud-Aerosol Lidar and Infrared Pathfinder Satellite Observation (CALIPSO) satellite measures aerosols in the vicinity of AERONET or Sun-sky radiometer Observation NETwork (SONET) [116,117] radiometric site. New program shell and modules were developed to ensure the implementation of new options for the formation and preliminary processing of input data files and to estimate the uncertainty of the retrieved aerosol parameters for the specified input data uncertainty.

3. Results and Discussion

3.1. Synoptic Situation during the Dust Episode

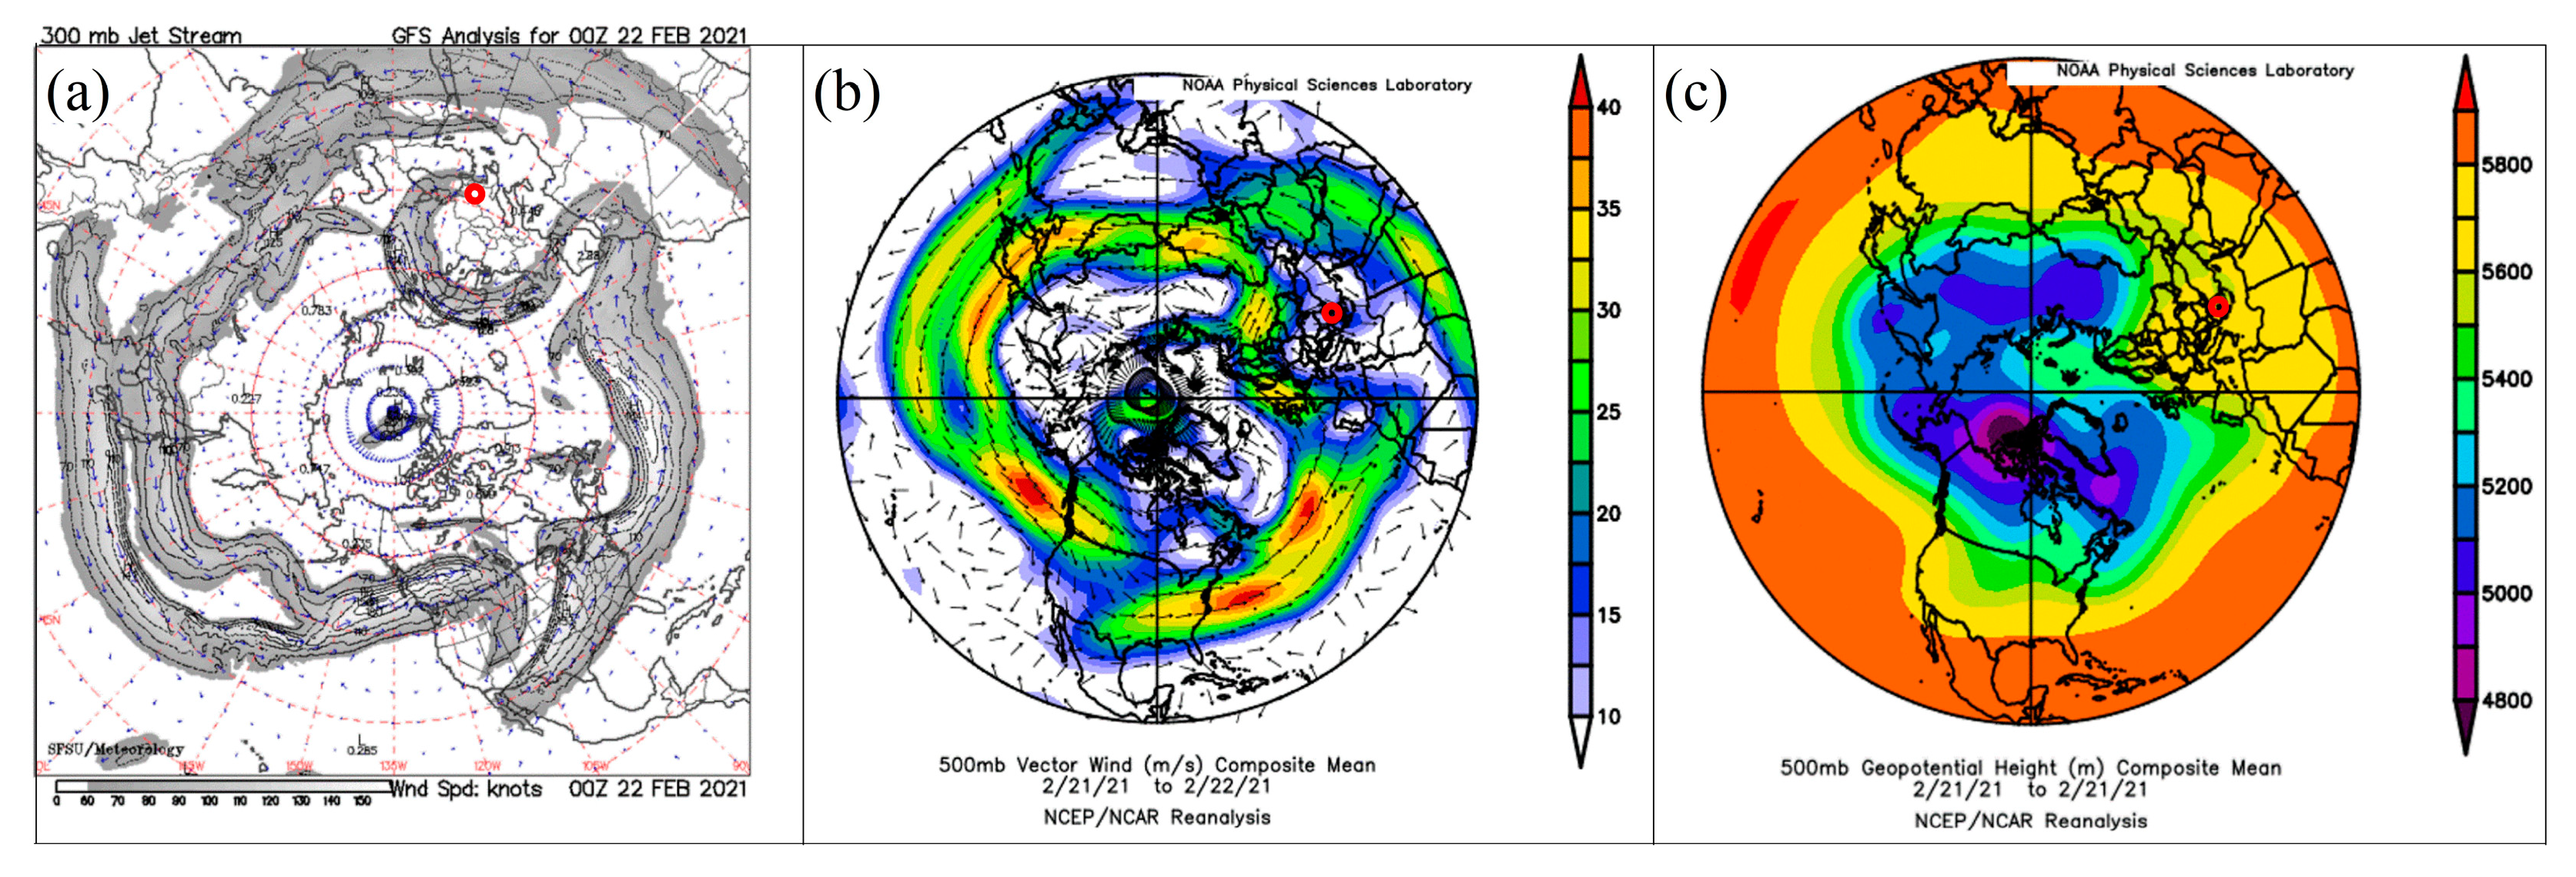
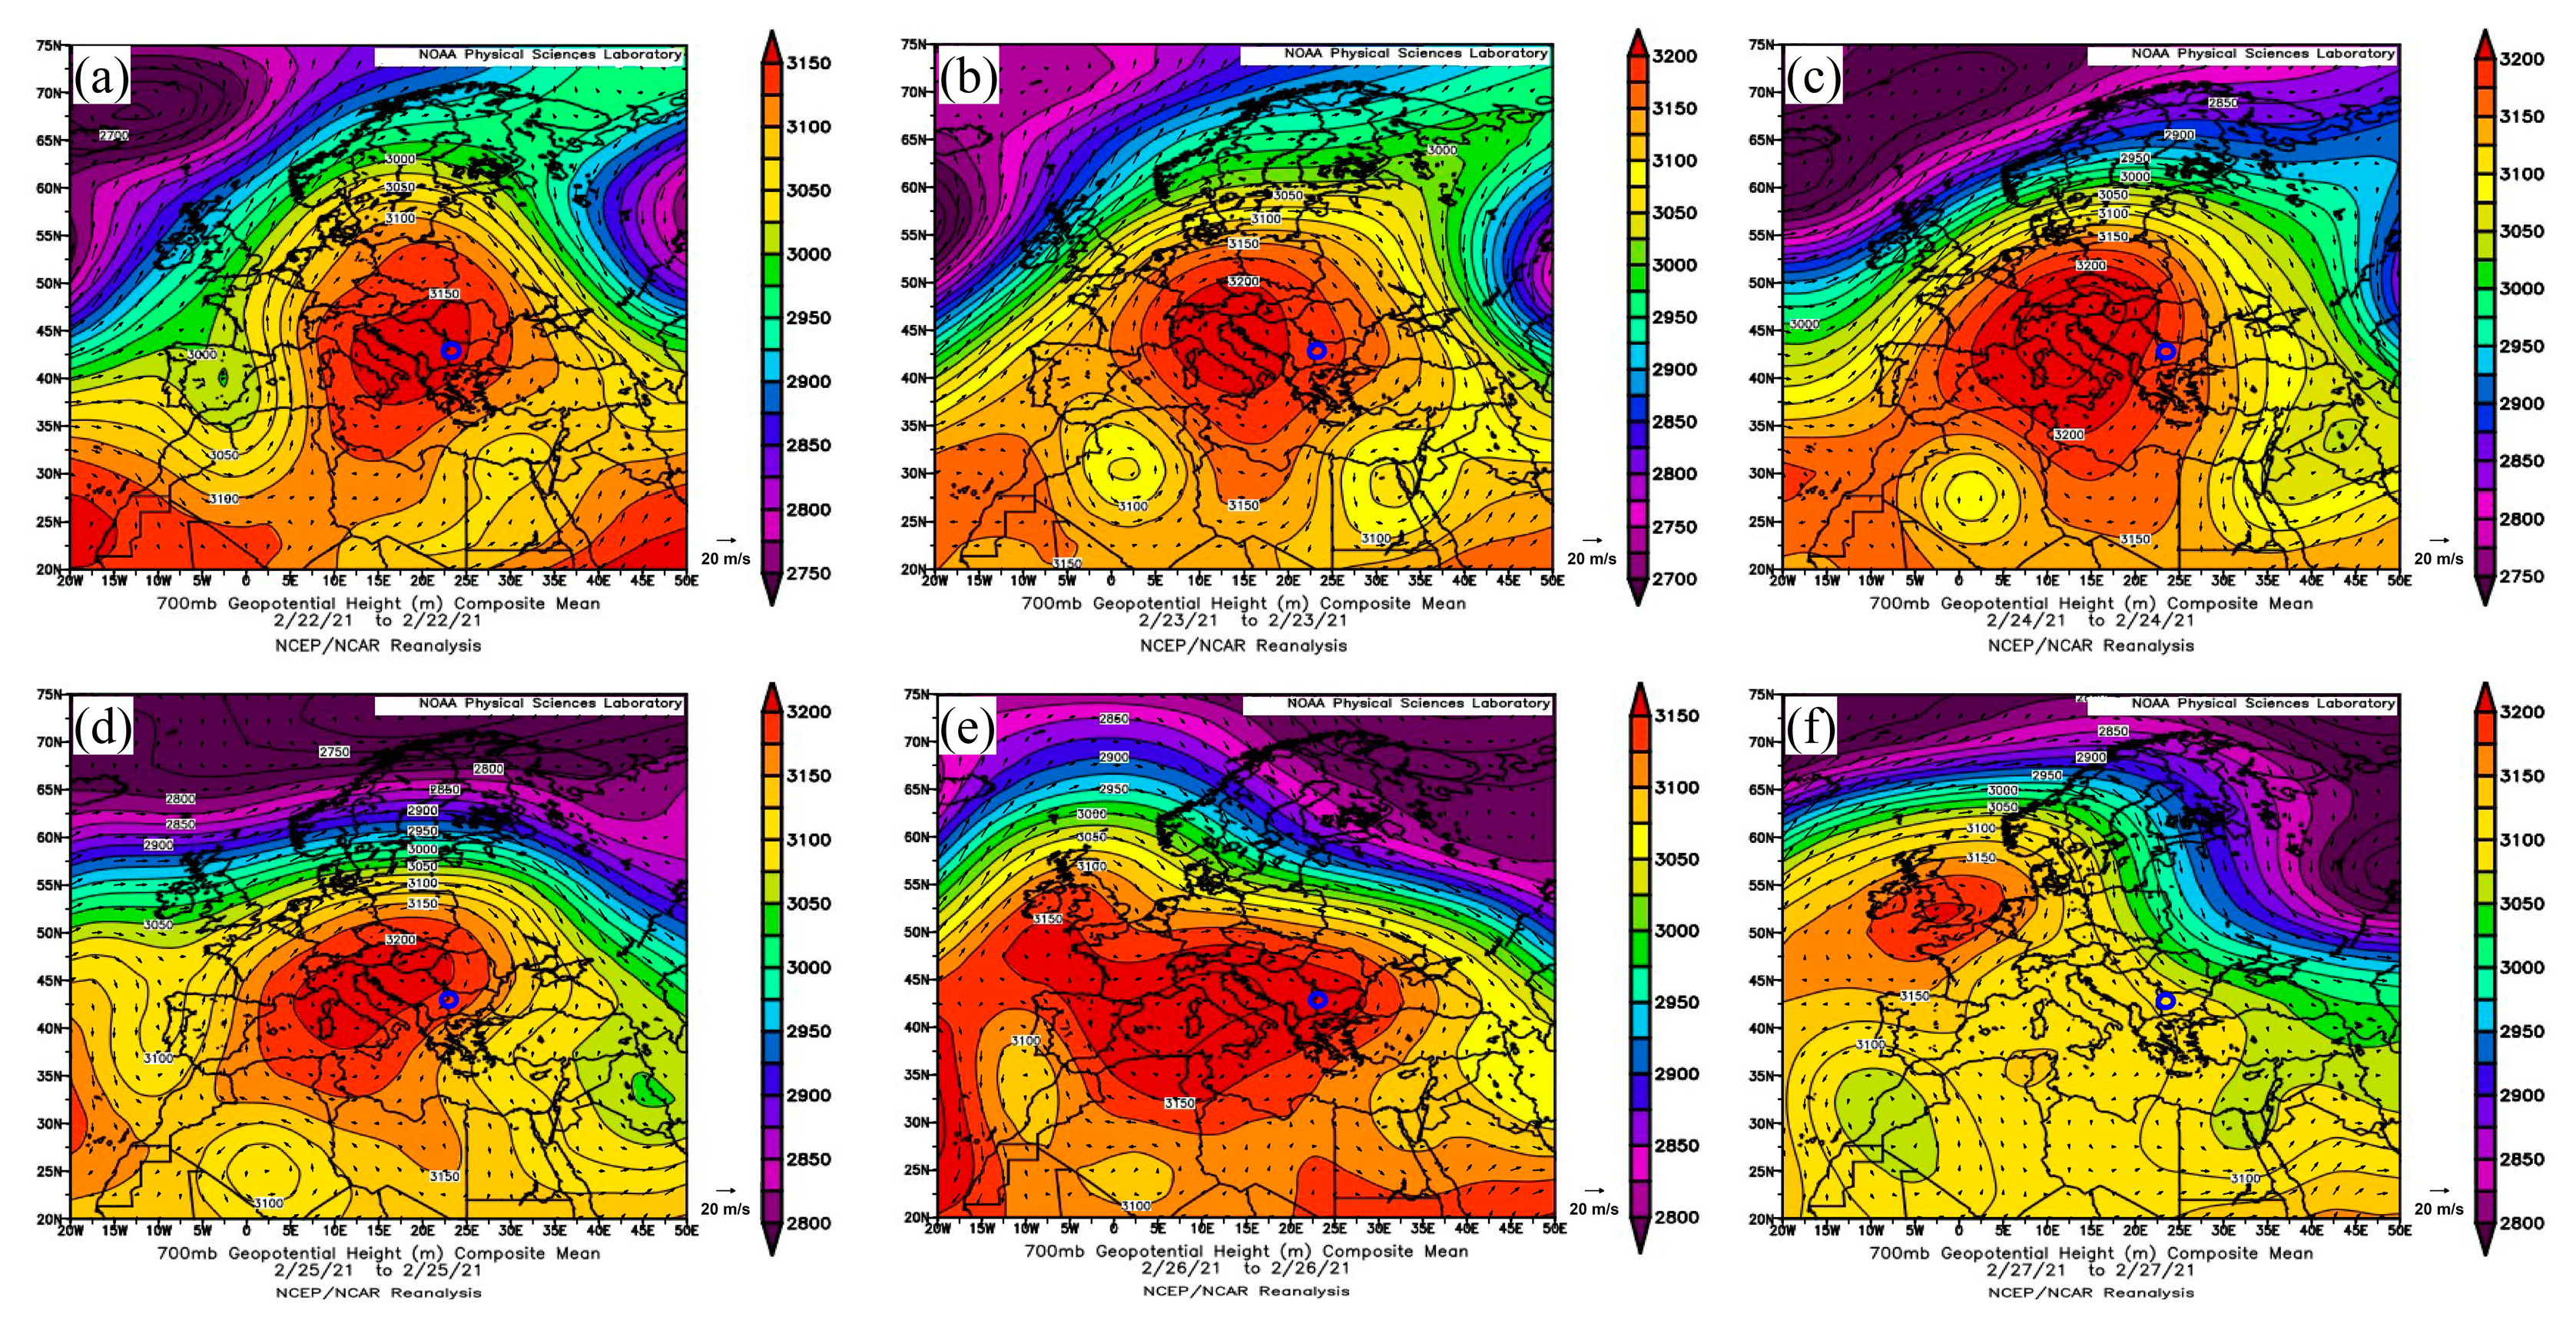
3.1.1. Blocking Circulation Patterns

In order to analyze the synoptic situation over Europe and the Mediterranean conditioning the dust outbreak episode under consideration (20–28 February 2021), data are mainly used from the NCEP/NCAR reanalysis dataset.
Figure 2 shows diagrams outlining the meteorological circulation picture in the upper troposphere and the tropopause of the Northern Hemisphere. These diagrams refer to a period of time shortly after the onset of the dust episode and immediately before the start of the aerosols/dust measurements described here. The polar jet-stream map from the Global Forecast System (GFS) model analysis of the California Regional Weather Server of San Francisco State University [118] and the NCEP/NCAR maps of the vector winds and geopotential height show pronounced undulation/meandering and meridional circulation in the longitude/latitude range 15 W–45 E/20 N–70 N (the upper right of the maps). This region includes the northernmost parts of Africa, the Northeast Atlantic, the Mediterranean, and the whole of Europe, forming a single Rossby wave. On the one hand, it is manifested by the strong and sharp penetration of cold air masses from north to south–southeast and the formation of a low-pressure area with cyclonic (anti-clockwise) vorticity over the Northeast Atlantic, Northwest Africa, and Southwest Europe. On the other hand, a wider oval (omega-like) zone showing the entry of warm air masses from North Africa and the Mediterranean to the north over the whole of Europe occurs in the neighborhood. It is related to the former, with anti-cyclonic (clockwise) vorticity partially entering the polar vortex zone. The possible projection of such a Rossby wave structure down to lower-lying tropospheric domains could be a typical and clear prerequisite for forming a synoptic blocking pattern.
Figure 3 shows NCEP/NCAR maps of the geopotential height composite for the longitude/latitude interval 20 W–50 E/20 N–75 N and the period of measurements. The 700 mb level chosen corresponds to heights in the lower half of the troposphere at mid-latitudes, where the dust transport considered here is mainly concentrated. Partially labeled isopleth contours of constant geopotential heights and the corresponding color bars are shown. The wind patterns depicted by wind vectors indicating the direction and amplitude of the air flows are also outlined on the maps. The wind vector lengths correspond to wind velocities of 5–30 m/s.
As can be seen from the maps in Figure 3, during the considered period, a synoptic-scale blocking weather pattern is formed over North Africa, the Mediterranean, and Europe. This pattern is characterized by strong meridional components of the air circulation. The observed blocking circulation pattern features are important for air mass tracking and how the desert aerosols are transported during the dust episode. The blocking structure undergoes a significant evolution during the period in question. Starting from an initial stationary ridge (22 February), it transforms into a fully formed, slightly fluctuating omega block (23–25 February) and converts to a high-over-low (26–27 February). It further develops into a Rex block in the following days (not shown).
Thus, within the period under review, the blocking system manifests itself in all the variants stated above. Nevertheless, most of the time, it retains some of its main features, such as the location of the high-pressure ridge core with a high geopotential height above the Mediterranean basin and the noticeably low airflow velocities in its interior combined with the high velocities of its meridional flows. Bulgaria, particularly Sofia, remains in the peripheral part of the anticyclonic ridge core of the blocking weather pattern throughout the period considered; the geopotential height is in a relatively constant range of 3100–3150 m, suggesting stable, likely cloudless, atmospheric conditions. Due to the above-mentioned features of the wind pattern within the blocking structure, a specific feature of the regional air circulation appears. This is expressed by the fact that the air flows carrying air masses from North Africa, in this case, enter the region of Bulgaria mainly from the north–northwest, in contrast to the typical entry for the region of those from the south–southwest. As a result, this creates specific, uncommon conditions for studying the dust load event considered.

3.1.2. Air Temperature Composite Anomalies in the Dust-Affected Areas

An essential aspect of analyzing and characterizing winter dust episodes, such as the one considered here, is related to the heat transfer from desert sources to mid- and high-latitudes, typically characterized by low seasonal temperatures. In this regard, it is important to clarify how the warm desert air masses affect the regional and local weather and meteorological parameters, particularly the air temperature, in the dust-laden zones.
Figure 4 displays color maps of the air temperature composite anomalies (TA) with respect to the climatological means based on the NCEP/NCAR reanalysis of climatological data provided by the NOAA Physical Sciences Laboratory [90].
As seen in Figure 4, the area of positive TA covers the Mediterranean and the whole of Europe and is surrounded mainly by areas of negative TA to the south and east. The core of the former moves over Central and Southeastern Europe. During this movement, the core shape and the spatial distribution of the TA in it also change. In general, areas at higher latitudes, with traditionally low seasonal temperatures, are subjected to positive TA, while the ones south of them, with typically higher seasonal temperatures (e.g., North Africa), undergo negative or zero TA. Combined with the fact that the positive/negative TA reach +(10–15) °C/−(10–12) °C, this reveals the presence of a serious heat transfer in the lower troposphere from North Africa (i.e., from the Sahara Desert) to the Mediterranean and Europe.
Bulgaria, particularly Sofia, is progressively covered by the zone of positive TA with increasing temperature values; on 23 February, it is close to its core with a positive anomaly of +11 °C, which is the highest for the entire period. This situation persists with some fluctuations until the end of the period, reaching a moderate TA of +5–6 °C. Thus, during the whole period of the lidar and radiometric measurements considered here, Sofia and the measuring site are in a zone of significant positive TA. This creates preconditions for a serious influence of the TA on components of the local seasonal weather, particularly for a possible increase in the near-surface air temperature with the corresponding climatic, environmental, and medical consequences.

3.2. Dust Episode Description

February 2021 appears to be a month of exceptional winter period activity and transport of warm air masses carrying Saharan dust northward to the temperate latitudes. Two significant dust episodes in their strength and scale in the first and last ten days of that month led to the transfer of tremendous amounts of dust over the Mediterranean and the whole of Europe. This seriously impacted the air quality and seasonal climate conditions in the affected regions. These dust events were the subject of research interest and study, as reflected in the specialized scientific literature [59,119,120,121]. Here, we present the results of experimental and model studies on the second of the two dust episodes noted.

3.2.1. Dust Spread Mapping and Imaging

Figure 5 presents forecast color maps of the total dust load of Saharan dust in the atmosphere over North Africa, the Mediterranean, and Europe for 22–27 February 2021, obtained by the SKIRON model provided by NKUA [81,82]. The transport of mineral dust from the Sahara to the Balkans, and in particular to Bulgaria, is usually observed in a northeastward direction over the Mediterranean Sea and the southern parts of Europe [122,123], whereupon, naturally, dust intrusions over the region of Sofia are generally observed as coming from the southwest. Chronological tracking of the dust transport shown in Figure 5 reveals a different path and a specific pattern of the desert aerosols’ distribution for the episode discussed here. As seen in Figure 5, a dense and narrow dust plume is formed at the beginning of the period, heading north and reaching Scandinavia. During this period, the region of Sofia remains on the lateral periphery of the dust plume, with relatively low levels of expected dust load.
In the middle of the period, a noticeable bending of the dust plume to the east–southeast can be observed at high latitudes (above 40 N). It is accompanied by a higher dust load (≥1000 mg/m2) over Eastern Europe and the Black Sea basin, reaching the western parts of Central Asia and merging with the dust-rich regions of the Middle East. During this middle period of the dust episode, especially on 24 February the Sofia region is covered by the densest parts of the dust plume. The forecast values of dust load are in the 600–1000 mg/m2 range.
The dust transport tracking presented above reveals a specific picture of the dust intrusion considered, according to which the dust-containing desert air masses occur and enter the atmosphere over Bulgaria and Sofia mainly from the north and partly from the northwest. This is unusual for Saharan dust intrusions over Bulgaria as a whole and even more so regarding the coldest parts of the winter, when markedly cold and snow-bearing atmospheric frontal systems reach the region from the north. We associate this atypical movement and intrusion of desert aerosols with the formation and dominance of the synoptic blocking pattern (in particular, the omega block), conditioning the atmospheric circulations in the Mediterranean region and Europe during the dust episode in question. In the next few days (25–26 February), high dust density persists over the already dust-covered regions, including Bulgaria. At the end of the period, a dust field movement begins from the northern parts of Europe to the south, while Bulgaria remains in its upper periphery with decreasing dust density.
A well-defined correlation is ascertained between the above-described picture of dust distribution and those of geopotential height (Figure 3) and temperature anomalies (Figure 4). It shows unequivocally that the dust episode is conditioned and driven by the blocking patterns formed and present over the Mediterranean and Europe in the period under consideration.
Figure 6 shows true-color images obtained by a MODIS-Terra satellite tracking the spread of the dust plume and cloud coverage from North Africa over the Mediterranean and Europe from 21 to 26 February 2021.
The satellite images are in good agreement with their counterparts in Figure 3 and Figure 5. They reveal additional characteristic features of the transport of dust-containing air masses driven by the blocking synoptic pattern. As in previous cases [36], dust plume transport occurs parallel with that of large cloud-bearing air masses. However, in the present case, a central cloud-free zone of the blocking synoptic system is observed, characterized by high atmospheric pressure, slow air circulation, and a cloud-laden periphery with low pressure and high air flow rates. Due to this feature, the contours and structure of the blocking pattern are clearly distinguished and well-outlined on the satellite images, in particular the omega-like contours on the upper three (a–c) ones. As can be seen, Bulgaria and Sofia remain permanently in the cloud-free zone, although close to its periphery, which favored our conducting daily lidar observations of the Saharan dust loads. The images for 24–26 February (panels d–f) clearly show that Sofia is in the dust-saturated zone (areas in hazy gray), while on 23 February (panel c), the dust region is partially masked by clouds in neighboring regions.

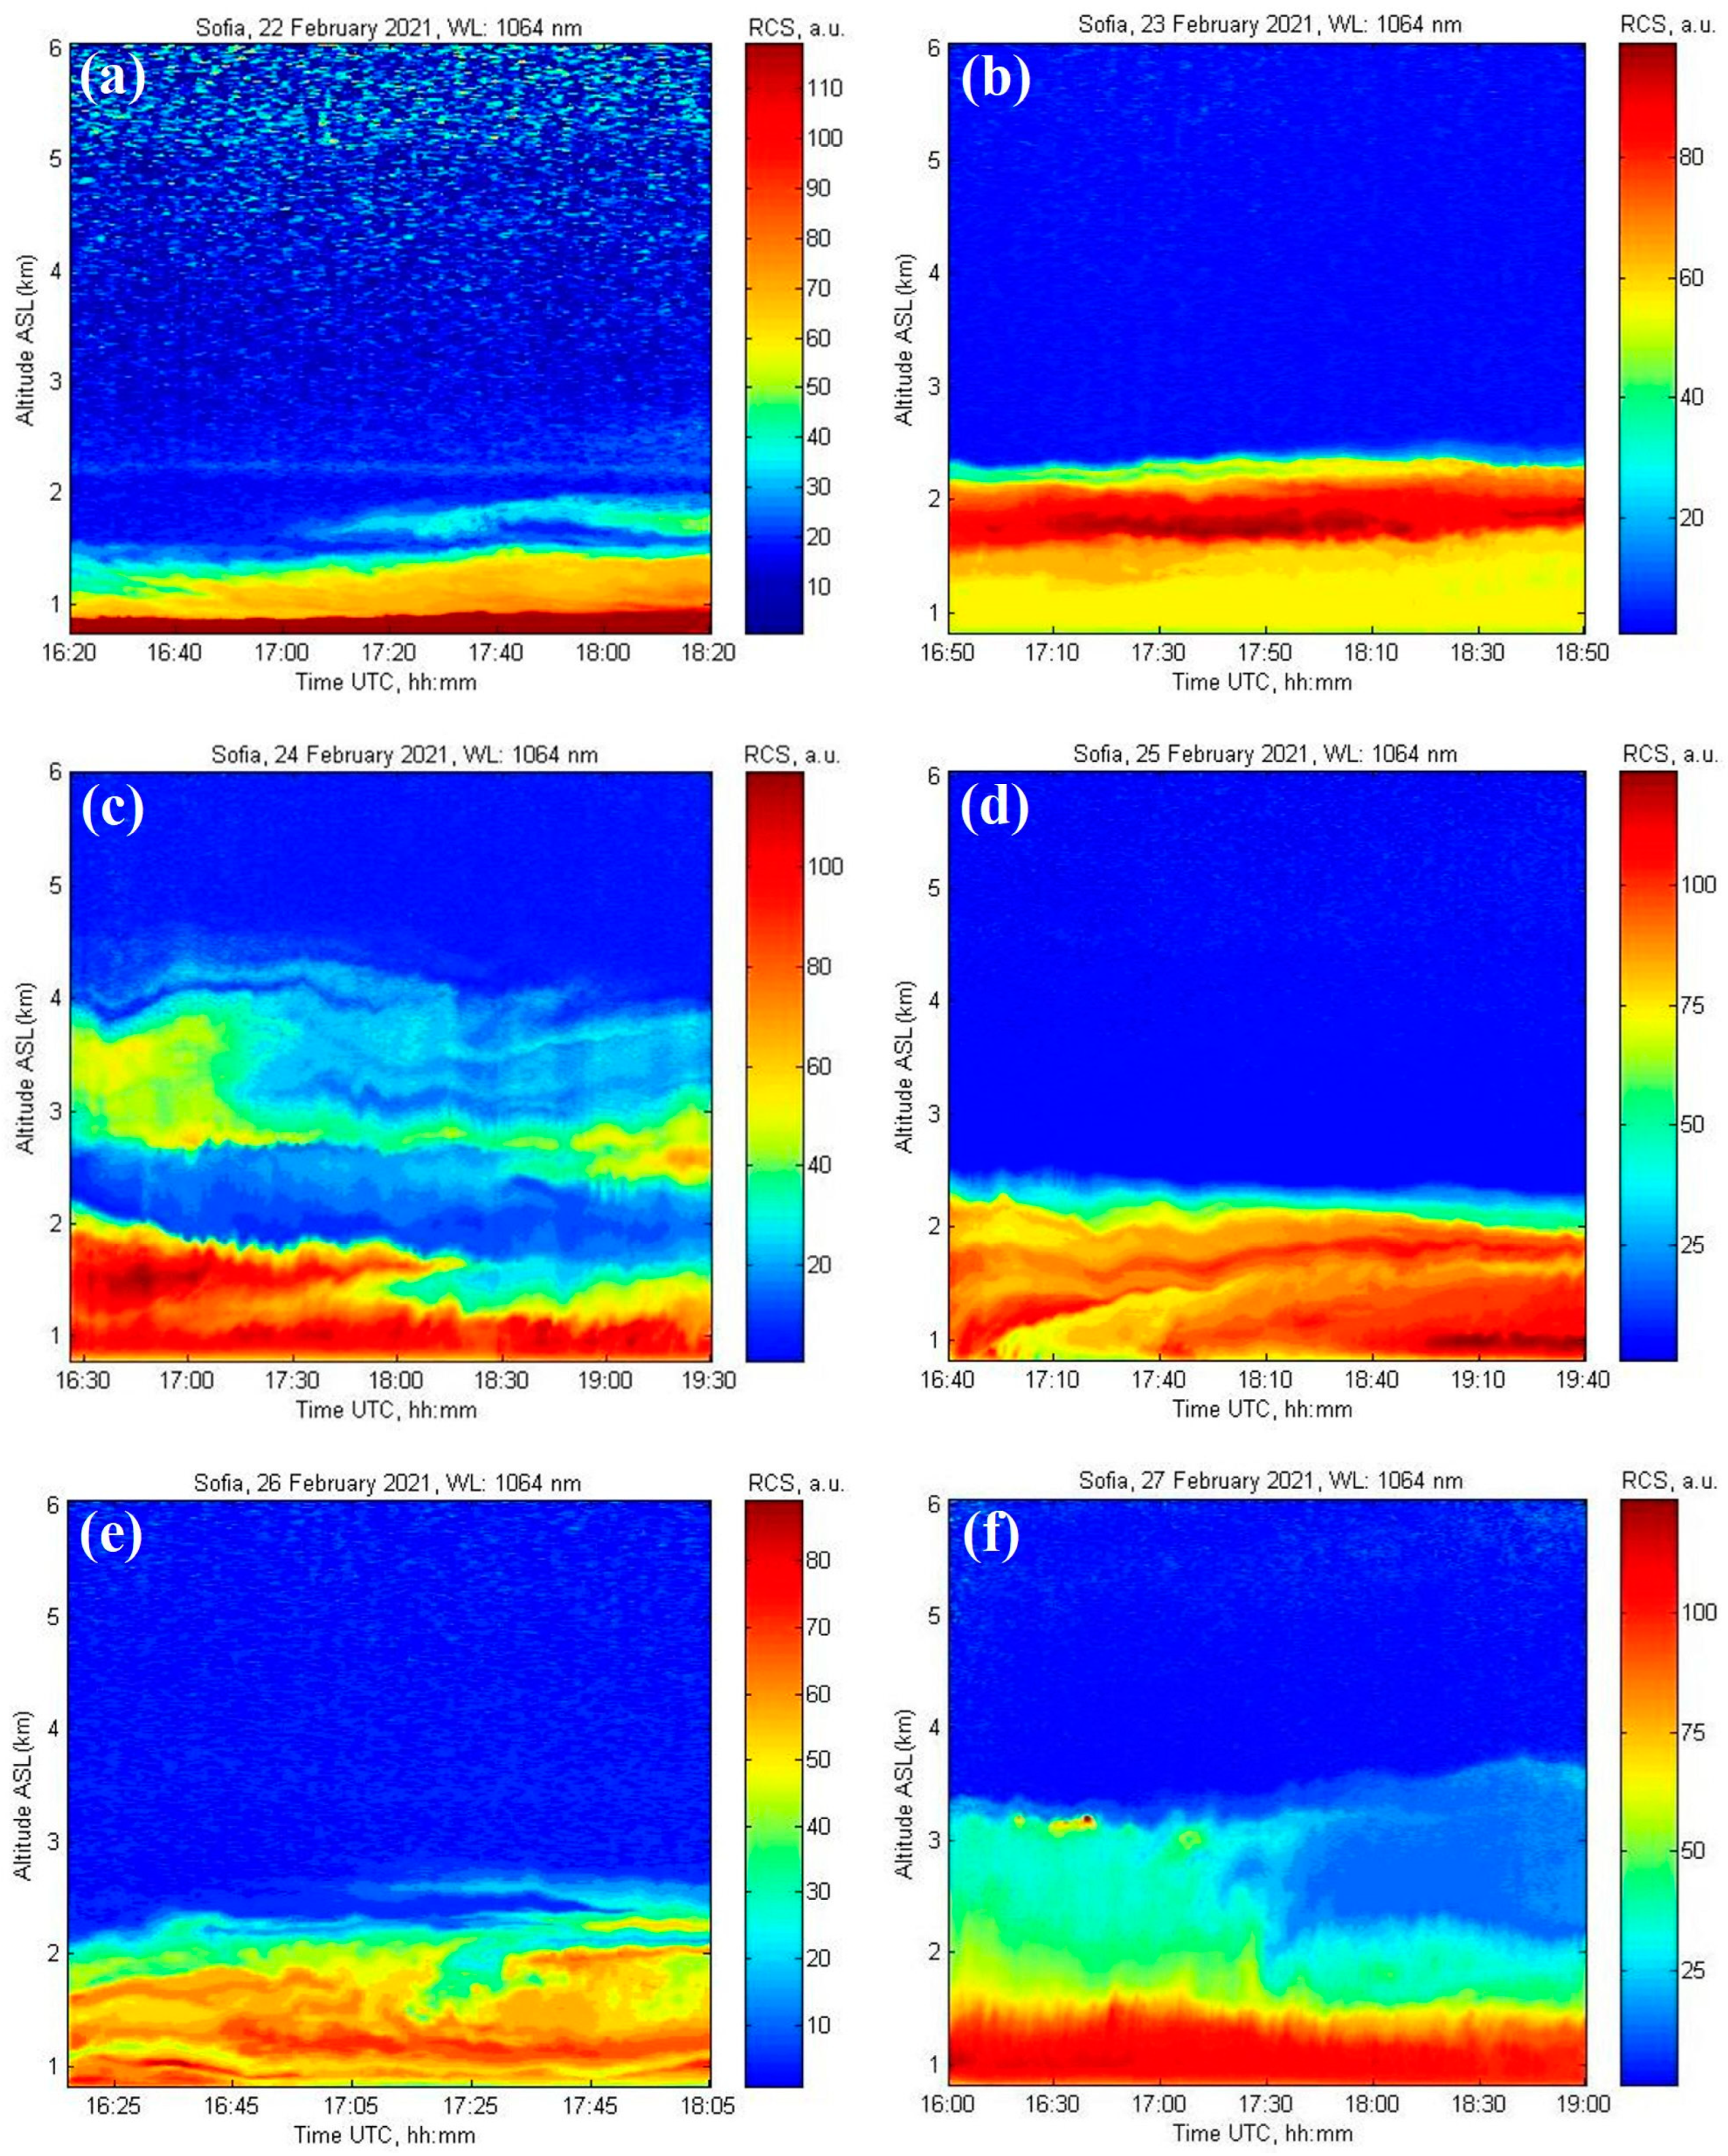
3.2.2. Dust Height Distribution and Dynamics

Lidar measurements of atmospheric aerosols and Saharan dust over Sofia were carried out using the lidar aerosol channels operating at 1064 nm and 532 nm within the nighttime interval 16:00–20:00 UTC, 22–27 February 2021.
Figure 7 presents colormaps of the height distribution and dynamics of the detected aerosols obtained as one-minute averaged time series of range-corrected lidar signals. Results are shown for the lidar channel at 1064 nm because of the higher contrast of the aerosol stratification at this wavelength, which is less sensitive to the molecular atmospheric component. All the values of elevation (height or altitude) cited below are as measured ASL.
As a general characteristic of the aerosol distribution observed, the aerosol layers are located entirely in the lower half of the local troposphere (at altitudes up to 5 km), while its upper half is nearly free of aerosols. As the nighttime ABL height above Sofia in winter varies near and slightly above 1 km [112,124], significant amounts of external aerosols are present in the low troposphere over Sofia throughout the period under review. In addition, the normally distinct upper boundary of the local ABL is heavily blurred by the presence of external aerosols.
According to the colormaps in Figure 4, the temporal dynamics of the aerosol density during the measurements on different days varies from weak to significant. At the beginning of the measurement period, loading the lower tropospheric parts with aerosols is still in progress. This is expressed clearly in Figure 7a, where emerging or still weak aerosol layers are visible in the 1.2–2.2 km height range, closely above the ABL. Taking into account the fact that this is the first day of the Saharan dust intrusion over the Sofia area, it can reasonably be assumed that the layers mentioned may contain incoming Saharan dust.
During the following days, aerosols remain predominantly in compact layer configurations of relatively high density at heights below 2.2 km. As an exception, on 24 and 27 February, upper layers with lower density and uneven aerosol distribution are also observed, extending up to and slightly above 4 km.
A characteristic feature of the atmospheric content above Sofia in the period studied is the absence of aerosols, including cirrus clouds, in the high troposphere, above the aerosol layers visible in Figure 7. Together with the aforementioned predominant compactness of those layers, this fact indirectly indicates that the Sofia region was located, albeit on its periphery, in the high atmospheric pressure zone characterizing the interior of the blocking synoptic pattern conditioning the dust episode/event under consideration. This is also consistent with the blurring observed of the local ABL top, influenced by the incoming external-to-the-region, most likely desert, aerosols.

3.2.3. Dust Transport Tracking

Figure 8 presents forecast vertical profiles of up to 12 km of dust concentration in the atmosphere over Sofia for the times closest to those of lidar measurements in the period 22–27 February 2021, as provided by the BSC-DREAM8b model [83,84]. Insets on the diagrams depict groups of three backward trajectories ending above Sofia within the time intervals of measurements on the different days. These trajectories are obtained using the NOAA HYSPLIT model [79,80] and correspond to the characteristic heights of the aerosol layers detected.
The predicted dust-concentration height distribution displayed in Figure 8 is in good day-by-day agreement with that of the aerosol layers detected during the lidar measurements, presented on the colormaps in Figure 7. Combined with the ascertained absence of aerosols upwards, this is a qualitative indication of the possible dominance of mineral dust over other aerosol types in the registered tropospheric layers.
As seen in the insets of Figure 8, all the groups of backward trajectories depicted pass for significant periods of time over large areas of North Africa, primarily over the Western and Northwestern Sahara. They cover territories in Morocco, Western Sahara, Mauritania, Mali, Algeria, Libya, and Tunisia, falling mainly in the cyclonic “trough” of the blocking pattern. Furthermore, the trajectories occur at different altitudes within the Saharan ABL (≤5–6 km). These regions of the Sahara Desert are identified as the dust sources for the considered dust episode also in Refs. [59,121]. The backward trajectories relating to the first two days of lidar measurements, 22 and 23 February (Figure 8a,b), pass mainly over the Northwestern Sahara at altitudes from the middle and upper parts of the desert ABL. For the remaining days of the period in question, 24–27 February (Figure 8c–f), along through the Saharan ABL, the trajectories pass for significant periods of time also in close proximity to the desert surface. Such passages create appropriate conditions for capturing and transporting large dust-size fractions. These features indicate the Saharan origin of the aerosols detected during the lidar observations.
In the lower half of the insets of Figure 8, plots are available of the time evolution of the altitudinal levels of aerosol/dust long-range transport from the dust sources in North Africa to the measurement area in Sofia during the period of interest. According to them, air transport takes place mainly at heights up to 3 km, with a few exceptions up to 4 km, exhibiting a marked trend towards decreasing height with the distance from the source. Considering that the dust sources are mainly located in the left cyclonic zone of low atmospheric pressure (“trough”) of the omega block (Figure 3), and the transport of the dust-carrying air masses is realized mainly through the interior high-pressure zone of the blocking pattern, the air-transport altitudinal characteristics noted above are reasonable.

3.3. Lidar Aerosol/Dust Retrievals and Radiosonde Data

During the dust event, the lidar measurements provided range-resolved data for vertical profiling of essential optical and microphysical characteristics of the detected atmospheric aerosols dominated by Saharan dust. For each of the days of the analyzed dust period, Figure 9 displays triple horizontally stacked graphs containing: retrieved time-averaged height profiles of the aerosol backscattering coefficients at 1064 nm and 532 nm (left-hand graphs); calculated time-averaged profiles of backscatter-related Ångström exponents (middle graphs); and daily profiles of meteorological parameters (temperature, dew point, relative humidity) based on radiosonde measurements and modeling data (right-hand graphs).
The lidar and meteorological profiles are compared to track the impacts of the intrusion of warm, dry air masses from North Africa carrying desert dust on the wintertime atmospheric meteorological characteristics and weather over the Sofia city area. We note that February is one of the coldest months of the year in Bulgaria, with a monthly average normal temperature of 0.6 °C [93].
Temperature (T) and relative humidity (RH) profiles are obtained from daytime radiosonde measurements standardly conducted at 12:00 UTC (solid lines) preceding the lidar measurements by nearly four hours. The radiosonde measurement site is about 300 m from the lidar/sun-photometer station. Modeling profiles of these parameters are also shown, obtained by the READY-Current and Forecast Meteorology model of NOAA ARL [125], for 18:00 UTC falling within the intervals of lidar observations (dashed lines).
The retrieved BSC height profiles are averaged over the full time of lidar measurements for the respective days, which is normally 2 or 3 h, as seen in Figure 7. The error bars shown in Figure 9 represent standard deviations calculated by the built-in lidar software based on the error-propagation theory. In the profile parts with a more significant aerosol load, they vary in the range of 20–30%.
As already commented in Section 3.2.2, the first day of lidar measurements is the first day of intrusion of desert aerosols in the Sofia area. For this reason, the values of the aerosol/dust optical parameters for the day are transient and relatively low. This is also visible on the BSC profile in Figure 9a, except for the narrow, dense layer below 1 km with high BSC values, which is a remnant of a near-ground fog layer observed earlier that day. This is confirmed by the meteorological profiles for the day, which show that the DP and T profiles are in contact near the surface, indicating water condensation conditions.
During the rest of the period considered (23–27 February), in which the dust event manifests itself in its prime, the presence of desert aerosols over the Sofia region is well pronounced. This is characterized by the formation of mainly monolithic, close-to-the-surface layers of Saharan dust up to 2.5 km (Figure 9b,d,e). Additionally, there are layers that extend to higher altitudes, reaching up to 5–6 km (Figure 9c,f).
The maximum BSC values obtained at 1064 nm and 532 nm fall in the range of 1–2.8 Mm−1 sr−1 and 1.4–3.7 Mm−1 sr−1, respectively. They indicate a dust load of moderate to nearly heavy intensity. The corresponding BAE values are quite low in the above-mentioned altitude intervals occupied by aerosol layers, falling in the interval 0.2–0.7. This indicates the prevalence of large aerosols in the supra-micron size range, which is also the typical size range of the Saharan dust particles. At the end of the dust event, the BAE values for the dust layers extending up to 4 km altitude are around 0.8 (Figure 9f), showing the tendency of a gradual decrease in the dominance of desert aerosols. At altitudes above the Saharan layers, the BAE assumes values of 1.2–1.5, typical of background aerosols in the free troposphere (according to the Standard Atmosphere Model [126]). Although the BSC values are very low at these altitudes and the estimation errors reach 50–100%, we include those parts of the BAE profiles in the analysis, since we use the BAE values typical for the background aerosols as reference ones for indirectly validating the BAE values related to the remaining aerosol-rich parts of the profiles.
Other research groups have reported aerosol/dust optical and microphysical parameters, particularly BSC and (B)AE, with value ranges similar to the ones presented above, regarding the same dust episode [59,121].
The radiosonde and model meteorological profiles presented in Figure 9 testify to the significant impact of the warm, dry air masses coming from Africa on important components of the local climate in the Sofia region. During most of the dust event period, the near-surface air temperature remains close to 20 °C, i.e., significantly and continuously exceeding the values typical for February, which are normally around or slightly above 0 °C. At the same time, the RH values measured at the heights of the Saharan dust layers are markedly low—of the order of 10–40%, except for some sections of the profiles on 24 and 25 February (Figure 9c,d), when they reach 70–80%.
Accordingly, the DP profiles remain mostly well separated from the T profiles, except for the two cases mentioned. Thus, it appears that the three targeted meteorological parameters important for the local weather in the Sofia region have been seriously and lastingly influenced by the warm dust-carrying air masses originating from North Africa. A similar significant increase in the near-surface air temperature (up to 18 °C) in the period 24–26 February 2021 was recorded for the Warsaw region, located much further north of Sofia (with climatologically mean values for February of about 0 °C) [121].

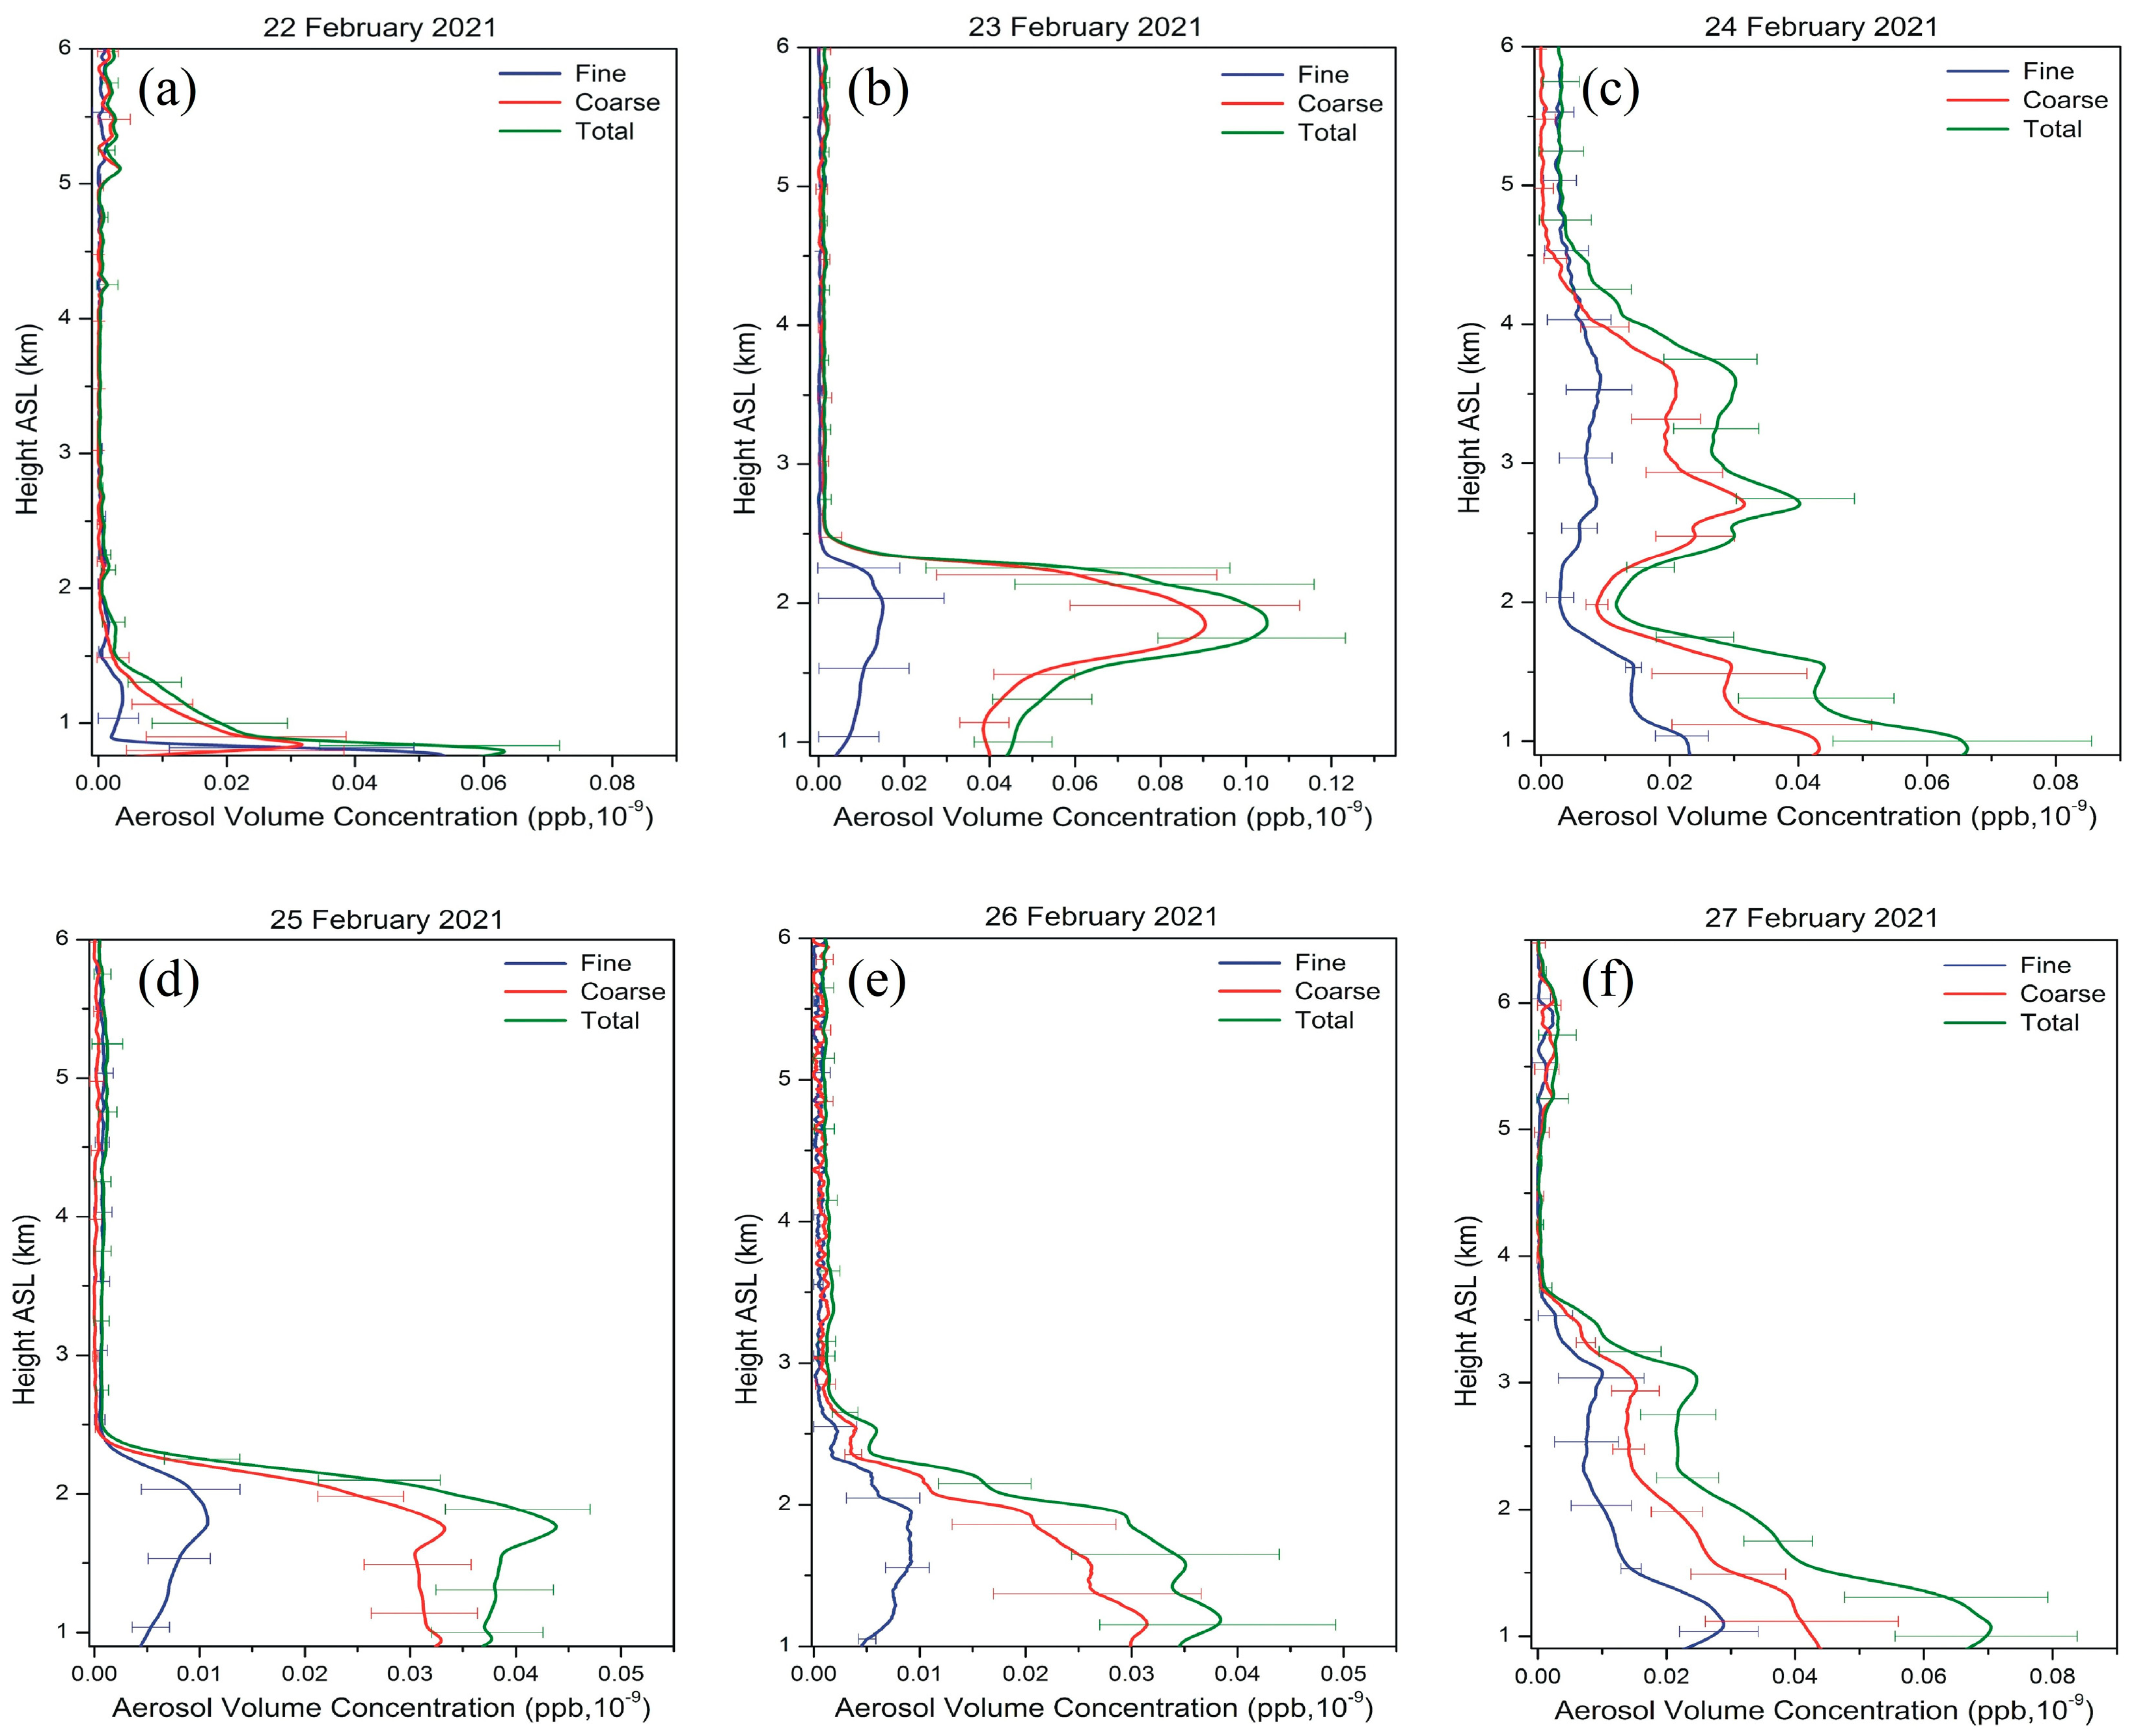
3.4. Profiling Aerosol/Dust Mode Volume Concentration Using LIRIC-2 Inversion Code

The range-resolved profiling of the total and/or size-mode-related aerosol mass/volume concentrations is a powerful tool for characterizing more completely atmospheric aerosols. However, this is a difficult task that challenges the capabilities of the remote and in situ approaches and instruments normally used for aerosol/dust analysis.
In this section, we present results on vertical (height-resolved) profiling of aerosol/dust volume concentrations retrieved from LRS measurements using the LIRIC-2 inversion code synergistically, combining sun-photometric and lidar data.
Sofia_IEBAS AERONET site carried out the full set of direct sun and sky radiance measurements during the dust event. For the period considered, depolarization data from the CALIOP lidar were unavailable due to the absence of suitable passages of the CALIPSO satellite close to Sofia. The lidar system used to carry out the measurements described here does not contain (de)polarization channels. For these reasons, separate volume concentration profiles of spherical and non-spherical modes of coarse aerosols, shown in previous cases [127], were not obtained here and the two-mode (fine and coarse) aerosol model was used for processing the LRS data.
Figure 10 shows vertical profiles of aerosol volume concentrations for the fine and coarse aerosol/dust size modes and the total volume concentrations. The aerosol concentration values are presented in dimensionless units, parts per billion (ppb, 10−9). The error bars in the figure represent standard deviations of the volume concentration values calculated using the program code’s Errors modeling module [70]. It generates the sets of disturbed lidar signals and columnar optical parameters of the aerosol layer in the range of their variations in a specific LRS experiment. Then, it estimates the resulting standard deviations of the volume concentration values.
The characteristic features in the height distribution of the aerosol/dust concentration, which can be distinguished from the profiles presented in Figure 10, are logically similar to those of the BSC profiles shown in Figure 9. However, they reveal significant specificities and distinctive peculiarities arising mainly from the size-mode distributions of aerosol/dust particles.
The comparison of the LIRIC-2 total volume concentration profiles in Figure 10 with the forecast mass concentration profiles of the BSC-DREAM8b model in Figure 8 for the corresponding dates shows good qualitative agreement. The two types of profiles match almost exactly with respect to the altitude ranges in which the aerosols and dust are concentrated. Satisfactorily good agreement is also observed in the general shape and course of the profiles and the heights of their maxima. A distinctive feature of the LIRIC-2 profiles is the higher differentiation in their shapes compared to the shapes of the model ones, which are naturally smoother. In the near-ground part of the profiles for 22 February, at a height of about 1 km ASL, a discrepancy is observed, which is explained by the presence of residual water aerosols from the morning fog on that day, as discussed in Section 3.3.
For comparison, Table 1 lists the height-integrated columnar values of the full volume concentrations of aerosol/dust for the days of the period considered and their fine and coarse fractions according to data from sun-photometric measurements at the Sofia AERONET station. In addition, the columnar volume concentrations of the spherical and non-spherical coarse aerosol sub-fractions are also given in the last two columns of the table.
As the profiles in Figure 10a show, on 22 February, the aerosol concentrations at heights above 1.5 km are very low (≤0.005 ppb), with those of the fine and coarse modes nearly coincident. Below 1.5 km, the coarse-mode aerosol concentration significantly exceeds that of the fine modes, whereas immediately near the surface, the ratio is inverted. These observations are in good agreement with the profiles in Figure 9a, showing still weak transport of Saharan dust and the presence of a near-surface residual fog layer.
During the next days of the dust period (23–27 February), the profiles in Figure 10b–f exhibit total peak volume aerosol concentrations falling in the range 0.038–0.11 ppb, with the upper limit measured on 23 February at an altitude of 1.84 km. These limits for the coarse and fine particle size modes are 0.03–0.09 ppb and 0.016–0.029 ppb, respectively. As can be concluded from these data, the maximum concentrations of the coarse aerosol/dust fractions are two to three times higher than those of the fine ones. The maximum value of this ratio is above six, as measured on 23 February (Figure 10b) during the initial stage of the dust event, while its minimum value is 1.55 and is measured on 27 February, the event’s last day.
Comparing the profiles of aerosol/dust coarse and fine mode concentrations, one can see that the ratio between them varies within the layers, exhibiting considerable dynamics in the mode concentration vertical distribution over the days of the event. Such a profile comparison related to 25 and 26 February (Figure 10d,e) is particularly revealing of the opposite trends in the size-mode concentration changes in the ABL approaching the surface—an increase in the coarse mode concentrations and a decrease in the fine mode ones. It is worth noting that the course of the BAE profiles below the height of 2.5 km for these two dates (Figure 9d,e) is markedly decreasing, which is in good agreement with the increasing dominance of coarse aerosol modes, as visible on the concentration profiles in Figure 10d,e.
Such a correspondence is also observed for the days when the course of the mode concentration profiles is similar (23, 24, and 27 February), as seen in Figure 10b,c,f. In these cases, the course of the BAE profiles (Figure 9b,c,f) within the near-surface aerosol layers is plateau-like indicating a close-to-constant ratio between the coarse and fine aerosol/dust size fractions. This good agreement between the concentration profiles and the BAE ones supports and indirectly validates the use of BAE for qualitative and semi-quantitative estimations of the dominant aerosol/dust size modes, particularly in cases of the absence of data on the ratio of their concentrations [36,98].
While the concentration profiles in Figure 10 show height-resolved ratios between the coarse and fine aerosol/dust size modes, the columnar data in Table 1 give their overall quantitative ratios.
The total aerosol/dust columnar concentration varies from its minimum value of 0.034 μm3/μm2 measured on the first day of the event (22 February) to its maximum of 0.138 μm3/μm2 reached on 24 February, with an average value of 0.09 μm3/μm2.
The fine-mode columnar concentration remains low throughout the period, being in the range of 0.015–0.054 μm3/μm2, with a median value of 0.02 μm3/μm2. In contrast, the coarse-mode concentration remains much higher, varying in the range 0.015–0.106 μm3/μm2, with a median value of 0.063 μm3/μm2, which is more than three times greater than that of the fine modes. Furthermore, on 23 February, the excess increases more than fivefold.
Comparing the last two columns of Table 1, it becomes clear that in the period 23–25 February, the spherical coarse-modes’ columnar concentrations do not exceed 10% of those of the non-spherical ones, while on 23 February, this part is below 1%. In the last two days of the period, that percentage rises to 33%.
The high ratios obtained between the columnar aerosol coarse-mode concentrations and the fine-mode ones and between the concentrations of non-spherical and spherical coarse modes are typical of Saharan dust. This provides evidence of its dominance over the local aerosols during most of the dust-event period.

3.5. AERONET Data and Retrievals

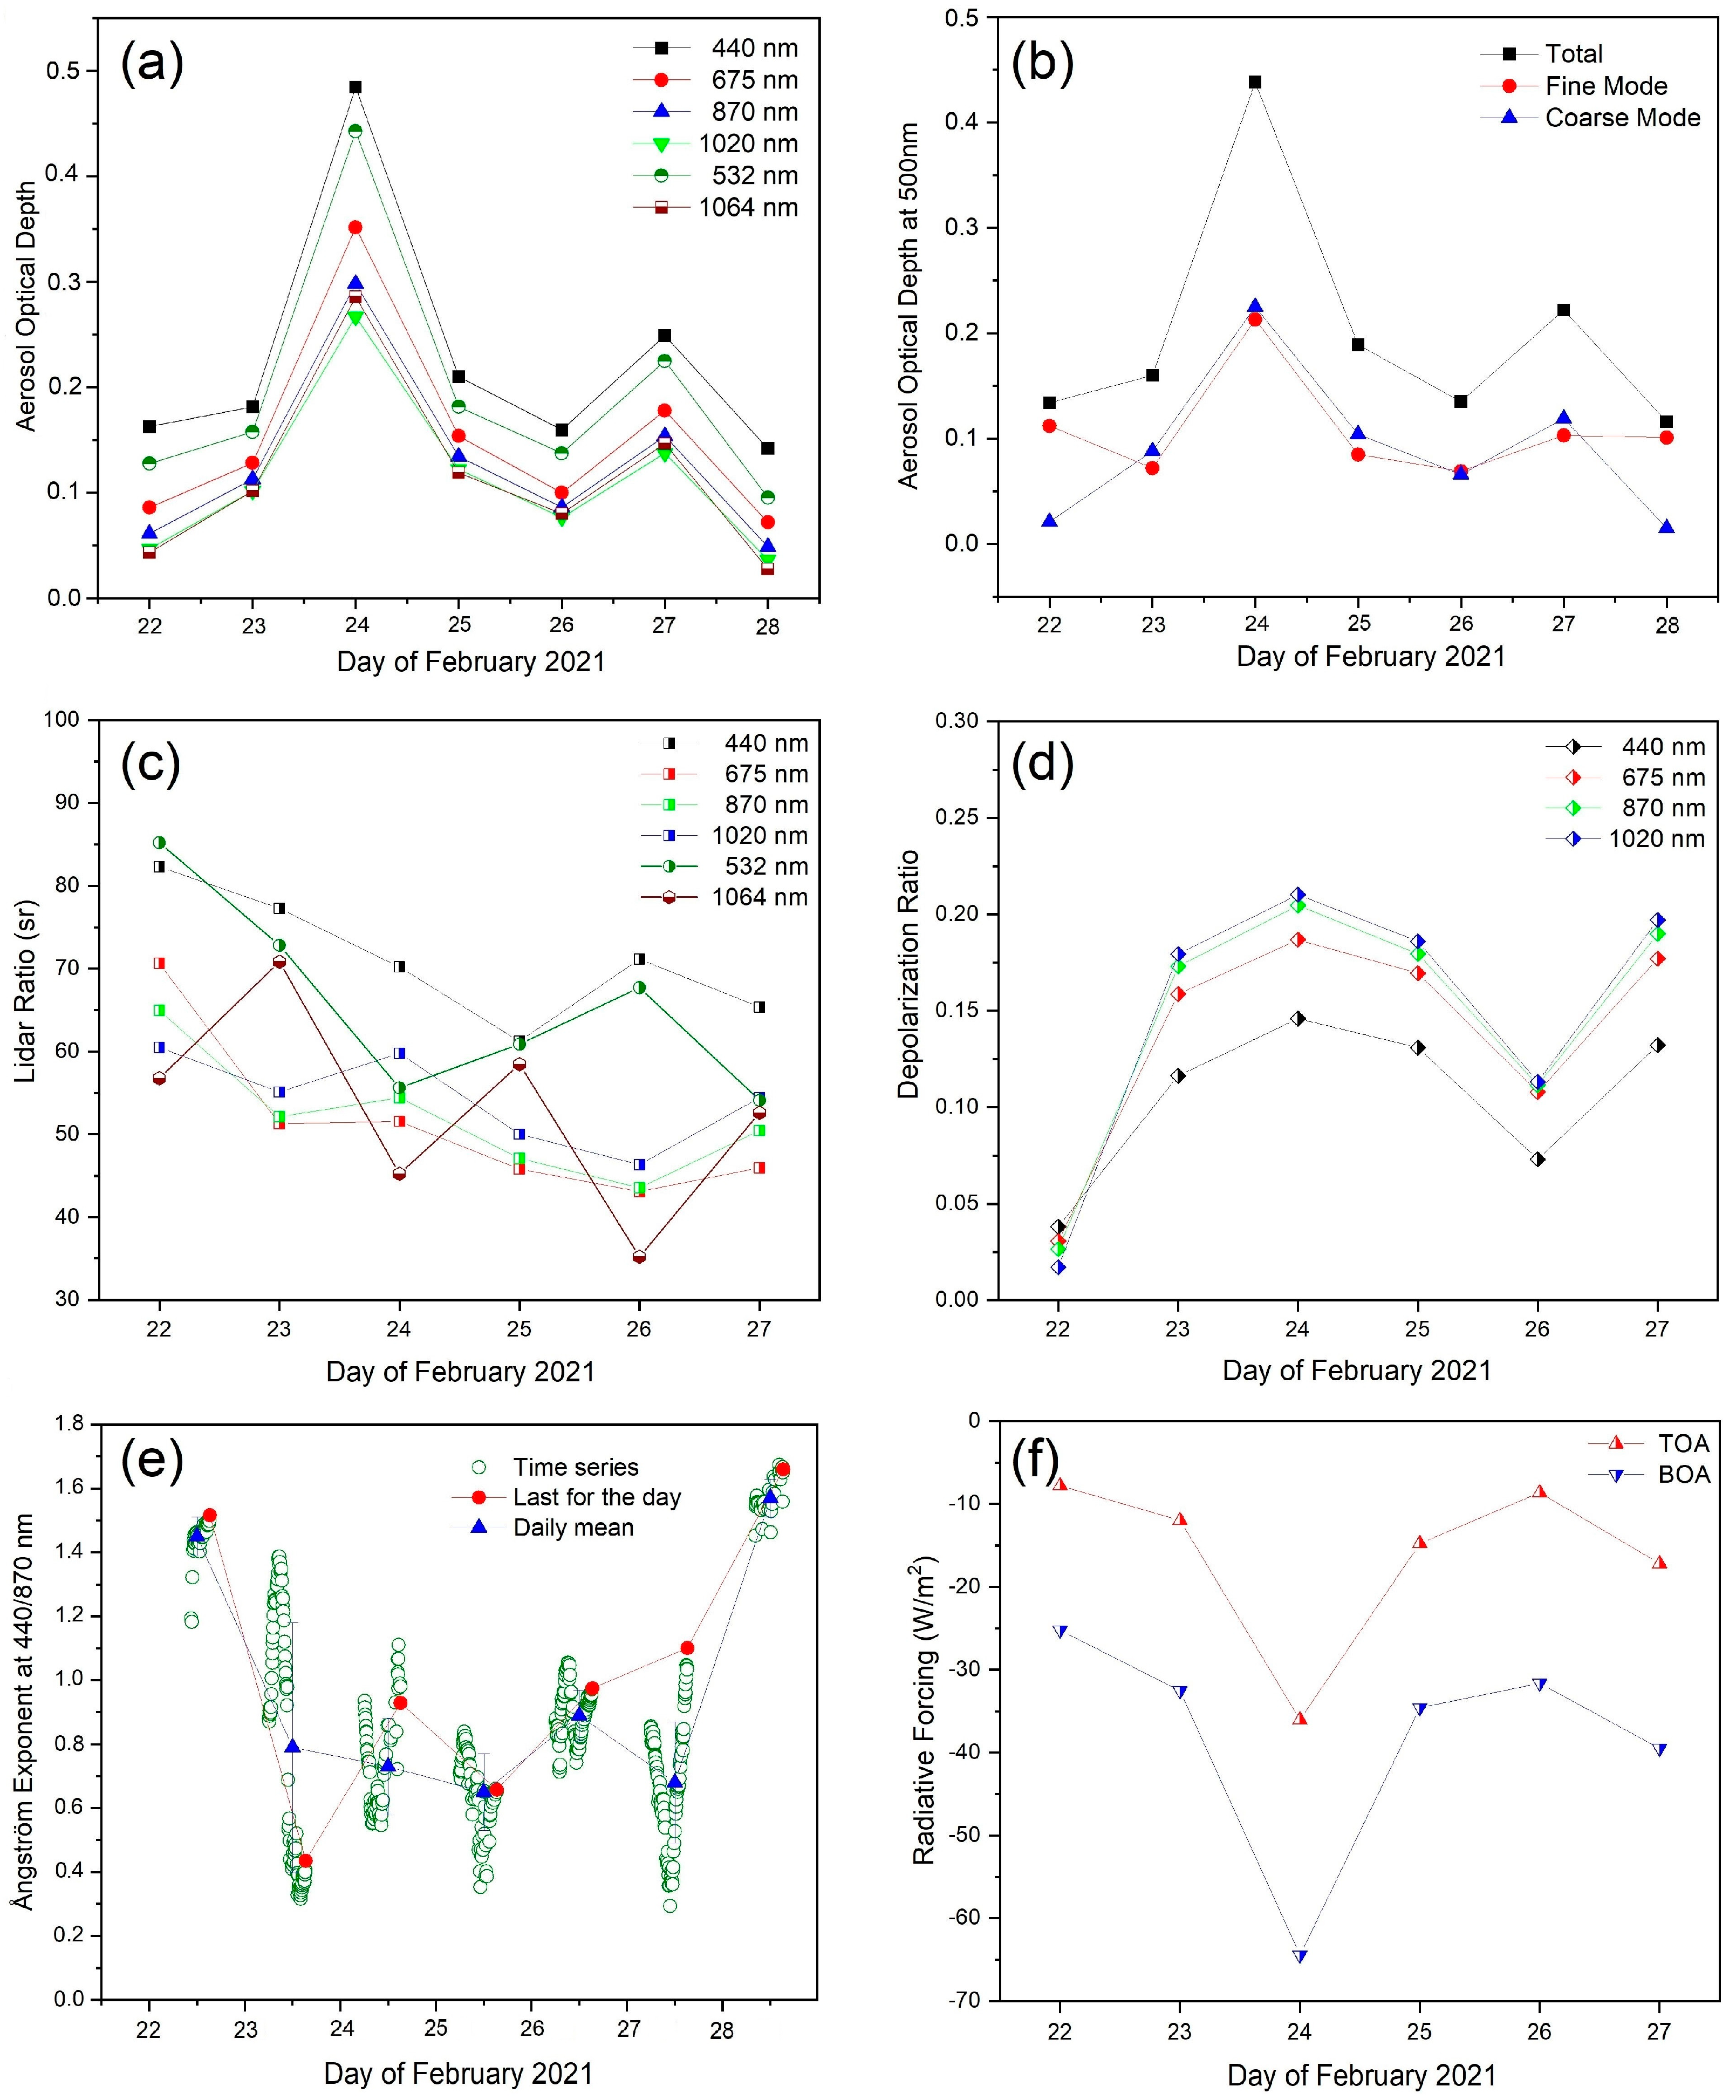
3.5.1. Basic Aerosol/Dust Properties

The wide variety of columnar aerosol properties determined by sun-photometric measurements makes the data from such measurements significant for aerosol/dust characterization. Furthermore, by combining them with lidar and modeling data within the approaches used, one can achieve a synergistic effect.
The data presented here are AERONET Version 3 Level 1.5 products representing data that are automatically cloud-screened and quality-controlled for instrument anomalies in near real-time. Detailed information on the AERONET Version 3 direct measurement data and inversion products can be found in [108,109,128].
We consider and analyze the following sun-photometer aerosol parameters: AOD at some of the available wavelengths; AE at the wavelength pair 440/870 nm obtained from direct measurements; fine and coarse mode AOD at wavelength 500 nm obtained from SDA; and the inversion parameters LR, DR, and RF. In addition, aerosol PSD is also analyzed. The AOD data at 532 and 1064 nm are obtained using LIRIC interpolation procedures [70,115]. The LR data at 532 and 1064 nm result from interpolation procedures, representing the last daily measurements, which are closest in time to the corresponding lidar measurements for the dates in question [129]. They fall in the time interval 14:00–15:00 UTC, whereas the related lidar measurements are conducted in the interval 16:00–19:40 UTC. These data are used for normalization purposes in the quantitative calibration of lidar backscatter profiles in the framework of the combined aerosol characterization approach used here.
Figure 11 presents diagrams of the daily mean values of the above aerosol characteristics obtained by sun-photometer data provided by the Sofia_IEBAS AERONET station and those resulting from interpolation procedures for the dust-event period. Figure 11a shows data related to the AOD at the following wavelengths in the visible and near-infrared spectral range: 440, 675, 870, 532, 1020, and 1064 nm. During the first three days of the event (22–24 February), the total AODs at the wavelengths presented increase significantly from values in the range 0.04 (at 1064 nm)–0.16 (at 440 nm) on 22 February to the values between 0.27 and 0.49 reached on 24 February. The latter are the maximal ones for the period considered. A decreasing trend is seen afterward to the minimal AOD values of about 0.03–0.14 obtained on 28 February, except for the secondary maximum observed on 27 February, with values varying in the range of 0.14–0.25. The values measured for the total AOD testify to a dust load of moderate intensity. However, given the winter period, which is normally characterized by weak outbreaks of desert dust from North Africa to the Balkans, the event can be described as a relatively strong one for the season [102].
The total AOD and that of fine and coarse size modes at wavelength 500 nm are presented in Figure 11b. On 22 and 28 February, a strong dominance of the fine aerosol fraction over the coarse one exists. In the prime of the dust event (23 to 27 February), the daily-mean coarse mode AOD slightly predominates. This can also be followed in Table 2, which summarizes the daily mean values of the total, fine, and coarse mode AOD at 500 nm and AE at 440/870 nm, along with their standard deviations.
The relative standard deviations (SD/mean ratio) of the total AOD calculated from the data in Table 2 for the individual days vary by 15–24%. This indicates relatively stable dust loading processes above the measurement area, which aligns with the predominantly stable weather conditions due to the blocking pattern. The results obtained correspond well with the pictures of the aerosol dynamics from the lidar measurements for the respective days presented in Figure 7.
The columnar lidar ratios for the different wavelengths (Figure 11c) show a nearly steady downward trend from values between 57 sr (at 1064 nm) and 85 sr (at 532 nm) at the beginning of the period to values in the range of 46 sr (at 675 nm)–65 sr (at 440 nm) at its end. This is consistent with the progressive dominance of Saharan dust, for which the noted lower LR values are typical.
Starting from values in the range 0.02 (at 1020 nm)–0.04 (at 440 nm) for the day of initial Saharan dust entry (22 February), the particle depolarization ratios (Figure 11d) at the different wavelengths show a substantial increase during the following days. They reach a nearly 3- to 10-fold excess with values of 0.14 (at 440 nm) and 0.21 (at 1020 nm) on 24 February, remaining relatively high throughout the period. This confirms the enhanced concentrations of desert particulate matter, which is of irregular shape producing high values of the depolarization ratio.
Figure 11e presents the Ångström exponent time series, the daily mean, and the last for the day values. The latter are data related to the time intervals closest to those of the lidar measurements. The individual AE values vary between 0.29 and 1.67 during the period. The daily mean AEs, starting from the relatively high value of 1.45 (characteristic of fine aerosols) for the first day of the period, steadily decrease about twofold in the subsequent days, reaching values around 0.7. A value of 0.7 is characteristic of a substantial contribution from a large aerosol fraction primarily composed of Saharan dust.
One of the most important climate-significant integral resultant effects of the aerosol parameter complex discussed above is manifested in the radiative forcing that the aerosol/dust layers cause at the top of the atmosphere (TOA) and its bottom (BOA). Figure 11f displays the time diagram of the TOA and BOA aerosol/dust radiative forcing during the considered dust event. As can be seen, in both cases, a distinct and strongly negative (having a cooling effect) radiative forcing occurs, with values ranging from −6 to −35 W/m2 for TOA and from −25 to −65 W/m2 for BOA, with clearly pronounced peak negative values registered on 24 February. The negative (cooling) effect observed by radiative forcing is in agreement with the other authors’ results for winter events of Saharan dust transport over the northern Mediterranean region [123].

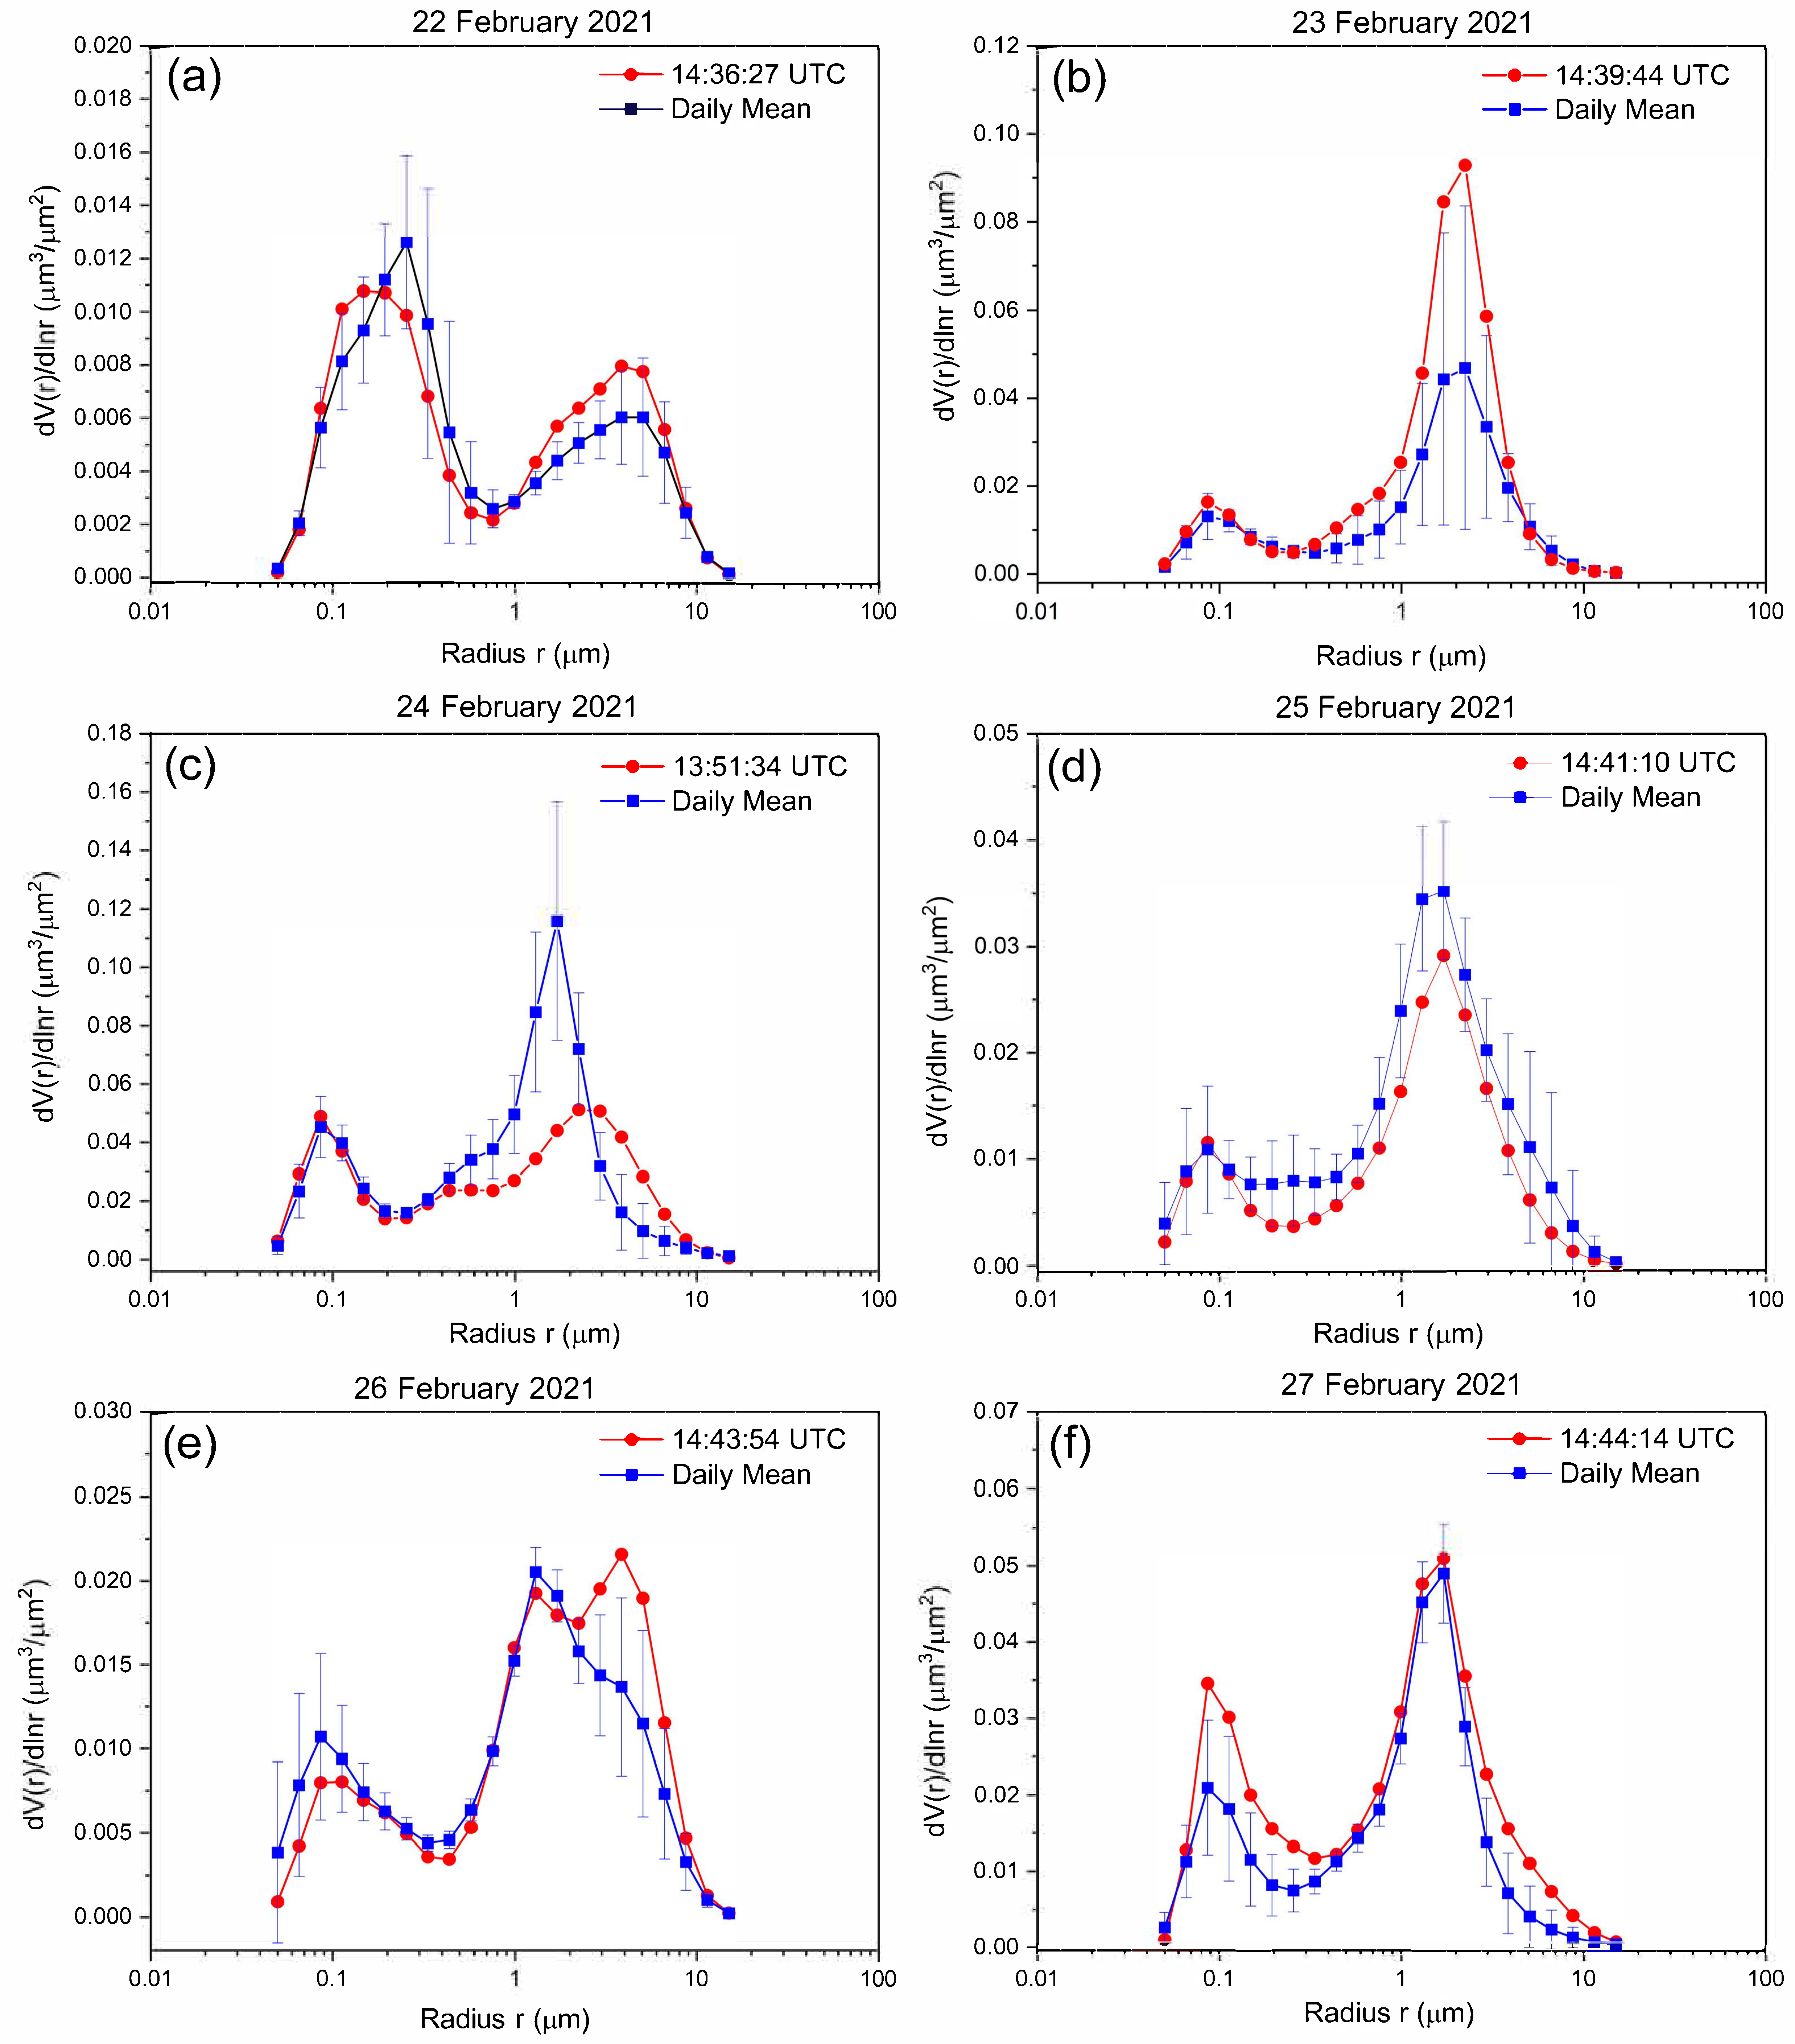
3.5.2. Aerosol/Dust Particle Size Distributions

Saharan dust, by nature, consists mostly of large, irregularly shaped particles [130,131]. For this reason, along with data on the degree of depolarization (depolarization ratio), the volume particle size distribution could be a significant indicator of the presence of desert aerosols and the quantitative ratio of coarse to fine aerosol fractions.
Figure 12 presents the aerosol PSDs for the days of remote and in situ measurements considered here. Daily mean distributions with corresponding error bars and those from the last measurements for the day at the time indicated on the figure panel legends are shown. These last ones are also the closest in time and practically immediately precede the daily lidar measurements. The error bars shown represent the calculated standard deviations with respect to the PSD daily mean. The PSDs displayed exhibit two-peak shapes typical of columnar sun-photometric measurements, with a peak for the fine aerosol size modes occurring around a particle radius of 0.1 μm and that of the coarse fractions distributed over the 1–10 μm size range.
As a general characteristic feature of the PSDs presented resulting from their comparison, on 22 February (Figure 12a), the fine aerosol fractions prevail, with peak values located around 0.1–0.3 μm. However, throughout the rest of the period 23–27 February (Figure 12b–f), coarse fractions dominate, centered mainly around the 2–3 μm size range.
This is consistent with the general course of the dust event, which began on 22 February and developed actively with high intensity during the following days of the period. The inversion of the ratio between the peaks’ intensities of coarse and fine aerosols is most clearly expressed by comparing the PSDs for 22 and 23 February, changing from about 0.4 (Figure 12a) to 2 (Figure 12b) for the mean PSD and up to nearly 5 for the last one of the day. It is in good agreement with the strong density increase in the dust layer located at a height of about 2 km visible in Figure 7a,b for these two days, as well as with the steep increase in the PM10 concentration on 23 February (see Figure 13 below). The distinct increase in the aerosol DR from about 0.025 on 22 February to about 0.15 on 23 February (Figure 11d) shows that the highly dominant coarse aerosols are also irregular in shape, supporting their identification as predominantly Saharan dust. PSDs very close to those shown in Figure 12 were reported for the same period and dust episode by AERONET data for Northeastern Europe (Warsaw) [121].

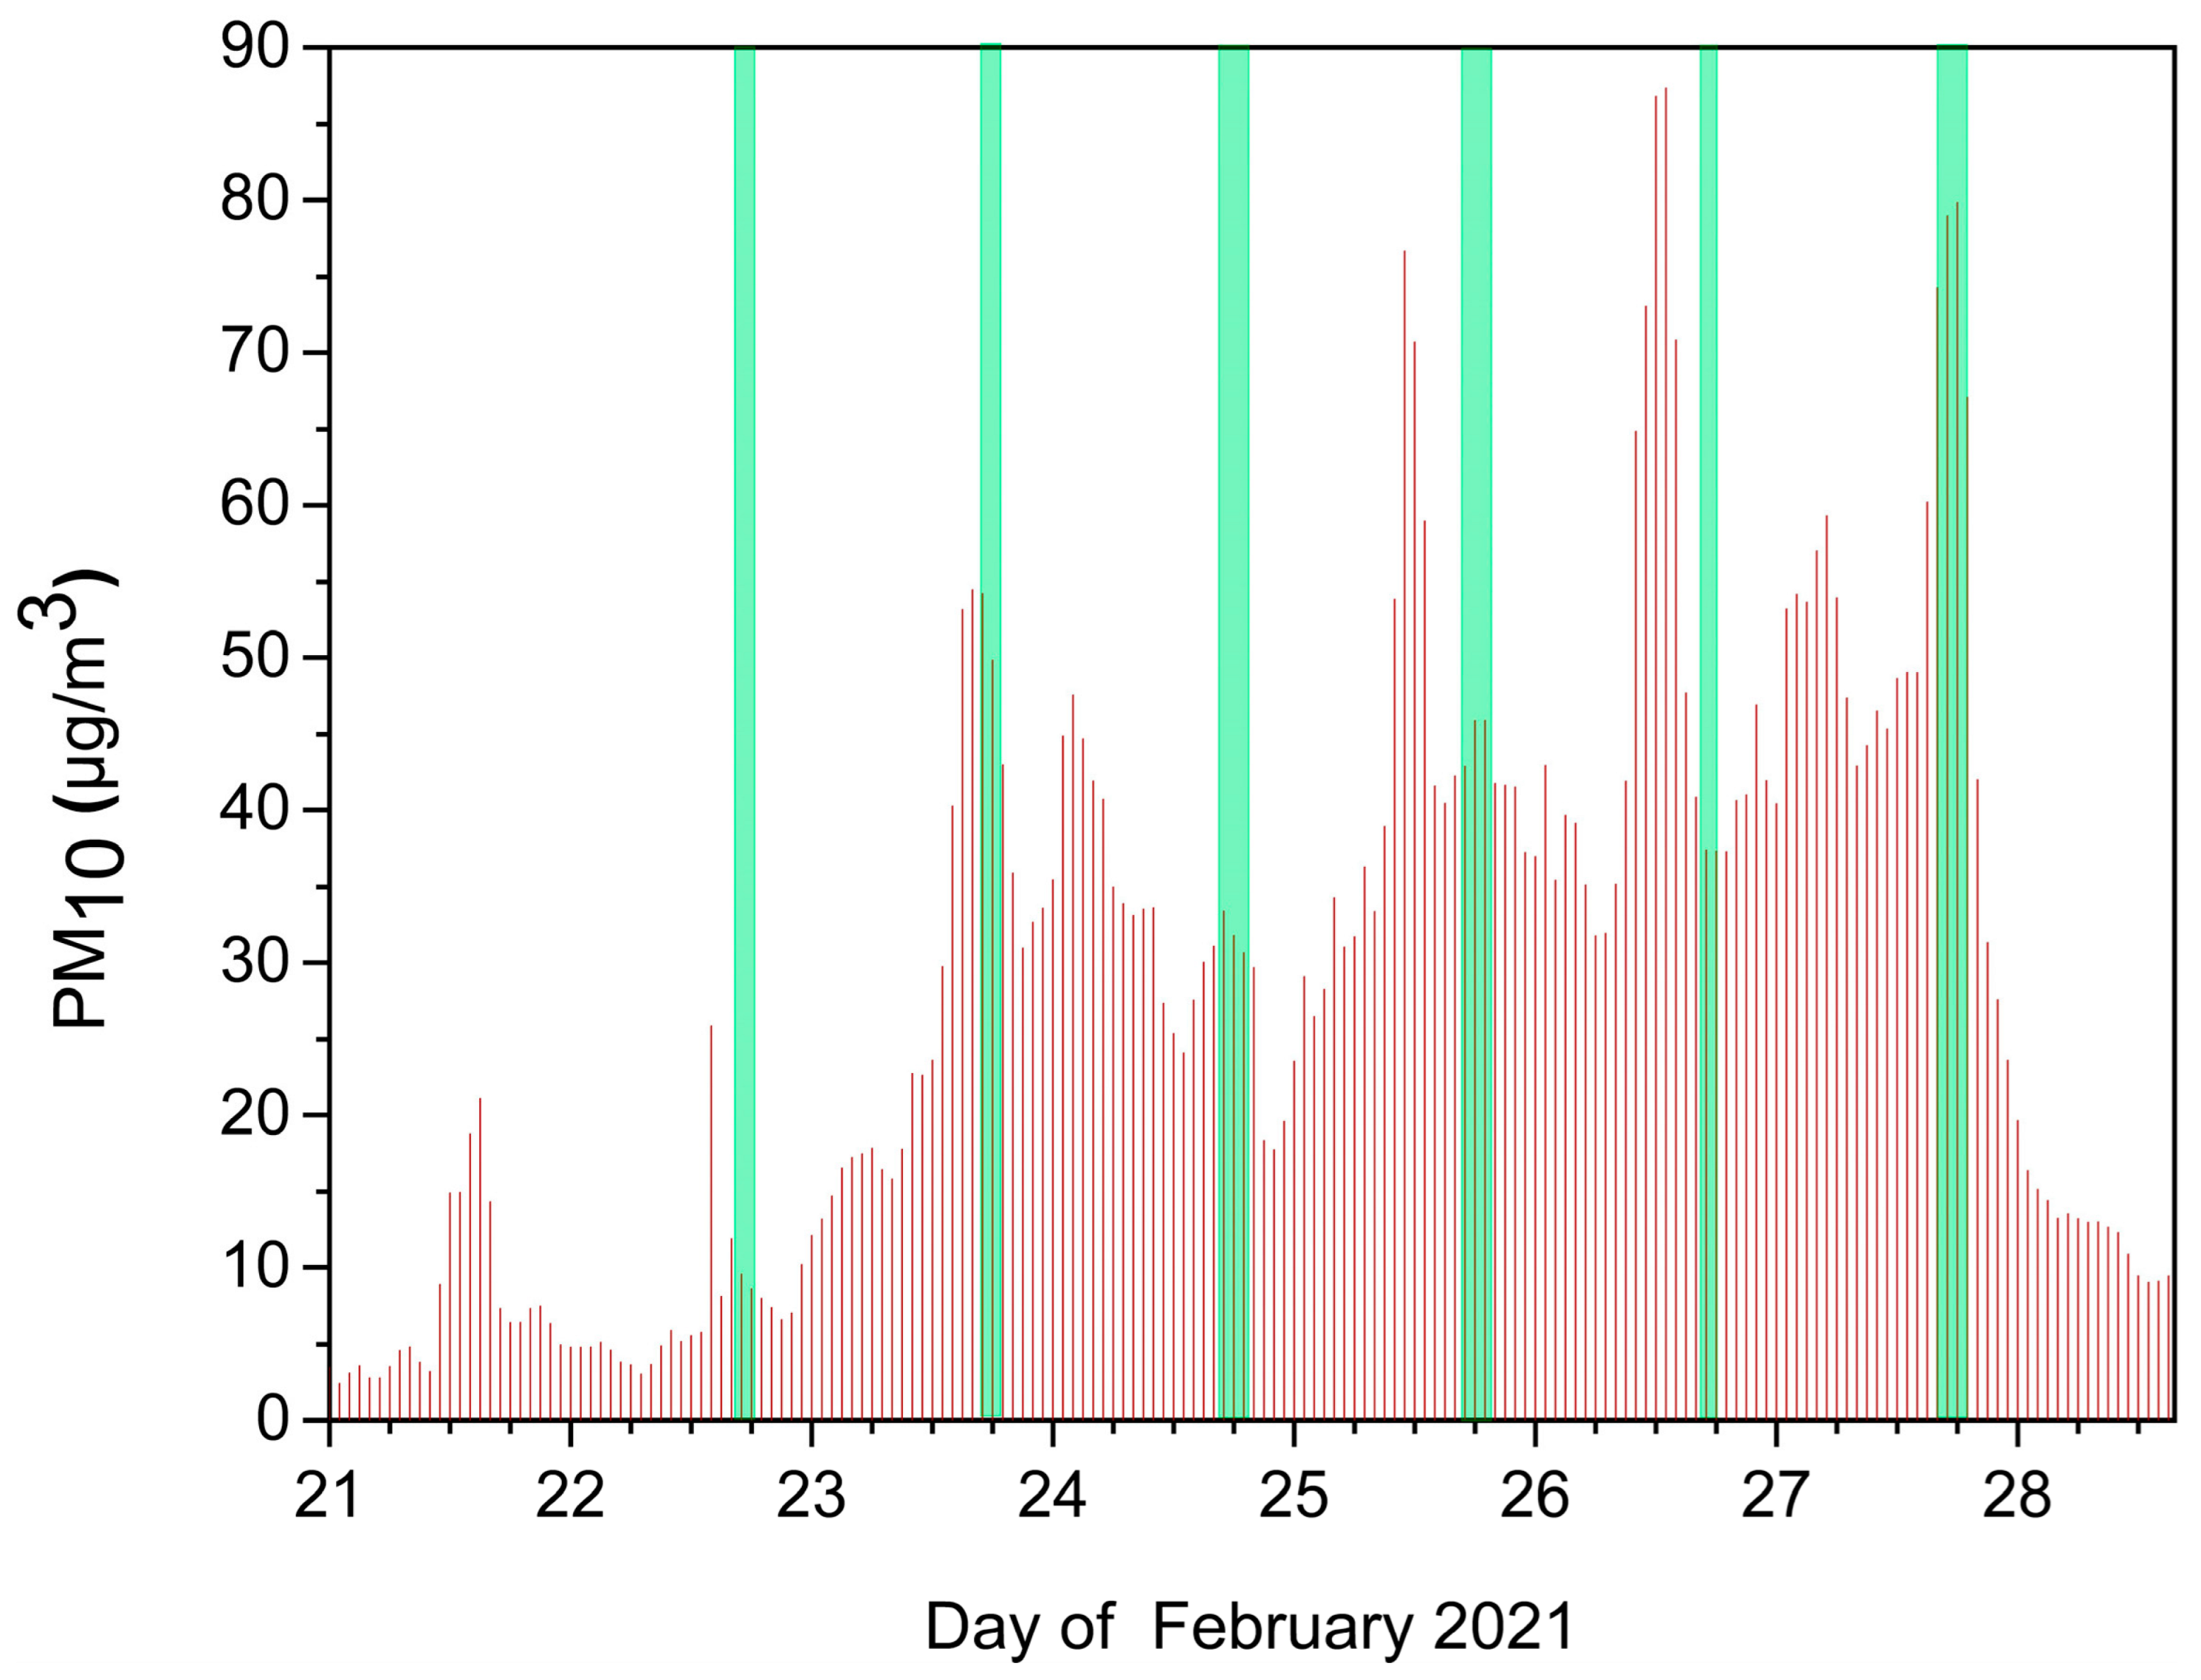
3.6. In Situ PM10 Concentration Measurements

Figure 13 presents the hourly mean values of the PM10 mass concentrations measured by the Kopitoto AMS reference rural station (BG0070A) in the periods of Saharan dust intrusions over Sofia analyzed in the work.
Figure 13. Hourly mean values of the PM10 mass concentrations (red lines) measured by the Kopitoto AMS (BG0070A) in the periods of Saharan dust intrusions over Sofia from 21–28 February 2021. The green stripes mark the intervals of lidar measurements.
Remotesensing 15 03833 g013
The low values of the PM10 mass concentration of about 5–10 μg/m3 measured at the very beginning of the period are typical for the Kopitoto AMS in the absence of incoming external aerosols, as the station is located near the top of the local winter ABL. As shown in Figure 13, during the dust event period over Sofia, 22–27 February, in which the lidar and radiometric observations analyzed here are conducted, the measured concentrations of PM10 particulate matter exhibit a significant and stable increase with an average value of 31.5 μg/m3 (SD = 17.5), and peak values reaching about 80 μg/m3. At the end of the period, on 28 February, the PM10 mass concentrations return to the usual station values of 5–10 μg/m3. A daily evolution of the PM10 concentrations with a course and values close to the ones displayed in Figure 13 was registered in the southeast of the Iberian Peninsula from 15–21 February 2021 [119]. Due to the proximity of that area to North Africa, the dust plume passed over it for several days before reaching Sofia, so the comparison is considered correct.
Bearing in mind the positions of the intervals of lidar measurements (green stripes) with respect to the total course of in situ measurements, it is clear that the lidar measurements on 22, 23, and 27 February are conducted during periods of maximum aerosol concentration for the day. Conversely, the lidar measurements on 24, 25, and 26 February are related to periods with PM10 mass concentration values close to the daily average. Based on the temporal coincidence of the periods of high PM10 values measured by the Kopitoto AMS with the time period of the dust event and taking into account the fact that the lidar detected no other aloft aerosol layers, it can be concluded that the increased PM10 concentrations presented in Figure 13 are most probably due to desert aerosols brought from North Africa. This means that the in situ data obtained can be used for a direct comparison with the predicted model dust concentrations for the height of the station, as well as to serve for quantitative calibration of data resulting from lidar measurements [36].
The day-by-day comparison of the mass concentration values measured by Kopitoto AMS around 18:00 UTC with the estimated values of the BSC-DREAM8b model for the station’s height shows good agreement in their course (increase–decrease) for the greater part of the period, except for 27 February. However, the in situ mass concentration values measured for the second half of the period are persistently higher (about 1.5–2 times) than those predicted by the model; on the last day, the excess reaches a maximum (nearly 5 times). The HYSPLIT backward trajectory analysis for Kopitoto AMS (not presented in the paper) shows that in the first half of the event (22–24 February), the registered aerosols are mainly Saharan dust, while in the second half (25–27 February) there is also a contribution of continental and marine aerosols, mostly on 27 February. This explains the discrepancy between the in situ and the above modeling data. The backward trajectories ending above the lidar/sun-photometer station at heights close to that of Kopitoto AMS indicate a possible limited presence of continental and marine aerosols on 25 and 27 February.

4. Conclusions

The paper provides a substantial set of representative observational data (remote, in situ, modeling/forecasting, reanalysis) concerning the intensity, dynamics, and characteristics of a specific wintertime Saharan dust load event that took place over Sofia, Bulgaria, in the period 22–27 February 2021. It resulted from the atypical long-range transport of desert particulate matter to the region of the Eastern Balkans. It was part of and manifested in a large-scale dust episode covering vast areas, including North Africa, the Mediterranean, and Europe.
The driving mechanism conditioning this Saharan dust episode is the formed synoptic-scale blocking weather pattern of evolving type centered over the Central-to-East Mediterranean and characterized by strong meridional components of the air circulations, as proven by the implemented NCEP/NCAR reanalysis. The most likely premise and reason for its formation is a large single Rossby wave that formed in the Northern Hemisphere Polar jet-stream projected down to domains in the low troposphere. The predominant part of the vast blocking pattern interior, including the Sofia region, is an area of sustained high atmospheric pressure, providing clear skies and stable cloudless conditions favorable for conducting remote measurements of atmospheric aerosols.
During the dust episode, a significant heat transfer from North Africa to the Mediterranean and Europe is ascertained in the lower troposphere, seriously perturbing the seasonal (wintertime) thermal regime over the affected areas. Zones at middle latitudes with traditionally low seasonal temperatures are subjected to positive composite temperature anomalies reaching +10–15 °C, while those south of them, with typically higher seasonal temperatures (e.g., North Africa), undergo mainly negative temperature anomalies reaching −(10–12) °C.
Based on the transport history of the recorded aerosol layers (mainly by HYSPLIT backward trajectories), the identified sources of the desert dust reaching the measurement site in the study period are large areas of North–Western Africa falling mainly in the cyclonic “trough” of the blocking pattern. Desert aerosols are captured at different altitudes within the Saharan ABL (mainly fine-size fractions) and in the immediate vicinity of the desert surface (predominantly coarse-size fractions).
The dust spread mapping (using SKIRON dust-load maps and MODIS-Terra images) reveals a specific and unusual picture of the dust event studied, according to which the dust-containing warm desert air masses occur and enter the wintertime atmosphere over Bulgaria and Sofia mainly from the north–northwest, in contrast to the normal for the region entry from the south–southwest. We associate this uncommon movement and intrusion of desert aerosols into the Sofia region with the specific arc-shaped air circulation formed by the synoptic blocking pattern.
The warm and dry desert air masses have a strong impact on important components of the wintertime local weather in the Sofia region, as shown by meteorological radiosonde measurements and model estimates (unusually high for the season near-surface air temperatures of about 20 °C and markedly low relative humidity values of 10–40%). A serious overall effect is also ascertained on the aerosol composition, vertical stratification, and radiative forcing properties of the local troposphere.
The lidar measurements show that: (a) the aerosol layers are located entirely in the lower half of the local troposphere (at altitudes up to 5 km), in nearly compact configurations, superimposed on and mixed with the local ABL, while its upper half remains nearly free of aerosols; (b) the aerosol temporal dynamics is weak to moderate; (c) the maximum BSC values obtained at 1064 nm and 532 nm fall in the range of 1–2.8 Mm−1 sr−1 and 1.4–3.7 Mm−1 sr−1, respectively, denoting a dust load of moderate to nearly heavy intensity; (d) the BAE values falling in the interval 0.2–0.7 are quite low indicating the dominance of large aerosols in the supra-micron size range, typical of the Saharan dust particles.
The height-resolved profiling of the aerosol/dust modal (fine, coarse) and total volume concentration obtained using the LIRIC-2 inversion code represents an important achievement of the work. In addition to the quantitative characterization of the aerosol concentration, it also reveals the dynamics of the height distribution of the fine and coarse aerosol modes and their ratios. The retrieved volume concentration profiles correlate well with the dust mass concentration ones provided by the BSC-DREAM8b model. They are also in good agreement with the BAE profiles derived from lidar measurements, which indirectly validates the use of BAE for qualitative and semi-quantitative estimations of the dominant aerosol/dust size modes.
The wide variety of columnal aerosol parameters derived from AERONET sun-photometer data show good consistency with the overall pattern of the considered dust event and the lidar, LIRIC-2, and in situ data. The key aerosol parameters and their variations during the event are as follows: (a) AODs varying from 0.03 (at 1064 nm) to 0.16 (at 440 nm) in the beginning and the end of the event, reaching values of 0.27 and 0.49 during its prime; (b) DRs reaching values of 0.14 (at 440 nm) and 0.21 (at 1020 nm) in the middle of the period; (c) AE (at the wavelength pair 440/870 nm) decreasing from about 1.45 to 0.7; TOA/BOA RF exhibiting negative values going down to −35/−65 W/m2; (d) PSDs showing coarse-to-fine-mode ratios from about 0.5 at the beginning and reaching inverted values of 3 to 5 during the period of question. The overall behavior of the listed aerosol characteristics indicates that irregularly shaped large and very large particle size fractions prevail, indirectly proving the dominance of the Saharan dust over other aerosol types.
Based on the increased PM10 concentration values measured by the elevated rural Kopitoto AMS, which correlate well with the course of the studied dust event over Sofia, it can be concluded that the station provides representative qualitative and quantitative information about aerosols external to the region, in particular Saharan dust. Such data could be useful for validating and/or calibrating lidar and photometric data and for proper evaluative comparison to modeling/forecasting ones.
The productive complementarity and interrelationships between the data from various instruments and approaches contribute to adequate referencing and calibration of measurement data and profiling the aerosol/dust optical and microphysical parameters and mass concentration, leading to a more reliable and complete characterization of desert aerosols. The results obtained are in good agreement with the results of other studies related to the same dust episode.

Author Contributions

Conceptualization, Z.P. and T.D.; methodology, Z.P., T.D. and A.C.; software, V.P. and A.C.; investigation, Z.P., A.D., T.E., L.V., T.D., A.C. and V.P.; writing—original draft preparation, Z.P., T.E. and T.D.; writing—review and editing, Z.P., T.D., A.C., T.E. and A.D.; visualization, L.V., Z.P., T.E. and T.D.; project administration, T.D. and Z.P.; funding acquisition, T.D. and Z.P. All authors have read and agreed to the published version of the manuscript.

Funding

This research was funded by the Ministry of Education and Science of Bulgaria (support for ACTRIS BG, part of the Bulgarian National Roadmap for Research Infrastructure), by the Bulgarian National Science Fund (Grant No. KP-06-N28/10/2018), and by the European Commission under the Horizon 2020—Research and Innovation Framework Program, Grant Agreement No. 871115 (ACTRIS IMP). A.C. and V.P. acknowledge funding by the Belarusian Republican Foundation for Fundamental Research under grant No. F22KI-035.

Data Availability Statement

The lidar measurement and analysis data presented in this study are available upon request from the authors. The data products of the CE318-TS9 sun-photometer observations at the Sofia_IEBAS Site are available via the AERONET portal, https://aeronet.gsfc.nasa.gov/ (accessed on 27 May 2021). In situ, modeling/forecasting, and satellite data are publicly available from the corresponding web resources cited in the paper.

Acknowledgments

The authors acknowledge AERONET-Europe (CARS-ASP-CNRS) for providing calibration services. AERONET-Europe is part of the ACTRIS-IMP project that received funding from the European Union (H2020-INFRADEV-2018-2020) under Grant Agreement No. 871115. The authors also acknowledge the images from the BSC-DREAM8b model operated by the Barcelona Supercomputing Center and from the SKIRON model operated by the University of Athens, the NCEP Reanalysis images provided by the NOAA/ESRL Physical Sciences Laboratory, Boulder, CO, USA, from their website at http://psl.noaa.gov/ (accessed on 22 July 2021), the use of imagery from the NASA Worldview application (https://worldview.earthdata.nasa.gov/ (accessed on 25 May 2021), part of the NASA Earth Observing System Data and Information System (EOSDIS), and the NOAA ARL for the provision of the HYSPLIT transport and dispersion model and the READY website used in this publication.

Conflicts of Interest

The authors declare no conflict of interest.

References

  1. Middleton, N.J.; Goudie, A.S. Saharan Dust: Sources and Trajectories. Trans. Inst. Brit. Geogr. 2002, 26, 165–181. [Google Scholar] [CrossRef]
  2. Prospero, J.M.; Ginoux, P.; Torres, O.; Nicholson, S.E.; Gill, T.E. Environmental characterization of global sources of atmospheric soil dust identified with the Nimbus 7 Total Ozone Mapping Spectrometer (TOMS) absorbing aerosol products. Rev. Geophys. 2002, 40, 1002. [Google Scholar] [CrossRef]
  3. Washington, R.; Todd, M.C.; Middleton, N.J.; Goudie, A.S. Dust-storm source areas determined by the total ozone monitoring spectrometer and surface observations. Ann. Assoc. Am. Geogr. 2003, 93, 297–313. [Google Scholar] [CrossRef]
  4. Tanaka, T.Y.; Chiba, M. A numerical study of the contributions of dust source regions to the global dust budget. Glob. Planet. Chang. 2006, 52, 88–104. [Google Scholar] [CrossRef]
  5. Engelstaedter, S.; Tegen, I.; Washington, R. North African dust emissions and transport. Earth-Sci. Rev. 2006, 79, 73–100. [Google Scholar] [CrossRef]
  6. Mahowald, N.M.; Baker, A.R.; Bergametti, G.; Brooks, N.; Duce, R.A.; Jickells, T.D.; Kubilay, N.; Prospero, J.M.; Tegen, I. Atmospheric global dust cycle and iron inputs to the ocean. Glob. Biogeochem. Cycles 2005, 19, GB4025. [Google Scholar] [CrossRef]
  7. Shao, Y.; Wyrwoll, K.-H.; Chappell, A.; Huang, J.; Lin, Z.; McTainsh, G.H.; Mikami, M.; Tanaka, T.Y.; Wang, X.; Yoon, S. Dust cycle: An emerging core theme in Earth system science. Aeolian Res. 2011, 2, 181–204. [Google Scholar] [CrossRef]
  8. Kok, J.F.; Adebiyi, A.A.; Albani, S.; Balkanski, Y.; Checa-Garcia, R.; Chin, M.; Colarco, P.R.; Hamilton, D.S.; Huang, Y.; Ito, A.; et al. Improved representation of the global dust cycle using observational constraints on dust properties and abundance. Atmos. Chem. Phys. 2021, 21, 8127–8167. [Google Scholar] [CrossRef]
  9. Asutosh, A.; Vinoj, V.; Murukesh, N.; Ramisetty, R.; Mittal, N. Investigation of June 2020 giant Saharan dust storm using remote sensing observations and model reanalysis. Sci. Rep. 2022, 12, 6114. [Google Scholar] [CrossRef]
  10. Evan, A.; Flamant, C.; Gaetani, M.; Guichard, F. The past, present and future of African dust. Nature 2016, 531, 493–495. [Google Scholar] [CrossRef]
  11. Groß, S.; Gasteiger, J.; Freudenthaler, V.; Müller, T.; Sauer, D.; Toledano, C.; Ansmann, A. Saharan dust contribution to the Caribbean summertime boundary layer—A lidar study during SALTRACE. Atmos. Chem. Phys. 2016, 16, 11535–11546. [Google Scholar] [CrossRef] [Green Version]
  12. Kubilay, N.; Nickovic, S.; Moulin, C.; Dulac, F. An illustration of the transport and deposition of mineral dust onto the eastern Mediterranean. Atmos. Environ. 2000, 34, 1293–1303. [Google Scholar] [CrossRef]
  13. Papayannis, A.; Amiridis, V.; Mona, L.; Tsaknakis, G.; Balis, D.; Bösenberg, J.; Chaikovski, A.; De Tomasi, F.; Grigorov, I.; Mattis, I.; et al. Systematic lidar observations of Saharan dust over Europe in the frame of EARLINET (2000–2002). J. Geophys. Res. 2008, 113, D10204. [Google Scholar] [CrossRef] [Green Version]
  14. Marinou, E.; Amiridis, V.; Binietoglou, I.; Tsikerdekis, A.; Solomos, S.; Proestakis, E.; Konsta, D.; Papagiannopoulos, N.; Tsekeri, A.; Vlastou, G.; et al. Three-dimensional evolution of Saharan dust transport towards Europe based on a 9-year EARLINET-optimized CALIPSO dataset. Atmos. Chem. Phys. 2017, 17, 5893–5919. [Google Scholar] [CrossRef] [Green Version]
  15. Salvador, P.; Pey, J.; Pérez, N.; Querol, X.; Artíñano, B. Increasing atmospheric dust transport towards the western Mediterranean over 1948–2020. NPJ Clim. Atmos. Sci. 2022, 5, 34. [Google Scholar] [CrossRef]
  16. Ansmann, A.; Bösenberg, J.; Chaikovsky, A.; Comerón, A.; Eckhardt, S.; Eixmann, R.; Freudenthaler, V.; Ginoux, P.; Komguem, L.; Linné, H.; et al. Long-range transport of Saharan dust to northern Europe: The 11–16 October 2001 outbreak observed with EARLINET. J. Geophys. Res. 2003, 108, 4783. [Google Scholar] [CrossRef]
  17. Barkan, J.; Alpert, P. Synoptic analysis of a rare event of Saharan dust reaching the Arctic region. Weather 2010, 65, 208–211. [Google Scholar] [CrossRef]
  18. Knippertz, P.; Stuut, J.-B.W. (Eds.) Mineral Dust: A Key Player in the Earth System; Springer: Dordrecht, The Netherlands, 2014. [Google Scholar]
  19. Choobari, O.A.; Zawar-Reza, P.; Sturman, A. The global distribution of mineral dust and its impacts on the climate system: A review. Atmos. Res. 2014, 138, 152–165. [Google Scholar] [CrossRef]
  20. Middleton, N.J. Desert dust hazards: A global review. Aeolian Res. 2017, 24, 53–63. [Google Scholar] [CrossRef]
  21. Schepanski, K. Transport of Mineral Dust and Its Impact on Climate. Geosciences 2018, 8, 151. [Google Scholar] [CrossRef] [Green Version]
  22. Mahowald, N.M.; Kloster, S.; Engelstaedter, S.; Moore, J.K.; Mukhopadhyay, S.; McConnell, J.R.; Albani, S.; Doney, S.C.; Bhattacharya, A.; Curran, M.A.J.; et al. Observed 20th century desert dust variability: Impact on climate and biogeochemistry. Atmos. Chem. Phys. 2010, 10, 10875–10893. [Google Scholar] [CrossRef] [Green Version]
  23. Helmert, J.; Heinold, B.; Tegen, I.; Hellmuth, O.; Wendisch, M. On the direct and semidirect effects of Saharan dust over Europe: A modeling study. J. Geophys. Res. 2007, 112, D13208. [Google Scholar] [CrossRef] [Green Version]
  24. Kok, J.F.; Storelvmo, T.; Karydis, V.A.; Adebiyi, A.A.; Mahowald, N.M.; Evan, A.T.; He, C.; Leung, D.M. Mineral dust aerosol impacts on global climate and climate change. Nat. Rev. Earth Environ. 2023, 4, 71–86. [Google Scholar] [CrossRef]
  25. Kok, J.F.; Ward, D.S.; Mahowald, N.M.; Evan, A.T. Global and regional importance of the direct dust-climate feedback. Nat. Commun. 2018, 9, 241. [Google Scholar] [CrossRef] [Green Version]
  26. Alizadeh-Choobari, O.; Sturman, A.; Zawar-Reza, P. A global satellite view of the seasonal distribution of mineral dust and its correlation with atmospheric circulation. Dyn. Atmos. Ocean. 2014, 68, 20–34. [Google Scholar] [CrossRef]
  27. Engelstaedter, S.; Washington, R. Atmospheric controls on the annual cycle of North African dust. J. Geophys. Res. 2007, 112, D03103. [Google Scholar] [CrossRef]
  28. Meloni, D.; Di Sarra, A.; Biavati, G.; DeLuisi, J.J.; Monteleone, F.; Pace, G.; Piacentino, S.; Sferlazzo, D.M. Seasonal behavior of Saharan dust events at the Mediterranean island of Lampedusa in the period 1999–2005. Atmos. Environ. 2007, 41, 3041–3056. [Google Scholar] [CrossRef]
  29. Pey, J.; Querol, X.; Alastuey, A.; Forastiere, F.; Stafoggia, M. African dust outbreaks over the Mediterranean Basin during 2001–2011: PM10 concentrations, phenomenology and trends, and its relation with synoptic and mesoscale meteorology. Atmos. Chem. Phys. 2013, 13, 1395–1410. [Google Scholar] [CrossRef] [Green Version]
  30. Varga, G.; Kovács, J.; Újvári, G. Analysis of Saharan dust intrusions into the Carpathian Basin (Central Europe) over the period of 1979–2011. Glob. Planet. Chang. 2013, 100, 333–342. [Google Scholar] [CrossRef] [Green Version]
  31. Russo, A.; Sousa, P.M.; Durão, R.M.; Ramos, A.M.; Salvador, P.; Linares, C.; Díaz, J.; Trigo, R.M. Saharan dust intrusions in the Iberian Peninsula: Predominant synoptic conditions. Sci. Total Environ. 2020, 717, 137041. [Google Scholar] [CrossRef]
  32. Papayannis, A.; Mamouri, R.E.; Amiridis, V.; Kazadzis, S.; Pérez, C.; Tsaknakis, G.; Kokkalis, P.; Baldasano, J.M. Systematic lidar observations of Saharan dust layers over Athens, Greece in the frame of EARLINET project (2004–2006). Ann. Geophys. 2009, 27, 3611–3620. [Google Scholar] [CrossRef] [Green Version]
  33. Soupiona, O.; Papayannis, A.; Kokkalis, P.; Mylonaki, M.; Tsaknakis, G.; Argyrouli, A.; Vratolis, S. Long-term systematic profiling of dust aerosol optical properties using the EOLE NTUA lidar system over Athens, Greece (2000–2016). Atmos. Environ. 2018, 183, 165–174. [Google Scholar] [CrossRef]
  34. Varga, G. Changing nature of Saharan dust deposition in the Carpathian Basin (Central Europe): 40 years of identified North African dust events (1979–2018). Environ. Int. 2020, 139, 105712. [Google Scholar] [CrossRef]
  35. Ajtai, N.; Stefanie, H.; Mereuta, A.; Radovici, A.; Botezan, C. Multi-sensor observation of a Saharan dust outbreak over Transylvania, Romania in April 2019. Atmosphere 2020, 11, 364. [Google Scholar] [CrossRef] [Green Version]
  36. Peshev, Z.; Deleva, A.; Vulkova, L.; Dreischuh, T. Large-Scale Saharan Dust Episode in April 2019: Study of Desert Aerosol Loads over Sofia, Bulgaria, Using Remote Sensing, In Situ, and Modeling Resources. Atmosphere 2022, 13, 981. [Google Scholar] [CrossRef]
  37. Nastos, P.T. Meteorological patterns associated with intense Saharan dust outbreaks over Greece in winter. Adv. Meteorol. 2012, 2012, 828301. [Google Scholar] [CrossRef] [Green Version]
  38. Varga, G.; Cserháti, C.; Kovács, J.; Szeberényi, J.; Bradák, B. Unusual Saharan dust events in the Carpathian Basin (Central Europe) in 2013 and early 2014. Weather 2014, 69, 309–313. [Google Scholar] [CrossRef] [Green Version]
  39. Titos, G.; Ealo, M.; Pandolfi, M.; Pérez, N.; Sola, Y.; Sicard, M.; Comerón, A.; Querol, X.; Alastuey, A. Spatiotemporal evolution of a severe winter dust event in the western Mediterranean: Aerosol optical and physical properties. J. Geophys. Res. Atmos. 2017, 122, 4052–4069. [Google Scholar] [CrossRef] [Green Version]
  40. Fernández, A.J.; Sicard, M.; Costa, M.J.; Guerrero-Rascado, J.L.; Gómez-Amo, J.L.; Molero, F.; Barragán, R.; Basart, S.; Bortoli, D.; Bedoya-Velásquez, A.E.; et al. Extreme, wintertime Saharan dust intrusion in the Iberian Peninsula: Lidar monitoring and evaluation of dust forecast models during the February 2017 event. Atmos. Res. 2019, 228, 223–241. [Google Scholar] [CrossRef]
  41. Córdoba-Jabonero, C.; Sicard, M.; del Águila, A.; Jiménez, M.; Zorzano, M.-P. Performance of a dust model to predict the vertical mass concentration of an extreme Saharan dust event in the Iberian Peninsula: Comparison with continuous, elastic, polarization-sensitive lidars. Atmos. Environ. 2019, 214, 116828. [Google Scholar] [CrossRef]
  42. Deleva, A.D.; Peshev, Z.Y.; Vulkova, L.A.; Dreischuh, T.N. Lidar study of unusual winter Saharan dust loads above Sofia, Bulgaria: Impacts on the local weather and troposphere. J. Appl. Remote Sens. 2021, 15, 024517. [Google Scholar] [CrossRef]
  43. Barriopedro, D.; García-Herrera, R.; Trigo, R.M. Application of blocking diagnosis methods to general circulation models. Part I: A novel detection scheme. Clim. Dyn. 2010, 35, 1373–1391. [Google Scholar] [CrossRef]
  44. Barriopedro, D.; García-Herrera, R.; Lupo, A.R.; Hernández, E. A Climatology of Northern Hemisphere blocking. J. Clim. 2006, 19, 1042–1063. [Google Scholar] [CrossRef] [Green Version]
  45. Woollings, T.; Barriopedro, D.; Methven, J.; Son, S.-W.; Martius, O.; Harvey, B.; Sillmann, J.; Lupo, A.R.; Seneviratne, S. Blocking and its response to climate change. Curr. Clim. Chang. Rep. 2018, 4, 287–300. [Google Scholar] [CrossRef] [PubMed] [Green Version]
  46. Lupo, A.R. Atmospheric blocking events: A review. Ann. N. Y. Acad. Sci. 2021, 1504, 5–24. [Google Scholar] [CrossRef]
  47. Kautz, L.A.; Martius, O.; Pfahl, S.; Pinto, J.G.; Ramos, A.M.; Sousa, P.M.; Woollings, T. Atmospheric blocking and weather extremes over the Euro-Atlantic sector–a review. Weather Clim. Dyn. 2022, 3, 305–336. [Google Scholar] [CrossRef]
  48. Pérez, C.; Nickovic, S.; Baldasano, J.M.; Sicard, M.; Rocadenbosch, F.; Cachorro, V.E. A long Saharan dust event over the western Mediterranean: Lidar, Sun photometer observations, and regional dust modeling. J. Geophys. Res. 2006, 111, D15214. [Google Scholar] [CrossRef]
  49. Papayannis, A.; Balis, D.; Amiridis, V.; Chourdakis, G.; Tsaknakis, G.; Zerefos, C.; Castanho, A.D.A.; Nickovic, S.; Kazadzis, S.; Grabowski, J. Measurements of Saharan dust aerosols over the Eastern Mediterranean using elastic backscatter-Raman lidar, spectrophotometric and satellite observations in the frame of the EARLINET project. Atmos. Chem. Phys. 2005, 5, 2065–2079. [Google Scholar] [CrossRef] [Green Version]
  50. Yin, Z.; Ansmann, A.; Baars, H.; Seifert, P.; Engelmann, R.; Radenz, M.; Jimenez, C.; Herzog, A.; Ohneiser, K.; Hanbuch, K.; et al. Aerosol measurements with a shipborne Sun–sky–lunar photometer and collocated multiwavelength Raman polarization lidar over the Atlantic Ocean. Atmos. Meas. Tech. 2019, 12, 5685–5698. [Google Scholar] [CrossRef] [Green Version]
  51. Schmid, B.; Redemann, J.; Russell, P.B.; Hobbs, P.V.; Hlavka, D.L.; McGill, M.J.; Holben, B.N.; Welton, E.J.; Campbell, J.R.; Torres, O.; et al. Coordinated airborne, spaceborne, and ground-based measurements of massive thick aerosol layers during the dry season in southern Africa. J. Geophys. Res. 2003, 108, 8496. [Google Scholar] [CrossRef] [Green Version]
  52. Mona, L.; Liu, Z.; Müller, D.; Omar, A.; Papayannis, A.; Pappalardo, G.; Sugimoto, N.; Vaughan, M. Lidar measurements for desert dust characterization: An overview. Adv. Meteorol. 2012, 2012, 356265. [Google Scholar] [CrossRef] [Green Version]
  53. Comerón, A.; Muñoz-Porcar, C.; Rocadenbosch, F.; Rodríguez-Gómez, A.; Sicard, M. Current Research in Lidar Technology Used for the Remote Sensing of Atmospheric Aerosols. Sensors 2017, 17, 1450. [Google Scholar] [CrossRef] [PubMed] [Green Version]
  54. Soupiona, O.; Samaras, S.; Ortiz-Amezcua, P.; Böckmann, C.; Papayannis, A.; Moreira, G.A.; Benavent-Oltra, J.A.; Guerrero-Rascado, J.L.; Bedoya-Velásquez, A.E.; Olmo, F.J.; et al. Retrieval of optical and microphysical properties of transported Saharan dust over Athens and Granada based on multi-wavelength Raman lidar measurements: Study of the mixing processes. Atmos. Environ. 2019, 214, 116824. [Google Scholar] [CrossRef]
  55. Deleva, A.D.; Peshev, Z.Y.; Dreischuh, T.N.; Chaikovsky, A.P.; Slesar, A.S.; Fedarenka, A. Lidar observations of Saharan dust loads above Sofia, Bulgaria: Dust layers extending throughout the troposphere (a case study). J. Appl. Remote Sens. 2020, 14, 014504. [Google Scholar] [CrossRef]
  56. Dreischuh, T.; Grigorov, I.; Peshev, Z.; Deleva, A.; Kolarov, G.; Stoyanov, D. Lidar Mapping of Near-Surface Aerosol Fields. In Aerosols—Science and Case Studies, 1st ed.; Volkov, K., Ed.; IntechOpen: Rijeka, Croatia, 2016; pp. 85–107. [Google Scholar]
  57. Esselborn, M.; Wirth, M.; Fix, A.; Weinzierl, B.; Rasp, K.; Tesche, M.; Petzold, A. Spatial distribution and optical properties of Saharan dust observed by airborne high spectral resolution lidar during SAMUM 2006. Tellus B 2009, 61, 131–143. [Google Scholar] [CrossRef] [Green Version]
  58. Liu, Z.; Omar, A.; Vaughan, M.; Hair, J.; Kittaka, C.; Hu, Y.; Powell, K.; Trepte, C.; Winker, D.; Hostetler, C.; et al. CALIPSO lidar observations of the optical properties of Saharan dust: A case study of long-range transport. J. Geophys. Res. Atmos. 2008, 113, D7. [Google Scholar] [CrossRef]
  59. Haarig, M.; Ansmann, A.; Engelmann, R.; Baars, H.; Toledano, C.; Torres, B.; Althausen, D.; Radenz, M.; Wandinger, U. First triple-wavelength lidar observations of depolarization and extinction-to-backscatter ratios of Saharan dust. Atmos. Chem. Phys. 2022, 22, 355–369. [Google Scholar] [CrossRef]
  60. Janicka, L.; Stachlewska, I.S.; Veselovskii, I.; Baars, H. Temporal variations in optical and microphysical properties of mineral dust and biomass burning aerosol derived from daytime Raman lidar observations over Warsaw, Poland. Atmos. Environ. 2017, 169, 162–174. [Google Scholar] [CrossRef]
  61. Tesche, M.; Ansmann, A.; Mueller, D.; Althausen, D.; Mattis, I.; Heese, B.; Freudenthaler, V.; Wiegner, M.; Esselborn, M.; Pisani, G. Vertical profiling of Saharan dust with Raman lidars and airborne HSRL in southern Morocco during SAMUM. Tellus B 2009, 61, 144–164. [Google Scholar] [CrossRef] [Green Version]
  62. Groß, S.; Esselborn, M.; Weinzierl, B.; Wirth, M.; Fix, A.; Petzold, A. Aerosol classification by airborne high spectral resolution lidar observations. Atmos. Chem. Phys. 2013, 13, 2487–2505. [Google Scholar] [CrossRef] [Green Version]
  63. Karanasiou, A.; Moreno, N.; Moreno, T.; Viana, M.; de Leeuw, F.; Querol, X. Health effects from Sahara dust episodes in Europe: Literature review and research gaps. Environ. Intern. 2012, 47, 107–114. [Google Scholar] [CrossRef] [PubMed]
  64. Mallone, S.; Stafoggia, M.; Faustini, A.; Gobbi, G.P.; Marconi, A.; Forastiere, F. Saharan dust and associations between particulate matter and daily mortality in Rome, Italy. Environ. Health Perspect. 2011, 119, 1409–1414. [Google Scholar] [CrossRef] [PubMed]
  65. Wang, Q.; Gu, J.; Wang, X. The impact of Sahara dust on air quality and public health in European countries. Atmos. Environ. 2020, 15, 117771. [Google Scholar] [CrossRef]
  66. Pappalardo, G.; Amodeo, A.; Apituley, A.; Comeron, A.; Freudenthaler, V.; Linné, H.; Ansmann, A.; Bösenberg, J.; D’Amico, G.; Mattis, I.; et al. EARLINET: Towards an advanced sustainable European aerosol lidar network. Atmos. Meas. Tech. 2014, 7, 2389–2409. [Google Scholar] [CrossRef] [Green Version]
  67. Aerosol, Clouds and Trace Gases (ACTRIS) Research Infrastructure. Available online: https://www.actris.eu (accessed on 21 March 2023).
  68. Barreto, Á.; Cuevas, E.; Granados-Muñoz, M.-J.; Alados-Arboledas, L.; Romero, P.M.; Gröbner, J.; Kouremeti, N.; Almansa, A.F.; Stone, T.; Toledano, C.; et al. The new sun-sky-lunar Cimel CE318-T multiband photometer—A comprehensive performance evaluation. Atmos. Meas. Tech. 2016, 9, 631–654. [Google Scholar] [CrossRef] [Green Version]
  69. Holben, B.N.; Eck, T.F.; Slutsker, I.; Tanre, D.; Buis, J.P.; Setzer, A.; Vermote, E.; Reagan, J.A.; Kaufman, Y.J.; Nakajima, T.; et al. AERONET—A federated instrument network and data archive for aerosol characterization. Rem. Sens. Environ. 1998, 66, 1–16. [Google Scholar] [CrossRef]
  70. Chaikovsky, A.; Dubovik, O.; Holben, B.; Bril, A.; Goloub, P.; Tanré, D.; Pappalardo, G.; Wandinger, U.; Chaikovskaya, L.; Denisov, S.; et al. Lidar-Radiometer Inversion Code (LIRIC) for the retrieval of vertical aerosol properties from combined lidar/radiometer data: Development and distribution in EARLINET. Atmos. Meas. Tech. 2016, 9, 1181–1205. [Google Scholar] [CrossRef] [Green Version]
  71. Tsekeri, A.; Lopatin, A.; Amiridis, V.; Marinou, E.; Igloffstein, J.; Siomos, N.; Solomos, S.; Kokkalis, P.; Engelmann, R.; Baars, H. GARRLiC and LIRIC: Strengths and limitations for the characterization of dust and marine particles along with their mixtures. Atmos. Meas. Tech. 2017, 10, 4995–5016. [Google Scholar] [CrossRef] [Green Version]
  72. Mamouri, R.E.; Ansmann, A. Fine and coarse dust separation with polarization lidar. Atmos. Meas. Tech. 2014, 7, 3717–3735. [Google Scholar] [CrossRef] [Green Version]
  73. Dubovik, O.; Fuertes, D.; Litvinov, P.; Lopatin, A.; Lapyonok, T.; Doubovik, I.; Xu, F.; Ducos, F.; Chen, C.; Torres, B. A Comprehensive Description of Multi-Term LSM for Applying Multiple a Priori Constraints in Problems of Atmospheric Remote Sensing: GRASP Algorithm, Concept, and Applications. Front. Remote Sens. 2021, 2, 706851. [Google Scholar] [CrossRef]
  74. Legrand, M.; Plana-Fattori, A.; N’doumé, C. Satellite detection of dust using the IR imagery of Meteosat: 1. Infrared difference dust index. J. Geophys. Res. 2001, 106, 18251–18274. [Google Scholar] [CrossRef] [Green Version]
  75. Levy, R.C.; Remer, L.A.; Dubovik, O. Global aerosol optical properties and application to Moderate Resolution Imaging Spectroradiometer aerosol retrieval over land. J. Geophys. Res. 2007, 112, D13210. [Google Scholar] [CrossRef] [Green Version]
  76. MODIS (Moderate Resolution Imaging Spectroradiometer). Available online: https://modis.gsfc.nasa.gov/ (accessed on 29 April 2021).
  77. Schladitz, A.; Müller, T.; Kaaden, N.; Massling, A.; Kandler, K.; Ebert, M.; Weinbruch, S.; Deutscher, C.; Wiedensohler, A. In situ measurements of optical properties at Tinfou (Morocco) during the Saharan Mineral Dust Experiment SAMUM 2006. Tellus B 2009, 61, 64–78. [Google Scholar] [CrossRef] [Green Version]
  78. Rodriguez, S.; Alastuey, A.; Querol, X. A review of methods for long term in situ characterization of aerosol dust. Aeolian Res. 2012, 6, 55–74. [Google Scholar] [CrossRef]
  79. Stein, A.F.; Draxler, R.R.; Rolph, G.D.; Stunder, B.J.B.; Cohen, M.D.; Ngan, F. NOAA’s HYSPLIT Atmospheric Transport and Dispersion Modeling System. Bull. Am. Meteorol. Soc. 2015, 96, 2059–2077. [Google Scholar] [CrossRef]
  80. Rolph, G.; Stein, A.; Stunder, B. Real-time environmental applications and display system: READY. Environ. Model. Softw. 2017, 95, 210–228. [Google Scholar] [CrossRef]
  81. Kallos, G.; Nickovic, S.; Papadopoulos, A.; Jovic, D.; Kakaliagou, O.; Misirlis, N.; Boukas, L.; Mimikou, N.; Sakellaridis, G.; Papageorgiou, J.; et al. The regional weather forecasting system SKIRON: An overview. In Proceedings of the International Symposium on Regional Weather Prediction on Parallel Computer Environments, Athens, Greece, 15–17 October 1997. [Google Scholar]
  82. Nickovic, S.; Kallos, G.; Papadopoulos, A.; Kakaliagou, O. A model for prediction of desert dust cycle in the atmosphere. J. Geophys. Res. 2001, 106, 18113–18129. [Google Scholar] [CrossRef] [Green Version]
  83. Pérez, C.; Haustein, K.; Janjic, Z.; Jorba, O.; Huneeus, N.; Baldasano, J.M.; Black, T.; Basart, S.; Nickovic, S.; Miller, R.L.; et al. An online mineral dust aerosol model for MESO to global scales: Model description, annual simulations and evaluation. Atmos. Chem. Phys. 2011, 11, 13001–13027. [Google Scholar] [CrossRef] [Green Version]
  84. Basart, S.; Pérez, C.; Nickovic, S.; Cuevas, E.; Baldasano, J. Development and evaluation of the BSC-DREAM8b dust regional model over Northern Africa, the Mediterranean and the Middle East. Tellus B 2012, 64, 18539. [Google Scholar] [CrossRef] [Green Version]
  85. Nickovic, S.; Cvetkovic, B.; Madonna, F.; Rosoldi, M.; Pejanovic, G.; Petkovic, S.; Nikolic, J. Cloud ice caused by atmospheric mineral dust—Part 1: Parameterization of ice nuclei concentration in the NMME-DREAM model. Atmos. Chem. Phys. 2016, 16, 11367–11378. [Google Scholar] [CrossRef] [Green Version]
  86. Klose, M.; Jorba, O.; Gonçalves Ageitos, M.; Escribano, J.; Dawson, M.L.; Obiso, V.; Di Tomaso, E.; Basart, S.; Montané Pinto, G.; Macchia, F. Mineral dust cycle in the Multiscale Online Nonhydrostatic AtmospheRe Chemistry model (MONARCH) version 2.0. Geosci. Model Dev. 2021, 14, 6403–6444. [Google Scholar] [CrossRef]
  87. The European Centre for Medium-Range Weather Forecasts (ECMWF). Available online: https://www.ecmwf.int/ (accessed on 21 March 2023).
  88. Kalnay, E.; Kanamitsu, M.; Kistler, R.; Collins, W.; Deaven, D.; Gandin, L.; Iredell, M.; Saha, S.; White, G.; Woollen, J.; et al. The NCEP/NCAR 40-year reanalysis project. Bull. Am. Meteorol. Soc. 1996, 77, 437–471. [Google Scholar] [CrossRef]
  89. Kistler, R.; Kalnay, E.; Collins, W.; Saha, S.; White, G.; Woollen, J.; Chelliah, M.; Ebisuzaki, W.; Kanamitsu, M.; Kousky, V.; et al. The NCEP–NCAR 50-year reanalysis: Monthly means CD-ROM and documentation. Bull. Am. Meteorol. Soc. 2001, 82, 247–268. [Google Scholar] [CrossRef]
  90. NOAA/ESRL Physical Sciences Laboratory, Boulder Colorado, Daily Mean Composites Website. Available online: https://psl.noaa.gov/data/composites/day (accessed on 29 April 2021).
  91. University of Wyoming. Upperair Air Data. Available online: http://weather.uwyo.edu/upperair/sounding.html (accessed on 1 February 2022).
  92. Hoshyaripour, A. February 2021: A Dusty Month for Europe, Blog of the Atmospheric Sciences (AS) Division of the European Geosciences Union (EGU). Available online: https://blogs.egu.eu/divisions/as/2021/04/03/february-2021-a-dusty-month-for-europe (accessed on 29 April 2021).
  93. National Oceanic and Atmospheric Administration, National Centers for Environmental Information, The World Meteorological Organization (WMO) Climate Normals, World Meteorological Organization (WMO) Station Number: 15614. Available online: https://www.ncei.noaa.gov/products/wmo-climate-normals (accessed on 15 March 2022).
  94. Klett, D. Stable analytical inversion solution for processing lidar returns. Appl. Opt. 1981, 20, 211–220. [Google Scholar] [CrossRef] [Green Version]
  95. Fernald, G. Analysis of atmospheric lidar observations: Some comments. Appl. Opt. 1984, 23, 652–653. [Google Scholar] [CrossRef]
  96. Freudenthaler, V.; Linné, H.; Chaikovski, A.; Rabus, D.; Groß, S. EARLINET LiDAR quality assurance tools. Atmos. Meas. Tech. Discuss. 2018. preprint. [Google Scholar]
  97. Berjón, A.; Barreto, A.; Hernández, Y.; Yela, M.; Toledano, C.; Cuevas, E. A 10-year characterization of the Saharan Air Layer lidar ratio in the subtropical North Atlantic. Atmos. Chem. Phys. 2019, 19, 6331–6349. [Google Scholar] [CrossRef] [Green Version]
  98. Peshev, Z.Y.; Dreischuh, T.N.; Evgenieva, T.T.; Deleva, A.D.; Tonev, D.; Stoyanov, D.V. Lidar observations of long-range transported Saharan dust over Sofia, Bulgaria: A case study of dust mixed with local aerosols. J. Appl. Remote Sens. 2016, 10, 036009. [Google Scholar] [CrossRef]
  99. Mona, L.; Amodeo, A.; Pandolfi, M.; Pappalardo, G. Saharan dust intrusions in the Mediterranean area: Three years of Raman lidar measurements. J. Geophys. Res. 2006, 111, D16203. [Google Scholar] [CrossRef] [Green Version]
  100. Del Guasta, M. Daily cycles in urban aerosols observed in Florence (Italy) by means of an automatic 532–1064 nm LIDAR. Atmos. Environ. 2002, 36, 2853–2865. [Google Scholar] [CrossRef]
  101. Cimel. Multiband photometer CE318–T, User’s Manual (Revision V4.10 October 2021). Available online: https://www.cimel.fr/wp-content/uploads/2022/01/CE318_T_Photometer_UserManual_V4.10.pdf (accessed on 1 April 2022).
  102. Evgenieva, T.; Gurdev, L.; Toncheva, E.; Dreischuh, T. Optical and Microphysical Properties of the Aerosol Field over Sofia, Bulgaria, Based on AERONET Sun-Photometer Measurements. Atmosphere 2022, 13, 884. [Google Scholar] [CrossRef]
  103. O’Neill, N.T.; Eck, T.F.; Smirnov, A.; Holben, B.N.; Thulasiraman, S. Spectral discrimination of coarse and fine mode optical depth. J. Geophys. Res. 2003, 108, 4559–4573. [Google Scholar] [CrossRef]
  104. O’Neill, N.; Eck, T.; Holben, B.; Smirnov, A.; Dubovik, O.; Royer, A. Bimodal size distribution influences on the variation of Angstrom derivatives in spectral and optical depth space. J. Geophys. Res. Atmos. 2001, 106, 9787–9806. [Google Scholar] [CrossRef]
  105. Dubovik, O.; King, M.D. A flexible inversion algorithm for retrieval of aerosol optical properties from Sun and sky radiance measurements. J. Geophys. Res. 2000, 105, 20673–20696. [Google Scholar] [CrossRef] [Green Version]
  106. Dubovik, O.; Smirnov, A.; Holben, B.N.; King, M.D.; Kaufman, Y.J.; Eck, T.F.; Slutsker, I. Accuracy assessments of aerosol optical properties retrieved from AERONET sun and sky-radiometric measurements. J. Geophys. Res. 2000, 105, 9791–9806. [Google Scholar] [CrossRef] [Green Version]
  107. Dubovik, O.; Sinyuk, A.; Lapyonok, T.; Holben, B.N.; Mishchenko, M.; Yang, P.; Eck, T.F.; Volten, H.; Muñoz, O.; Veihelmann, B.; et al. Application of spheroid models to account for aerosol particle nonsphericity in remote sensing of desert dust. J. Geophys. Res. 2006, 111, D11208. [Google Scholar] [CrossRef] [Green Version]
  108. Giles, D.M.; Sinyuk, A.; Sorokin, M.G.; Schafer, J.S.; Smirnov, A.; Slutsker, I.; Eck, T.F.; Holben, B.N.; Lewis, J.R.; Campbell, J.R.; et al. Advancements in the Aerosol Robotic Network (AERONET) Version 3 database—Automated near-real-time quality control algorithm with improved cloud screening for Sunphotometer aerosol optical depth (AOD) measurements. Atmos. Meas. Tech. 2019, 12, 169–209. [Google Scholar] [CrossRef] [Green Version]
  109. Sinyuk, A.; Holben, B.; Eck, T.; Giles, D.; Slutsker, I.; Korkin, S.; Schafer, J.; Smirnov, A.; Sorokin, M.; Lyapustin, A. The AERONET Version 3 aerosol retrieval algorithm, associated uncertainties and comparisons to Version 2. Atmos. Meas. Tech. 2020, 13, 3375–3411. [Google Scholar] [CrossRef]
  110. Kaufman, Y.J.; Koren, I.; Remer, L.A.; Tanré, D.; Ginoux, P.; Fan, S. Dust transport and deposition observed from the Terra-Moderate Resolution Imaging Spectroradiometer (MODIS) spacecraft over the Atlantic Ocean. J. Geophys. Res. 2005, 110, D10S12. [Google Scholar] [CrossRef] [Green Version]
  111. Executive Environment Agency (ExEA), Ministry of Environment and Water—Bulgaria, National System for Environmental Monitoring. Available online: http://www.eea.government.bg/kav/ (accessed on 7 May 2021).
  112. Evgenieva, T.; Tatarov, B.; Kolev, N.; Iliev, I.; Savov, P.; Kaprielov, B.; Kolev, I. One year measurements of aerosol optical depth during development of the atmospheric boundary layer over urban area (Sofia, Bulgaria). In Proceedings of the 24th International Laser Radar Conference 2008 (ILRC 24), International Coordination Group on Laser Atmospheric Studies (ICLAS), Boulder, CO, USA, 23–27 June 2008; pp. 951–954. [Google Scholar]
  113. Evgenieva, T.; Kolev, N.; Iliev, T.; Savov, P.; Kaprielov, B.; Devara, P.; Kolev, I. Lidar and spectroradiometer measurements of atmospheric aerosol optical characteristics over an urban area in Sofia, Bulgaria. Int. J. Remote Sens. 2009, 30, 6381–6401. [Google Scholar] [CrossRef]
  114. Barcelona Dust Regional Center—The World Meteorological Organization (WMO) Sand and Dust Storms Warning Advisory and Assessment System (SDS-WAS) Regional Center for Northern Africa, Middle East and Europe. Available online: https://dust.aemet.es (accessed on 21 March 2023).
  115. Chaikovsky, A.; Chaikovskaya, L.; Denishchik-Nelubina, N.; Fedarenka, A.; Oshchepkov, S. Lidar&radiometer inversion code (LIRIC) for synergetic processing of Earlinet, Aeronet and Calipso lidar data. EDJ Web Conf. 2018, 176, 08007. [Google Scholar]
  116. Sun-Sky Radiometer Observation NETwork (SONET). Available online: http://www.sonet.ac.cn/en/index.php (accessed on 26 June 2023).
  117. Li, L.; Li, Z.; Li, K.; Wang, Y.; Tian, Q.; Su, X.; Yang, L.; Ye, S.; Xu, H. Aerosol Direct Radiative Effects over China Based on Long-Term Observations within the Sun–Sky Radiometer Observation Network (SONET). Remote Sens. 2020, 12, 3296. [Google Scholar] [CrossRef]
  118. San Francisco State University, Analyses of Jet Stream Positions. Available online: https://squall.sfsu.edu/crws/archive/jet_arch.html (accessed on 26 June 2021).
  119. López-Caravaca, A.; Castañer, R.; Clemente, A.; Yubero, E.; Galindo, N.; Crespo, J.; Nicolás, J.F. The Impact of Intense Winter Saharan Dust Events on PM and Optical Properties at Urban Sites in the Southeast of the Iberian Peninsula. Atmosphere 2021, 12, 1469. [Google Scholar] [CrossRef]
  120. Francis, D.; Fonseca, R.; Nelli, N.; Bozkurt, D.; Picard, G.; Guan, B. Atmospheric rivers drive exceptional Saharan dust transport towards Europe. Atmos. Res. 2022, 266, 105959. [Google Scholar] [CrossRef]
  121. Szczepanik, D.M.; Ortiz-Amezcua, P.; Heese, B.; D’Amico, G.; Stachlewska, I.S. First Ever Observations of Mineral Dust in Wintertime over Warsaw, Poland. Remote Sens. 2022, 14, 3788. [Google Scholar] [CrossRef]
  122. Meloni, D.; Di Sarra, A.; Monteleone, F.; Pace, G.; Piacentino, S.; Sferlazzo, D.M. Seasonal transport patterns of intense Saharan dust events at the Mediterranean island of Lampedusa in the period 1999–2005. Atmos. Res. 2008, 88, 134–148. [Google Scholar] [CrossRef]
  123. Soupiona, O.; Papayannis, A.; Kokkalis, P.; Foskinis, R.; Sánchez, H.G.; Ortiz-Amezcua, P.; Mylonaki, M.; Papanikolaou, C.-A.; Papagiannopoulos, N.; Samaras, S.; et al. EARLINET observations of Saharan dust intrusions over the northern Mediterranean region (2014–2017): Properties and impact on radiative forcing. Atmos. Chem. Phys. 2020, 20, 15147–15166. [Google Scholar] [CrossRef]
  124. Kirova, H.; Syrakov, D.; Prodanova, M.; Georgieva, E.; Atanassov, D. Background Concentration of Air Pollutants for Sofia City–Analysis For Summer and Winter Months. Int. Multidiscip. Sci. GeoConf. SGEM 2022, 22, 279–286. [Google Scholar]
  125. Current & Forecast Meteorology—Real-Time Environmental Applications and Display System (READY), National Oceanic and Atmospheric Administration (NOAA) Air Resources Laboratory (ARL). Available online: https://www.ready.noaa.gov/READYcmet.php (accessed on 3 February 2022).
  126. United States Committee on Extension to the Standard Atmosphere. U.S. Standard Atmosphere 1976; U.S. Government Printing Office: Washington, DC, USA, 1976. [Google Scholar]
  127. Peshev, Z.; Deleva, A.; Chaikovsky, A.; Pescherenkov, V.; Vulkova, L.; Dreischuh, T. Vertical and near-horizontal scanning lidar observations of aerosol loads over Sofia, Bulgaria, in the presence of Saharan dust. J. Phys. Conf. Ser. 2022, 2240, 012032. [Google Scholar] [CrossRef]
  128. AERONET Technical and Quality Assurance Documents. Available online: https://aeronet.gsfc.nasa.gov/new_web/publications.html (accessed on 28 June 2023).
  129. Sawamura, P.; Landulfo, E. AERONET sunphotometer products and backscatter lidar data: Systematic intercomparison over the city of São Paulo, Brazil. Opt. Pura Apl. 2008, 41, 201–205. [Google Scholar]
  130. Nousiainen, T.; Muinonen, K.; Räisänen, P. Scattering of light by large Saharan dust particles in a modified ray optics approximation. J. Geophys. Res. 2003, 108, 4025. [Google Scholar] [CrossRef]
  131. Muñoz, O.; Volten, H.; Hovenier, J.W.; Nousiainen, T.; Muinonen, K.; Guirado, D.; Moreno, F.; Waters, L.B.F.M. Scattering matrix of large Saharan dust particles: Experiments and computations. J. Geophys. Res. 2007, 112, D13215. [Google Scholar] [CrossRef] [Green Version]
Figure 1. Geographic maps of (a) the Balkan Peninsula (source: https://commons.wikimedia.org/w/index.php?curid=110933799, accessed on 7 March 2023) and (b) Sofia (Google Maps image). The positions are indicated of the Sofia IE-BAS station (magenta star) and the Kopitoto automated measuring station (AMS) (orange triangle).
Remotesensing 15 03833 g001
Figure 2. GFS analysis map of the Polar jet stream at 300 mb level (a); NCEP/NCAR reanalysis diagrams at 500 mb level for the Northern Hemisphere of the vector winds (b) and the geopotential height (c), in the period 21–22 February 2021. Sofia’s location is marked by a red circle.
Remotesensing 15 03833 g002
Figure 3. NCEP/NCAR maps of the geopotential height composite mean (colored) and wind vectors (black arrows), at 700 mb pressure level, for the period 22–27 February 2021. Sofia’s location is marked by a blue circle.
Remotesensing 15 03833 g003
Figure 4. NCEP/NCAR color maps of air temperature composite anomalies at a 700-mb level with respect to the climatological means for the period 1981–2010 over the region of North Africa, the Mediterranean, and Europe (20 N–60 N, 10 W–50 E) for the period 22–27 February 2021.
Remotesensing 15 03833 g004
Figure 5. Forecast color maps of the total dust load of Saharan dust over North Africa, the Mediterranean, and Europe for 22–27 February 2021, obtained by the NKUA SKIRON model. Sofia’s location is marked by a red circle.
Remotesensing 15 03833 g005
Figure 6. MODIS-Terra true-color images of the dust-cloud plume spread for (a) 21 February 2021, (b) 22 February 2021, (c) 23 February 2021, (d) 24 February 2021, (e) 25 February 2021, and (f) 26 February 2021. The red symbol indicates the position of Sofia station. The images are downloaded from the NASA Worldview website (https://worldview.earthdata.nasa.gov/, accessed on 29 April 2021) using the NASA Worldview Snapshots application.
Remotesensing 15 03833 g006
Figure 7. Time series of the dust/aerosol vertical distribution in terms of range-corrected lidar signals for the measurement dates.
Remotesensing 15 03833 g007
Figure 8. BSC-DREAM8b dust-concentration profiles and NOAA HYSPLIT model backward trajectories ending in Sofia (inset) for the time of lidar measurements in the period 22–27 February 2021. The corresponding time durations and ending heights of the trajectories are noted at the bottom of the insets.
Remotesensing 15 03833 g008
Figure 9. Time-averaged vertical profiles of the aerosol: BSC at 532 nm and 1064 nm (left), BAE (middle), radiosonde, and modeling meteorological parameters (Temperature, Dew Point, Relative Humidity) (right) for the days of lidar measurements.
Remotesensing 15 03833 g009
Figure 10. Height profiles of the aerosol volume concentration for fine and coarse particle size modes and the resulting total aerosol concentration as retrieved by the LIRIC-2 inversion code.
Remotesensing 15 03833 g010
Figure 11. Aerosol optical parameters derived from the AERONET radiometric data and interpolated ones at wavelengths 532 and 1064 nm.
Remotesensing 15 03833 g011
Figure 12. Particle size distributions derived from AERONET radiometric measurements performed from 22–27 February 2021.
Remotesensing 15 03833 g012
Table 1. Columnar Aerosol Volume Concentration.
DateColumnar Volume Concentration (μm3/μm2)
TotalFineCoarseCoarse SphericalCoarse
Non-Spherical
22 Feb.0.0340.0190.0150.0150.000
23 Feb.0.1260.0200.1060.0010.105
24 Feb.0.1380.0540.0840.0060.077
25 Feb.0.0680.0160.0520.0020.050
26 Feb.0.0630.0150.0480.0120.036
27 Feb.0.1140.0400.0740.0100.063
Table 2. AERONET daily mean values of total, fine, and coarse mode AOD at 500 nm and AE at 440/870 nm, along with their standard deviations.
Parameterλ (nm)22 Feb.23 Feb.24 Feb.25 Feb.26 Feb.27 Feb.28 Feb.
AOD5000.134 ± 0.01240.160 ± 0.0380.438 ± 0.0670.189 ± 0.0450.135 ± 0.0200.222 ± 0.0540.116 ± 0.028
AOD Fine Mode5000.112 ± 0.0250.072 ± 0.0200.213 ± 0.0250.085 ± 0.0300.069 ± 0.0140.103 ± 0.0440.101 ± 0.029
AOD Coarse Mode5000.021 ± 0.0020.088 ± 0.0450.225 ± 0.0560.104 ± 0.0210.066 ± 0.0060.119 ± 0.0160.015 ± 0.003
AE440/8701.45 ± 0.060.79 ± 0.390.73 ± 0.150.65 ± 0.120.89 ± 0.080.68 ± 0.191.57 ± 0.06
Disclaimer/Publisher’s Note: The statements, opinions and data contained in all publications are solely those of the individual author(s) and contributor(s) and not of MDPI and/or the editor(s). MDPI and/or the editor(s) disclaim responsibility for any injury to people or property resulting from any ideas, methods, instructions or products referred to in the content.

