
The Impacts of Climate and Human Activities on Grassland Productivity Variation in China
1
College of Geographical and Remote Sensing Science, Xinjiang University, Urumqi 830046, China
2
Institute of Geographical Science, Taiyuan Normal University, Jinzhong 030619, China
3
Xinjiang Laboratory of Lake Environment and Resources in Arid Zone, Urumqi 830054, China
4
College of Geographic Science and Tourism, Xinjiang Normal University, Urumqi 830054, China
*
Author to whom correspondence should be addressed.
Remote Sens. 2023, 15(15), 3864; https://doi.org/10.3390/rs15153864
Submission received: 3 July 2023
/
Revised: 30 July 2023
/
Accepted: 2 August 2023
/
Published: 3 August 2023
(This article belongs to the Special Issue Remote Sensing of Mountain and Plateau Vegetation)
Abstract
:Grassland degradation is widespread and increasing globally, which is closely related to the sustainable development of the ecosystems and the well-being of human life in pastoral areas. Quantifying the factors influencing grassland ecosystems, specifically climate change and human activities, is of great significance for grassland restoration. However, due to the unpredictability of human activities, further research is still needed to distinguish and identify the factors affecting grasslands. In this study, we examined the changes in the gross primary productivity (GPP) of grassland cover in 10 provinces (autonomous regions) of China from 2000 to 2018 and selected three representative climate factors (temperature, precipitation, solar radiation) and six factors covering socioeconomic (primary industry production and population), animal husbandry (large livestock and sheep populations), and national policies (grazing areas, rodent, and pest control) to characterize human activities; then, we quantified the effects and contribution of climate and human factors using three analysis methods (partial correlation analysis, geographical and temporal weighted regression model, and Lindeman Merenda Gold method). The results indicated that the GPP of grassland presented an obvious uptrend (4.75 g C m−2 yr−1, p < 0.05). Among the nine factors, sheep, precipitation, and temperature were the primary factors affecting grassland dynamics. Additionally, the GPP dynamics of grassland were mainly dominated by human activities in seven provinces (autonomous regions). These findings provide decision support for protecting grassland ecosystems and implementing ecological restoration policies in China.
1. Introduction
Grasslands, as an irreplaceable ecosystem, account for approximately 25% of the global terrestrial area and are universally located in arid, semi-arid, and semi-humid areas [1,2]. Grasslands have invaluable ecological functions and economic value in terms of protecting biodiversity, conserving water resources, maintaining ecosystem balance, and promoting regional economies [3,4,5]. With global warming and unreasonable anthropogenic behaviors (overgrazing, over-reclamation, and overexploitation), grassland degradation is widespread and increasing globally. To date, more than 45% of grassland areas have shown different extents of degradation, and this degradation has seriously impacted the livelihood of the local population and threatened sustainable ecological development in the region [6,7]. Therefore, monitoring grassland dynamics and quantifying driving factors are significant for grassland restoration and ensuring local residents’ well-being.
Attributing the long-term, large-scale, and high-resolution characteristics of remote sensing, terrestrial ecosystem research can be realized at regional, continental, and even global scales. Gross primary productivity (GPP), as a physical measure of the rate of photosynthesis, reflects the amount of carbon dioxide converted into organic carbon via plant photosynthesis, and this indicator is widely used for grassland dynamic monitoring [8,9]. Many researchers have chosen GPP to detect grassland variation. Liang [4] indicated that the GPP of grassland had a significant upward trend globally at annual and seasonal scales during 1982–2011. In China, He [10], based on model simulations and remote sensing satellites, reported that more than 80% of the area in Chinese grassland had a sharply increasing trend. However, although a consistent growth trend has emerged, the phenomenon of grassland degradation is still hidden in the context of overall restoration. Nearly 23% of the area of grassland in China has experienced significant grassland degradation [11], especially in Inner Mongolia [10,12]. Grassland variation is mainly affected by climate change and human activities [13,14,15]. In previous studies, statistical methods [16,17], model simulations [18,19], and observational experiments [20] have been used to assess how climate and human factors affect grassland ecosystems. According to previous research results, grassland variation generally has positive or negative correlations with precipitation (PRE) and temperature (TEM) in most areas of China [14,21]. In addition, human activities, including overgrazing, socioeconomics, and regional policy, have profound impacts on the sustainable development and biodiversity of grassland ecosystems [22,23,24]. Nevertheless, as climate exhibits spatiotemporal heterogeneity and human activities are immeasurable, their impact on grassland dynamics still needs further clarification.
In China, grasslands cover an area of approximately 400 million ha and occupy more than 40% of the national land area [25,26]. Grasslands are the main ecosystem, especially in North China, and play an irreplaceable role in windbreaks and sand fixation, forage supply, economic development, and ecological security. The sharply increasing population and unreasonable land use have been accompanied by the serious degradation of grasslands in China in recent years [27]. To curb grassland degradation and promote grassland restoration, many grazing managerial actions have been effectively implemented to increase the sustainability of grassland ecosystems worldwide [6]. The Chinese government has invested in policies that support ecosystem services and the recovery of degraded grassland since 2000, such as the “returning grazing land to grassland” policy, the Beijing and Tianjin Sandstorm Source Control Program, and “Grassland Transfers” [28,29]. Additionally, the use of grazing intensity management as a significant government measure (e.g., yearlong continuous and seasonal grazing exclusion) has been extensively implemented [30]. Liu [31] indicated that human activities have an impact on GPP of over 70% in China, and ecological restoration efficiently promotes the increase in GPP, whereas overgrazing has the opposite effect [31,32,33]. Previous [34,35] studies have broadly discussed how human activities have impacted grasslands, but there is still a lack of quantitative studies to evaluate the different types of human activity impact intensity.
Therefore, to address these knowledge deficiencies and gaps, we used mainstream GPP remote sensing dataset products, three major climatic factors (PRE, TEM, and solar radiation (RAD)), and six human activity indicators, including socioeconomics (primary industry production and population), animal husbandry (large livestock and sheep stock) and national policies (area of forbidden grazing and rodent and pest control) to analyze grassland dynamics and dominant factors in China during 2000–2018. The objectives were to (1) detect the spatiotemporal trends regarding grassland in China during the past two decades, (2) analyze how climate and human activities affect grassland ecosystems, and (3) conduct a quantitative assessment of the impact intensity of climate and human activities on grassland and identify the main driving factors. This research contributes to a theoretical foundation for the evaluation of national policies and is critical for the recent implementation of grassland management practices, regional livestock economy development, and ecological environment protection.
2. Materials and Methods
2.1. Study Area
Grasslands are widely distributed in northern and northwestern China and are mainly distributed in Hebei (HB), Shanxi (SX), Inner Mongolia (IMG), Sichuan (SC), Tibet (TB), Shaanxi (SAX), Gansu (GS), Ningxia (NX), Qinghai (QH) and Xinjiang (XJ) provinces (autonomous regions). The climate types of grasslands are mainly dominated by arid and semi-arid climates and alpine climates, and nearly 80% of these grasslands belong to arid and semi-arid climate regions. Grasslands are classified into five types: meadow, slope grassland, plain grassland, desert grassland, alpine, and sub-alpine meadow (Figure 1a) [36]. China’s grasslands are widely distributed in plateau areas, including the Inner Mongolian Plateau, the Loess Plateau, and the Qinghai–Tibet Plateau. These grasslands are not only important resources for the local development of animal husbandry but also provide irreplaceable ecosystem services such as wind prevention, sand fixation, and soil and water conservation for the stability of regional and even national ecosystems. The area of grassland in this study was extracted from the grassland areas where no land use conversion occurred in the period of 2000–2018 based on the land use types of the China Land Cover Dataset (CLCD) dataset (Figure 1b).
2.2. Data
2.2.1. Remote Sensing Data
The GPP data in this study were provided by the Global Land Surface Satellite (GLASS) dataset, which was downloaded from the National Center for Earth System Science Data (data source: http://www.geodata.cn/index.html, accessed on 8 October 2022) [37]. The GLASS dataset has high accuracy and combines multi-source ground observation data with remote sensing data [38]. This dataset is a global-scale remote sensing data product with the longest time series, of which the temporal resolution is 1982–2018 and the spatial resolution is 0.05° [37]. In addition, the GLASS GPP product was calculated based on the Eddy Covariance–Light Use Efficiency model and has better accuracy than the moderate resolution imaging spectroradiometer (MODIS) GPP product [39,40]. The GIMMS dataset widely serves for vegetation dynamic monitoring and climate change studies and land surface models driven at global, continental, and regional scales.
The TEM, PRE, and RAD were downloaded from the China Meteorological Forcing Dataset (CMFD) [41], which is a regional high spatial and temporal resolution surface meteorological dataset. This CMFD dataset is a set of gridded near-surface meteorological datasets, assimilated remote sensing products, and meteorological station observation datasets. In addition, this dataset spans nearly 40 years, ranging from 1979 to 2018, with a spatial resolution of 0.1°, and it has seven climate variables, including 2 m air temperature, precipitation, shortwave and longwave downward radiation, and so on. Based on the above advantages, the CMFD dataset has been widely used in hydrological models, climate models, and data assimilation. The land use dataset was obtained from the CLCD dataset, which has a long temporal period (from 1985 to 2020), a high spatial resolution (30 m), and a high accuracy compared to common land use datasets, such as the moderate resolution imaging spectroradiometer (MODIS) land cover product (MCD12Q1) and global land cover datasets at 30-meters resolution (GlobeLand30), [42]. To unify the spatial resolution of multi-source data, the climate factor data and land use data were resampled to 0.05°, which was consistent with the GPP data, using the “bilinear” and “majority” interpolation methods, respectively.
2.2.2. Human Activity Data
According to previous studies [43,44,45,46], we have collected six categorical indicators to characterize human activities, covering socioeconomics, animal husbandry, and national ecological policies. The six representative indicators, including large livestock, sheep, population, primary industry, forbidden grazing, and rodent and pest control, were obtained from 10 major grassland-covered provinces (autonomous regions) over 2000–2018 through the Statistical Yearbook and websites. A detailed description of the six indicators, including large livestock, sheep, population, primary industry, grazing prohibition, and rodent and pest control, is shown in Table 1.
2.3. Methods
2.3.1. Sen-Mann–Kendall (Sen-MK) Trend Analysis
The Sen-MK trend analysis method combines the Theil–Sen (T–S) median trend analysis and the Mann–Kendall (M–K) test. The T–S median trend analysis method is used for detecting the trend of the variables, and the method exhibits insensitivity to measurement error and discrete data and is not easily affected by outliers. Therefore, this method effectively avoids the interference of outliers on the internal trend of monitoring data and is widely used to detect the trend of variables [47,48]. The M–K test is a nonparametric statistical test for testing the significance of the trend [35]. Similar to the T–S median trend analysis method, in the M–K test, the monitored variables do not have to show a normal distribution and linear trend, and the result of the test is also insensitive to missing and abnormal values of the monitored variables [49]:
where Slope is the value of the trend detected using the T–S median; i and j represent the time series; and x represents the variable’s value.
The M–K test can be calculated using the following formulas:
where Zmk is the test statistic, and when |Zmk| < 1.96, the detected variables display significance at the level of 0.05; n is the variable length, and x represents the variable’s value.
2.3.2. Partial Correlation Analysis
The partial correlation analysis method was used to investigate how climate affects grassland vegetation from spatiotemporal perspectives. This method can efficiently eliminate the influence of other factors from detection factors when calculating the correlation between multiple factors and one variable [50].
where R is the correlation coefficient, n is the sequential year, xi represents the variables in year i, represents the mean value of the variable during the study period, and yi and represent the influence factor in year i and the mean value of the influence factor during the study period, respectively.
2.3.3. Geographical and Temporal Weighted Regression (GTWR) Model
Spatiotemporal models provide a basic framework for the spatial and temporal analysis of human activities, social events, and environmental processes. Geographical and temporal weighted regression (GWR) serves as a spatial statistical method widely used for modeling spatially heterogeneous processes. As the temporal extension of the GWR model, the GTWR incorporates temporal effects into the GWR model, and thus, it can effectively describe the quantitative relationship between the dependent variable and independent variable in time and space [51,52]. The coefficient represents the regression coefficient for each independent variable. Each independent variable has a corresponding coefficient that measures its impact on the dependent variable in the model [53]. The GTWR can be displayed as follows:
where is the spatiotemporal geographic coordinate of the variable at point j, Yj is the dependent variable, xjk is the kth independent variable, and εj is the error term. In this study, we used the GTWR model to measure the impact of six anthropogenic indicators on grassland GPP. The implementation of the GTWR model in this study is mainly based on ArcGIS 10.7 software, using the GTWR plugin made by Huang [54], and the bandwidth is optimized using AIC (Akaike Information Criterion) settings.
2.3.4. Lindeman Merenda Gold (LMG) Method
This study adopted the LMG method for quantifying the contribution of climate and multiple human activities to the GPP of grassland. The LMG method can quantify the direct contribution of each factor to variables in multifactor influence analysis. This method effectively overcomes the difference in the contribution rate caused by the order of influencing factors when inputting into the model [55]. The formula for LMG is as follows:
where refers to the factorial of the number of variables, denotes the regression model goodness, and is the increase in after the variable was added into the model by the order r. Therefore, to quantify the contributions of climate and anthropogenic impacts on grassland in China, we used the LMG model to calculate the contribution rate.
Overall, firstly, the S-M–K method was used to detect the variation of grassland GPP. Then, the correlation between climate factors and grassland GPP was analyzed using partial correlation analysis. Furthermore, the impact of human activities was measured using the GTWR method. Finally, the LMG model was used to quantify the contribution of climate factors and human activities to grassland dynamics. The workflow in this study is demonstrated in Figure 2.
3. Results
3.1. Spatiotemporal Variation in GPP in Chinese Grassland
The spatiotemporal trend of annual GPP from 2000 to 2018 in China’s main grassland-covered provinces (autonomous regions) was detected using the Sen-MK method (Figure 3 and Figure 4). Accordingly, the GPP in the study area clearly increased by 4.75 g C m−2 yr−1, and approximately 14.03% of the areas were significant, mainly distributed in northern SAX, middle NX, and eastern GS. The mean significant upward trend was 10.15 g C m−2 yr−1, especially in northern SAX, and the increasing trend was as high as 15.64 g C m−2 yr−1. Contrary to the increase, only 3.21% presented a significant downward trend, spatially distributed in XJ, TB, and IMG, and the average decreasing trend was −8.50 g C m−2 yr−1.
Among the 10 provinces (autonomous regions), 6 provinces, including HB, SX, SAX, GS, QH, and NX, had a significant increasing trend in GPP during 2000–2018. Among them, QH and SX had the lowest and highest increasing trends of 3.00 g C m−2 yr−1 and 14.00 g C m−2 yr−1, respectively. However, while most provinces (autonomous regions) showed an uptrend for GPP, XJ showed a decreasing trend of −0.22 g C m−2 yr−1. Although this trend was not significant, it should not be ignored.
3.2. The Effects of Climate Factors on Grassland GPP
PRE, TEM, and RAD, as the main climatic factors, had significant effects on grassland change. The Sen-MK trend detection results showed that the temporal trends of PRE, TEM, and RAD in the whole region had no significant trend during 2000–2018. Spatially, over 9.04% of the study area presented an obvious increasing trend of 9.38 mm yr−1, mostly distributed in the middle, northeast, and southwest of the study area (Figure 5a). In contrast, approximately 7.53% of the area showed the opposite trend (−11.48 mm yr−1), and these areas were concentrated in the northwest of the study area. Similar to PRE, nearly 9.71% and 7.61% of the study area had significant uptrends and downtrends, respectively (Figure 5c). Moreover, in the southwest of the study area, the central QH and SC experienced significant increases. Compared with PRE and RAD, only 9.48% of the study area had a significant downtrend, and most had an increasing trend (Figure 5e). Individual provinces (autonomous regions), including SX (5.73 mm yr−1), SAX (8.20 mm yr−1), GS (3.40 mm yr−1), SC (0.04 °C yr−1), and QH (0.04 °C yr−1), showed significant trends for PRE and TEM.
Based on the partial correlation analysis, the relationships between GPP and PRE, TEM, and RAD during 2000–2018 were identified (Figure 5b,d,f). Overall, among the three main climate factors, PRE played a major role in affecting GPP dynamics, with a positive correlation greater than 0.59, and these areas occupied nearly 13.79% of the study area, mainly in the middle and northeast regions. Moreover, the spatial distribution of the positive and negative effects of TEM and RAD on GPP was relatively consistent; an obvious positive correlation was found in the middle of the study area, that is, at the junction of QH, TB, and SC, and the negative effect was most significant in the northeast of the study area. The partial correlation analysis results of each province showed that, except for SC, TB, and QH, the GPP of grassland in seven provinces showed a significant positive correlation with PRE. However, only three provinces (autonomous regions), including SC, GS, and QH, had a significant positive correlation with TEM. In addition, there was no significant partial correlation between RAD and GPP at the provincial (autonomous regions) level.
3.3. The Effects of Human Activities on Grassland GPP
Human activities can also contribute to grassland variation. In the past 20 years, the social and economic factors have experienced considerable changes, and the variations in six socioeconomic factors are shown in Figure 6. The large livestock in all provinces (autonomous regions) showed an increasing trend before 2005 or 2006 and a decreasing trend after 2005 or 2006, except in IMG, QH, and NX. For sheep, the same trend as that of large livestock was shown in HB, SX, TB, SAX, and QH provinces (autonomous region), and an obvious increasing trend was shown in IMG, SC, GX, and NX provinces (autonomous regions). In addition, increases in both large livestock and sheep were observed in IMG and NX provinces (autonomous regions). The population and primary industry showed a relatively consistent growth trend. In addition, the area of forbidden grazing showed a rapid increase followed by a downward fluctuating trend in recent years. Furthermore, the area of rodent and pest control fluctuated greatly.
To reveal the effects of human activities on grassland vegetation variation, the GTRW method was used to detect the qualitative and quantitative effects of human activities on grassland GPP. The model fitted using GTWR had good performance, with R2 = 0.97. The temporal variation during 2000–2018 and spatial distribution of the multi-year mean of the coefficients are shown in Figure 6 and Figure 7, respectively. In general, the positive and negative effects of each socioeconomic factor on grassland were obviously different. Large livestock had a negative relationship with grassland GPP in most provinces (autonomous regions). Therefore, the coefficient showed an obvious weakening trend, with the number of large livestock decreasing in HB, SX, SC, and GS provinces and increasing in IMG, QH, and NX provinces (autonomous regions). The relationship of sheep with grassland GPP was mainly positive, consistent with the relationship of large livestock, and the coefficient of sheep showed a consistent weakening trend in many provinces (autonomous regions). The relationship between population and grassland GPP exhibited a positive correlation in all provinces. However, it weakened in HB, SX, and NMG and strengthened in SC, SAX, GS, QH, and NX provinces (autonomous regions). Moreover, there was an obvious fluctuation in TB and XJ, but the magnitude change at the beginning and end of the study was not significant. Furthermore, in provinces (autonomous regions) such as HB, SX, and IMG, the relationship between primary industry and grassland GPP shifted from positive to negative. In contrast, in SAX, GS, QH, NX, and XJ provinces (autonomous regions), this relationship transitioned from negative to positive. In most provinces, there was a negative correlation between forbidden grazing and grassland GPP. The negative correlation showed a weakening trend from approximately 2005 to 2015, but in recent years, this trend has rebounded. The relationship between pest and rodent control and grassland GPP was intricate, with alternating positive and negative impacts. Nevertheless, in SC and SAX provinces, this relationship notably transitioned from positive to negative.
3.4. The Contribution of Climate Factors and Human Activities to GPP
The contribution of climate and human activities to controlling changes in grassland GPP in each province (autonomous region) was calculated based on LMG methods (Figure 8). The variation in the GPP of grassland in China was dominated by human activities; seven provinces (autonomous regions) had a human activity contribution greater than 50%, especially on the Loess Plateau, including GS, SX, and SAX. However, the provinces (autonomous region) of SC (77.60%), QH (59.58%), and IMG (53.83%) were dominated by climate factors.
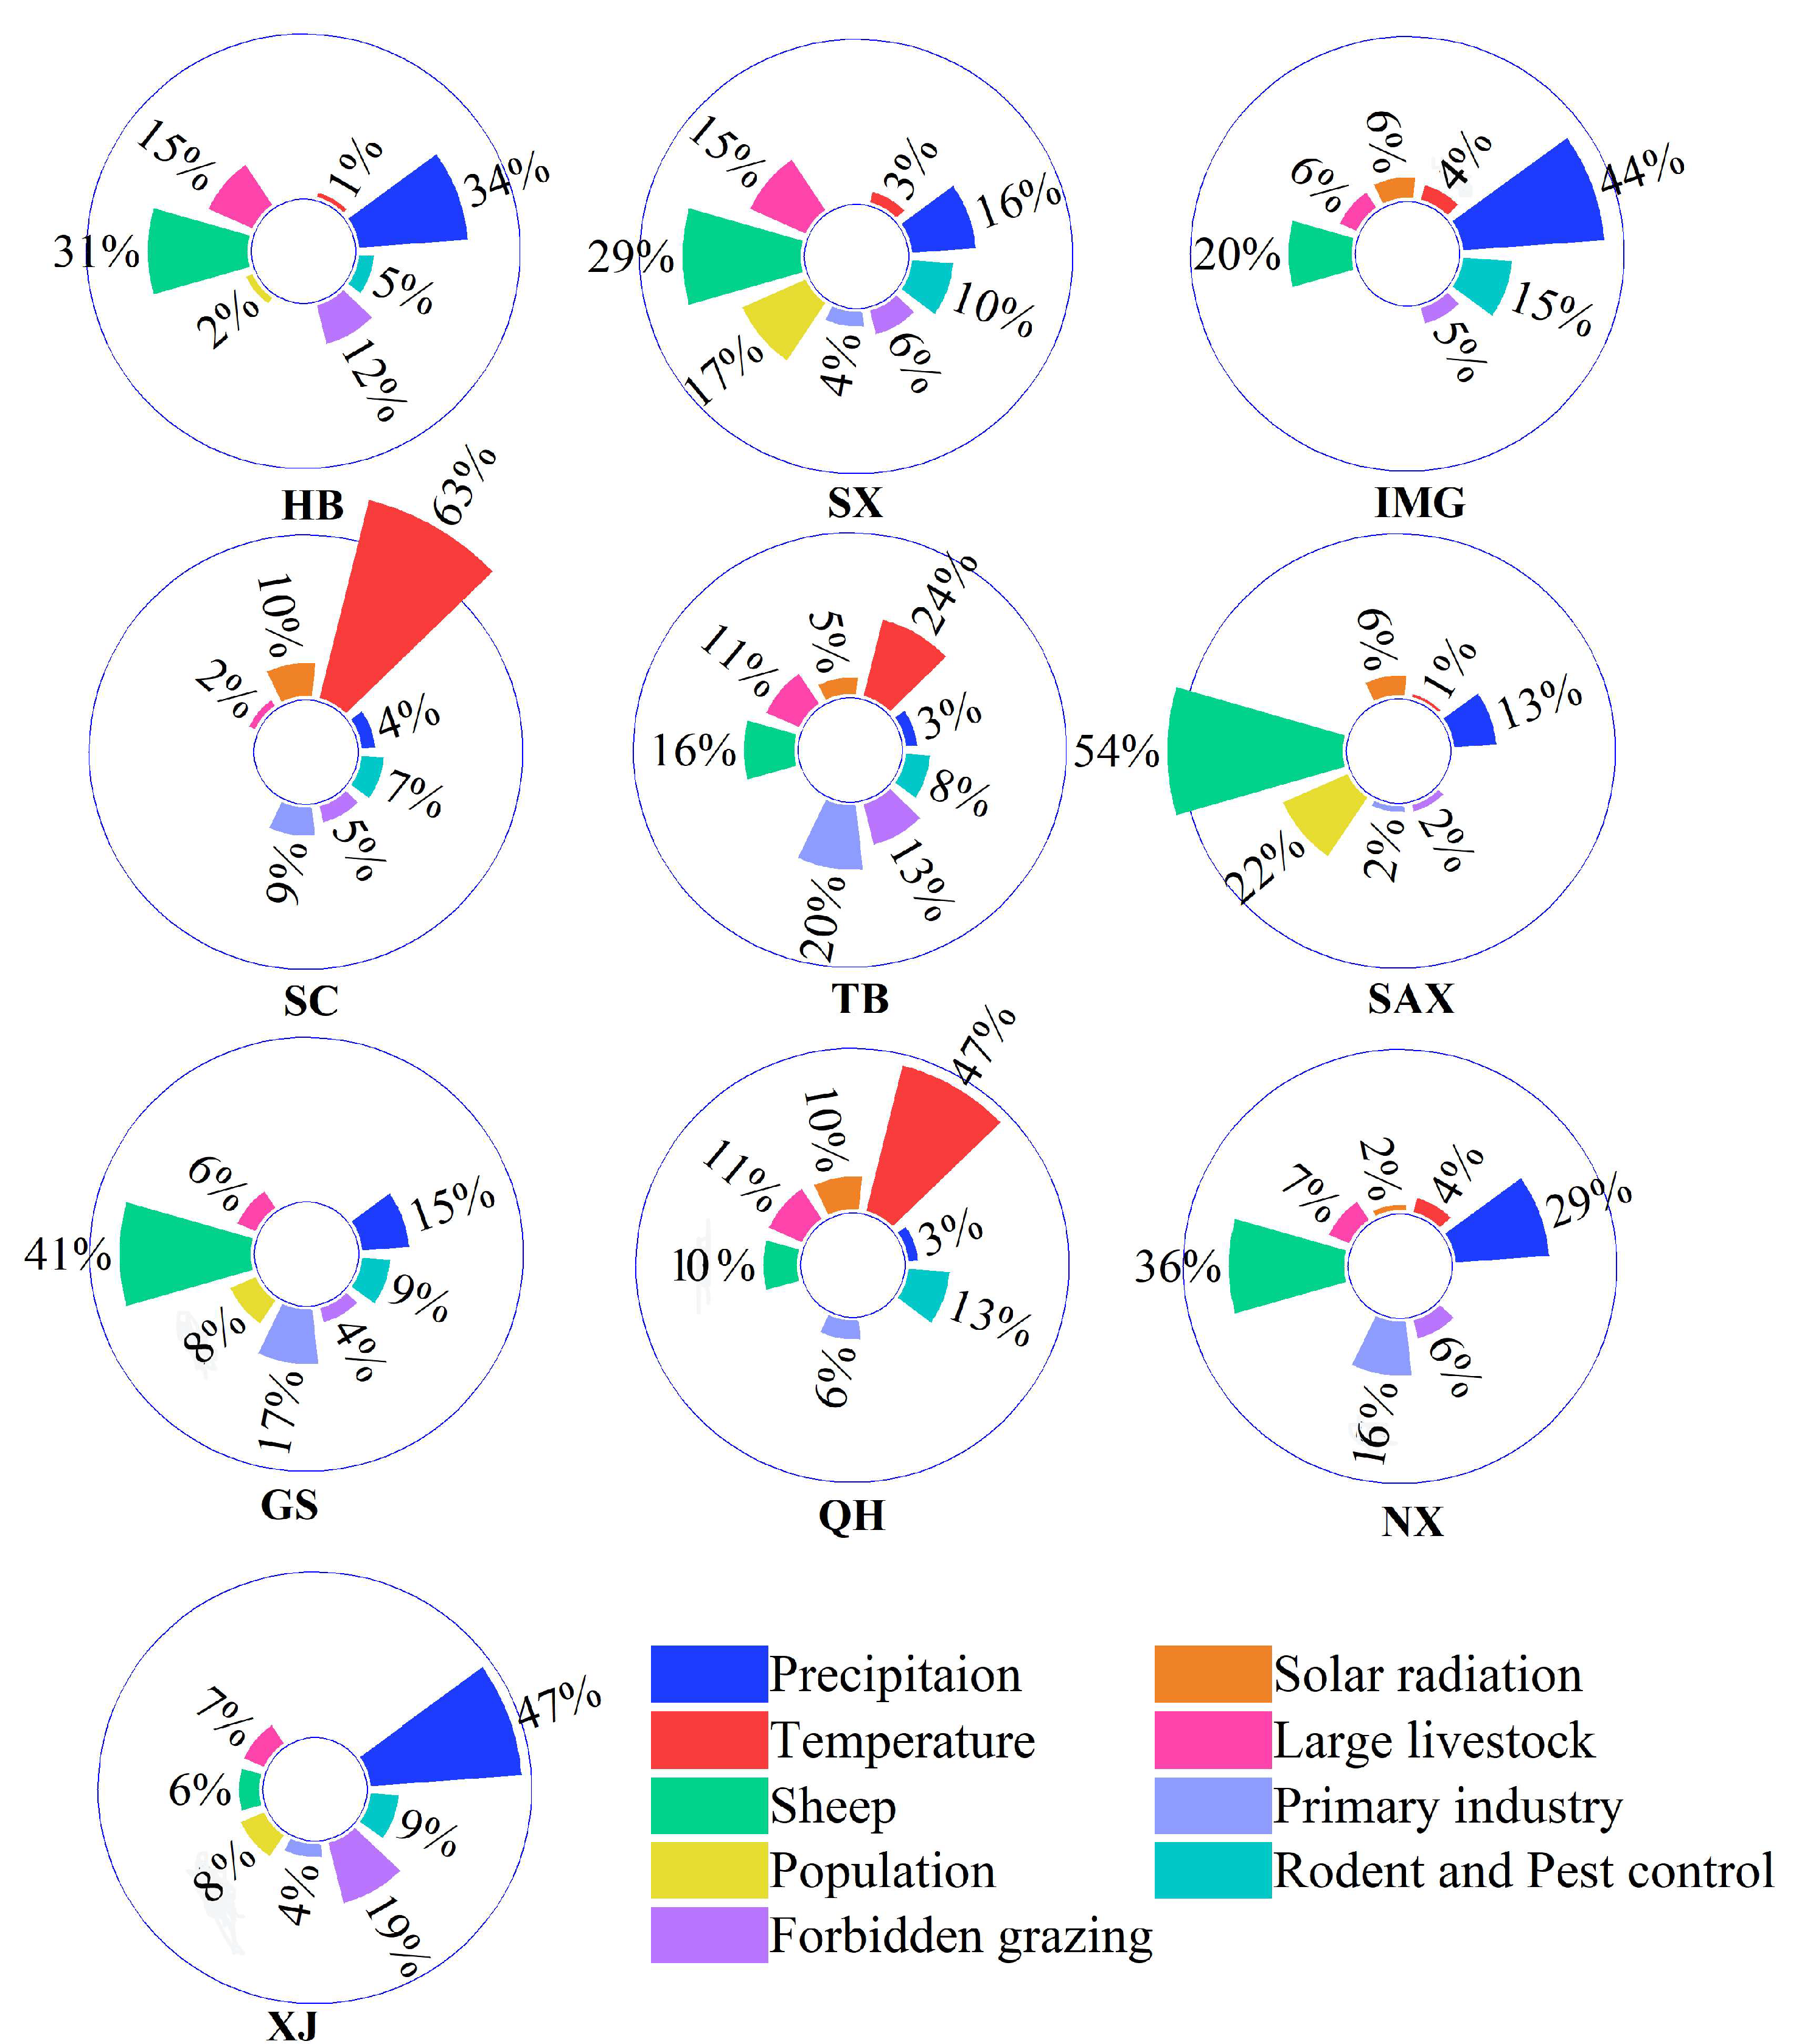
In terms of the overall impact of the three climate factors and six human activities, the effects of climate and human activities on grassland variation in different provinces (autonomous regions) were significantly different, as shown in the radar chart (Figure 9). Generally, sheep, PRE, and TEM were the primary factors affecting grassland dynamics, and they had the highest contribution to grassland dynamics in most provinces. Therefore, the sheep factor, which played a leading role in SAX, GS, NX, and SX provinces (autonomous regions), was most important on the Loess Plateau, and the contribution was greater than 50%. PRE and TEM were the dominant climate factors that played a dominant role in arid and semi-arid regions (including XJ, IMG, and HB provinces (autonomous region) and so on) and the Qinghai Tibet Plateau region (including TB, QH, and SC provinces (autonomous regions)), respectively. However, compared to sheep, PRE, TEM, RAD, large livestock, population, primary industry, forbidden grazing, and rodent and pest control contributed less. Moreover, the RAD, population, primary industry, forbidden grazing, and rodent and pest control factors contributed as the secondary contributing factors distributed in SC, SX, and SAX, TB and GX, XJ, and QH provinces (autonomous regions), respectively.
4. Discussion
The vegetation index is widely used to detect vegetation dynamics. Previous research has indicated that GPP is a more effective measure of the carbon sequestration capacity of vegetation, whereas the leaf area index (LAI) or the normalized difference vegetation index (NDVI) tends to signify the vegetation’s greenness [56,57]. Therefore, in this study, we used GPP as the vegetation indicator to research grassland variation. The results indicate that the degradation of Chinese grasslands has been effectively reversed in the past 20 years. The GPP of the grassland has shown a significantly increasing trend during 2000–2018 in most provinces (autonomous region), especially in SX, SAX, GS, and NX provinces (autonomous region), located on the Loess Plateau. These results are consistent with previous research based on remote sensing data such as the NDVI, LAI, and net primary productivity (NPP) [58,59]. Although an overall trend of grassland recovery in China was observed, the degradation of grassland in some regions cannot be ignored, such as in the northeastern region of the IMG autonomous region and the western region of the XJ autonomous region, where there are patches of grassland degradation. Many previous studies have confirmed this finding [57,60].
According to previous studies, climate and human activities remarkably impact grassland variation. In this study, we selected three climate factors and six socioeconomic factors as indicators to measure the impact intensity. The results show that the impacts of climate and socioeconomic factors on grassland in China had obvious spatiotemporal heterogeneity. In terms of climate factors, PRE was the primary climatic factor affecting grassland in China, followed by TEM. Grasslands are mostly in northern China, and this region is controlled by arid and semi-arid climates and limited by water resources [61,62]. Therefore, PRE is the main factor affecting northern grassland, and PRE was absolutely dominant in western XJ and parts of IMG and HB provinces (autonomous region). In recent decades, the amount and frequency of PRE have shown an upward trend [63,64]. In addition, the grasslands of China distributed on the Qinghai–Tibet Plateau, which has a high altitude, are controlled by the plateau climate. Previous studies have shown that with global changes, the TEM on the Qinghai–Tibet Plateau has warmed significantly over the past few decades, and accelerated warming could alleviate the restriction of microthermal conditions on the vegetation growth rate [65]. Therefore, the grassland in most areas of the Qinghai–Tibet Plateau has been shown to be in a state of recovery. However, in the northern part of the IMG autonomous region, which has a temperate continental climate, the increasing TEM has an inhibitory effect on grassland restoration in the region, and previous studies have shown similar results [66,67]. The reason for this phenomenon may be that the increased TEM leads to increased water evaporation, which accelerates the drying rate of the soil [68,69].
How human activities affect ecosystems is often difficult to measure, and they are difficult to express on spatial and temporal scales using specific data [70,71]. In this study, we chose six socioeconomic factors covering economic, population, livestock, and grassland conservation measures to reflect human activities, and based on the GTWR model and the LMG method, we quantified the effects and contribution of the grassland ecosystems. Grasslands are a fundamentally important source of food for livestock; however, the relationship between livestock and grassland is extremely complex. Previous studies have shown that moderate grazing can maintain a high level of ecosystem diversity in grassland ecosystems, while low or high grazing can have negative impacts [72]. Our research indicates that in the early stages of the study, i.e., 2000, there was a strong relationship (including positive and negative) between livestock (sheep and large livestock) and grassland, while in the late stages of the study, this relationship showed a weakening trend in most provinces. This might have occurred because the Chinese government began implementing a large-scale project of “returning grazing land to grassland” in 2003 to curb the deterioration of grassland ecosystems, and a series of measures like grazing prohibition, rotation, and rest were implemented on grassland [73,74]. It is worth noting that sheep have a higher contribution to the dynamics of grassland GPP in the Loess Plateau, especially in SAX and GS provinces. In the Loess Plateau, the main area for the implementation of ecological restoration policies in China, the scattered animal husbandry method was the main way of raising sheep before the implementation of ecological restoration policies. However, after the ecological restoration projects were implemented, the scattered animal husbandry method shifted to intensive farming, and the proportion of feed usage increased, effectively alleviating the pressure on the grassland [75,76]. Primary industry has a positive relationship with grassland GPP in the northwest region of China, such as SAX, GX, NX, QH, and XJ, and studies by Li [46] and Ren [77] have reached similar conclusions. Livestock husbandry is an important primary industry that relies on pasture areas. Although primitive grazing can generate economic income, it can also lead to grassland degradation. In recent years, with traditional grazing shifted to intensive farming and government ecosystem subsidies being directly disbursed, the dependence of herdsmen on grasslands for their production and livelihoods has decreased while their income has increased [78,79]. In addition, the coefficient of the forbidden grazing effect has had a consistent trend with the area of forbidden grazing. Although there was a negative relationship between forbidden grazing and grassland GPP in this research, when the area of forbidden grazing reached a certain level, the coefficient then had a positive effect. The area of rodent and pest control was closely related to the area where rodent and pest diseases occurred that year, so the area of rodent and pest control was negatively related to the GPP of grassland.
This study aimed to reveal the impact of human activities on grassland GPP using various socioeconomic data. However, due to the lack and inconsistency of statistical data at the county and city levels over many years, the collection of some indicator data has been limited. Therefore, the characteristics of spatial heterogeneity within the province cannot be reflected. In future research, we will strive to collect more accurate municipal or even county-level indicators to reveal the direct or indirect impact of socioeconomic factors on grassland ecosystems.
5. Conclusions
In this study, based on the GPP (gross primary productivity) and combining the climate (temperature, precipitation, solar radiation) and human factors (large livestock, sheep, population, primary industry, forbidden grazing, rodent and pest control), the variation, influence effects and contribution of grassland in 10 province s (autonomous region) were explored during 2000–2018. According to the study results, the GPP showed a significant upward tendency (4.75 g C m−2 yr−1), especially in Shaanxi Province. Furthermore, partial correlation analysis, the geographical and temporal weighted regression model, and the Lindeman Merenda Gold method revealed that sheep, as the main type of human activity, had a higher contribution in Shaanxi, Gansu, Ningxia, and Shanxi Provinces (autonomous region), located on the Loess Plateau, and temperature and precipitation were the main climate factors and had a higher contribution in arid and semi-arid regions (including Xinjiang, Inner Mongolia and Hebei Provinces (autonomous region) and the Qinghai Tibet Plateau region (including Tibet, Qinghai, and Sichuan Provinces (autonomous region)). Overall, the grassland in the study area is primarily affected by human activities, with seven provinces (autonomous regions) having a contribution of human activity greater than 50%. Therefore, these results indicate that grassland in China has shown a restoration trend, and human activities, including returning farmland to grassland and grazing prohibition, have played a positive role in grassland restoration. These findings can support decision-making for implementing further ecological restoration policies.
Author Contributions
Conceptualization, Y.X. and J.H.; methodology, Y.X.; software, G.X. and Y.M.; writing and editing, Y.X. and H.L. All authors contributed to the editing of the manuscript. All authors have read and agreed to the published version of the manuscript.
Funding
This research was funded by the Tianchi Doctor Program of the Xinjiang Uygur Autonomous Region under Grant (Grant Number: TCBS202140) and the Ph.D. Start-up Fund in Xinjiang University (Grant Number: 620321046), and the National Natural Science Foundation of China (Grant Numbers: 42001219, 42101104).
Data Availability Statement
No new data were created or analyzed in this study. Data sharing is not applicable to this article.
Acknowledgments
We are sincerely grateful to the reviewers and editors for their constructive comments towards the improvement of the manuscript.
Conflicts of Interest
The authors declare no conflict of interest.
References
- Deng, L.; Shangguan, Z.P.; Wu, G.L.; Chang, X.F. Effects of Grazing Exclusion on Carbon Sequestration in China’s Grassland. Earth Sci. Rev. 2017, 173, 84–95. [Google Scholar] [CrossRef]
- Kemp, D.; Han, G.D.; Hou, X.Y.; Michalk, D.L.; Hou, F.J.; Wu, J.P.; Zhang, Y.J. Innovative Grassland Management Systems for Environmental and Livelihood Benefits. Proc. Natl. Acad. Sci. USA 2013, 110, 8369–8374. [Google Scholar] [CrossRef] [PubMed]
- Bazzoffi, P. Soil Erosion Tolerance and Water Runoff Control: Minimum Environmental Standards. Reg. Environ. Change 2009, 9, 169–179. [Google Scholar] [CrossRef]
- Liang, W.; Lü, Y.H.; Zhang, W.B.; Li, S.; Zhao, J.; Ciais, P.; Fu, B.J.; Wang, S.; Yan, J.W.; Li, J.Y.; et al. Grassland gross carbon dioxide uptake based on an improved model tree ensemble approach considering human interventions: Global estimation and covariation with climate. Glob. Change Biol. 2017, 23, 2720–2742. [Google Scholar] [CrossRef]
- Han, D.M.; Wang, G.Q.; Xue, B.L.; Liu, T.X.; Yinglan, A.; Xu, X.Y. Evaluation of semiarid grassland degradation in North China from multiple perspectives. Ecol. Eng. 2018, 112, 41–50. [Google Scholar] [CrossRef]
- Bardgett, R.D.; Bullock, J.M.; Lavorel, S.; Manning, P.; Schaffner, U.; Ostle, N.; Chomel, M.; Durigan, G.; Fry, E.L.; Johnson, D.; et al. Combatting global grassland degradation. Nat. Rev. Earth Environ. 2021, 2, 720–735. [Google Scholar] [CrossRef]
- Zhang, C.X.; Wang, X.M.; Li, J.C.; Hua, T. Identifying the effect of climate change on desertification in northern China via trend analysis of potential evapotranspiration and precipitation. Ecol. Indic. 2020, 112, 106141. [Google Scholar] [CrossRef]
- Dass, P.; Rawlins, M.A.; Kimball, J.S.; Kim, Y. Environmental controls on the increasing GPP of terrestrial vegetation across northern Eurasia. Biogeosciences 2016, 13, 45–62. [Google Scholar] [CrossRef] [Green Version]
- Gebremichael, M.; Barros, A.P. Evaluation of MODIS gross primary productivity (GPP) in tropical monsoon regions. Remote Sens. Environ. 2006, 100, 150–166. [Google Scholar] [CrossRef]
- He, P.X.; Ma, X.L.; Meng, X.Y.; Han, Z.M.; Liu, H.X.; Sun, Z.J. Spatiotemporal evolutionary and mechanism analysis of grassland GPP in China. Ecol. Indic. 2022, 143, 109323. [Google Scholar] [CrossRef]
- Zhou, W.; Yang, H.; Huang, L.; Chen, C.; Lin, X.S.; Hu, Z.J.; Li, J.L. Grassland degradation remote sensing monitoring and driving factors quantitative assessment in China from 1982 to 2010. Ecol. Indic. 2017, 83, 303–313. [Google Scholar] [CrossRef]
- Wang, Z.Q.; Zhang, Y.Z.; Yang, Y.; Zhou, W.; Gang, C.C.; Zhang, Y.; Li, J.L.; An, R.; Wang, K.; Odeh, I.; et al. Quantitative assess the driving forces on the grassland degradation in the Qinghai–Tibet Plateau, in China. Ecol. Inf. 2016, 33, 32–44. [Google Scholar] [CrossRef]
- Chen, B.X.; Zhang, X.Z.; Tao, J.; Wu, J.S.; Wang, J.S.; Shi, P.L.; Zhang, Y.J.; Yu, C.Q. The impact of climate change and anthropogenic activities on alpine grassland over the Qinghai-Tibet Plateau. Agric. For. Meteorol. 2014, 189, 11–18. [Google Scholar] [CrossRef]
- Liu, Y.Y.; Wang, Q.; Zhang, Z.Y.; Tong, L.J.; Wang, Z.Q.; Li, J.L. Grassland dynamics in responses to climate variation and human activities in China from 2000 to 2013. Sci. Total Environ. 2019, 690, 27–39. [Google Scholar] [CrossRef]
- Zhou, Z.H.; Jin, J.X.; Yong, B.; Yu, L. Quantifying the influences of climate change and human activities on the grassland in the Southwest Transboundary Basin, China. J. Environ. Manag. 2022, 319, 115612. [Google Scholar] [CrossRef]
- Gang, C.C.; Zhou, W.; Chen, Y.Z.; Wang, Z.Q.; Sun, Z.G.; Li, J.L.; Qi, J.G.; Odeh, L. Quantitative assessment of the contributions of climate change and human activities on global grassland degradation. Environ. Earth Sci. 2014, 72, 4273–4282. [Google Scholar] [CrossRef]
- Zhang, R.Y.; Wang, Z.W.; Han, G.D.; Schellenberg, M.P.; Wu, Q.; Gu, C. Grazing induced changes in plant diversity is a critical factor controlling grassland productivity in the Desert Steppe, Northern China. Agric. Ecosyst. Environ. 2018, 265, 73–83. [Google Scholar] [CrossRef]
- Höglind, M.; Van Oijen, M.; Cameron, D.; Persson, T. Process-based simulation of growth and overwintering of grassland using the BASGRA model. Ecol. Modell. 2016, 335, 1–15. [Google Scholar] [CrossRef] [Green Version]
- Li, L.H.; Zhang, Y.L.; Liu, L.S.; Wu, J.S.; Li, S.C.; Zhang, H.Y.; Zhang, B.H.; Ding, M.J.; Wang, Z.F.; Paudel, B. Current challenges in distinguishing climatic and anthropogenic contributions to alpine grassland variation on the Tibetan Plateau. Ecol. Evol. 2018, 8, 5949–5963. [Google Scholar] [CrossRef]
- Zhu, G.Y.; Tang, Z.S.; Chen, L.; Shangguan, Z.P.; Deng, L. Overgrazing depresses soil carbon stock through changing plant diversity in temperate grassland of the Loess Plateau. Plant Soil Environ. 2018, 64, 1–6. [Google Scholar] [CrossRef] [Green Version]
- Zhang, Y.Z.; Wang, Q.; Wang, Z.Q.; Yang, Y.; Li, J.L. Impact of human activities and climate change on the grassland dynamics under different regime policies in the Mongolian Plateau. Sci. Total Environ. 2020, 698, 134304. [Google Scholar] [CrossRef] [PubMed]
- Fang, X.N.; Wu, J.G.; He, C.Y. Assessing human-environment system sustainability based on Regional Safe and Just Operating Space: The case of the Inner Mongolia Grassland. Environ. Sci. Policy 2021, 116, 276–286. [Google Scholar] [CrossRef]
- Li, S.Y.; Verburg, P.H.; Lv, S.H.; Wu, J.G.; Li, X.B. Spatial analysis of the driving factors of grassland degradation under conditions of climate change and intensive use in Inner Mongolia, China. Reg. Environ. Change 2012, 12, 461–474. [Google Scholar] [CrossRef]
- Robinson, B.E.; Li, P.; Hou, X.Y. Institutional change in social-ecological systems: The evolution of grassland management in Inner Mongolia. Glob. Environ. Change 2017, 47, 64–75. [Google Scholar] [CrossRef]
- Hu, Z.M.; Li, S.G.; Guo, Q.; Niu, S.L.; He, N.P.; Li, L.H.; Yu, G.R. A synthesis of the effect of grazing exclusion on carbon dynamics in grasslands in China. Glob. Change Biol. 2016, 22, 1385–1393. [Google Scholar] [CrossRef]
- Irisarri, G.; Derner, J.; Porensky, L.M.G.; Mueller, K. Grazing Intensity Differentially Regulates Anpp Response to recipitation in North American Semiarid Grasslands. Ecol. Appl. 2016, 26, 1370–1380. [Google Scholar] [CrossRef] [Green Version]
- Nan, Z. The grassland farming system and sustainable agricultural development in China. Grassland Sci. 2005, 51, 15–19. [Google Scholar] [CrossRef]
- Su, R.; Yu, T.; Dayananda, B.; Bu, R.; Su, J.H.; Fan, Q.Y. Impact of climate change on primary production of Inner Mongolian grasslands. Glob. Ecol. Conserv. 2020, 22, e00928. [Google Scholar] [CrossRef]
- Feng, X.L.; Tang, J.J.; Qiu, H.G. The effect of grassland transfer on herders’ livestock production and grazing intensity in Inner Mongolia and Gansu, China. China Agric. Econ. Rev. 2022, 14, 242–258. [Google Scholar] [CrossRef]
- Balasubramanian, D.; Zhou, W.J.; Ji, H.L.; Grace, J.; Bai, X.L.; Song, Q.H.; Liu, Y.T.; Sha, L.Q.; Fei, X.H.; Zhang, X.; et al. Environmental and management controls of soil carbon storage in grasslands of southwestern China. J. Environ. Manag. 2020, 254, 109810. [Google Scholar] [CrossRef]
- Liu, Y.; Liu, H.H.; Chen, Y.; Gang, C.C.; Shen, Y.F. Quantifying the contributions of climate change and human activities to vegetation dynamic in China based on multiple indices. Sci. Total Environ. 2022, 838, 156553. [Google Scholar] [CrossRef]
- Xie, S.D.; Mo, X.G.; Hu, S.; Liu, S.X. Contributions of climate change, elevated atmospheric CO2 and human activities to ET and GPP trends in the Three-North Region of China. Agric. For. Meteorol. 2022, 295, 108183. [Google Scholar] [CrossRef]
- Yan, H.M.; Xue, Z.C.; Niu, Z.G. Ecological restoration policy should pay more attention to the high productivity grasslands. Ecol. Indic. 2021, 129, 107938. [Google Scholar] [CrossRef]
- Zheng, K.; Wei, J.Z.; Pei, J.Y.; Cheng, H.; Zhang, X.L.; Huang, F.Q.; Li, M.F.; Ye, J.S. Impacts of climate change and human activities on grassland vegetation variation in the Chinese Loess Plateau. Sci. Total Environ. 2019, 660, 236–244. [Google Scholar] [CrossRef]
- Yang, Y.; Wang, Z.Q.; Li, J.L.; Gang, C.C.; Zhang, Y.Z.; Zhang, Y.; Odeh, I.; Qi, J. Comparative assessment of grassland degradation dynamics in response to climate variation and human activities in China, Mongolia, Pakistan and Uzbekistan from 2000 to 2013. J. Arid. Environ. 2016, 135, 164–172. [Google Scholar] [CrossRef]
- Wu, B.F.; Xu, W.T.; Yang, C.Z.; Xu, W.B. Combining spot4-vegetation and meteorological data derived land cover map in China. IEEE Geosci. Remote Sens. Symp. 2004, 4, 2672–2675. [Google Scholar]
- National Earth System Science Data Center. National Science & Technology Infrastructure of China. Available online: http://www.geodata.cn (accessed on 8 October 2022).
- Liang, S.L.; Zhao, X.; Liu, S.H.; Yuan, W.P.; Cheng, X.; Xiao, Z.Q.; Zhang, X.T.; Liu, Q.; Cheng, J.; Tang, H.R.; et al. A Long-term Global LAnd Surface Satellite (GLASS) Dataset for Environmental Studies. Int. J. Digit. Earth 2013, 6, 5–33. [Google Scholar] [CrossRef]
- Liang, S.L.; Cheng, J.; Jia, K.; Jiang, B.; Zhou, J. The global land surface satellite (glass) product suite. Bull. Am. Meteorol. Soc. 2020, 102, E323–E337. [Google Scholar] [CrossRef]
- Yu, T.; Sun, R.; Xiao, Z.Q.; Zhang, Q.; Liu, G.; Cui, T.X.; Wang, J.M. Estimation of global vegetation productivity from global land surface satellite data. Remote Sens. 2018, 10, 327. [Google Scholar] [CrossRef] [Green Version]
- Yang, K.; He, J. China Meteorological Forcing Dataset (1979–2018); National Tibetan Plateau Data Center: Beijing, China, 2019; Available online: https://data.tpdc.ac.cn/zh-hans/data/8028b944-daaa-4511-8769-965612652c49/ (accessed on 8 October 2022).
- Yang, J.; Huang, X. The 30 m annual land cover dataset and its dynamics in China from 1990 to 2019. Earth Syst. Sci. Data 2021, 13, 3907–3925. [Google Scholar] [CrossRef]
- Xu, G.C.; Kang, M.Y.; Jiang, Y. Adaptation to the policy-oriented livelihood change in Xilingol grassland, Northern China. Procedia Environ. Sci. 2012, 13, 1668–1683. [Google Scholar] [CrossRef] [Green Version]
- Su, J.; Xu, F.; Zhang, Y. Grassland biodiversity and ecosystem functions benefit more from cattle than sheep in mixed grazing: A meta-analysis. J. Environ. Manag. 2023, 337, 117769. [Google Scholar] [CrossRef] [PubMed]
- Kang, L.; Han, X.G.; Zhang, Z.B.; Sun, O.J. Grassland ecosystems in China: Review of current knowledge and research advancement. Philos. Trans. R. Soc. B Biol. Sci. 2007, 362, 997–1008. [Google Scholar] [CrossRef] [PubMed]
- Li, T.; Lü, Y.H.; Fu, B.J.; Comber, A.J.; Harris, P.; Wu, L.H. Gauging policy-driven large-scale vegetation restoration programmes under a changing environment: Their effectiveness and socio-economic relationships. Sci. Total Environ. 2017, 607, 911–919. [Google Scholar] [CrossRef] [Green Version]
- Sen, P.K. Estimates of the regression coefficient based on Kendall’s tau. J. Am. Stat. Assoc. 1968, 63, 1379–1389. [Google Scholar] [CrossRef]
- Zuo, Y.F.; Li, Y.H.; He, K. Temporal and spatial variation characteristics of vegetation coverage and quantitative analysis of its potential driving forces in the Qilian Mountains, China, 2000–2020. Ecol. Indic. 2022, 143, 109429. [Google Scholar] [CrossRef]
- Kendall, M.G. Rank Correlation Methods; Griffin: London, UK, 1970. [Google Scholar]
- Mancino, G.; Console, R.; Greco, M.; Lacovino, C.; Trivigno, L.M.; Falciano, A. Assessing vegetation decline due to pollution from solid waste management by a multitemporal remote sensing approach. Remote Sens. 2022, 14, 428. [Google Scholar] [CrossRef]
- Wen, Y.Y.; Liu, X.P.; Xin, Q.C.; Wu, J.; Xu, X.C.; Pei, F.S.; Li, X.; Du, G.M.; Cai, Y.L.; Lin, K.; et al. Cumulative effects of climatic factors on terrestrial vegetation growth. J. Geophys. Res. Biogeosci. 2019, 124, 789–806. [Google Scholar] [CrossRef]
- Fotheringham, A.S.; Crespo, R.; Yao, J. Geographical and temporal weighted regression (GTWR). Geogr. Anal. 2015, 47, 431–452. [Google Scholar] [CrossRef]
- Brunsdon, C.; Fotheringham, A.S.; Charlton, M.E. Geographically weighted regression: A method for exploring spatial nonstationarity. Geogr. Anal. 1996, 28, 281–298. [Google Scholar] [CrossRef]
- Huang, B.; Wu, B.; Barry, M. Geographically and temporally weighted regression for modeling spatio-temporal variation in house prices. Int. J. Geogr. Inf. Sci. 2010, 24, 383–401. [Google Scholar] [CrossRef]
- Gromping, U. Relative importance for linear regression in R: Te package relaimpo. J. Stat. Sofw. 2006, 17, 1–27. [Google Scholar]
- Bai, Y.; Li, S.G.; Liu, M.H.; Guo, Q. Assessment of vegetation change on the Mongolian Plateau over three decades using different remote sensing products. J. Environ. Manag. 2022, 317, 115509. [Google Scholar] [CrossRef]
- Xue, Y.Y.; Zhang, B.Q.; He, C.S.; Shao, R. Detecting Vegetation Variations and Main Drivers over the Agropastoral Ecotone of Northern China through the Ensemble Empirical Mode Decomposition Method. Remote Sens. 2019, 11, 1860. [Google Scholar] [CrossRef] [Green Version]
- Lin, X.N.; Niu, J.Z.; Berndtsson, R.; Yu, X.X.; Zhang, L.; Chen, X.W. NDVI dynamics and its response to climate change and reforestation in northern China. Remote Sens. 2020, 12, 4138. [Google Scholar] [CrossRef]
- Liu, Y.Y.; Zhou, R.L.; Ren, H.Y.; Zhang, W.; Zhang, Z.X.; Zhang, Z.Y.; Wen, Z.M. Evaluating the dynamics of grassland net primary productivity in response to climate change in China. Glob. Ecol. Conserv. 2021, 28, e01574. [Google Scholar] [CrossRef]
- Xue, J.; Wang, Y.Y.; Teng, H.F.; Wang, N.; Li, D.L.; Peng, J.; Biswas, A.; Shi, Z. Dynamics of Vegetation Greenness and Its Response to Climate Change in Xinjiang over the Past Two Decades. Remote Sens. 2021, 13, 4063. [Google Scholar] [CrossRef]
- Bai, X.; Zhao, W.; Wang, J.; Ferreira, C.S.S. Precipitation drives the floristic composition and diversity of temperate grasslands in China. Glob. Ecol. Conserv. 2021, 32, e01933. [Google Scholar] [CrossRef]
- Yan, Y.C.; Liu, X.P.; Wen, Y.Y.; Ou, J.P. Quantitative analysis of the contributions of climatic and human factors to grassland productivity in northern China. Ecol. Indic. 2019, 103, 542–553. [Google Scholar] [CrossRef]
- Zhou, B.T.; Xu, Y.; Wu, J.; Dong, S.Y.; Shi, Y. Changes in temperature and precipitation extreme indices over China: Analysis of a high-resolution grid dataset. Int. J. Climatol. 2016, 36, 1051–1066. [Google Scholar] [CrossRef]
- Yang, X.L.; Zhou, B.T.; Xu, Y.; Han, Z.Y. CMIP6 evaluation and projection of temperature and precipitation over China. Adv. Atmos. Sci. 2021, 38, 817–830. [Google Scholar] [CrossRef]
- Li, L.H.; Zhang, Y.L.; Wu, J.S.; Li, S.C.; Zhang, B.H.; Zu, J.X.; Zhang, H.M.; Ding, M.J.; Paudel, B. Increasing sensitivity of alpine grasslands to climate variability along an elevational gradient on the Qinghai-Tibet Plateau. Sci. Total Environ. 2019, 678, 21–29. [Google Scholar] [CrossRef] [PubMed]
- Wei, P.; Xu, L.; Pan, X.B.; Hu, Q.; Li, Q.Y.; Zhang, Y.T.; Shao, C.X.; Wang, C.C.; Wang, X.X. Spatio-temporal variations in vegetation types based on a climatic grassland classification system during the past 30 years in Inner Mongolia, China. Catena 2020, 185, 104298. [Google Scholar] [CrossRef]
- Xue, Y.Y.; Liang, H.B.; Zhang, B.Q.; He, C.S. Vegetation restoration dominated the variation of water use efficiency in China. J. Hydrol. 2022, 612, 128257. [Google Scholar] [CrossRef]
- Trenberth, K.E. Changes in precipitation with climate change. Clim. Res. 2011, 47, 123–138. [Google Scholar] [CrossRef] [Green Version]
- Russi, L.; Cocks, P.S.; Roberts, E.H. The fate of legume seeds eaten by sheep from a Mediterranean grassland. J. App. Ecol. 1992, 29, 772–778. [Google Scholar] [CrossRef]
- Isbell, F.; Gonzalez, A.; Loreau, M.; Cowles, J.; Díaz, S.; Hector, A.; Mace, G.M.; Wardle, D.A.; O’Connor, M.I.; Duffy, J.E.; et al. Linking the influence and dependence of people on biodiversity across scales. Nature 2017, 546, 65–72. [Google Scholar] [CrossRef] [Green Version]
- Zscheischler, J.; Martius, O.; Westra, S.; Bevacqua, E.; Raymond, C.; Horton, R.M.; van den Hurk, B.; AghaKouchak, A.; Jézéquel, A.; Mahecha, M.D.; et al. A typology of compound weather and climate events. Nat. Rev. Earth Environ. 2020, 1, 333–347. [Google Scholar] [CrossRef]
- Zhang, X.D.; Ye, P.; Wu, Y.J.; Zhai, E.C. Experimental study on simultaneous heat-water-salt migration of bare soil subjected to evaporation. J. Hydrol. 2022, 609, 127710. [Google Scholar] [CrossRef]
- Wang, X.J.; Pan, S.F.; Pan, N.Q.; Pan, P.P. Grassland productivity response to droughts in northern China monitored by satellite-based solar-induced chlorophyll fluorescence. Sci. Total Environ. 2022, 830, 154550. [Google Scholar] [CrossRef]
- Zhou, W.; Li, H.R.; Xie, L.J.; Nie, X.M.; Wang, Z.; Du, Z.P.; Yue, T.X. Remote sensing inversion of grassland aboveground biomass based on high accuracy surface modeling. Ecol. Indic. 2021, 121, 107215. [Google Scholar] [CrossRef]
- Li, X.L.; Yuan, Q.H.; Wan, L.Q.; He, F. Perspectives on livestock production systems in China. Rangel. J. 2008, 30, 211–220. [Google Scholar] [CrossRef]
- Yu, H.; Wang, G.X.; Yang, Y.; Bai, Z.Y.; Liu, B.T.; Zhang, T.G.; Xu, Y.X.; Lu, Y.Q. Enhancing ecological value through sustainable food supply of grasslands in the Three-River-Source National Park, Tibet Plateau, China. Ecosyst. Serv. 2020, 46, 101218. [Google Scholar] [CrossRef]
- Ren, Y.J.; Lü, Y.H.; Fu, B.J.; Comber, A.; Li, T.; Hu, J. Driving factors of land change in china’s loess plateau: Quantification using geographically weighted regression and management implications. Remote Sens. 2020, 12, 453. [Google Scholar] [CrossRef] [Green Version]
- Ding, W.Q.; Jimoh, S.O.; Hou, X.Y.; Shu, X.H.; Dong, H.B.; Bolormaa, D.; Wang, D.B. Grassland ecological subsidy policy and livestock reduction behavior: A case study of herdsmen in northern China. Rangel. Ecol. Manag. 2022, 81, 78–85. [Google Scholar] [CrossRef]
- Hu, Y.M.; Huang, J.K.; Hou, L.L. Impacts of the grassland ecological compensation policy on household livestock production in China: An empirical study in Inner Mongolia. Ecol. Econ. 2019, 161, 248–256. [Google Scholar] [CrossRef]
Figure 1.
Land use types (a) and main grassland areas (b) in the study area.
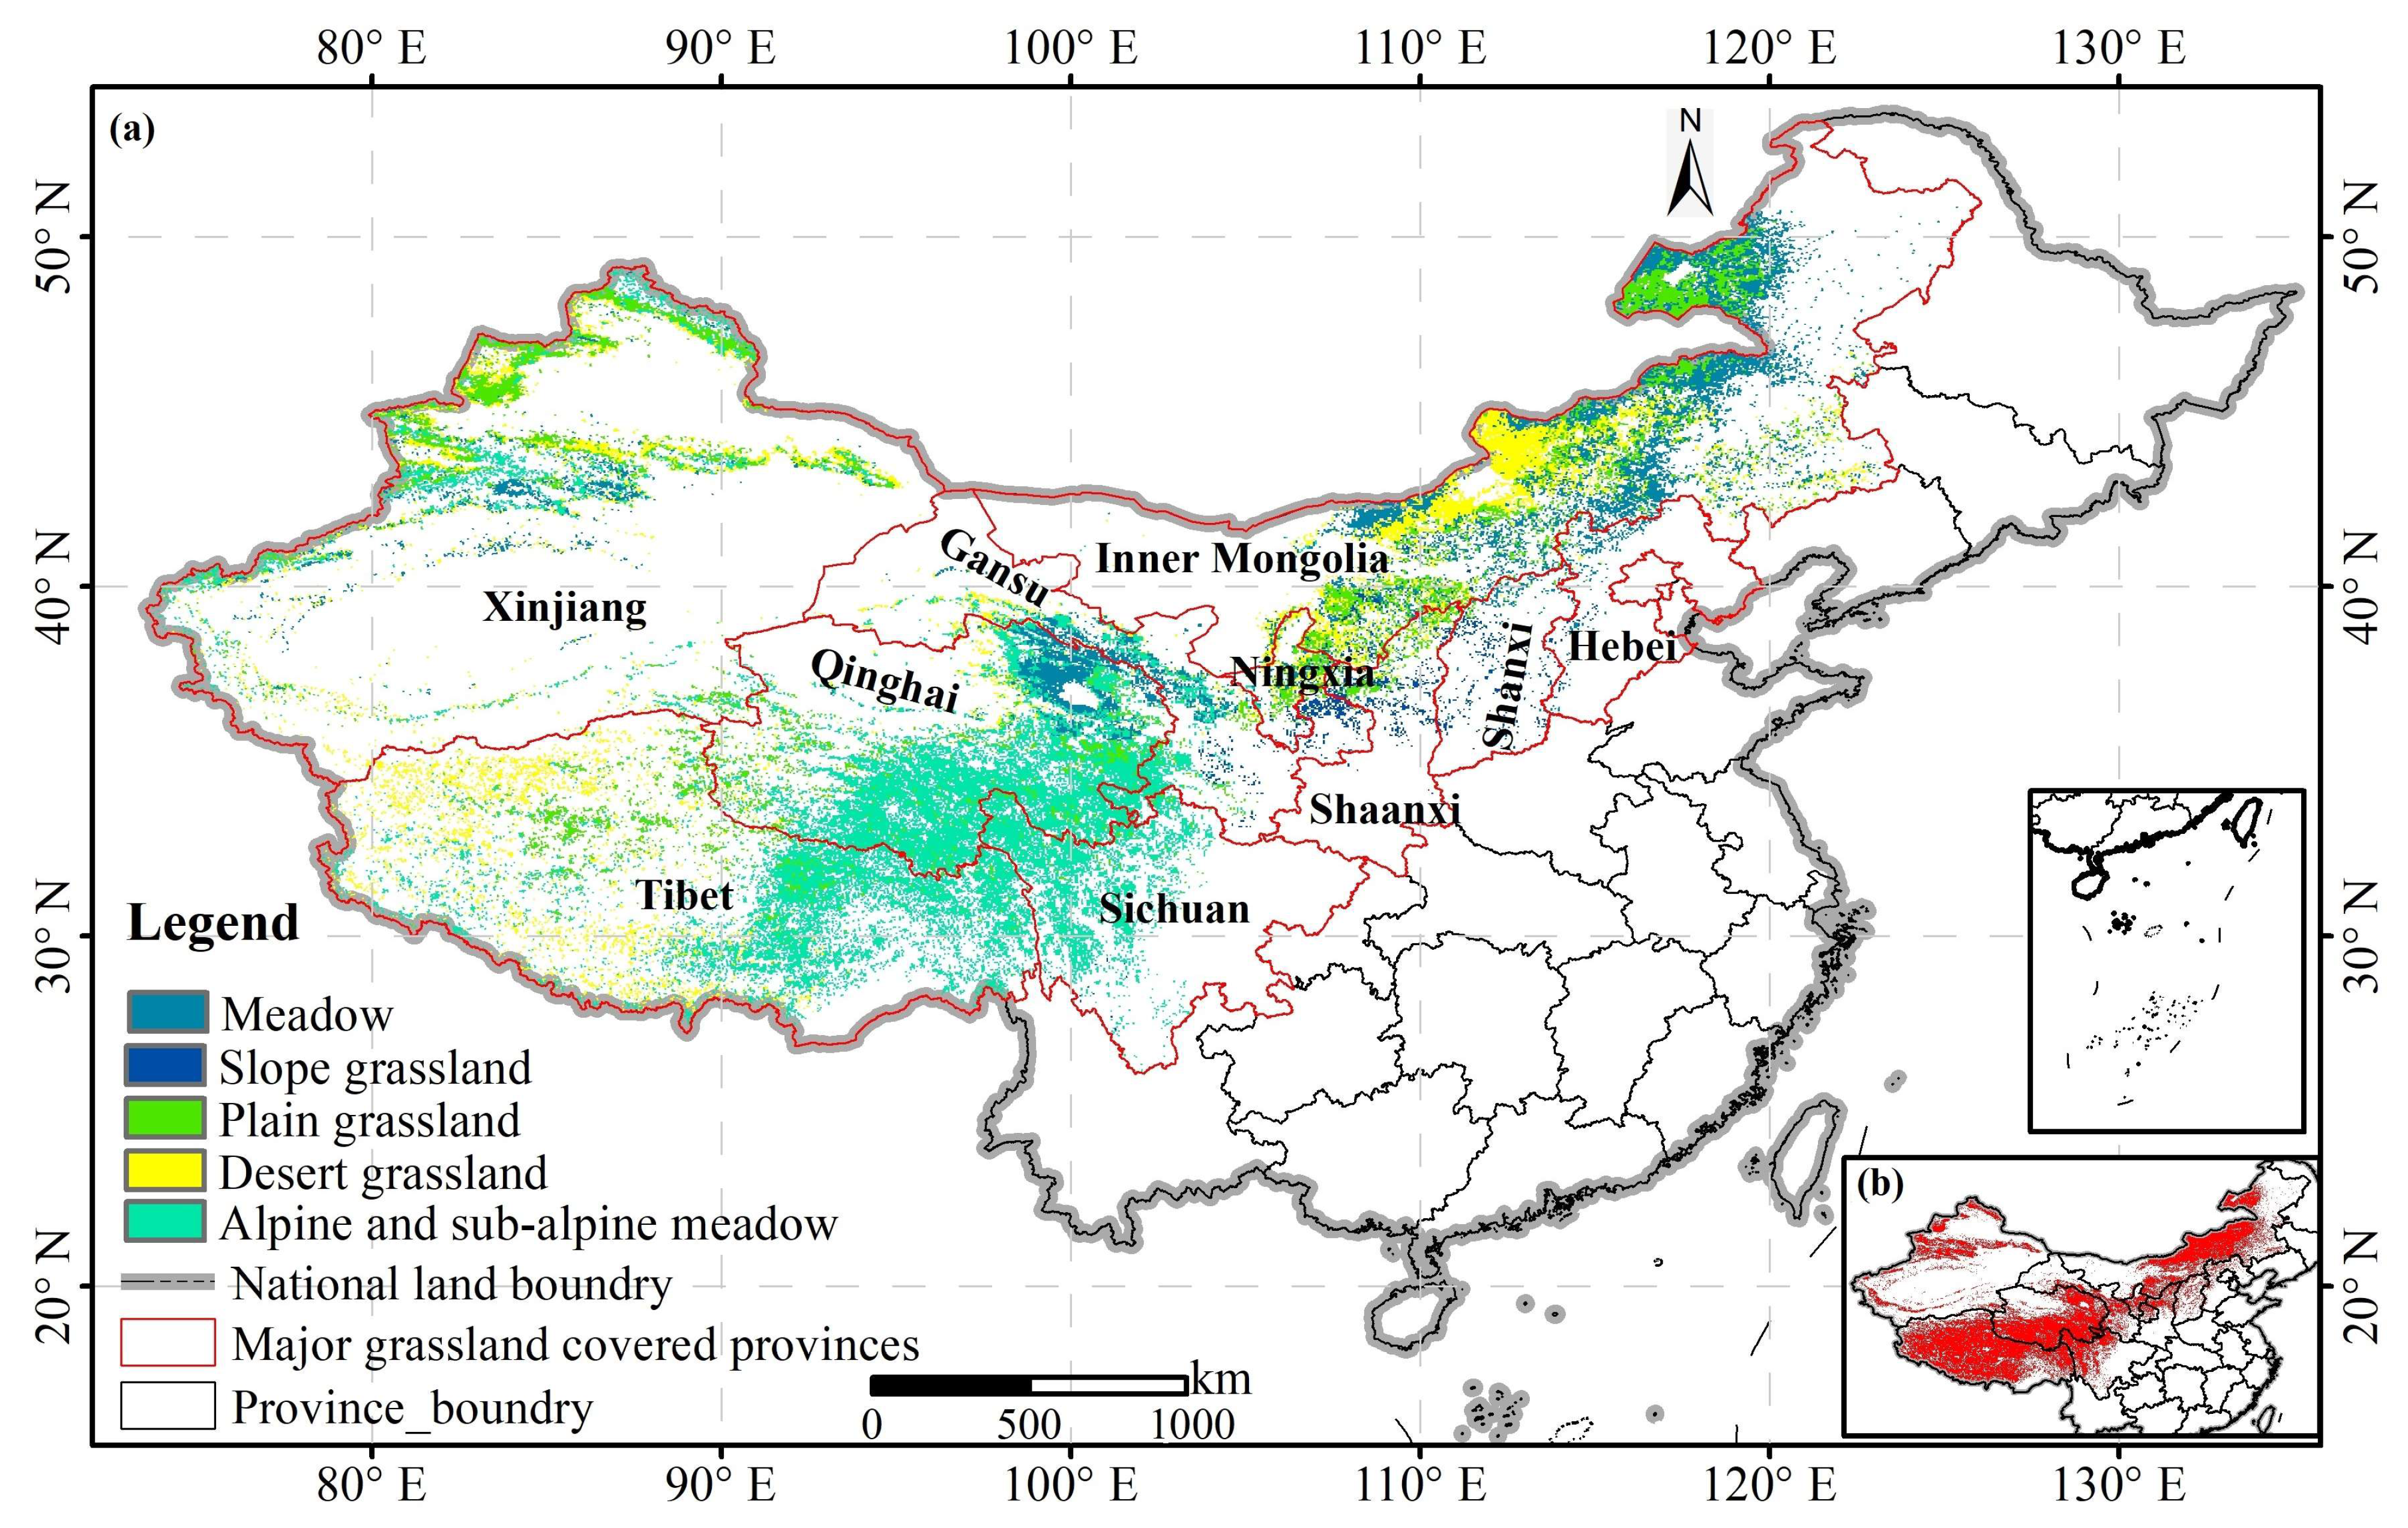
Figure 2.
Workflow of the grassland GPP analysis methods and processes.
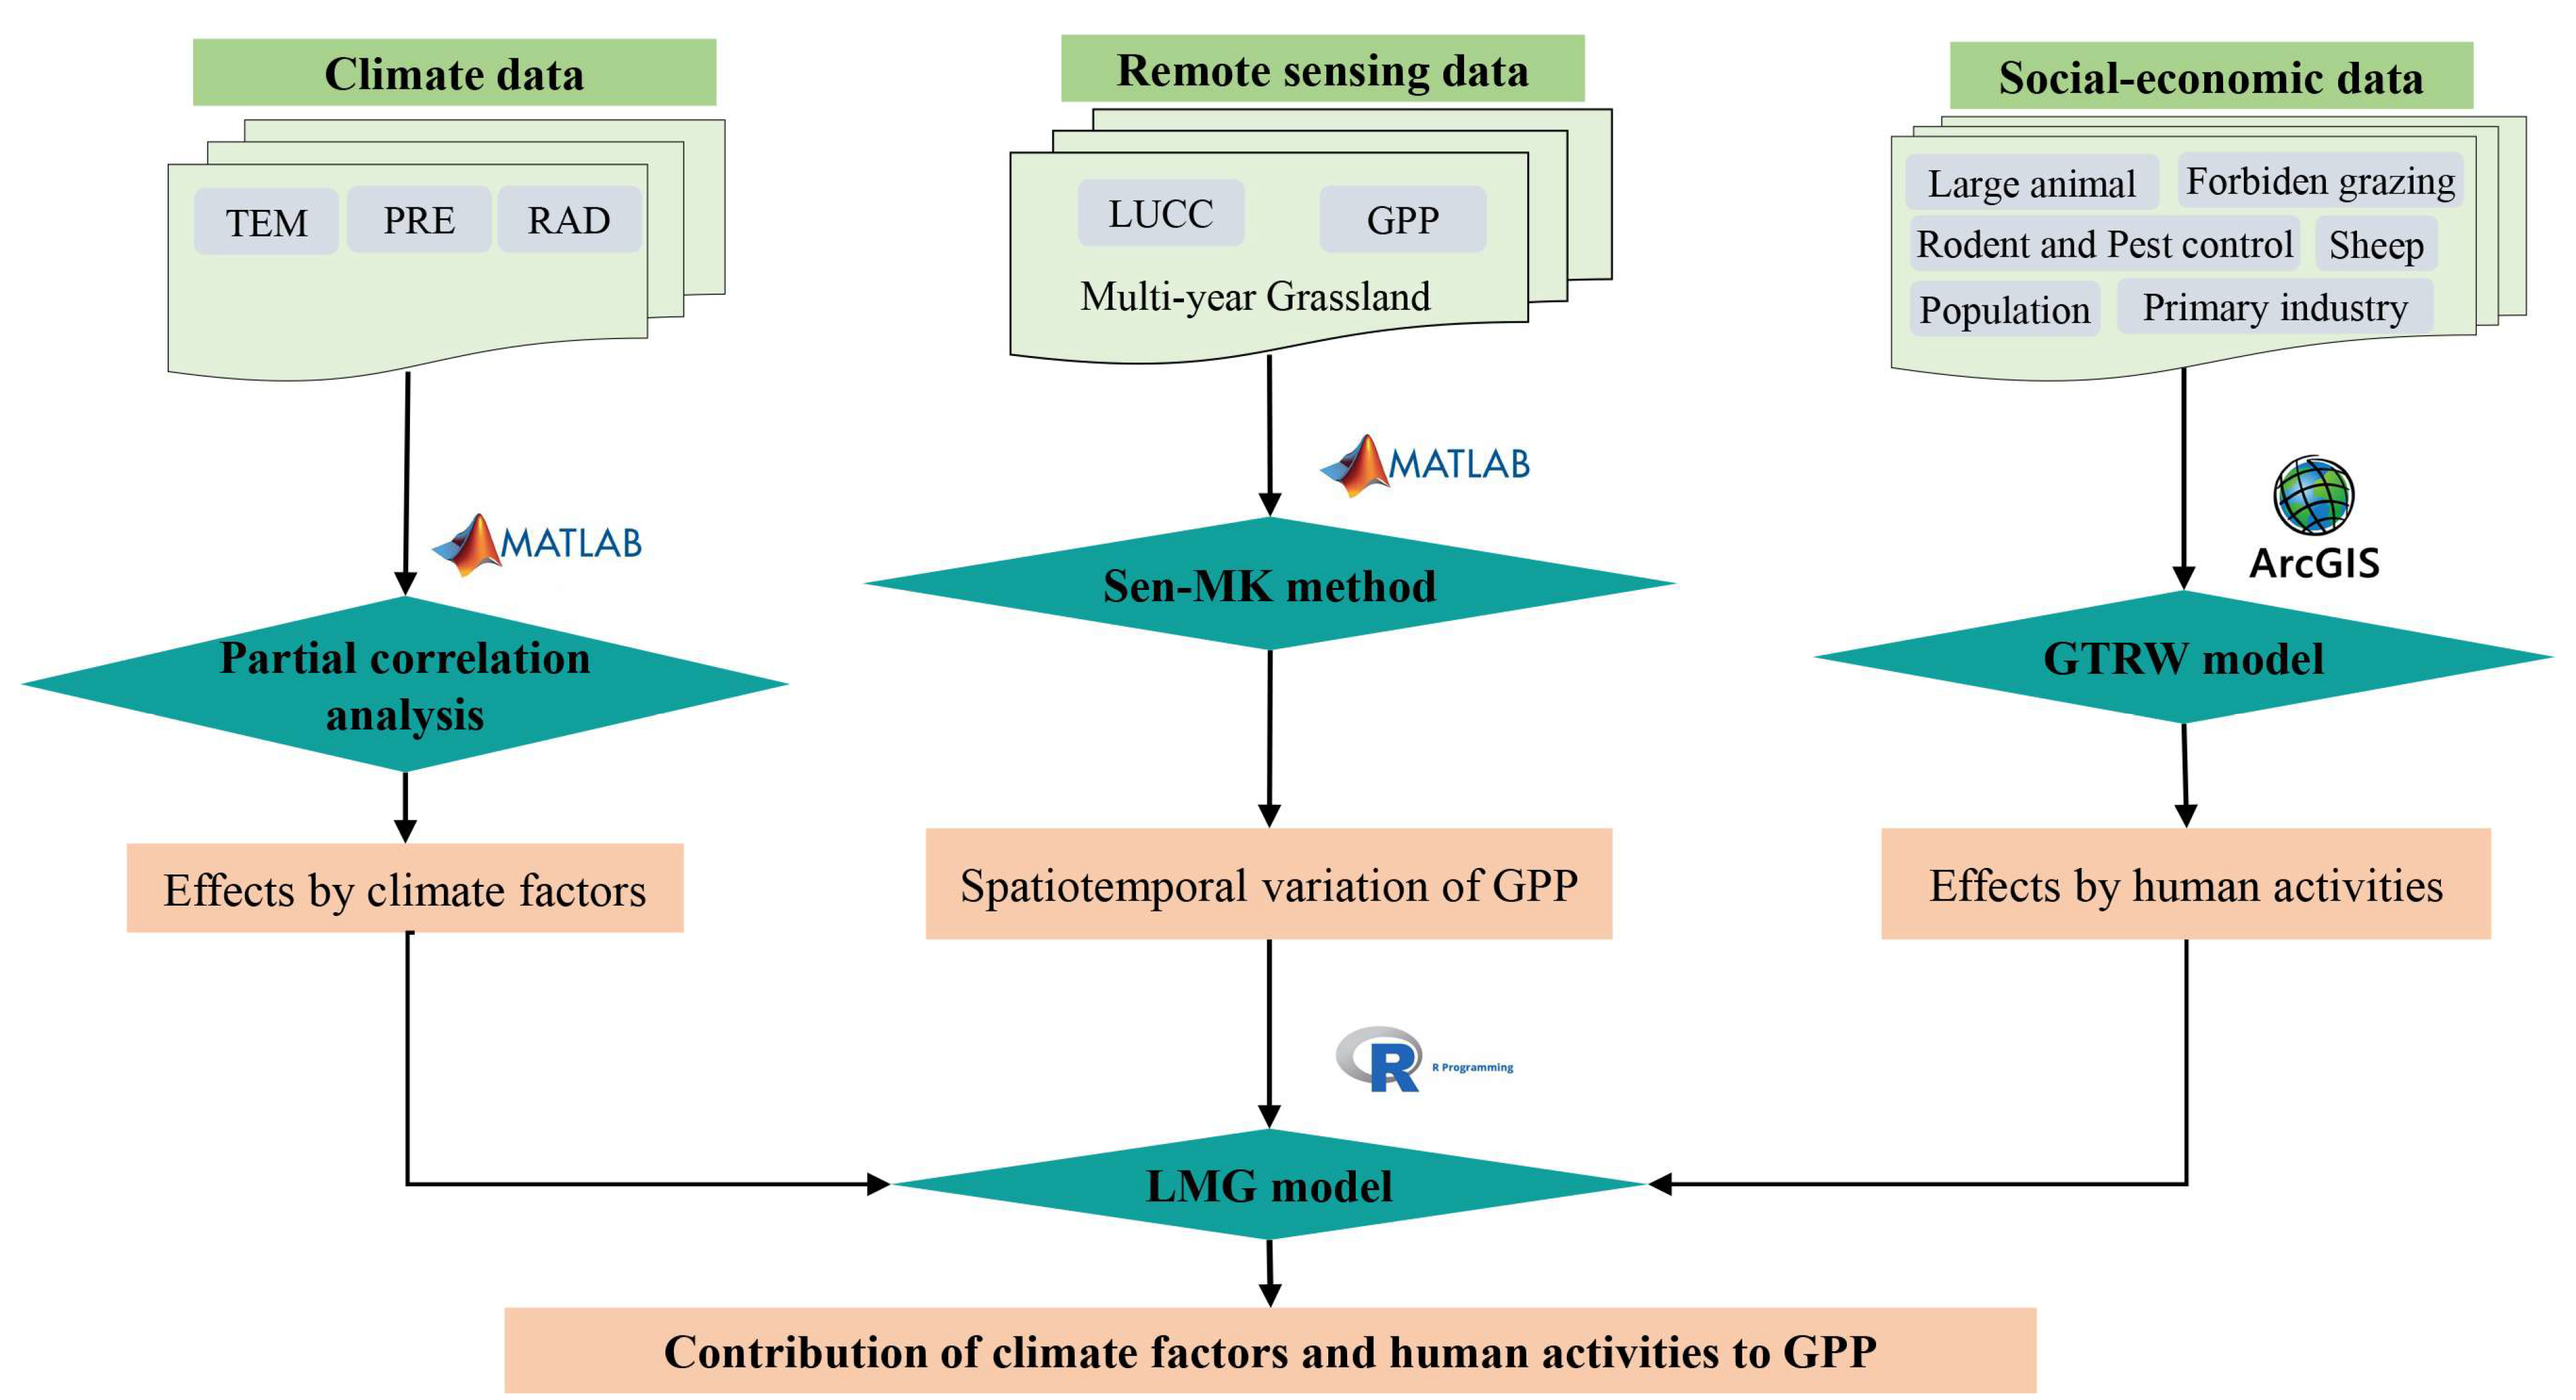
Figure 3.
The spatial variability of GPP across the main grassland in China during 2000–2018, and the inset figure shows the areas with significant changes (Significance level is p < 0.05).
Figure 3.
The spatial variability of GPP across the main grassland in China during 2000–2018, and the inset figure shows the areas with significant changes (Significance level is p < 0.05).

Figure 4.
The temporal trend of GPP during 2000–2018 in 10 provinces (autonomous regions) (Significance levels are denoted by asterisks: ** for p < 0.05).
Figure 4.
The temporal trend of GPP during 2000–2018 in 10 provinces (autonomous regions) (Significance levels are denoted by asterisks: ** for p < 0.05).
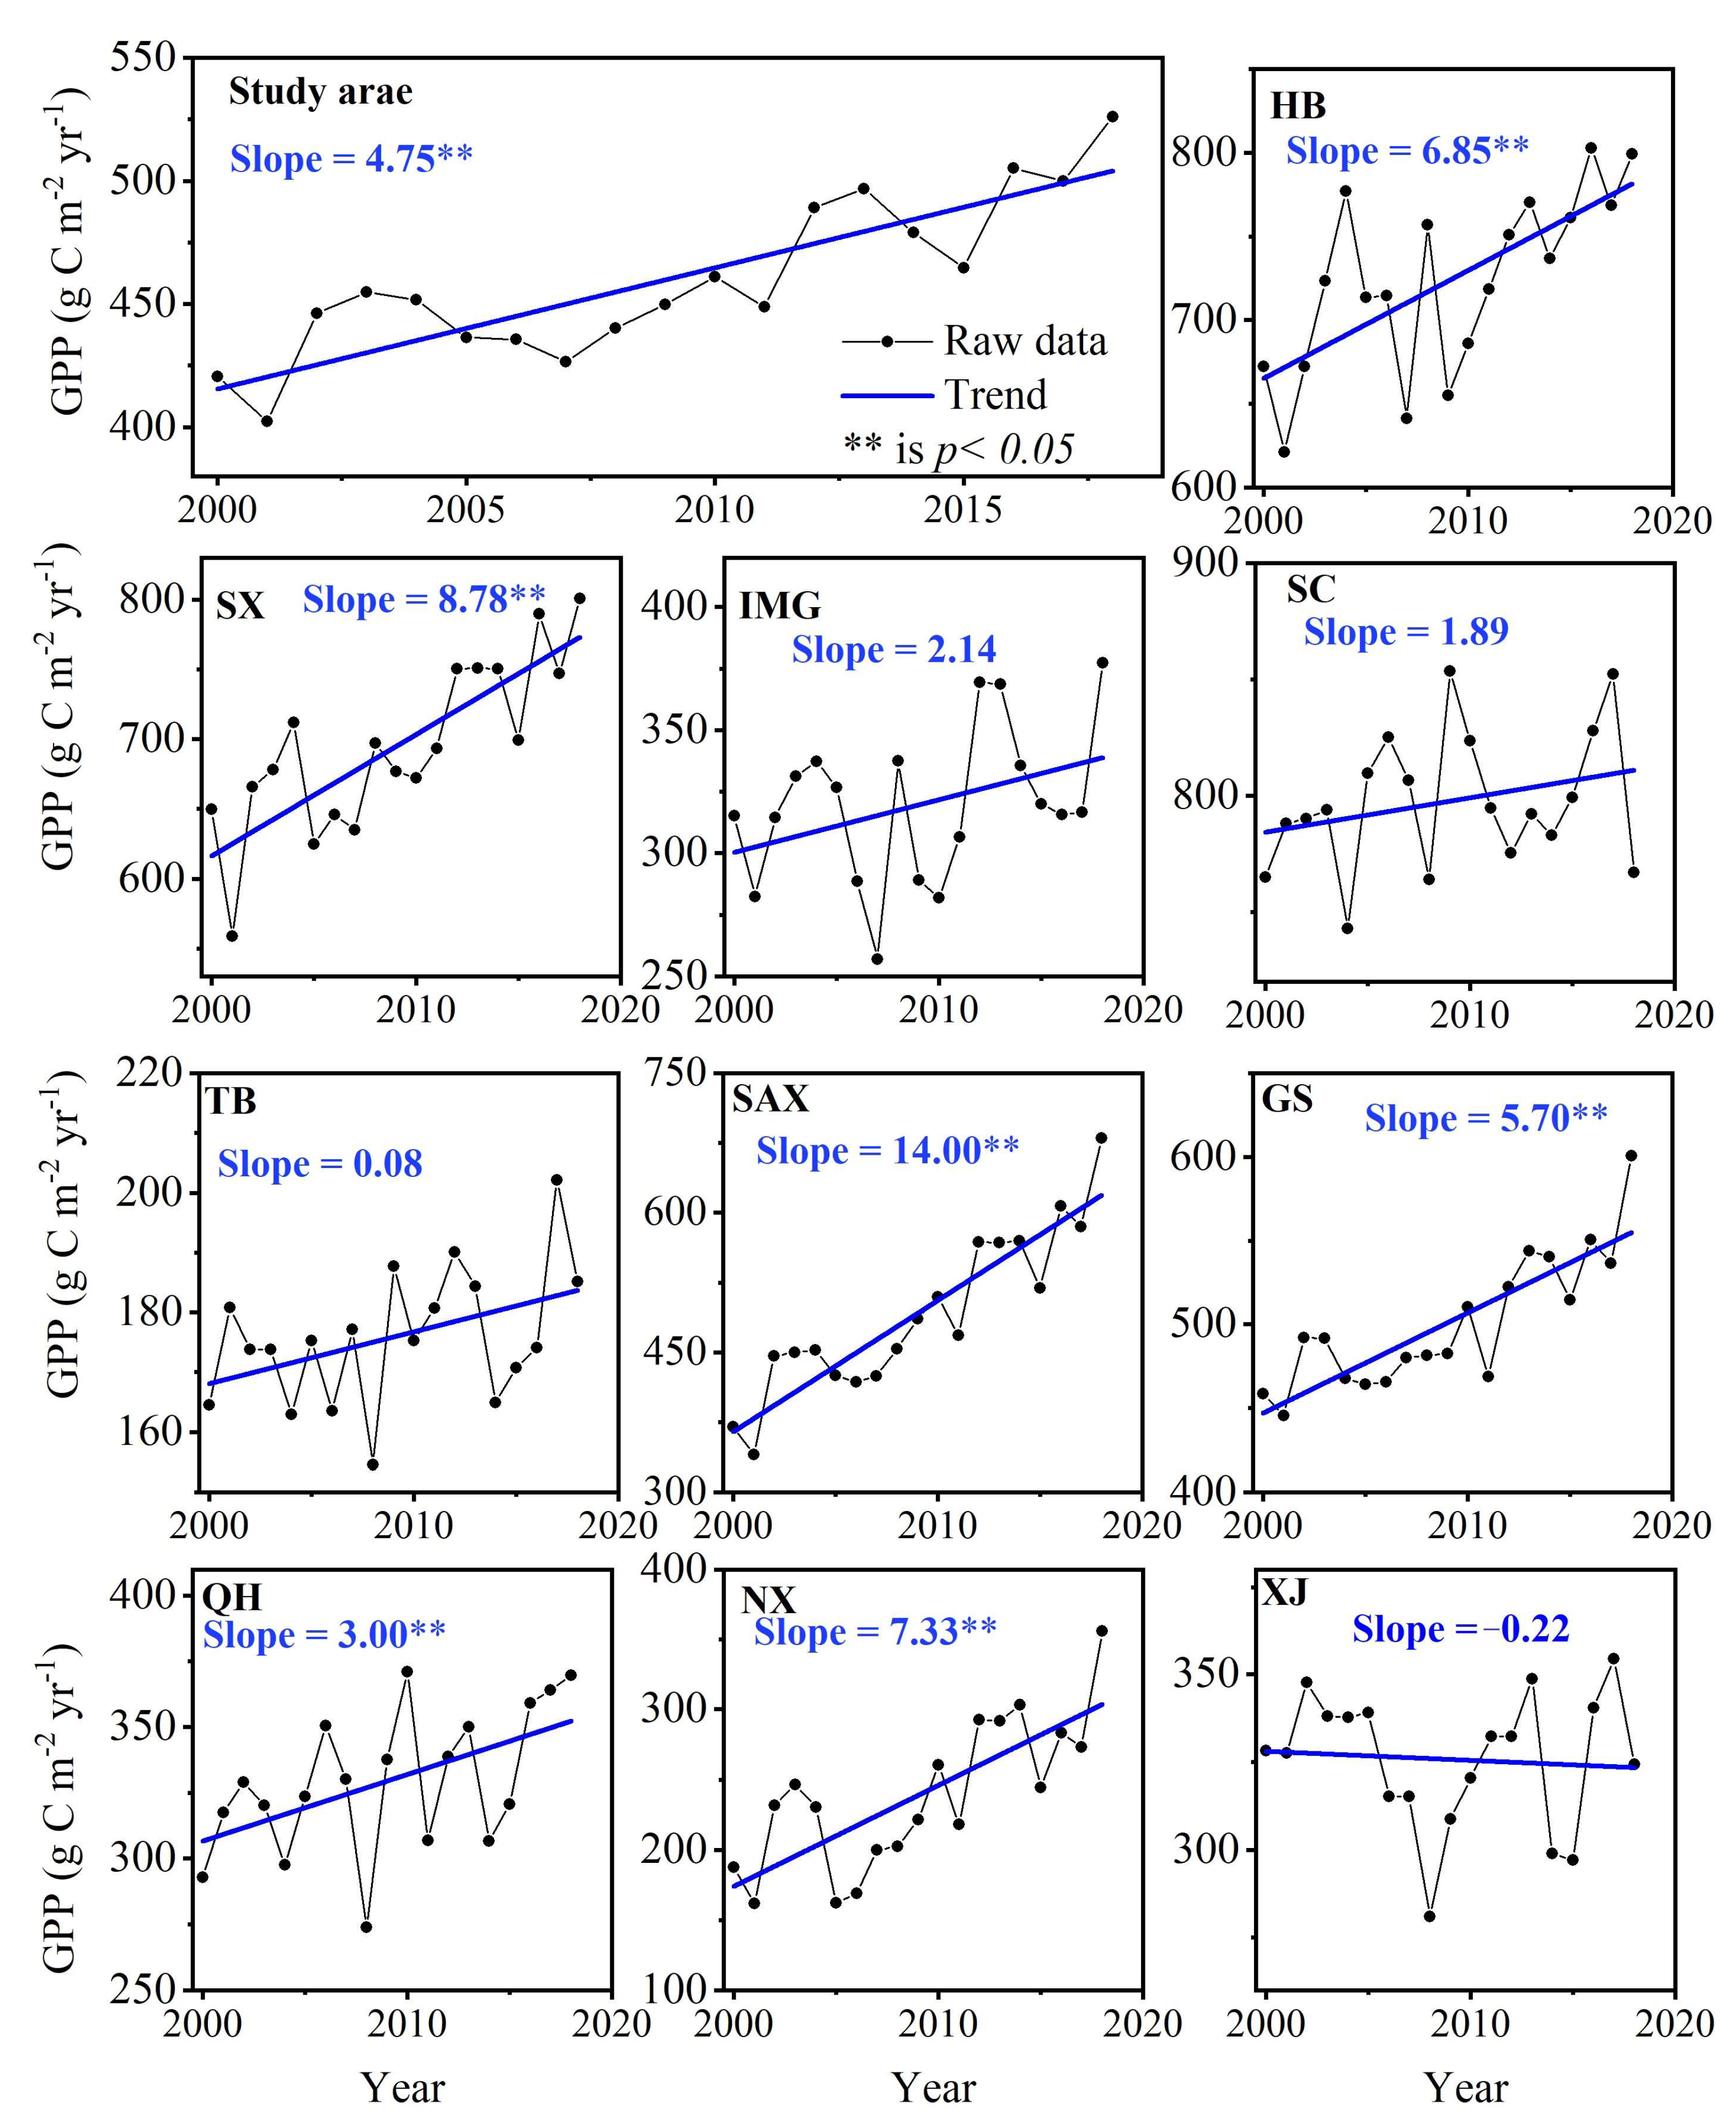
Figure 5.
Spatial variation of TEM, PRE, and RAD (a,c,e) and correlation between GPP (b,d,f) during 2000–2018 (Significance level is p < 0.05).
Figure 5.
Spatial variation of TEM, PRE, and RAD (a,c,e) and correlation between GPP (b,d,f) during 2000–2018 (Significance level is p < 0.05).
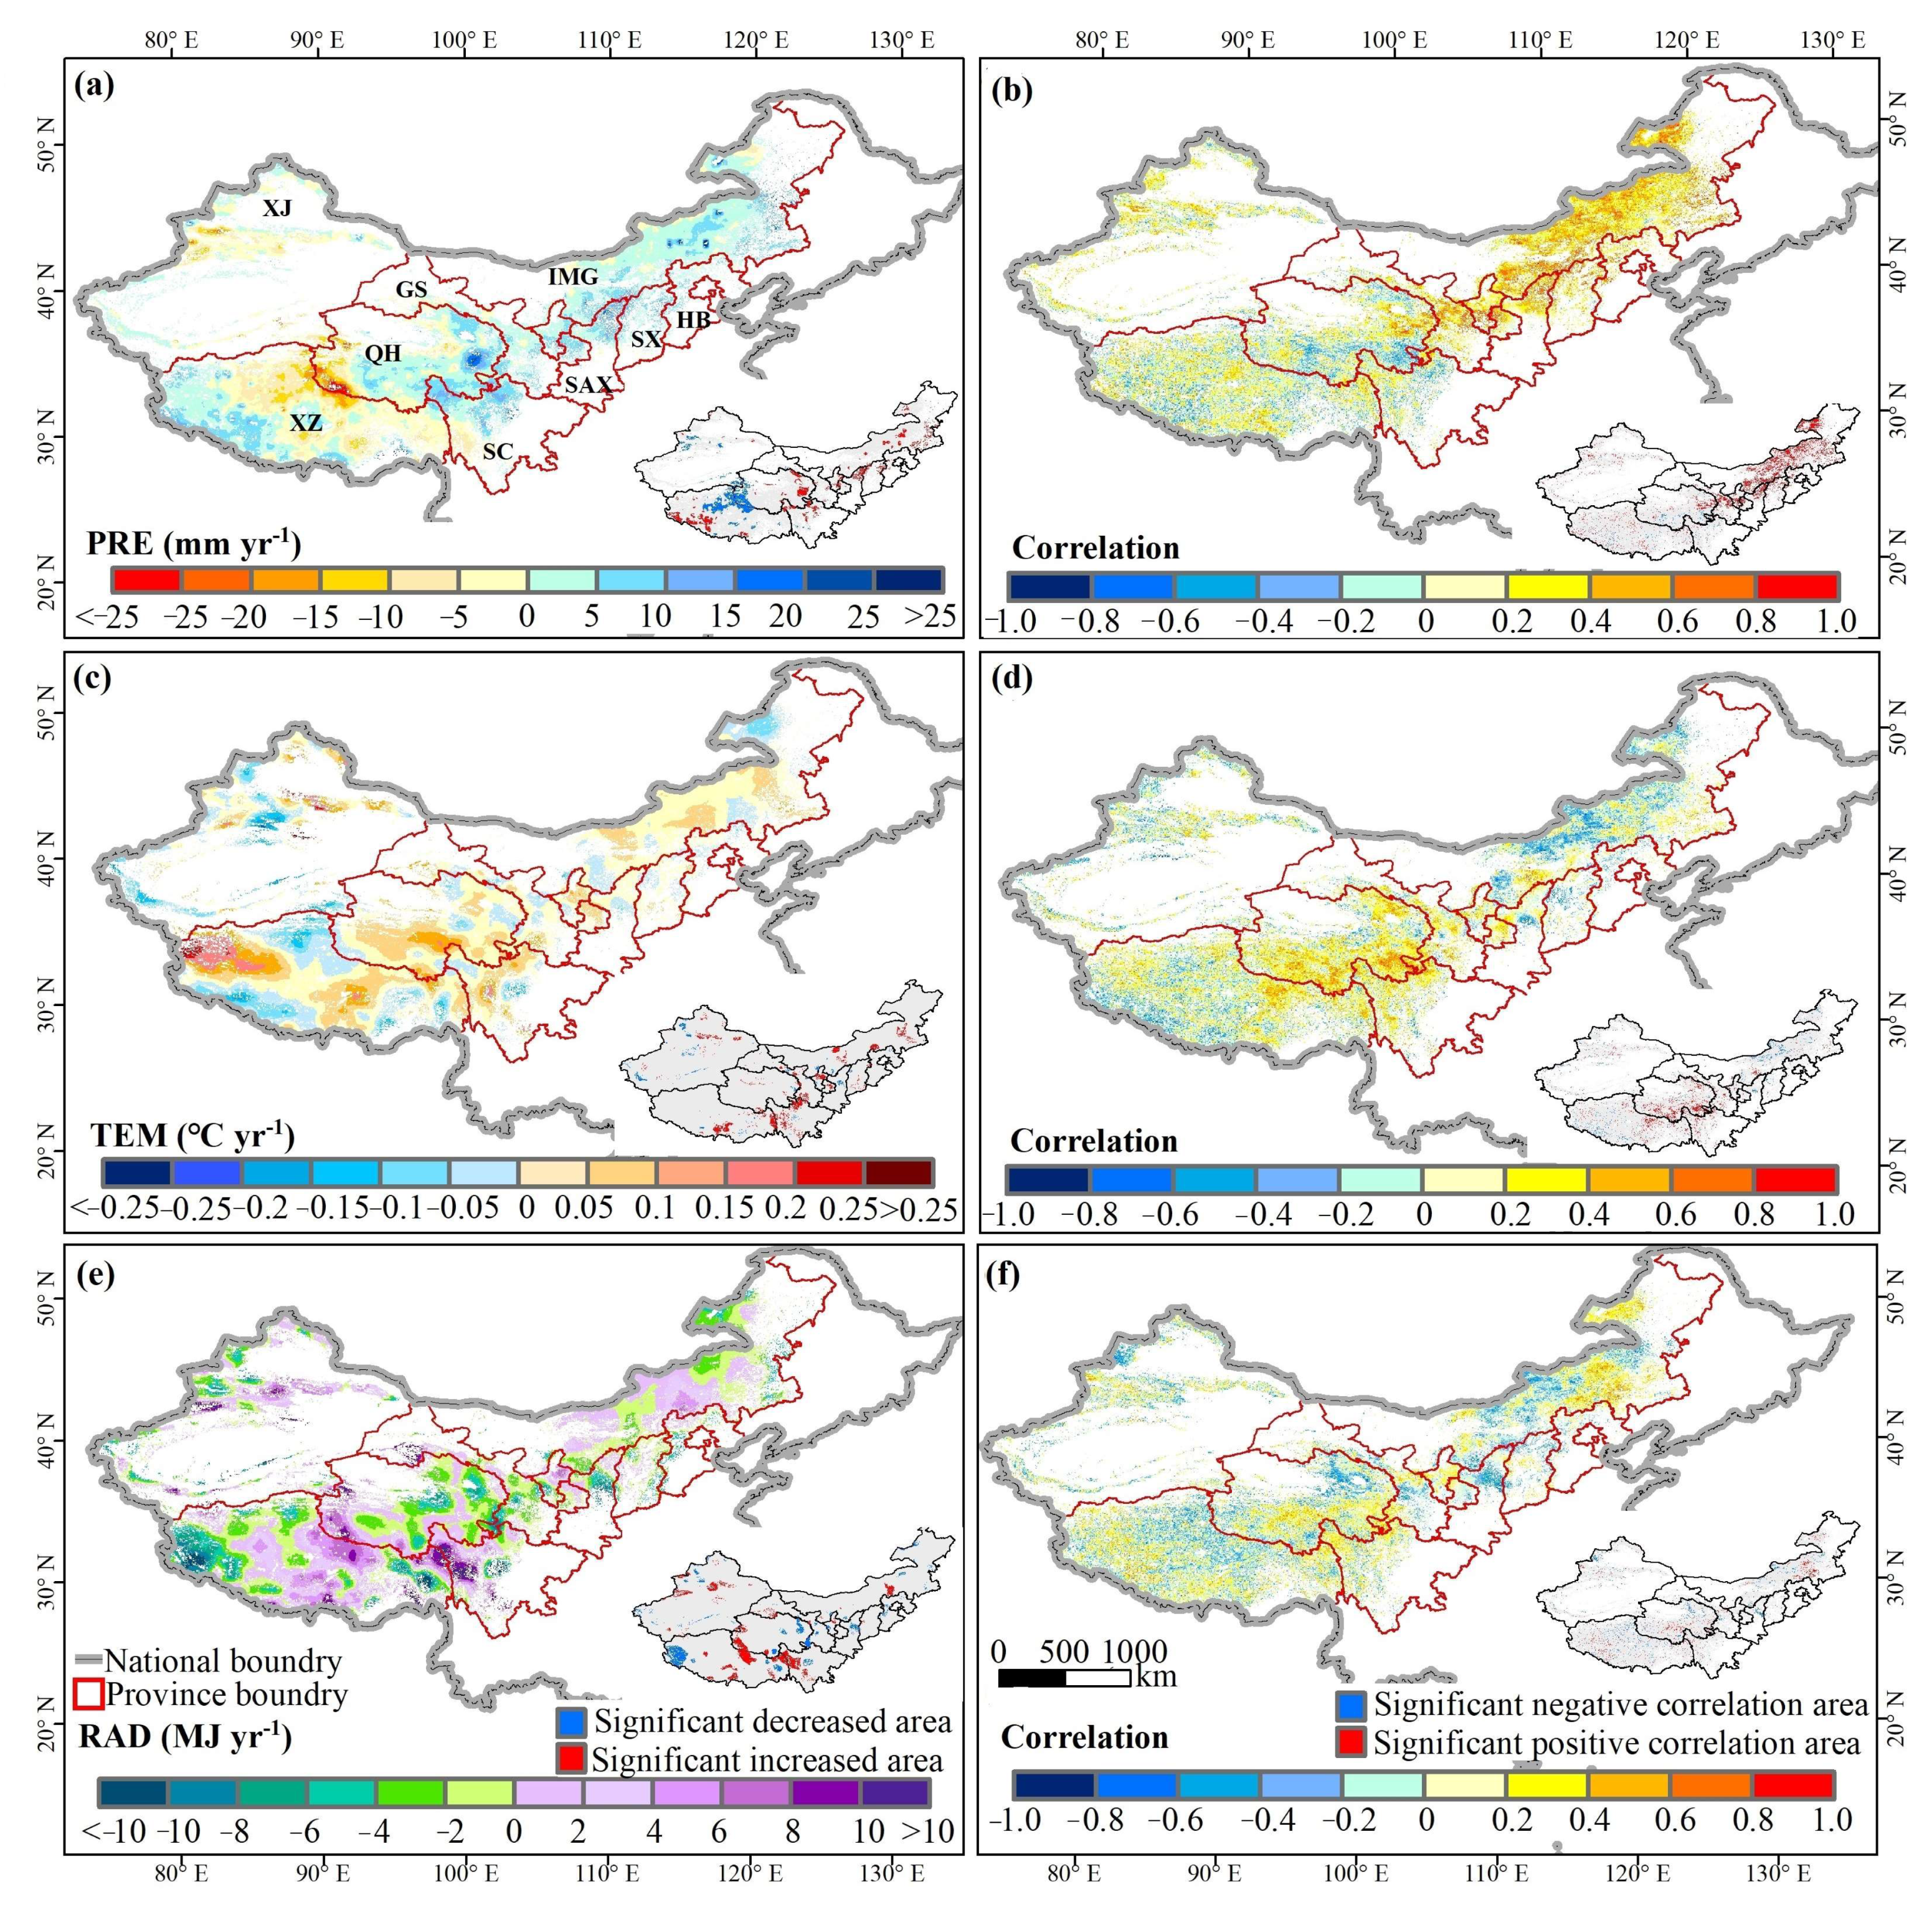
Figure 6.
Temporal variation of the coefficient between GPP and six human activities during 2000–2018 in ten provinces (autonomous region).
Figure 6.
Temporal variation of the coefficient between GPP and six human activities during 2000–2018 in ten provinces (autonomous region).
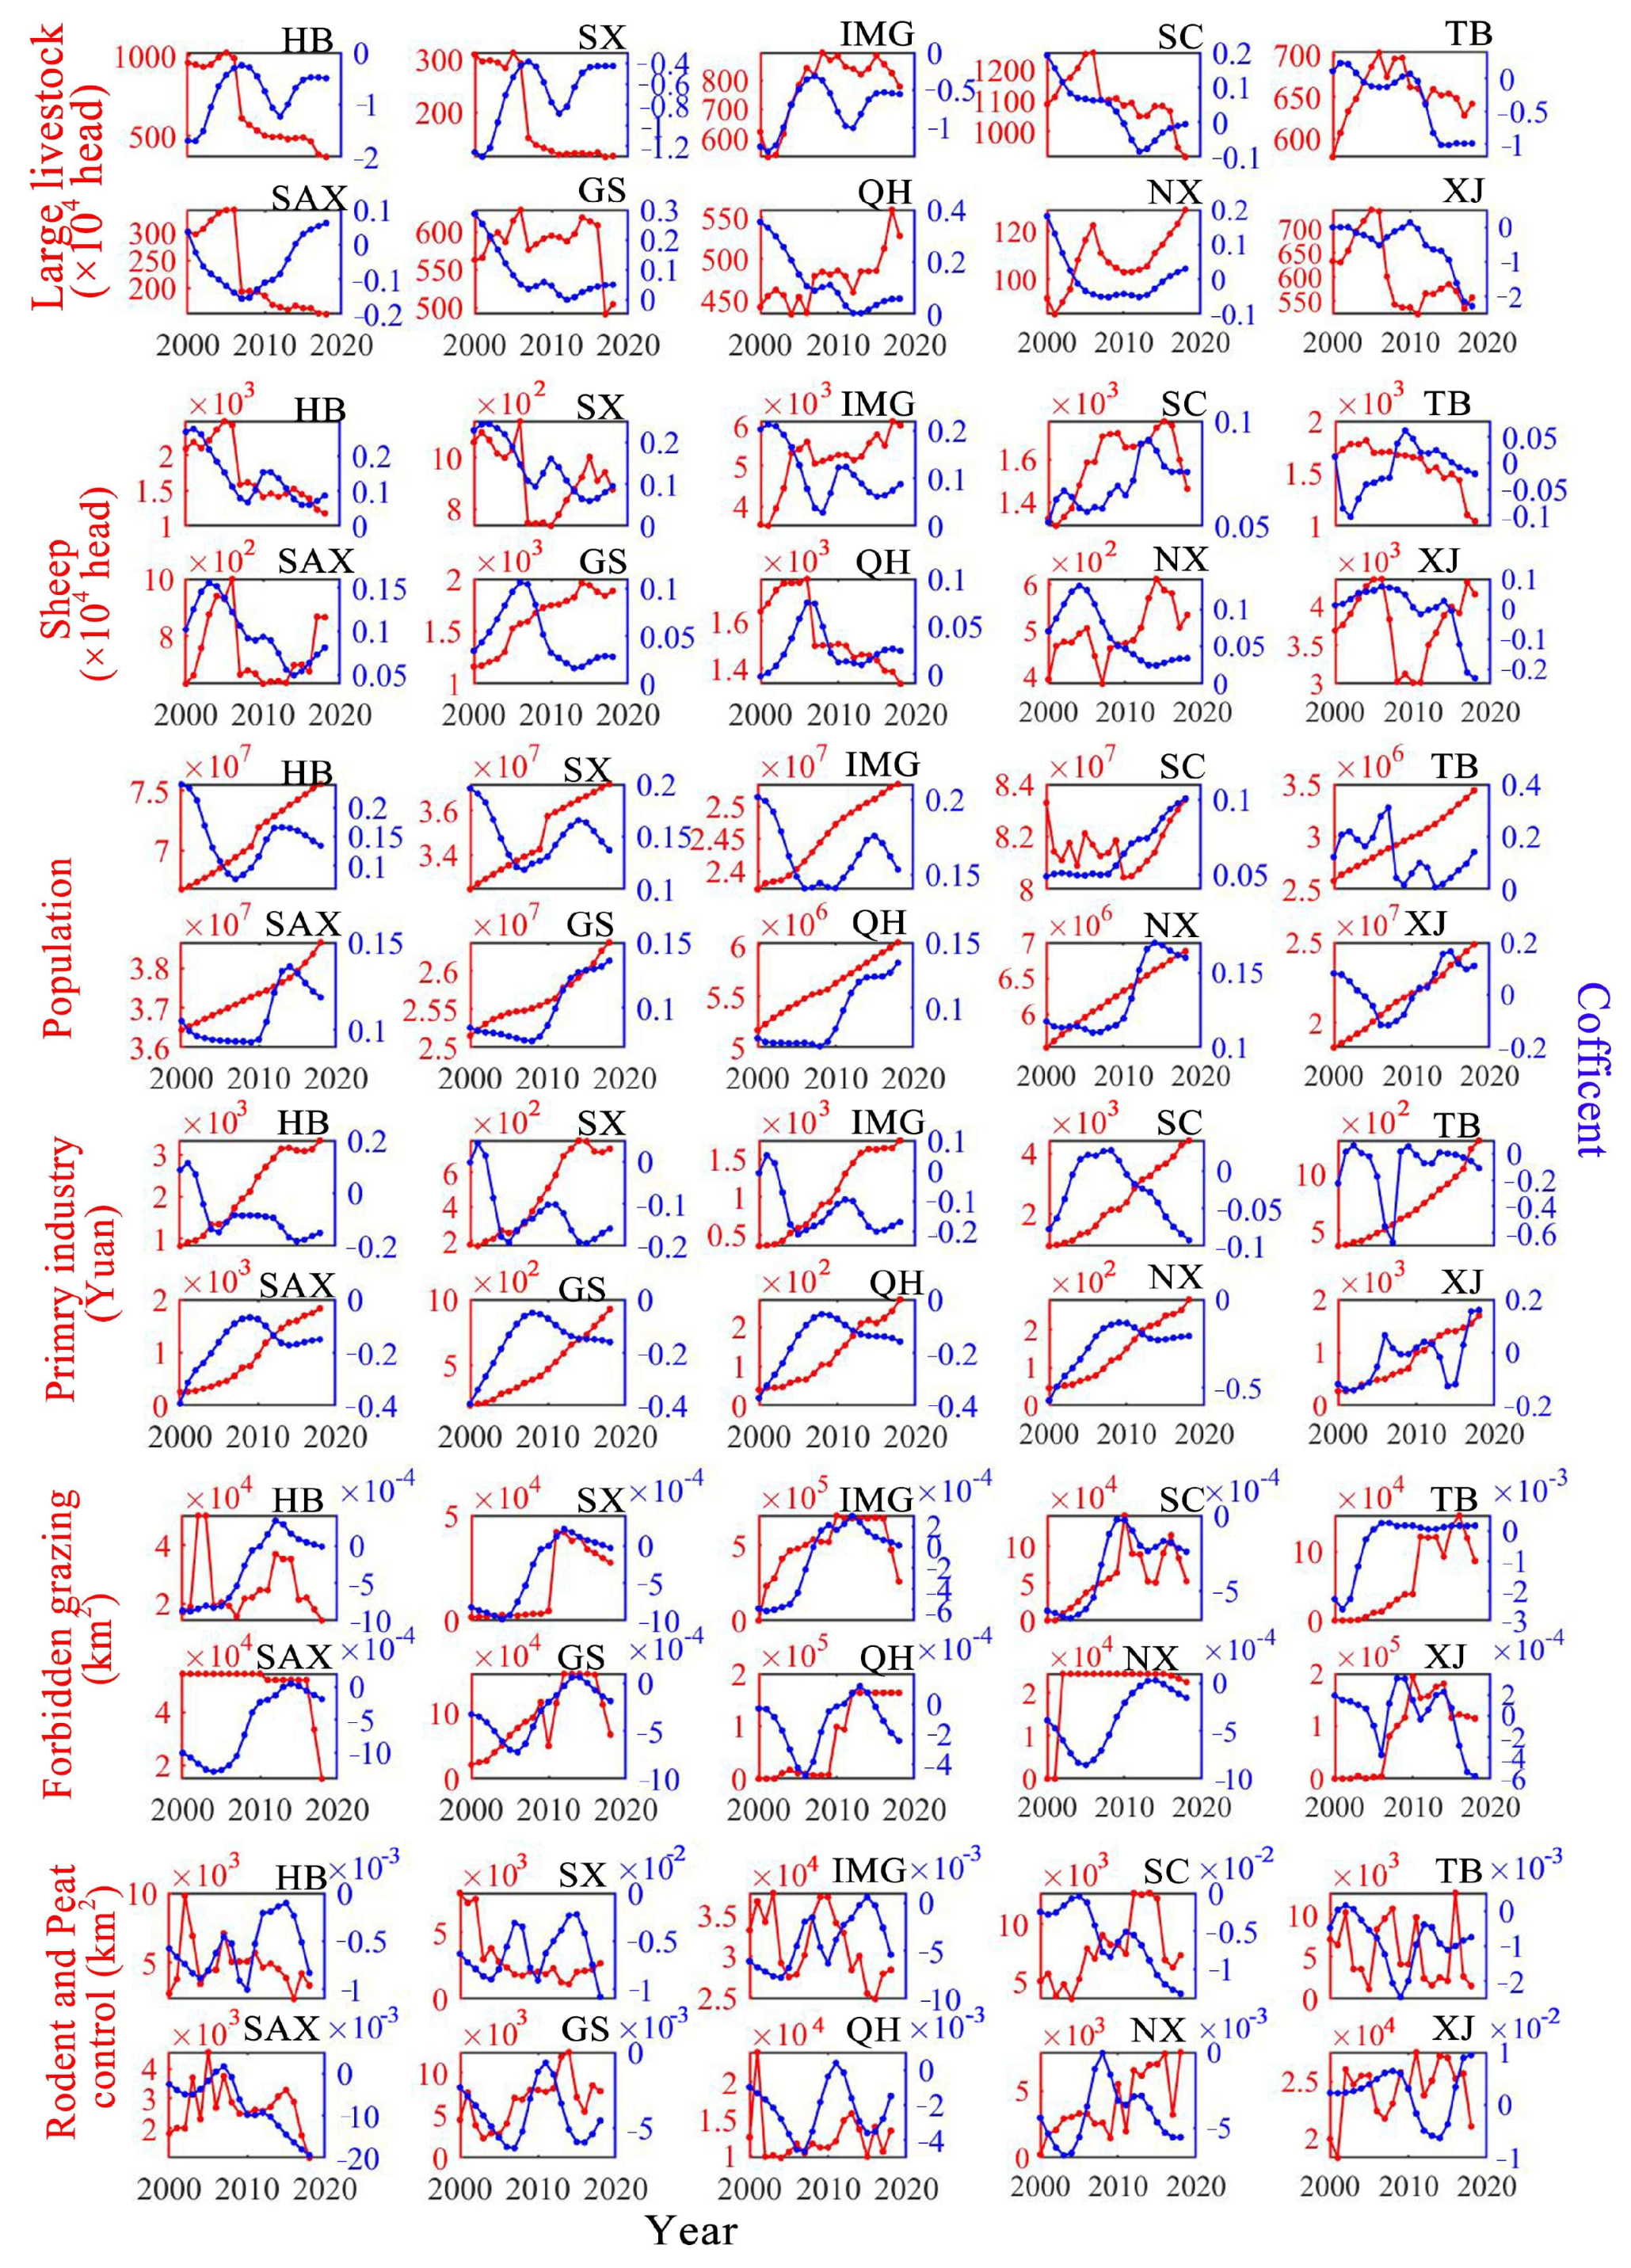
Figure 7.
Multi-annual spatial distribution of the coefficient between GPP and six human activities (large livestock (a), sheep (b), population (c), primary industry (d), forbidden grazing (e) and rodent and pest control (f)) during 2000–2018 in ten provinces (autonomous region).
Figure 7.
Multi-annual spatial distribution of the coefficient between GPP and six human activities (large livestock (a), sheep (b), population (c), primary industry (d), forbidden grazing (e) and rodent and pest control (f)) during 2000–2018 in ten provinces (autonomous region).
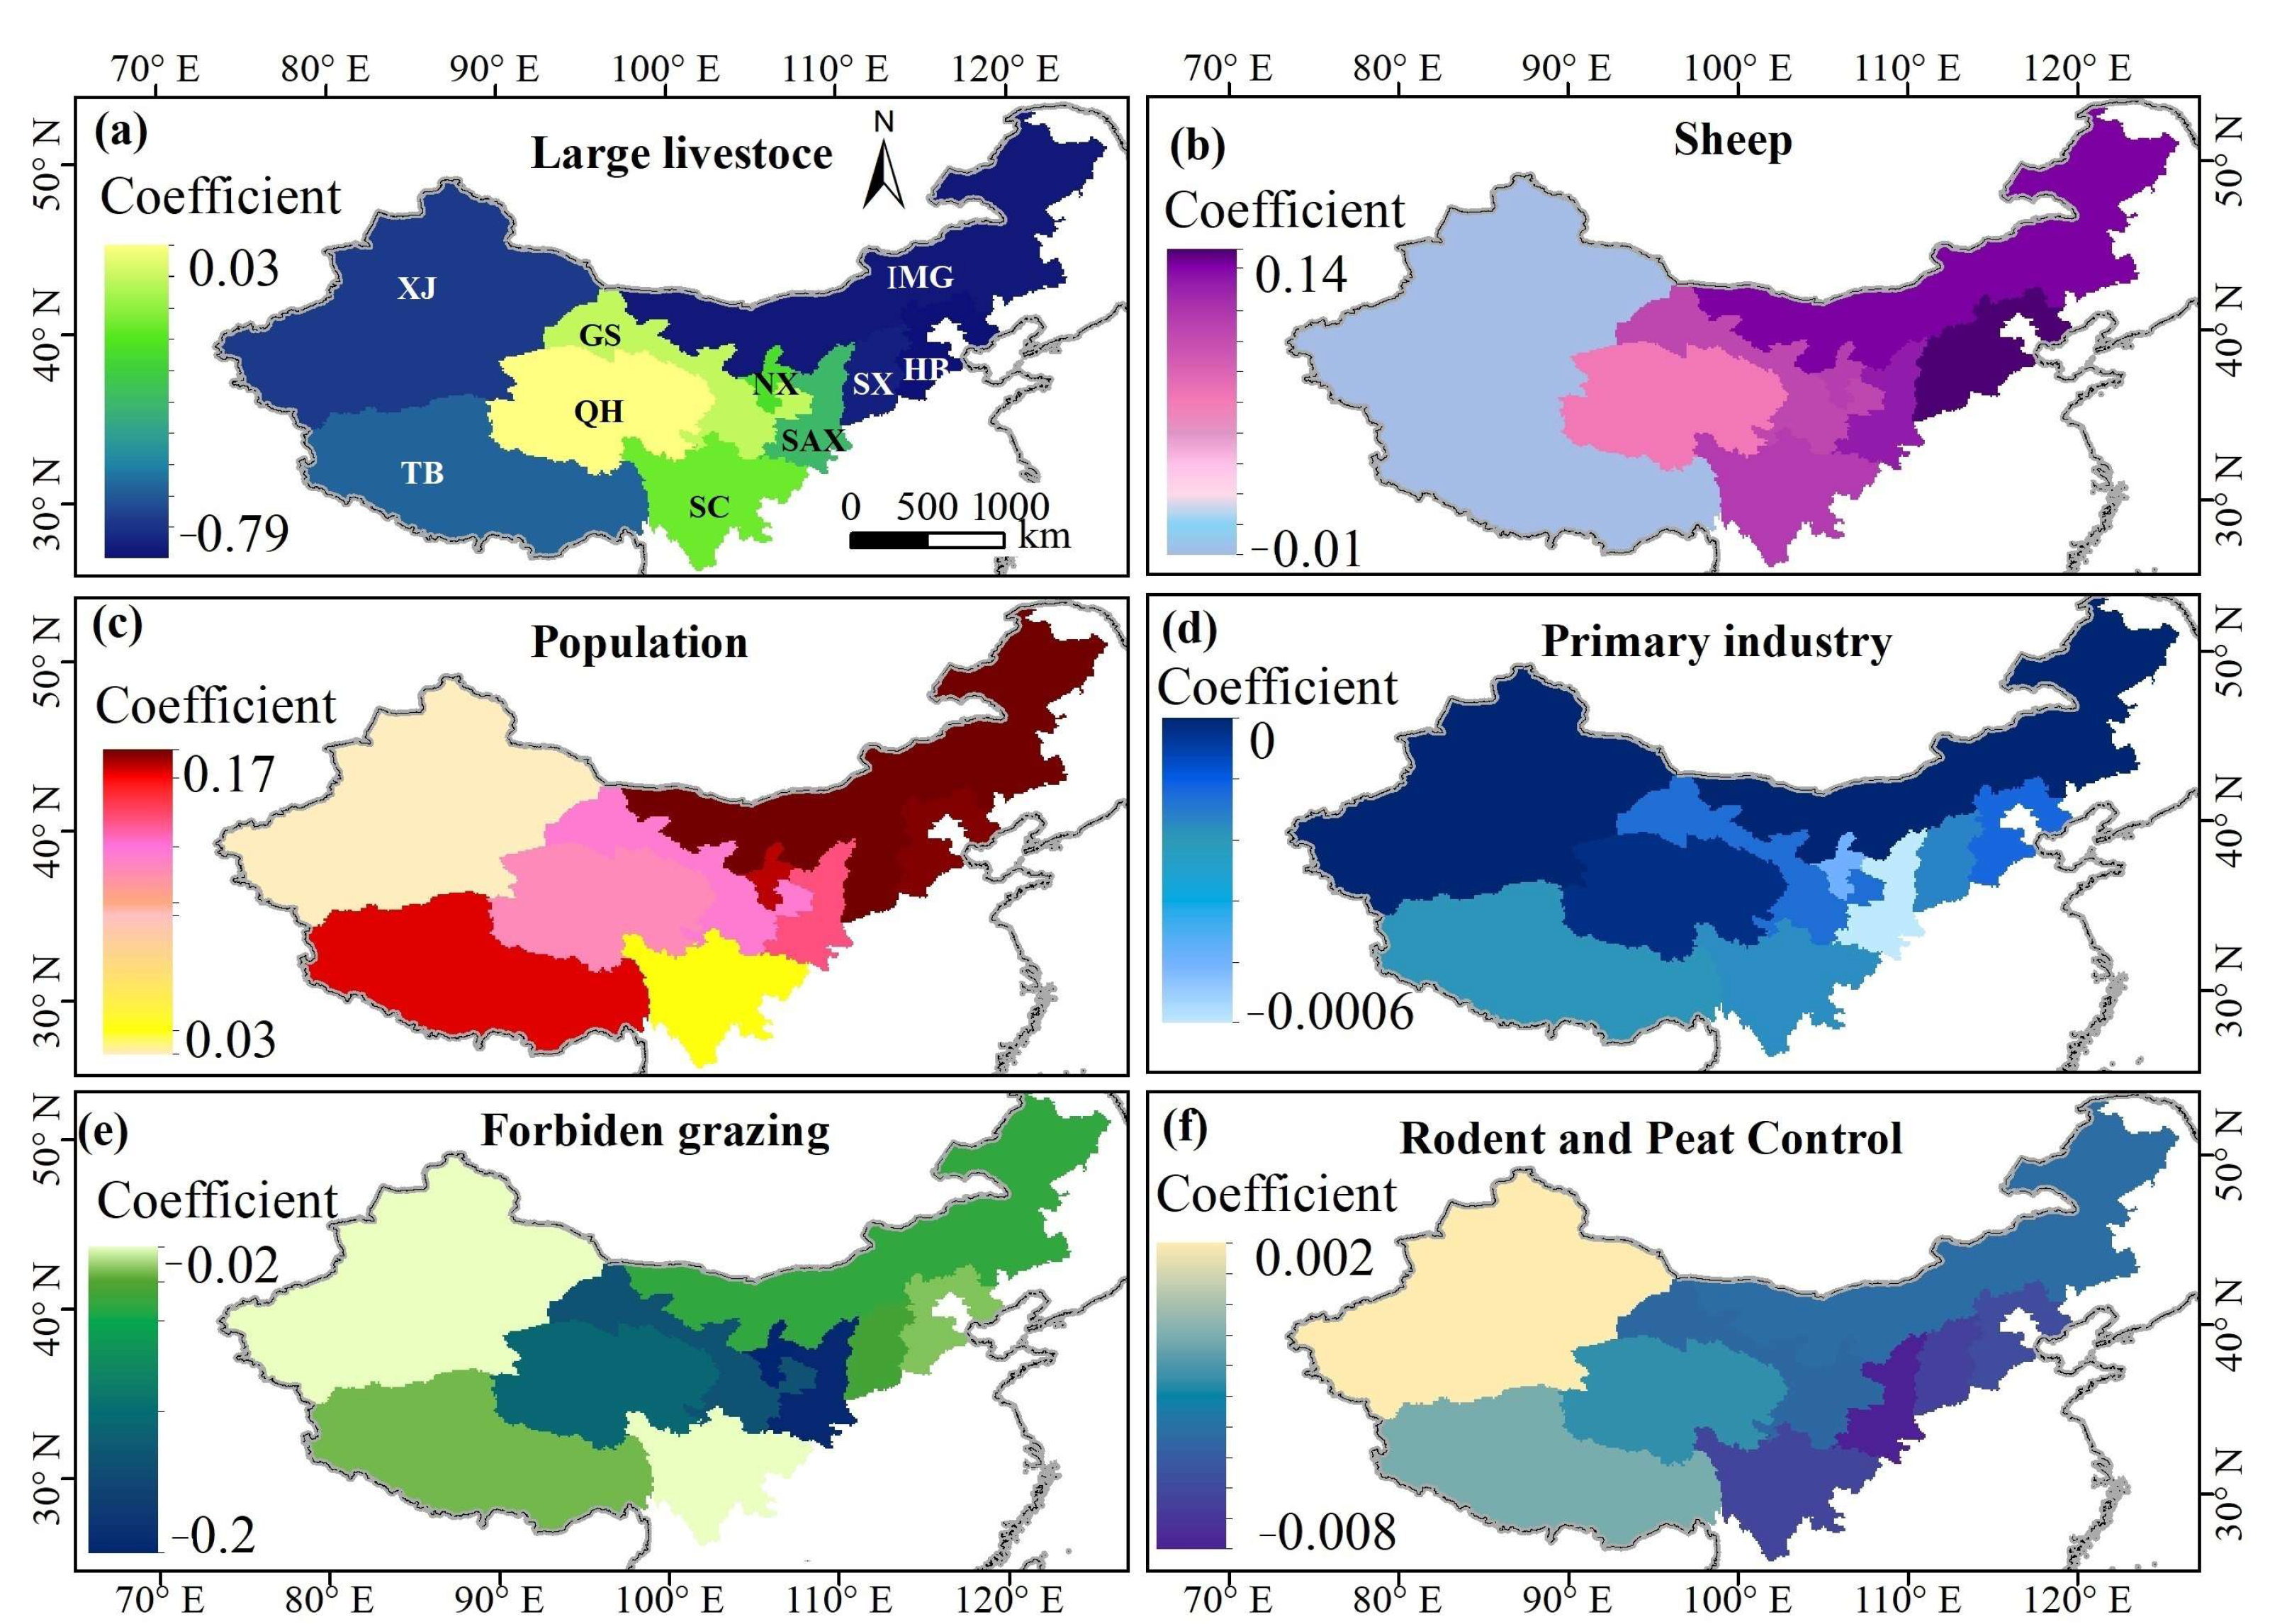
Figure 8.
Contribution rate of climate factors (a) and human activity (b) to GPP during 2000–2018 in ten provinces (autonomous regions).
Figure 8.
Contribution rate of climate factors (a) and human activity (b) to GPP during 2000–2018 in ten provinces (autonomous regions).
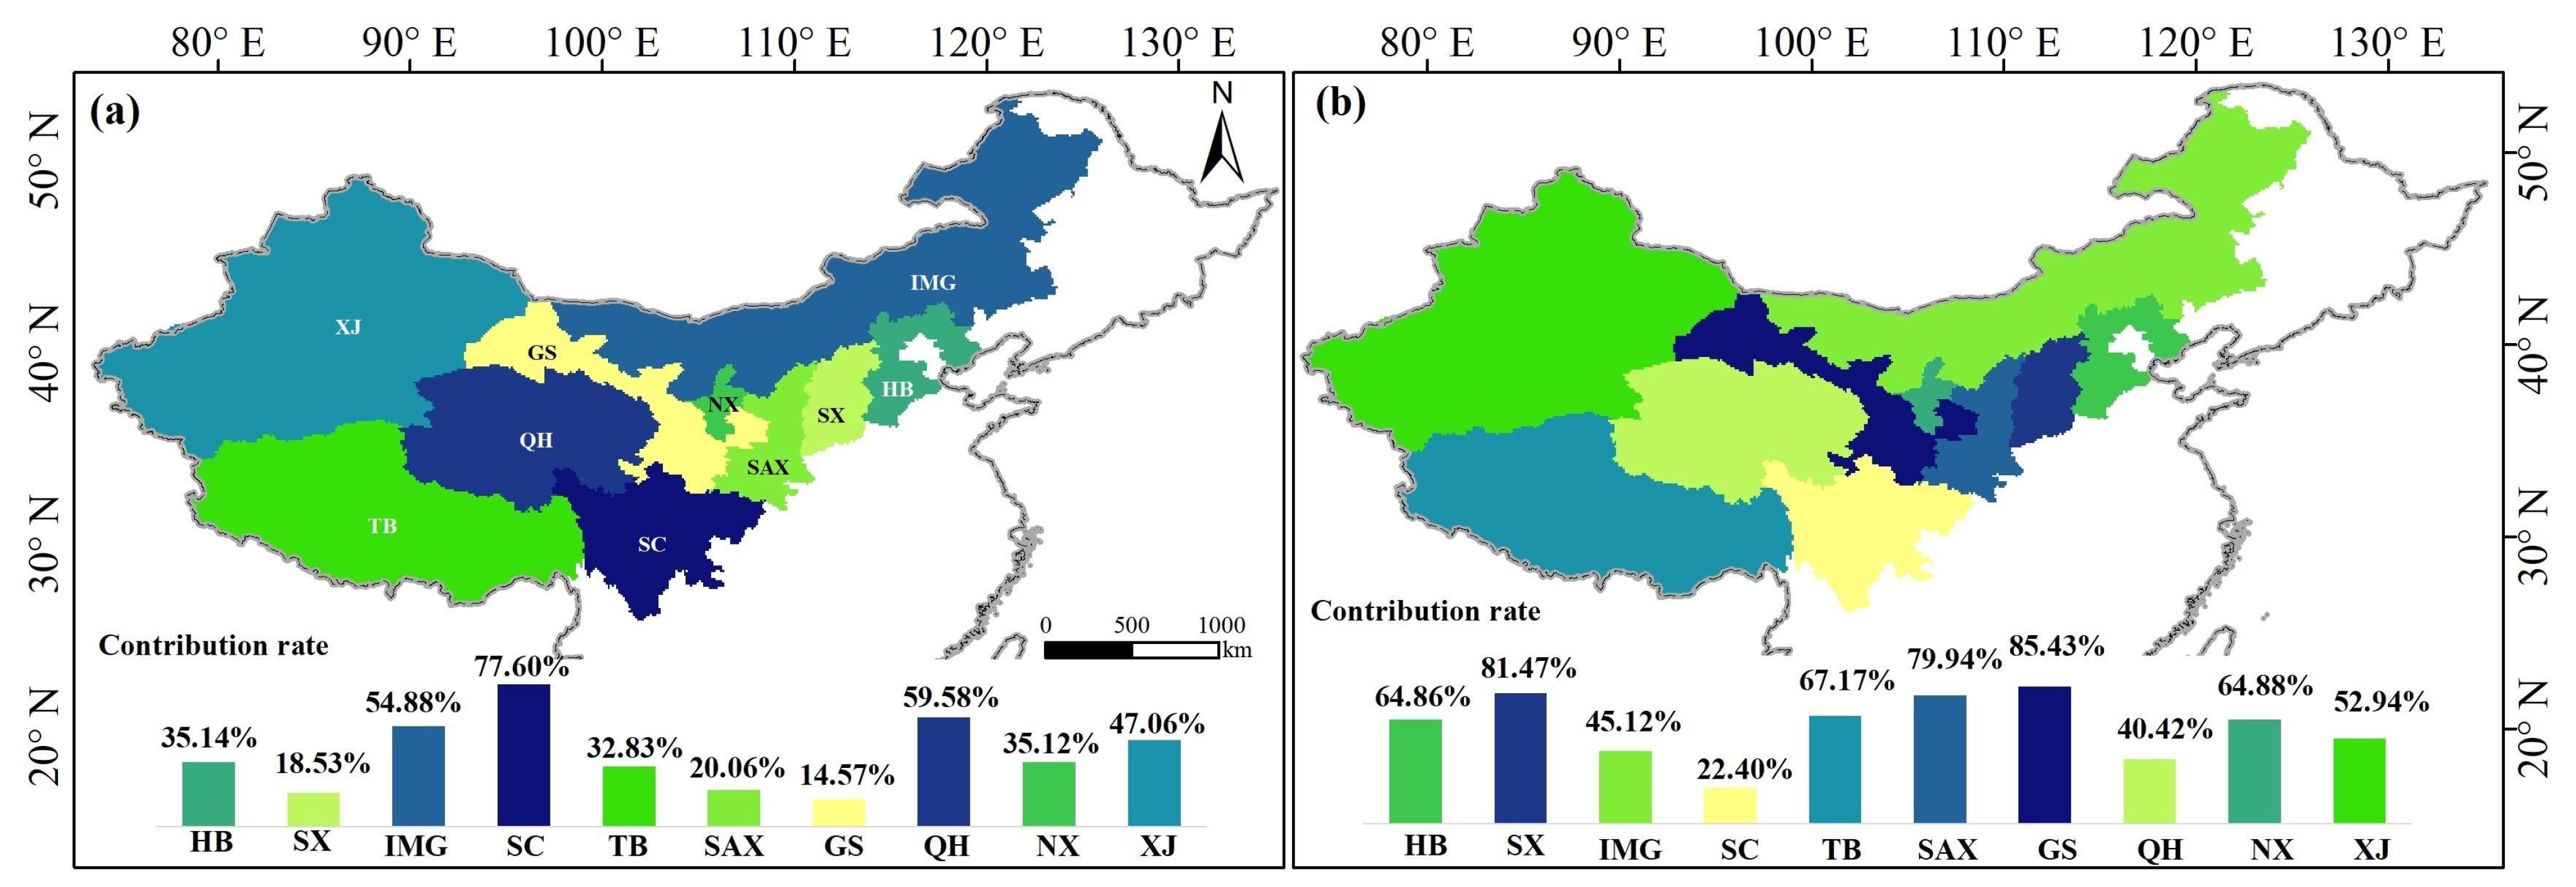
Figure 9.
The individual contribution rates of various climate factors and human activity to GPP.

Table 1.
Introduction of socioeconomic indicators.
| Indicators | Description | Sources |
|---|---|---|
| Large livestock | Year-end inventory of large livestock | China Animal Husbandry Yearbook and Web of SOSHOO (https://www-soshoo-com-cn.webvpn.xju.edu.cn:8040/index.do, accessed on 12 December 2022) |
| Sheep | Year-end inventory of sheep (sheep and goats) | China Animal Husbandry Yearbook and Web of SOSHOO |
| Population | Year-end inventory of population | China Statistical Yearbook and Web of SOSHOO |
| Primary industry | Output value of the primary industry | China Statistical Yearbook and Web of SOSHOO |
| Forbidden grazing | Area of grazing prohibition, rest, and rotation | China Grassland Statistical Yearbook and Web of SOSHOO |
| Rodent and pest control | Area of rodent and pest control | China Grassland Statistical Yearbook and Web of SOSHOO |
Disclaimer/Publisher’s Note: The statements, opinions and data contained in all publications are solely those of the individual author(s) and contributor(s) and not of MDPI and/or the editor(s). MDPI and/or the editor(s) disclaim responsibility for any injury to people or property resulting from any ideas, methods, instructions or products referred to in the content. |
© 2023 by the authors. Licensee MDPI, Basel, Switzerland. This article is an open access article distributed under the terms and conditions of the Creative Commons Attribution (CC BY) license (https://creativecommons.org/licenses/by/4.0/).
Share and Cite
MDPI and ACS Style
Xue, Y.; Liang, H.; Ma, Y.; Xue, G.; He, J. The Impacts of Climate and Human Activities on Grassland Productivity Variation in China. Remote Sens. 2023, 15, 3864. https://doi.org/10.3390/rs15153864
AMA Style
Xue Y, Liang H, Ma Y, Xue G, He J. The Impacts of Climate and Human Activities on Grassland Productivity Variation in China. Remote Sensing. 2023; 15(15):3864. https://doi.org/10.3390/rs15153864
Chicago/Turabian StyleXue, Yayong, Haibin Liang, Yuanyuan Ma, Guoxuan Xue, and Jia He. 2023. "The Impacts of Climate and Human Activities on Grassland Productivity Variation in China" Remote Sensing 15, no. 15: 3864. https://doi.org/10.3390/rs15153864
Note that from the first issue of 2016, this journal uses article numbers instead of page numbers. See further details here.