

Dynamic Response Measurement and Cable Tension Estimation Using an Unmanned Aerial Vehicle

1
Department of Civil Engineering, Kunsan National University, Kunsan 54150, Republic of Korea
2
Department of Civil and Environmental Engineering, Korea Advanced Institute of Science and Technology, Daejeon 34141, Republic of Korea
3
Department of Artificial Intelligence, Hannam University, Daejeon 34430, Republic of Korea
4
Department of Civil and Environmental Engineering, Chung-Ang University, Seoul 06974, Republic of Korea
*
Authors to whom correspondence should be addressed.
Remote Sens. 2023, 15(16), 4000; https://doi.org/10.3390/rs15164000
Submission received: 30 June 2023
/
Revised: 29 July 2023
/
Accepted: 2 August 2023
/
Published: 11 August 2023
(This article belongs to the Special Issue Remote Sensing for Structural Health Monitoring and Structural Analysis in Civil Engineering and Industrial Facilities Structures)
Abstract
:Since all structures vibrate due to external loads, measuring and analyzing vibration data is a representative method of structural health monitoring. In this paper, we propose a non-contact cable estimation method using a vision sensor mounted on an unmanned aerial vehicle. A target cable among many cables can be identified through marker detection. In addition, the motion of the structure can be quickly captured using the extracted feature points. Although computer vision can be used to transform displacements of multiple axis, in this study, only the vertical displacement is considered to estimate tension. Finally, the cable tension can be estimated via the vibration method using the modal frequencies derived from the cable displacement. To verify the performance of the proposed method, lab-scale experiments were carried out and the results were compared with the conventional method based on the accelerometer. The proposed method showed a 3.54% error compared with the existing method and confirmed that the cable tension force can be estimated quickly at low cost.
1. Introduction
Cable-supported bridges are widely used as long-span bridges because of their structural efficiency, wind-resistant stability, and economical construction cost. There are two types of cable-supported bridges: cable-stayed bridges and suspension bridges. Cable-stayed bridges are more commonly constructed due to their better wind stability compared to suspension bridges. Among the several elements in the cable-stayed bridge, cables are essential components that support the deck of the bridge and distribute the external load to the entire bridges [1]. There are three types of stayed cables, which are Locked Coil Rope (LCR), Parallel Wire Strand (PWS), and Multi Strand (MS). Since they are coated to prevent corrosion and damage to the cable, stayed cables can be used semi-permanently. However, if the sheath of a cable is peeled off or damaged by heat due to fatigue load, the cable can be broken due to corrosion and weakness. It is necessary to continuously monitor and maintain the condition of the cable because repair and reinforcement are very difficult [2,3]. The fundamental method of inspecting a cable is visual inspection by a human. Visual inspection includes the protector, anchorage device, hanger band, and saddle, as well as the cable element. The inspector roughly checks the condition of the cable through close-up visual inspection and sounds. And, if necessary, auxiliary devices such as telescopes and endoscope are used. Visual inspection of cables covers paint damage and corrosion, deformation, breakage, and deterioration. In general, human power-based inspections have limited accessibility, and there are disadvantages in terms of usability even when bridge inspection vehicles (i.e., ladder trucks and platform-type vehicles) are used. In addition, there is the problem that visual inspection cannot completely evaluate the structural defects of the cable inside. Therefore, studies have been conducted using accelerometers, elasto-magnetic (EM) sensors, endoscopic equipment, ultrasonic systems, and structural acoustic control sensors to overcome the limitations of cable visual inspection performed by humans. Recently, research using climbing robots and vision sensors has progressed due to the development of robot and sensor technology. As a method of evaluating the condition of the cable, a measurement of cable tension has also been widely used. Cable tension is an important factor that is assessed at all stages because the cable supports most of the bridge loads in the construction and in-service phases of the bridge. When the cable has a structural problem, the mode frequencies are slightly shifted because the cable’s characteristics are changed [4]. In general, damage to the cable anchorage parts or corrosion of cable inner wires is known to change cable tension. Therefore, reliable response data acquisition is needed to confirm slight changes in the cable mode frequencies and continuous cable tension monitoring strategy.
The cable tension estimation method can be roughly classified into direct [5] and indirect methods [6,7]. The direct method, also called a lift-off test, checks the tension force using a road cell, a displacement sensor, and a hydraulic jack. Tension measurements can present a force–displacement relationship by pulling the cable after installing sensors on the strands of the cable. At this time, the pulling force exceeds the tension of the cable, and the moment when the wedge is lifted is measured. This method has the advantages of being simple and accurate and does not require additional processing. However, sensors that use the direct method to estimate tension need to be installed during the cable installation process, and it is costly to install and maintain these sensors. It is also difficult to perform sensor calibration after installation. When using the indirect method, also called the vibration method, a sensor such as an accelerometer is installed on the cable to measure the vibration response. The mode frequencies derived from the vibration data are used to estimate the tension force. This method can estimate the tension force by installing a sensor even after the cable has already been installed on the bridge. Generally, if the cable is not sagging, various natural frequencies are extracted from the vibration data. Then, the first-order regression is performed considering each natural frequency and the order of the mode. Finally, cable tension can be estimated [8,9]. However, the sensor should be installed for each cable, and power and signal lines are required in order to utilize the vibration method. In addition, there is a limitation that an additional mass should be considered because of the bracket needed to install the sensor. To overcome these limitations, non-contact sensor (i.e., microwaves [10,11,12], lasers [13,14], vision [15,16,17,18,19,20], etc.)-based tension estimation methods have been proposed. Non-contact sensors do not need to consider damage to the surface paint of a structure and can measure multiple targets simultaneously compared with contact systems, which can only provide limited information. Since microwaves and laser measurement equipment are expensive, vision-based approaches have been considered for cable tension estimation. Vision-based tension estimation methods have slight variations, but there is a standard procedure [21,22,23,24]: First, set the camera to a fixed fiducial to the RoI of the cable. Next, record with a vision sensor, extract the cable area, and designate it as the RoI. Then, check the change in position using the subpixel orientation code matching algorithm. Finally, the cable tension is estimated using the vibration method. This method is limited to civil infrastructures built on rivers, roads, or seas when installing cameras [25]. Also, over long distances, it can be difficult to set the RoI per cable. Finally, subpixel algorithms often face various adverse conditions, such as weather, light-intensity fluctuations, and focus shifts.
Recently, many countries, including the United States, have been applying UAV (unmanned aerial vehicle) technology to bridge inspections. Unmanned aerial vehicles (UAVs) or unmanned aerial vehicle systems (UASs) overcome the limitations of traditional vision-based structure inspections by bringing cameras closer to structures. Many studies are being conducted in Europe, Japan, China, and Korea to inspect bridges using this technology [26,27,28,29]. Although UAV-based bridge inspections still have many challenges to overcome [30,31], UAVs are widely utilized in various civil engineering fields due to their ability to rapidly inspect bridges and reduce maintenance costs. However, since UAVs exhibit slight motion even in hovering states, research measuring the vibration of structures, similar to the vision-based approach, is not extensive. Most studies primarily focus on damage detection on bridge surfaces and the development of flight technologies over bridges. Tian et al. [32] confirmed the validity of UAV and computer vision-based cable tension estimation. The proposed method uses a line segment detector and a line segment matching algorithm that determines the edge of the cable in the captured video. The displacement of the cable is obtained by determining the RoI from several frames of the video and deriving the amount of change in the segment. This study contributes to the fact that structural identification was performed using UAV and computer vision. However, this method is not suitable for actual bridge sites. For example, consider a cable-supported bridge with a central main span of 344 m and 60 installed cables [33]. Detecting line segments for each cable and applying a segment matching algorithm is challenging due to changes in focal length or complex backgrounds. In addition, there is a limitation when it comes to determining the RoI from an image frame by an operator. Finally, it is difficult to capture and manage vibration images of about 60 cables for tension estimation.
In this paper, a non-contact cable tension estimation technique is proposed using a UAV and a marker. In the experiment, an ArUco marker and accelerometers were attached to the stayed cable, and the marker’s behavior was captured using a vision sensor mounted on a commercial UAV. The use of markers in vision-based vibration measurement studies is an additional task. However, the ArUco marker was used in this study because it can identify the cable using an OpenSource library and is highly applicable. The collected image data were converted into displacement data using the optical flow method. Finally, the cable tension force was estimated by using the vibration method, and compared experimentally with the conventional method. This paper is organized as follows. Section 2 presents the research background for the ArUco marker and the vibration method-based cable tension estimation. Section 3 presents the estimation procedure for cable tension forces based on the vibration method using a UAV. In order to validate the performance of the proposed approach, lab-scale tests were carried out in Section 4, and Section 5 concluded this study.
2. Research Background
2.1. ArUco Marker
The ArUco marker, an OpenSource library-based binary square fiducial marker written in a certain format, can be used for camera pose estimation [34]. In this study, an ArUco marker was used to increase the accuracy of features for the cable behavior. The ArUco marker consists of a two-dimensional bit pattern of N × N size and a black border, which surrounds a pattern. The black border helps us to quickly recognize the marker during image processing, and the specific pattern is comprised of white and black binarized cells to represent a unique ID [35]. This could be used to identify multiple cables for the future field experiments. In addition, when performing tension estimation of cables in a bridge, the accuracy of filtering noise components such as the vibration caused by wind and GPS errors can be improved through pose estimation of the vision sensor mounted on the UAV. Figure 1 shows the ArUco marker with the same ID according to the N × N size. As mentioned earlier, since ArUco is a fiducial marker, every marker in the dictionary can select the same number of blocks or bits (, , , or ), and each dictionary has a fixed number of markers (50, 100, 250, or 1000). Therefore, a marker can be automatically generated by selecting a specific size and a unique ID according to the desired purpose. Markers can be detected automatically using the ArUco marker detector provided via OpenCV. The processing method of this detector is as follows: (1) analyzing the image to find the square shape that can be a marker, (2) performing marker segmentation and extracting the contour, (3) filtering, (4) conducting perspective transformation of the marker, (5) separating white and black bits using the Otsu algorithm, (6) extracting the bits of each marker, and (7) analyzing bits and verifying marker IDs.
2.2. Vibration Method for Cable Tension Estimation
Because sagging of the stay cable is typically small compared to its length (1% sag-to-length ratio or less), the cable is perfectly elastic and is modeled by the motion of the taut string. The taut string (i.e., no sag, ) model of the cable vibration neglects some dynamic characteristics, such as sag-extensibility and flexural rigidity. Therefore, the cable tension can be estimated from the formula of the taut string theory:
where is the measured nth-order natural frequency (Hz), T,W,g and L refer to the cable tension force, weight per unit length, gravitational acceleration constant, and effective length of the cable, respectively. Equation (1) shows the relationship between the cable tension force and the natural frequency of the vibration mode. If , the same value of the tension can be obtained for all vibration modes. However, the actual cable does not have a linear relationship for all modes because its behavior is affected by flexural rigidity and sag-extensibility. Since the measured natural frequencies are larger than the theoretical value of the taut string, the estimated tension of cable using Equation (1) is smaller than the actual value. Therefore, it is necessary to consider the terms of flexural rigidity and the sagging effect of the cable in order to precisely estimate the cable tension. The correlation between the measured natural frequencies and the order of modes can be expressed using Equations (2) and (3).
where is the nth damping ratio of the cable, is the axial stiffness proportionality factor related to the sag, and is the cable flexural rigidity [7,36,37]. The natural frequency corresponding to each mode can be extracted from the measured vibration data using the power spectral density (PSD) and the peak-picking method. If the first term on the left is selected as the y-axis and n is selected as the x-axis, the equation for the straight line can be obtained through linear regression analysis. Finally, the cable tension is estimated by calculating the y-intercept (a) via the first-order regression analysis.
3. Cable Tension Estimation Using a UAV
In this section, the proposed UAV-based non-contact cable tension estimation method is described. UAVs can quickly capture target structures without having to install sensors on them. Figure 2 shows a schematic diagram and the tension estimation process. When the cable is vibrated using an exciter capable of applying a sinusoidal load, the attached marker moves accordingly. First, the movement of the marker is captured as a video using the vision sensor mounted on the UAV. Since an ArUco maker is used, it is possible to automatically select the marker’s RoI and obtain an ID from the collected images. Additionally, feature points within the selected RoI are extracted using an image processing algorithm. Finally, the displacement is tracked by the KLT tracker [38,39], which predicts object motion at the same feature distance between two adjacent frames. In this way, dynamic displacement can be obtained and cable tension can be estimated using the vibration method.
3.1. RoI Selection by ArUco Marker
The ArUco marker attached to the structure is a fiducial marker and it is made in a certain format. Therefore, it has the advantage of being strong and accurate while also achieving rapid detection. It also automatically selects RoIs for markers in the image. In this study, markers were detected using OpenCV’s Aruco Module (4.7.0-dev.). Marker detectors contain user-modifiable parameters. Parameters include thresholds for binarization of images, outline filtering, minimum distance in pixels, etc., and are adjusted to detect marker candidates. After detecting marker candidates, marker bits are extracted. Finally, the markers are identified through a bit analysis process that removes perspective distortion by calculating the width of the marker border and the number of black and white pixels. When the marker ID is detected, cable information can be obtained from the server by quickly measuring the tension of numerous cables on an actual bridge. Since this paper mainly aims to evaluate the validity of cable tension estimation using a UAV, obtaining cable information from the server was not considered. The next step after selecting the RoI of the marker is to extract its feature points. There are several algorithms used to track the correlation of feature points in different frames, but in this study, the Speeded-Up Robust Features (SURF) algorithm was applied. This is an algorithm that finds the same scene or object using the feature points and has the advantage of shortening the search time by changing the size of the box filter. Figure 3a shows the marker ID along with the selected RoI from the ArUco marker attached to the center of the cable. The detected marker ID is displayed as 20. Figure 3b shows the feature points extracted within the RoI.
3.2. Vision-Based Displacement Transformation Method
After the marker is detected, features within the marker can be extracted and traced via optical flow. Here, the detection rate of the marker can be set based on the allowable tolerance. Optical flow considers only the contrast change in the two consecutive frames. Therefore, it is an independent method for the object because it does not detect objects or reflect the movement of the object. However, optical flow can be considered to express a motion field, implicitly representing the motion of the object, since the contrast is affected by the object’s behavior. To estimate optical flow, the assumptions of brightness constancy and small motion are made. The former assumes that the same point of an object in two consecutive frames has the same or similar intensity values. The brightness constancy is assumed to ignore the difference in contrast that changes depending on the illumination and the angle between the surface of the object and the light source. This assumption is widely used in the optical flow method because its error can be ignored unless during a specific situation. If the pixel of a specific point of view frame is called and it moves by the distance of in the consecutive frame, it can be summarized as follows.
The second assumption, small motion, means that if the time difference, , between two frames is sufficiently small, the pixel’s movement (, ) is also small. Therefore, under the condition of satisfying the small motion assumption, Equation (5) can be rearranged according to the Taylor series, as follows. In this equation, terms higher than the second order (i.e., higher-order term, H.O.T.) are negligible compared to the first-order terms due to their significantly smaller magnitude.
where of the new pixel moved by for is equal to of the original pixel. Therefore, Equation (5) can be replaced to , and dividing both sides by results in Equation (6), which is called the optical flow constraint equation or gradient constraint equation.
where u and v are components of the motion vector, , , and are derivatives of the image at . In this study, the Lucas–Kanade algorithm and the KLT tracker were used to track the behavior of pixels representing features in the marker. The Lucas–Kanade algorithm is often used to detect motions via the vision sensor, and it is assumed that the motion vector of the window region, also called the region of interest (RoI) , which is centered on the pixel in a local way is the same. In addition, all pixels in the RoI must satisfy Equation (6). All pixels in the neighboring region can be represented by , where n is the number of pixels in the RoI. The motion vector, , is obtained by transforming Equation (6) into a matrix form and using the least square method.
where , , .
If the weight is gradually applied to the center of the ROI, a high-quality motion vector can be obtained. Therefore, the motion vector can be expressed via the following equation, which applies the Gaussian as a weight.
The KLT tracker was used to track the features of object trajectories and derive displacement of the marker in the optical flow. KLT can calculate all variables of the frame regardless of the next frame by using the Hessian matrix, , in Equation (8). If there is no change in the Hessian matrix, this matrix and the motion vector will become 0. The KLT tracker ignores these values and takes the point as a feature if the size of the small value of the H matrix’s eigenvalue is greater than the threshold. Therefore, the KLT selects the point with two eigenvalues (i.e., , ) that are larger than the threshold (). This means that the KLT does not track small changes in contrast and changes in contrast to one direction, but tracks where there are changes in multiple directions.
3.3. Cable Tension Estimation Using the Vibration Method
This section describes the procedure used to estimate the cable tension via KLT algorithm-based cable displacement tracking data from video frames. The cable tension estimation method, which is based on the vibration method, will be briefly explained, since many studies have been conducted using this method. Figure 4 shows the procedure for estimating cable tension via the displacement tracking data obtained through the KLT. The first step is high-pass filtering. In general, when the vibration is measured using a wired or wireless accelerometer, a specific frequency range is filtered through signal processing. The drone collects a video while hovering; however, noise occurs because it is not completely stationary. This is due to high-frequency vibrations of mechanical systems, GPS altitude errors, and movements that control the drone’s altitude. Therefore, a filtering process is implemented to obtain an accurate dynamic response [25,40]. In order to set the frequency to be filtered, the vibration component generated in the hovering state of the drone was confirmed through a lab-scale experiment. As a result, it was confirmed that the vibration that occurred in the frequency domain was less than 1 Hz. Since the vibration method-based tension estimation does not use the low natural frequencies of the cable, drone vibration during the hovering state can be processed through high-pass filtering. Although the mechanical vibration may occur in the UAV system, however, this was not considered in this study because it is small in the hovering state and has a high vibration frequency range different from the natural frequency range of the structure. Next, the filtered displacement time history can be transformed to a power spectral density (PSD) using a fast Fourier transform (FFT). It can be assumed that each significant peak in the frequency–response graph corresponds to the eigenmode of the cable. Here, we considered the Peak-Picking method among the several methods which can be used to extract peaks. Then, the cable tension could be calculated by performing linear regression using the natural frequency of the cable corresponding to the extracted peak and the cable parameter.
4. Experimental Validation
This section covers the experimental validation of the UAV-based tension estimation approach. Two commercial drones (i.e., Mavic Pro and Phantom 4, DJI, Shenzhen, China) were used in the experiment. In Section 4.1, a shaking table test was conducted to confirm that the proposed method can achieve dynamic response acquisition of the system. Here, the vibration of the drone in the hovering state was measured and frequency analysis was performed. Then, by attaching a marker to the shaking table, it was confirmed whether the response could be measured for the input frequency. Section 4.2 shows the result of estimating the tension for the cable installed in the laboratory.
4.1. Dynamic Response Acquisition Using Shaking Table Test
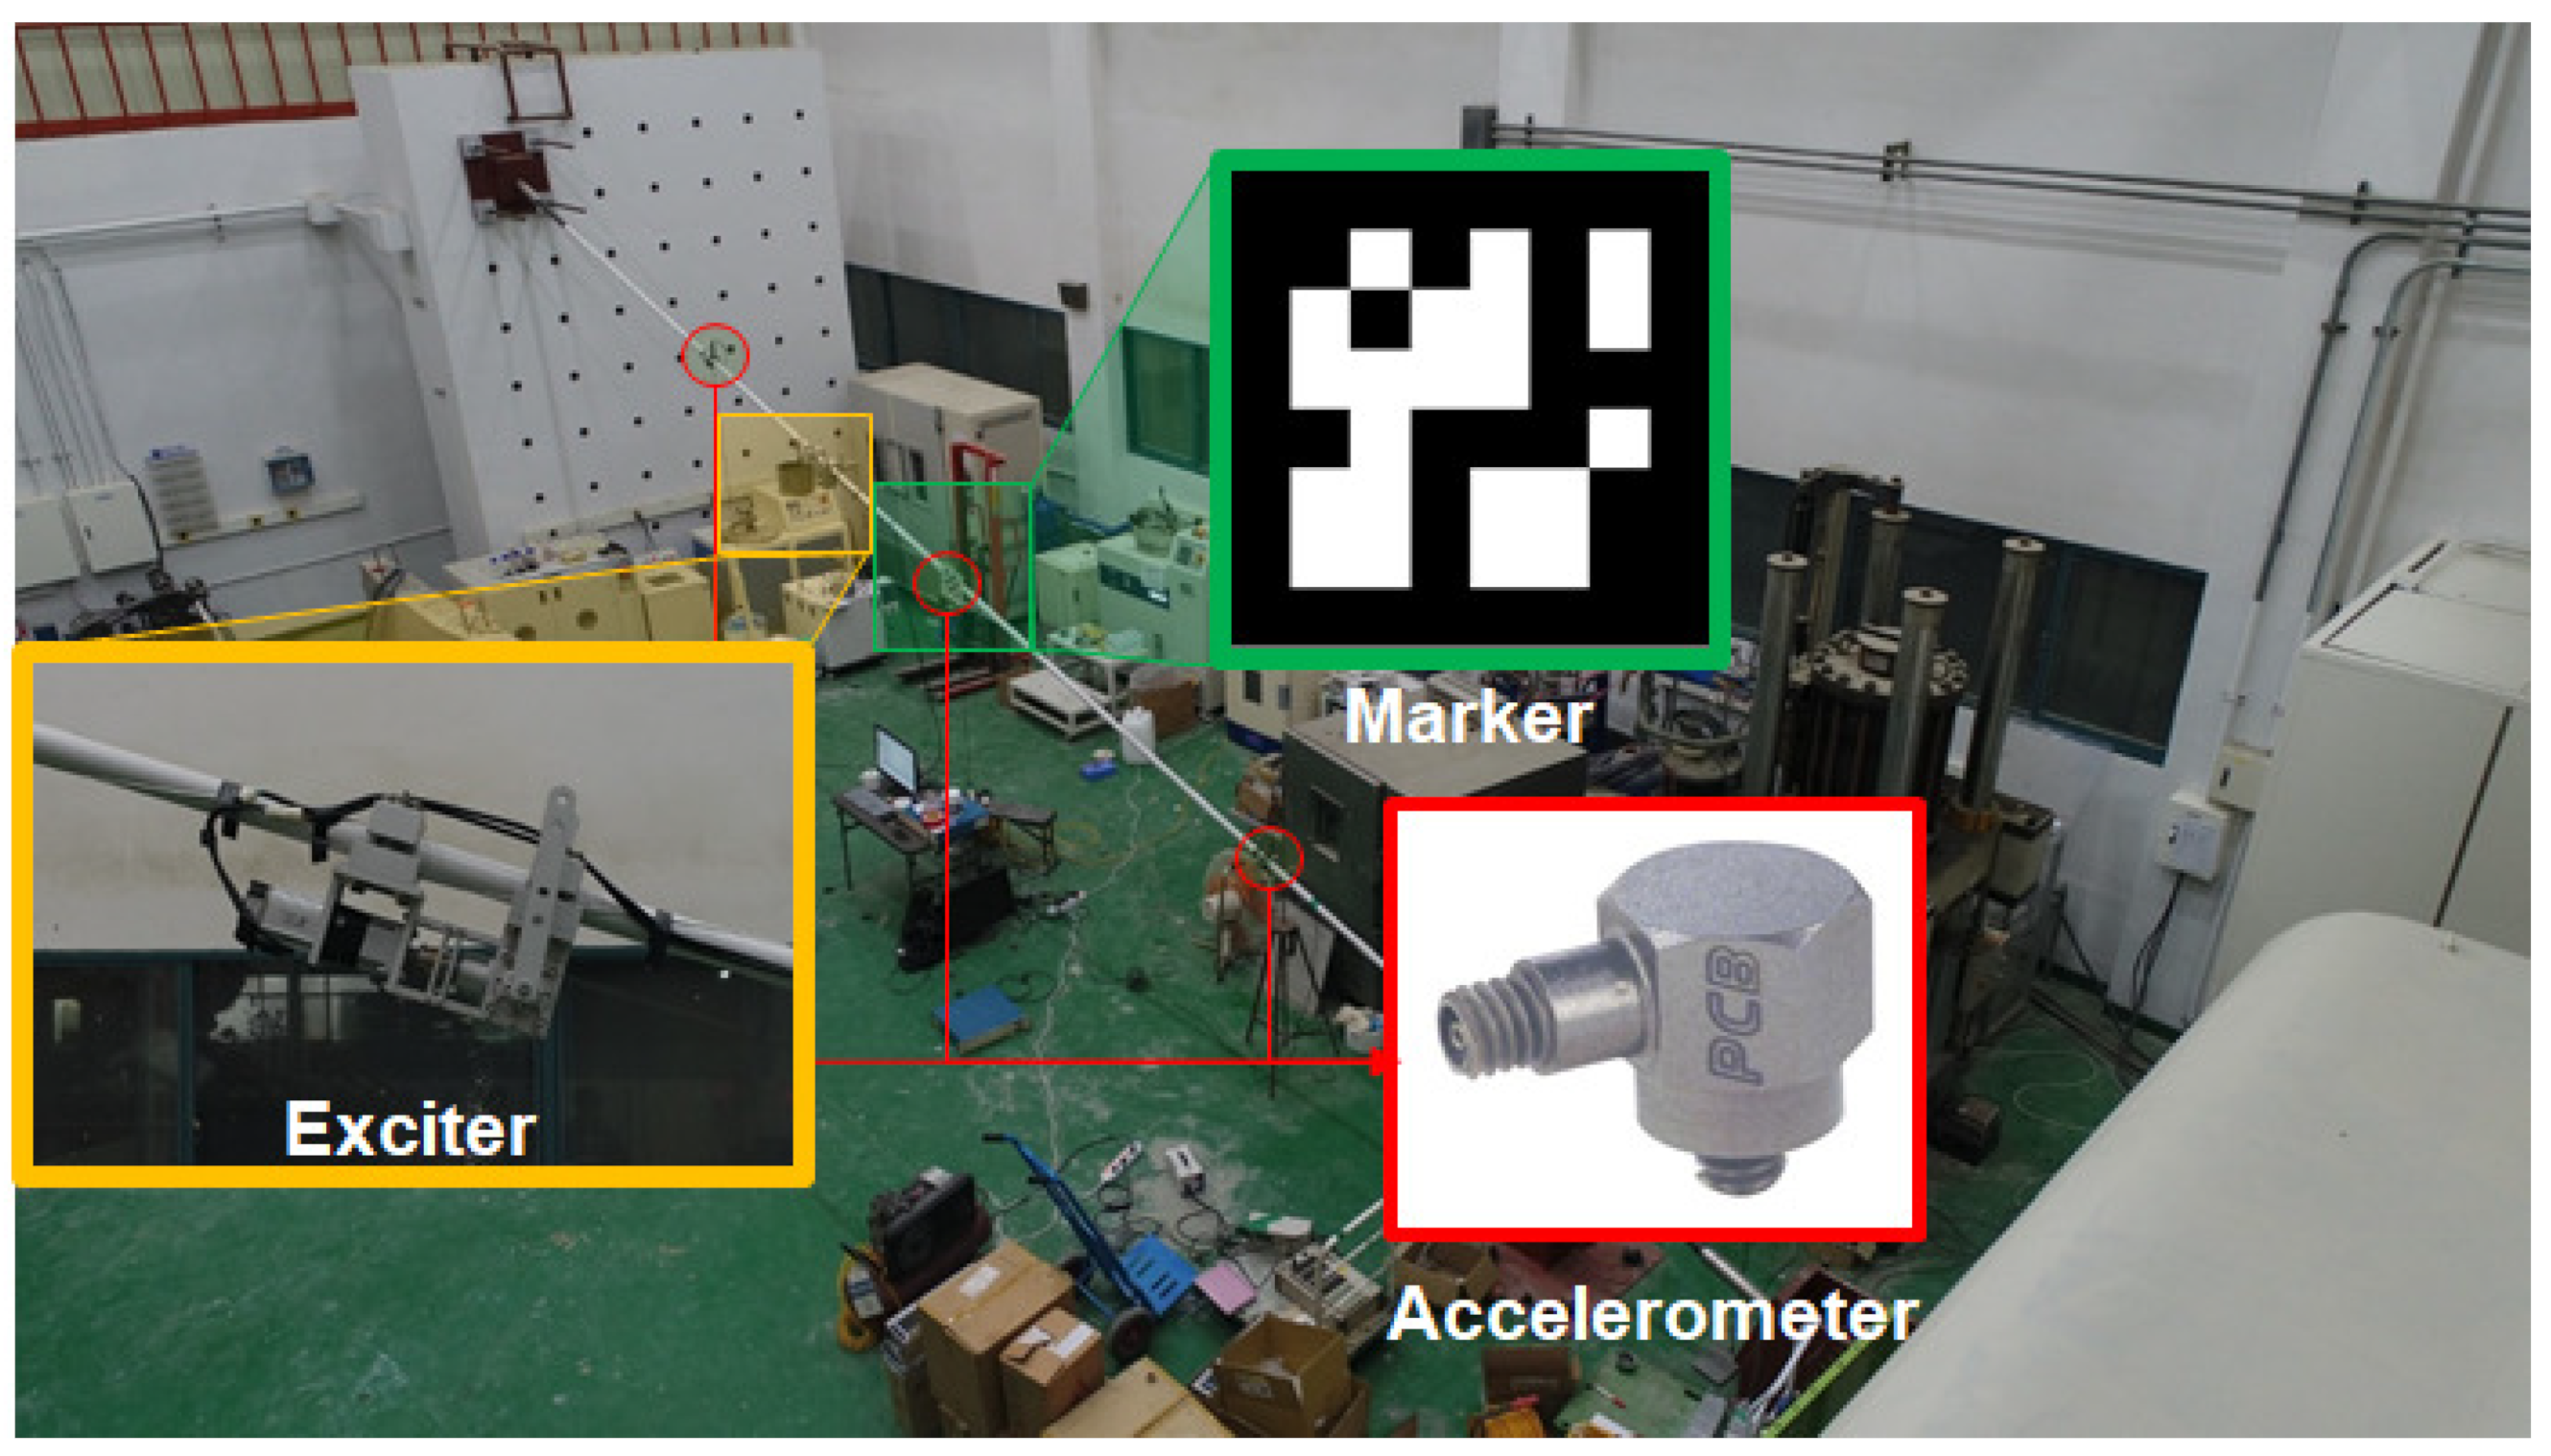
To verify the accuracy of the proposed approach to dynamic response acquisition, a shaking table experiment was first performed in the laboratory, as shown in Figure 5. In this experiment, an analysis of the vibration frequency of the drone in the hovering state and identification of the frequency domain from the displacement measured by the drone was performed. The shaker used in the experiment was Spektra’s DE/APS 400 model (SPEKTRA Dresden, Dresden, Germany), which can perform horizontal and vertical vibration experiments, and its maximum force was 445 N. The maximum stroke between the two peaks was 158 mm, which is an appropriate specification for the experiment. Because the experiment was conducted in an indoor space, a micro-UAV and the Mavic Pro were used for safety. The created markers were attached to the top surface of the vibrating shaker. In addition, an experiment was conducted to measure the displacement using the captured image frame and the proposed method. As for the input of the shaking table, sine waves with various excitation frequencies in the range from 1 to 10 Hz were considered. Additionally, the Mavic Pro drone was set to a camera FPS of 120 FPS, and the experiments were conducted accordingly. Finally, in order to measure the actual displacement of the marker, a laser doppler vibrometer (LDV) was installed at a fixed position on the shaking table for comparison with the experimental results.
In this experiment, the UAV was able to capture the ArUco marker on the shaking table from the front. The amplitude of the shaking table was adjusted to about 4 cm based on the LDV, and the distance between the drone and the shaking table was maintained at about 2 m.
The movement of the UAV while hovering introduced noise into the signal, and the measured displacement became entangled with the low-frequency drift. The purpose of this experiment was to confirm that dynamic components can be detected in the general vibration frequency range of the cable even when the drone is in motion.
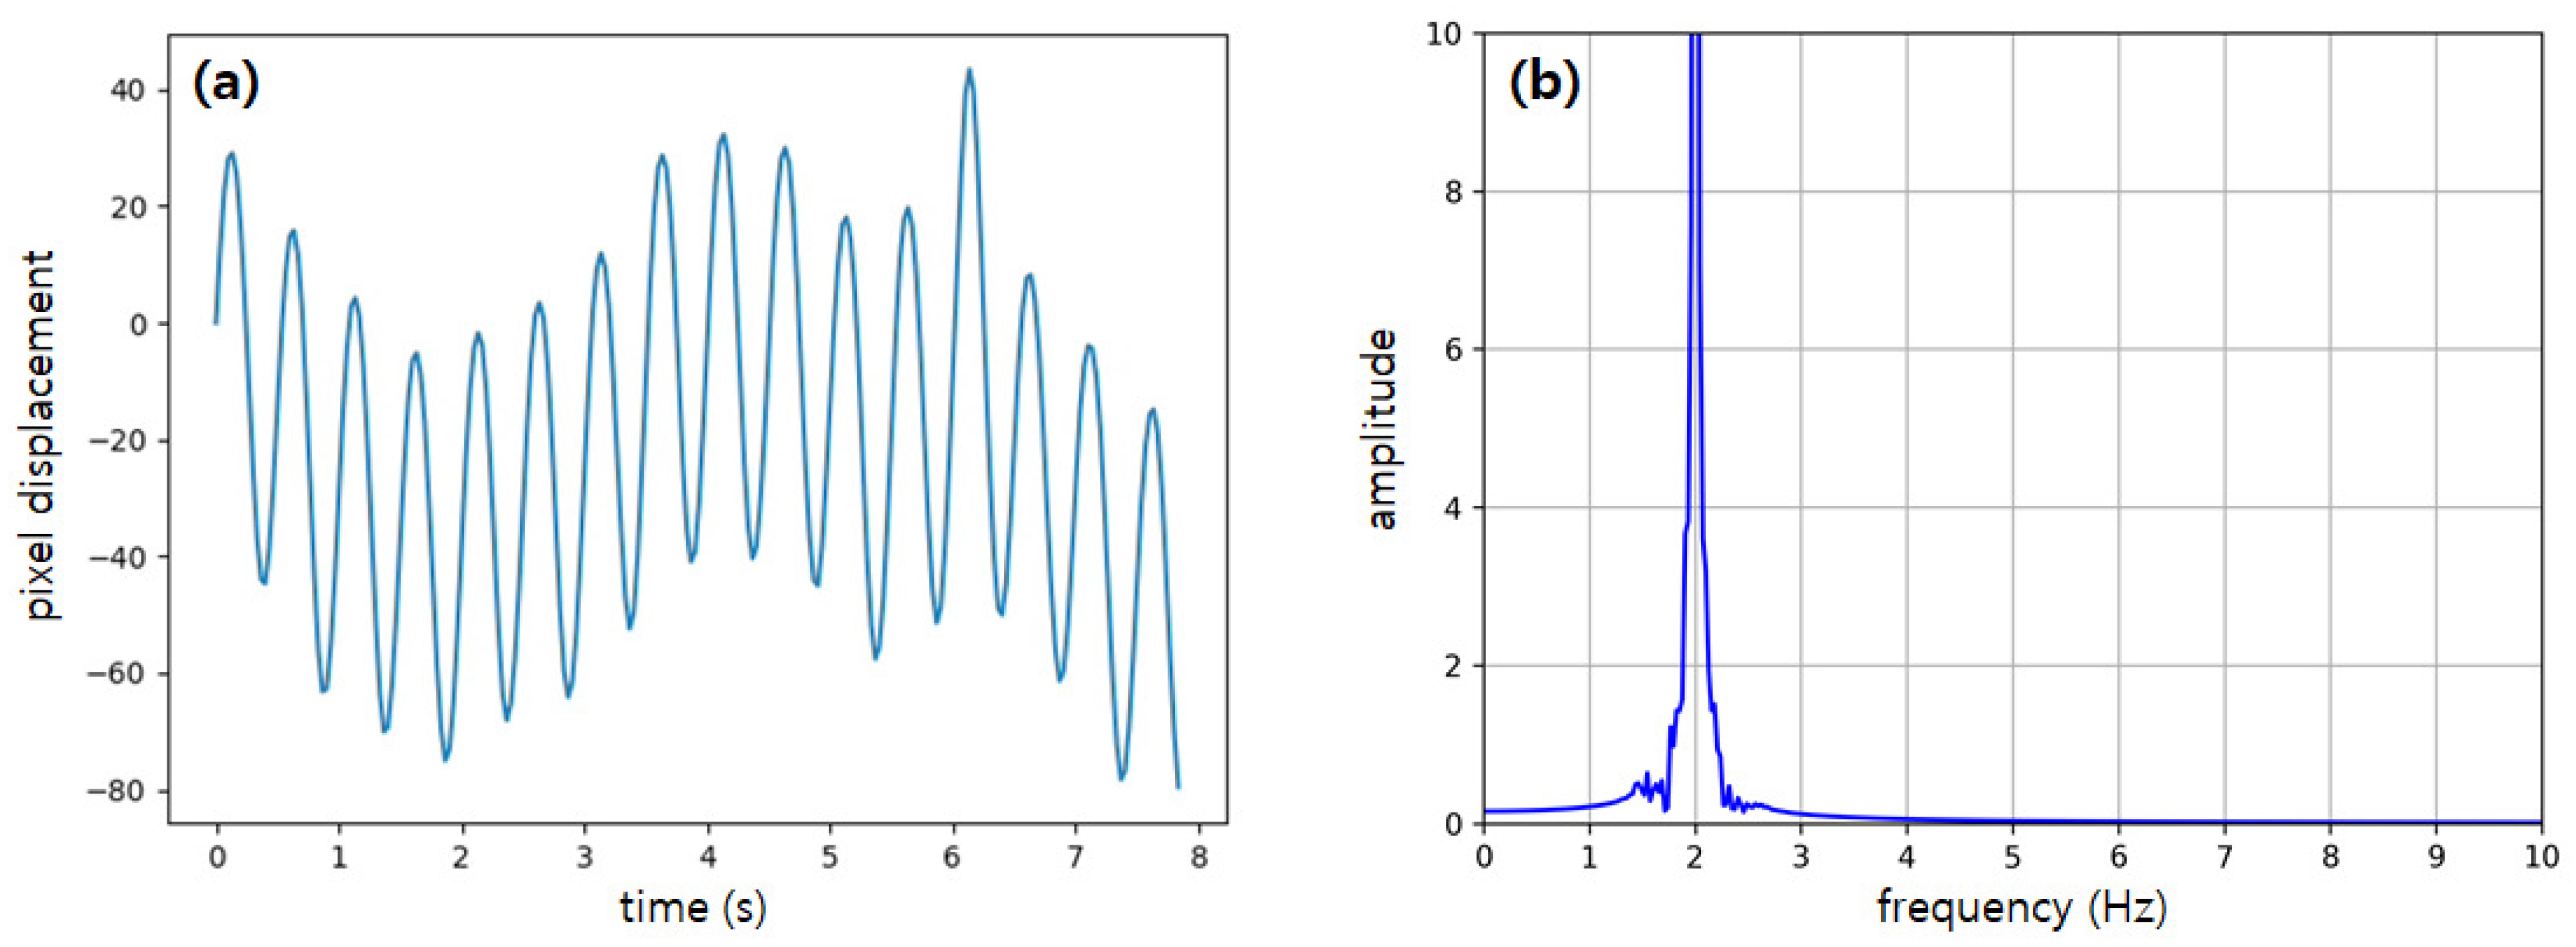
Figure 6 is a graph of the displacement data obtained from the above experiment and the cross power spectral density (CPSD) obtained through the FFT process. Figure 7 is the CPSD result for even Hz. Based on the experimental results, it can be confirmed that the vibration frequency component of the vibration table can be detected using a drone.
4.2. Cable Tension Estimation Using Lab-Scale Test
In the shaking table experiment above, it was confirmed that the dynamic response can be precisely obtained using UAV. In this section, the results of tension estimation experiments are presented using cables installed in the laboratory of Korea Advanced Institute of Science and Technology. The length of the cable was 11.8 m and it had an inclination angle of 18.72 degrees. One end was connected to the anchorage installed on the floor, while the other end was connected to the fixing plate connected to the shear wall. Prior to the experimental verification of the proposed method, an acceleration sensor was installed to measure the data, and the tension of the cable was confirmed using the vibration method. There is also a method which involves directly measuring cable tension using a load cell; however, since the vibration method has been verified by many studies [41,42], this experiment employed the vibration method. Although the accuracy of the tension estimation method using the vibration method will be different depending on the presence or absence of dampers and the sagging of a cable, the calculated error was less than 5% when compared to the direct measurement method under conditions similar to this experiment. Therefore, this result was compared with the result of the proposed method. Table 1 shows the parameters of the stay cable used in this study. In this section, each process of the proposed cable tension estimation algorithm was experimentally verified.
Figure 8 shows the installed cables and experimental setup. The cable was fitted with three accelerometers, an acquisition device capable of receiving data, an ArUco marker, and a cable exciter. The cable exciter used in the experiment was directly manufactured from a previous study, which consists of a controller, a motor, and two mass bodies. The torque of the cable exciter was designed to be about 4 Nm. The frequency band was designed to be a maximum of 10 Hz with a constant torque. Finally, the instantaneous maximum torque was designed to be 7.5 Nm, considering the acceleration torque and safety factor of 1.5 [43]. This cable exciter can adjust the excitation force of the exciter by adjusting the length of the moment arm and the mass of the weight. The harmonic excitation force transmitted to the cable by the exciter is as follows [44]:
where is the sum of the two rotating masses, e is the radius of the rotation and is the frequency of the rotating masses. The exciter can generate a sine wave of the mode frequency through a switch, and it can also generate an arbitrary waveform via a program. In this experiment, the vibration was performed in consideration of the natural frequency of the first mode of the cable, and when the desired appropriate amplitude was reached, the excitation was stopped and the system was allowed to vibrate freely. In addition, an impact load test was also performed on the cable, in which the vibration was measured by applying an impact to the cable with a hammer.
The marker used in this experiment was downloaded from an online ArUco marker generator (http://chev.me/arucogen/, accessed on 10 August 2023). ArUco markers are standard 2D square markers from the OpenSource library, which allows you to create markers with a specific pattern by selecting the marker’s ID, size, and dictionary. The marker attached to the center of the cable was printed as an SVG (Scalable Vector Graphics) file. Since ArUco is a standard marker, the corresponding marker was created by determining the ID and dictionary of the marker. The ID of the marker used in this study was 20, with a size of 50 mm. The dictionary of the marker was 6 × 6 (50, 100, 250, 1000). We also captured the movement of the markers using a commercial drone (i.e., Phantom 4 Pro, DJI). In the cable experiment, experiments were conducted with different frames per second (FPS) settings to compare the tracking performance of the dynamic objects. For the purpose of comparison with the proposed method, acceleration sensors were installed on the cable at a distance 25%, 50%, and 75% away from the fixed anchor, as shown in Figure 8.
In the cable tension estimation experiment, real-time tension estimation was not considered in this study. In this experiment, the vibration image of the cable was taken with a drone, and the tension was estimated through subsequent work.
The field of view (FoV) of the camera mounted on the UAV was fixed to the marker installed in the center of the cable, and the UAV collected images while hovering. In addition, using the ArUco marker detection algorithm, markers in an image frame were detected. When a marker is detected, the marker’s ID and RoI are automatically detected, as shown in Figure 3a in Section 3.1. Also, feature points are automatically extracted within the RoI of the image. This series of automated procedures has many advantages in cable tension estimation. In the field of conventional computer vision, installing markers on target structures can be considered negative, but if the surface is marked in the manufacturing stage of cables, cable information, maintenance, etc., can be included in the markers. Since this study was conducted to confirm the feasibility of the UAV-based cable tension estimation method, only the information on a single cable was considered. In addition, by selecting the fiducial marker, the problems of the RoI selection and feature point extraction, which were considered difficult in vision-based structure inspection, were resolved. Lastly, although not considered in this study, ArUco marker-based augmented reality (AR) can be applied in 3D pose extraction for structural health monitoring, which widens the application field.
When the cable vibrates, the marker also vibrates, and the motion vector between the previous frame and the current frame can be obtained through the optical flow of feature points. Finally, the vibration displacement of the cable can be calculated considering the position of the marker and the homography between the frames. Through the feature points of the image, the same scene or an object can determine the vibration displacement by implementing the algorithm SURF (Speed-up Robust Feature). Figure 9 and Figure 10 show the displacement response under the impact and the sinusoidal excitation, respectively. Experiments were conducted with a difference between 50 FPS and 120 FPS for each load condition. Using optical flow, displacement in pixel units can be obtained for each the feature point (Figure 9a,c and Figure 10a,c). In the figure, there is a difference between the center position and feature point of the camera mounted on the UAV. Therefore, it can be confirmed that a drift appeared in the feature point displacement on the marker. Using signal processing techniques such as filtering and data smoothing, a clean mm-unit displacement was obtained as shown in the figure on the right. The inset of Figure 9b shows the displacement results that are combined from multiple feature points.
In the impact case, the time history result appears as free vibration due to the low damping of the cable. And in the sinusoidal excitation case, the amplitude increases during the 10 s of the excitation, and then free oscillation occurs when the excitation is stopped.
The experiment was performed twice for each load condition and FPS setting. The results according to the camera’s FPS setting (i.e., 50 FPS, 120 FPS) do not differ significantly when viewed with the naked eye. However, in order to avoid aliasing according to the Nyquist–Shannon sampling theorem [45], which is a signal processing theory, the sampling rate should be set to more than twice the highest frequency component of the vibration signal. Therefore, in this study, the eigenmode of the cable below 25 Hz was used for tension estimation in order to compare the results according to the difference between the two FPS.
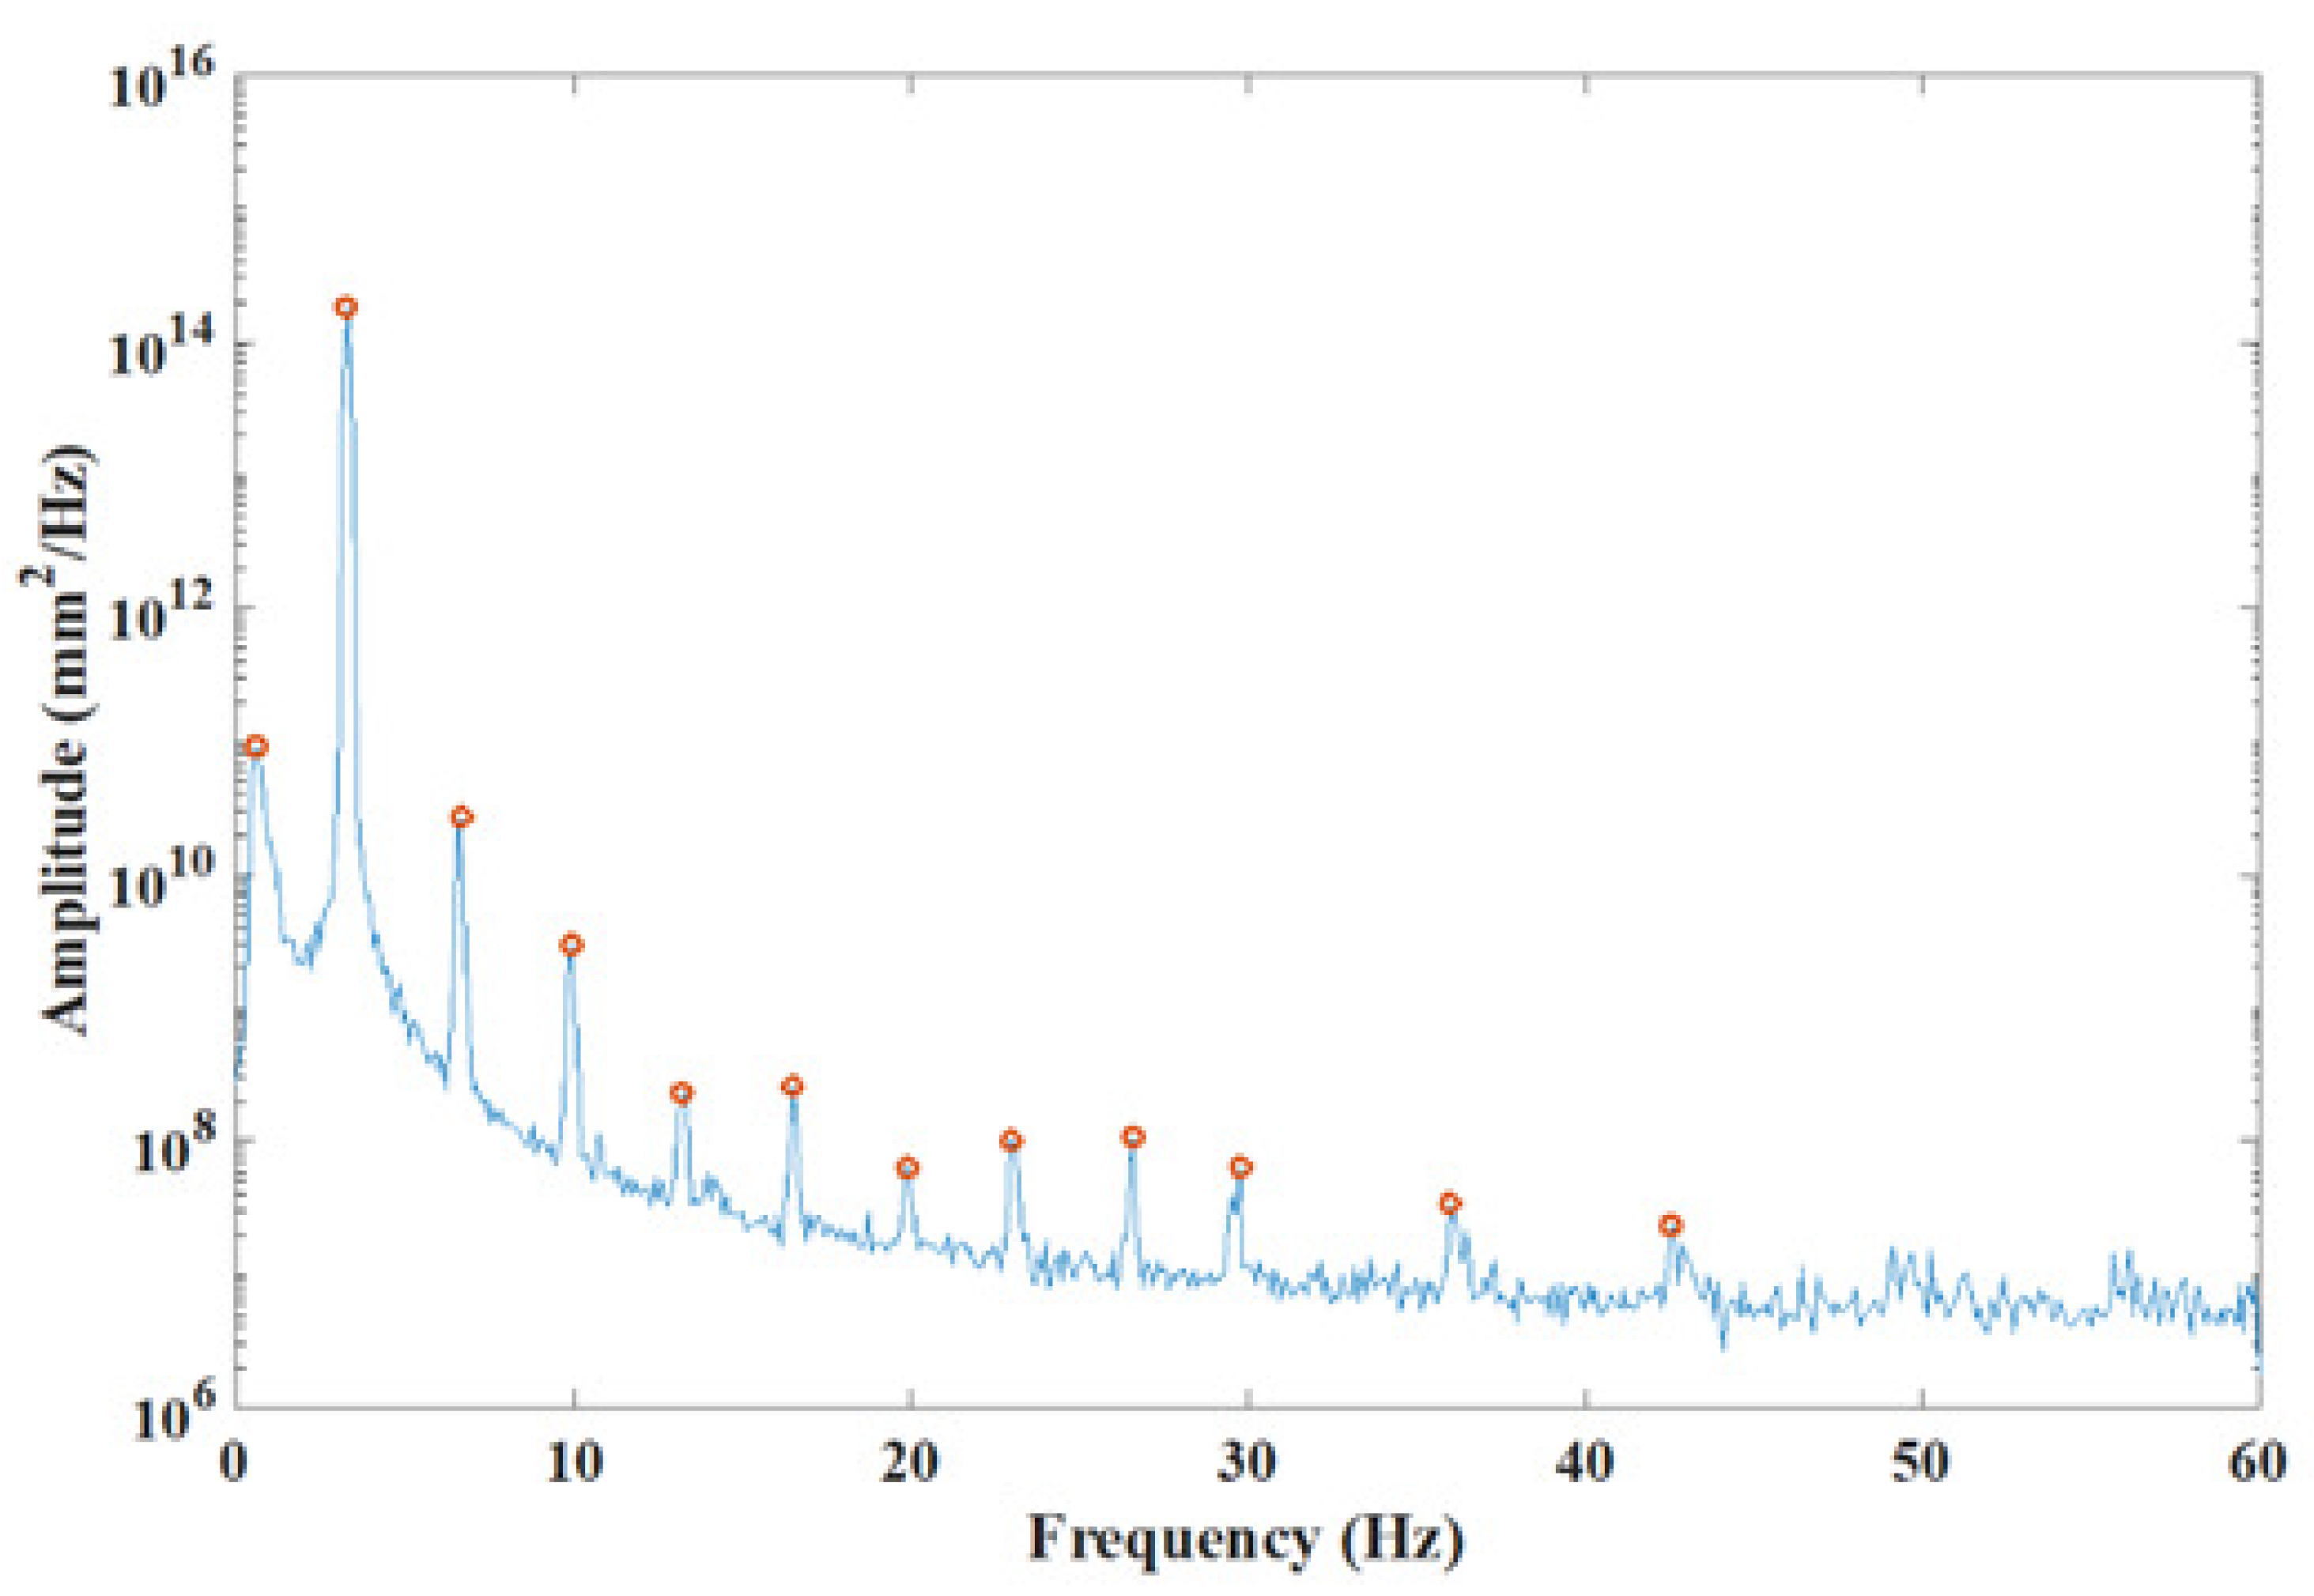
Figure 11 show the result obtained by performing FFT on the time history data (i.e., Figure 10d) obtained at 120 FPS for the sine load. When generating displacement data, signal processing techniques such as filtering and data smoothing were implemented in the same way as the shaking table test, so it can be confirmed that the peak appeared clearly in the frequency domain. The selected peaks in the frequency domain are used for modal analysis in vibrating systems. Peaks expressed in the frequency domain as eigen-modes of the system are intuitively revealed and are therefore widely used [46,47]. A common strategy relating to the peak picking method is to select the maximum value in the frequency domain of the structural response as the peak and each peak in a user-defined sub-frequency range. In the PSD result, the circles represent the peaks derived via the peak picking method. The frequency corresponding to each peak represents the natural mode frequency of the cable. In this study, to reduce the error, the first or higher frequencies among the frequencies obtained through the peak-picking method were excluded. To compare 50 FPS and 120 FPS results, a value of less than 25 Hz was used. As a result, natural frequencies from the first mode to the fifth mode of the cable were obtained. Table 2 shows the natural frequency values for each mode of the cable obtained through this method.
The results of linear regression, , using the values in Table 2 are shown in Figure 12. In the linear model, the slope (a) and the intercept (b) were calculated to be −0.00084 and 10.98, respectively. Then, the tension of the cable was estimated to be 25.86 kN using the following formula: .
In this study, the experiments were conducted twice with different loads (i.e., sine loads and impact loads) and FPS (i.e., 50 FPS and 120 FPS). The acceleration was measured by fixing the sampling frequency to 120 Hz. Figure 13 compares the tension results obtained using the conventional method versus the proposed method. The x-axis in the figure shows 50 and 120 FPS, respectively, for subscripts 1 and 2 of the load. As a result, the average of the tension values using the conventional method and the proposed method was found to be 24.89 kN and 25.77 kN, respectively, with an error of 3.54%. In this experiment, there is a possibility that the noise was included in the data because the impact load was applied using manpower. When considering only the sine load, which uses an exciter, the error rate was reduced to 1.69%. Therefore, it can be verified that the proposed method is a valid tension estimation method.
5. Conclusions
In this paper, a non-contact cable tension estimation method using a camera mounted on an unmanned aerial vehicle and an ArUco marker is proposed. There are many advantages of using ArUco markers as fiducial markers. The RoI can be selected automatically from the video frame both quickly and accurately. And since it is a fiducial marker, the marker’s ID can be quickly determined. Estimating cable tension in cable-supported bridges with dozens of cables is time consuming and costly. Existing vision-based cable tension estimation methods require a camera to be installed at a fixed location, and there are difficulties with the RoI selection and cable information management. Therefore, it is difficult to apply the existing vision-based cable tension estimation method to the field. However, the proposed method using a UAV and an ArUco marker has the advantage of overcoming the existing methods and estimating cable tension quickly, without complicated settings. In particular, it is possible to quickly estimate the tension of the cable by including the information of the ArUco measured cable, and efficiently manage the cable measurement data. In this study, an experiment was conducted to measure the dynamic response of a structure using a UAV and an ArUco marker to determine its accuracy. Optical flow was implemented to extract feature points from the automatically selected RoI and to extract motion vectors between two adjacent frames. Two experiments were performed to verify the performance of the proposed method. In the shaking table test, it was examined whether the dynamic data could be obtained accurately under the hovering condition of the UAV. The experiment was performed at an input vibration range from 1 Hz to 10 Hz, and it was verified that the dynamic response of the cable was calculated precisely via signal processing. Next, a lab-scale experiment was performed using an 11.8 m cable. In order to estimate the tension of the cable, the vibration method, which has been verified in many studies, was implemented. To validate the performance of the proposed method, a comparison was made with the vibration method using accelerometers. As a result, the average error between the tension values obtained through the proposed method and the existing method was 3.54%. The results show that the proposed method of using a UAV is a promising method with which to estimate the cable tension. In future research, we intend to apply the proposed method using a cloud computer on an actual bridge. Our aim is to check the tension by entering the information about the cable of the bridge into several ArUco markers and sending the video taken from the drone to the cloud computer. As such, structural health monitoring of bridge structures using UAVs is expected to have applications in many fields while overcoming existing limitations.
Author Contributions
Conceptualization, I.-H.K. and J.W.P.; methodology, I.-H.K.; software, I.-H.K. and J.W.P.; validation, I.-H.K. and S.Y.; formal analysis, I.-H.K.; investigation, J.W.P.; resources, I.-H.K. and S.Y.; data curation, I.-H.K. and S.Y.; writing—original draft preparation, I.-H.K.; writing—review and editing, S.Y. and H.-J.J.; visualization, I.-H.K.; supervision, J.W.P. and H.-J.J.; project administration, I.-H.K. and S.Y.; funding acquisition, I.-H.K. and S.Y. All authors have read and agreed to the published version of the manuscript.
Funding
This research was supported by the Basic Science Research Program through the National Research Foundation of Korea (NRF) funded by the Ministry of Education. (NRF-2022R1I1A1A01056139, NRF-2020R1I1A1A01073676).
Data Availability Statement
Not applicable.
Conflicts of Interest
The authors declare no conflict of interest.
References
- Jung, H.J.; Kim, I.H.; Koo, J.H. A multi-functional cable-damper system for vibration mitigation, tension estimation and energy harvesting. Smart Struct. Syst. 2011, 7, 379–392. [Google Scholar]
- Nazarian, E.; Ansari, F.; Azari, J. Recursive optimization method for monitoring of tension loss in cables of cable-stayed bridge. J. Intell. Mater. Syst. Struct. 2016, 27, 2091–2101. [Google Scholar]
- Bao, Y.; Shi, Z.; Becki, J.L.; Li, H.; Hou, T. Identification of time-varying cable tension forces based on adaptive sparse time-frequency analysis of cable vibrations. Struct. Control Health Monit. 2017, 24, e1889. [Google Scholar]
- Casas, J.R. A combined method for measuring cable forces: The cable-stayed Alamillo Bridge, Spain. Struct. Eng. Int. 1994, 4, 235–240. [Google Scholar]
- Kim, B.H.; Park, T. Estimation of cable tension force using the frequency-based system identification method. J. Sound Vib. 2007, 304, 660–676. [Google Scholar]
- Zui, H.; Shinke, T.; Namita, Y. Practical formulas for estimation of cable tension by vibration method. J. Struct. Eng. 1996, 122, 651–656. [Google Scholar]
- Russel, J.C.; Lardner, T.J. Experimental determination of frequencies and tension for elastic cables. J. Eng. Mech. 1998, 124, 1067–1072. [Google Scholar]
- Shimada, T. Estimating method of cable tension from natural frequency of high mode. In Proceedings of the Japan Society of Civil Engineers, Doboku Gakkai Ronbunshu, Japan, 21 October 1994; pp. 163–171. [Google Scholar]
- Fang, Z.; Wang, J. Practical formula for cable tension estimation by vibration method. J. Bridge Eng. 2012, 17, 161–164. [Google Scholar]
- Gentile, C. Application of Microwave Remote Sensing to Dynamic Testing of Stay-Cables. Remote Sens. 2010, 2, 36–51. [Google Scholar]
- Gentile, C.; Cabboi, A. Vibration-based structural health monitoring for stay cables by microwave remote sensing. Smart Struct. Syst. 2015, 16, 263–280. [Google Scholar]
- Zhao, W.; Zhang, G.; Zhang, J. Cable force estimation of a long-span cable-stayed bridge with microwave interferometric radar. Comput.-Aided Civ. Infrastruct. Eng. 2020, 35, 1419–1433. [Google Scholar]
- Cunha, A.; Caetano, E. Dynamic measurements on stay cables of cable-stayed bridge using an interferometry laser system. Exp. Tech. 1999, 23, 38–43. [Google Scholar]
- Nassif, H.H.; Gindy, M.; Divis, J. Comparison of laser doppler vibrometer with contact sensors for monitoring bridge deflection and vibration. NDT&E Int. 2005, 38, 213–218. [Google Scholar]
- Feng, D.; Scarangello, T.; Feng, M.Q.; Ye, Q. Cable tension force estimate using novel noncontact vision-based sensor. Measurement 2017, 99, 44–52. [Google Scholar]
- Kim, S.W.; Jeon, B.G.; Kim, N.S.; Park, J.C. Vision-based monitoring system for evaluating cable tensile forces on a cable-stayed bridge. Struct. Health Monit. 2013, 12, 440–456. [Google Scholar]
- Kim, S.W.; Jeon, B.G.; Cheung, J.H.; Kim, S.D.; Park, J.C. Stay cable tension estimation using a vision-based monitoring system under various weather conditions. J. Civ. Struct. Health Monit. 2017, 7, 343–357. [Google Scholar]
- Ji, Y.; Chang, C. Nontarget image-based technique for small cable vibration measurement. J. Bridge Eng. 2008, 13, 34–42. [Google Scholar]
- Lee, G.; Kim, S.; Ahn, S.; Kim, H.K.; Yoon, H. Vision-Based Cable Displacement Measurement Using Side View Video. Sensors 2022, 22, 962. [Google Scholar] [PubMed]
- Chu, C. Cable Tension Monitoring Using Non-Contact Vision-Based Techniques. Master’s Dissertation, University of Windsor, Windsor, ON, Canada, 2020. [Google Scholar]
- Kalybek, M.; Bocian, M.; Pakos, W.; Grosel, J.; Nikitas, N. Performance of Camera-based vibration monitoring systems in input-output modal identification using shaker excitation. Remote Sens. 2021, 13, 3471. [Google Scholar]
- Ghyabi, M.; Timber, L.C.; Jahangiri, G.; Lattanzi, D.; Shenton, H.W., III; Chajes, M.J.; Head, M.H. Vision-based measurements to quantify bridge deformations. J. Bridge Eng. 2022, 28, 05022010. [Google Scholar]
- Shan, J.; Liu, Y.; Cui, X.; Wu, H.; Loong, C.N.; Wei, Z. Multi-level deformation behavior monitoring of flexural structures via vision-based continuous boundary tracking: Proof-of-concept study. Measurement 2022, 194, 111031. [Google Scholar]
- Wang, J.; Zhao, J.; Liu, Y.; Shan, J. Vision-based displacement and joint rotation tracking of frame structure using feature mix with single consumer-grade camera. Struct. Control Health Monit. 2021, 28, e2832. [Google Scholar]
- Yoon, H.; Hoskere, V.; Park, J.W.; Spencer, B.F., Jr. Cross-Correlation-Based Structural System Identification Using Unmanned Aerial Vehicles. Sensors 2017, 17, 2075. [Google Scholar]
- Kim, I.H.; Jeon, H.; Baek, S.C.; Hong, W.H.; Jung, H.J. Application of crack identification techniques for an aging concrete bridge inspection using an unmanned aerial vehicle. Sensors 2018, 18, 1881–1894. [Google Scholar] [PubMed] [Green Version]
- Jung, H.J.; Lee, J.H.; Yoon, S.; Kim, I.H. Bridge inspection and condition assessment using unmanned aerial vehicles (UAVs): Major challenges and solutions from a practical perspective. Smart Struct. Syst. 2019, 24, 669–681. [Google Scholar]
- Lovelace, B.; Zink, J. Unmanned Aerial Vehicle Bridge Inspection Demonstration Project; Report No. MN/RC 2015-40; Minnesota Department of Transportation Research Services & Library: St. Paul, MN, USA, 2015.
- Kim, I.H.; Yoon, S.; Lee, J.H.; Jung, S.; Cho, S.; Jung, H.J. A comparative study of bridge inspection and condition assessment between manpower and a UAS. Drones 2022, 6, 355–372. [Google Scholar]
- Lee, J.H.; Yoon, S.; Kim, B.; Gwon, G.H.; Kim, I.H.; Jung, H.J. A new image-quality evaluating and enhancing methodology for bridge inspection using an unmanned aerial vehicle. Smart Struct. Syst. 2021, 27, 209–226. [Google Scholar]
- Gwon, G.H.; Lee, J.H.; Kim, I.H.; Jung, H.J. CNN-based image quality classification considering quality degradation in bridge inspection using an unmanned aerial vehicle. IEEE Access 2023, 11, 22096–22113. [Google Scholar]
- Tian, Y.; Zhang, C.; Jiang, S.; Duan, W. Noncontact cable force estimation with unmanned aerial vehicle and computer vision. Comput.-Aided Civ. Infrastruct. Eng. 2021, 36, 73–88. [Google Scholar]
- Jang, S.; Jo, H.; Cho, S.; Mechitov, K.; Rice, J.A.; Sim, S.H.; Jung, H.J.; Yun, C.B.; Spencer, B.F., Jr.; Agha, G. Structural health monitoring of a cable-stayed bridge using smart sensor technology: Deployment and evaluation. Smart Struct. Syst. 2010, 6, 439–459. [Google Scholar]
- Garrido-Jurado, S.; Muñoz-Salinas, R.; Madrid-Cuevas, F.J.; Marín-Jiménez, M.J. Automatic generation and detection of highly reliable fiducial markers under occlusion. Pattern Recognit. 2014, 47, 2280–2292. [Google Scholar] [CrossRef]
- Detection of ArUco Marker 4.7.0-dev. Available online: https://docs.opencv.org/4.x/d5/dae/tutorial_aruco_detection.html (accessed on 29 June 2023).
- Irvine, H.M. Cable Structures; The MIT Press: Cambridge, MA, USA, 1981. [Google Scholar]
- Ni, Y.Q.; Ko, J.M.; Zheng, G. Dynamic analysis of large-diameter sagged cables taking into account flexural rigidity. J. Sound Vib. 2002, 257, 301–319. [Google Scholar] [CrossRef]
- Lucas, B.D.; Kanade, T. An iterative image registration technique with an application to stereo vision. In Proceedings of the International Joint Conference on Artificial Intelligence, Vancouver, BC, Canada, 24–28 August 1981; pp. 674–679. [Google Scholar]
- Tomasi, C.; Kanade, T. Detection and tracking of point features. Pattern Recognit. 2004, 37, 165–168. [Google Scholar]
- Perez, M.; Billon, K.; Gerges, T.; Capsal, J.F.; Cabrera, M.; Chesené, S.; Jean-Mistral, C. Vibration energy harvesting on a drone quadcopter based on piezoelectric structures. Mech. Ind. 2022, 23, 674–679. [Google Scholar]
- Chen, C.C.; Wu, W.H.; Liu, Y.T.; Lai, G. A convenient cable tension estimation method simply based on local vibration measurements to fit partial mode shapes. Eng. Struct. 2022, 272, 115008. [Google Scholar] [CrossRef]
- Furukawa, A.; Hirose, K.; Kobayashi, R. Tension estimation method for cable with damper using natural frequencies. Front. Built Environ. 2021, 7, 603857. [Google Scholar] [CrossRef]
- Jung, H.Y. Feasibility Study of Multifunctional Electromagnetic Damper for Vibration Control of Cable and Energy Harvesting. Ph.D. Dissertation, Korea Advanced Institute of Science and Technology, Daejeon, Republic of Korea, 2018. [Google Scholar]
- Kim, N.S.; Jeong, W.; Seo, J.W.; Ahn, S.S. Development of cable excitation system for evaluating dynamic characteristics of stay cables. J. Earthq. Eng. Soc. Korea 2003, 7, 71–79. [Google Scholar]
- Nyquist-Shannon Sampling Theorem. Available online: https://en.wikipedia.org/wiki/Nyquist%E2%80%93Shannon_sampling_theorem (accessed on 29 June 2023).
- Gentile, C.; Saisi, A. Ambient vibration testing of historic masonry towers for structural identification and damage assessment. Constr. Build. Mater. 2007, 21, 1311–1321. [Google Scholar] [CrossRef]
- Kim, H.; Sim, S.H. Automated peak picking using region-based convolutional neural network for operational modal analysis. Struct. Control Health Monit. 2019, 21, e2436. [Google Scholar] [CrossRef]
Figure 1.
Fiducial markers according to size.

Figure 2.
Schematic diagram of cable tension estimation.

Figure 3.
Marker detection results. (a) Automated RoI selection of the marker with marker ID, (b) feature point extraction in the RoI.
Figure 3.
Marker detection results. (a) Automated RoI selection of the marker with marker ID, (b) feature point extraction in the RoI.

Figure 4.
Procedures of cable tension estimation using the vibration method.

Figure 5.
Experimental setup for dynamic response acquisition.

Figure 6.
Results of shaking table test (2 Hz) (a) Displacement time–history; (b) power spectrum result.
Figure 6.
Results of shaking table test (2 Hz) (a) Displacement time–history; (b) power spectrum result.

Figure 7.
Power spectrum for various excitation frequencies (a) 4 Hz, (b) 6 Hz, (c) 8 Hz, (d) 10 Hz.
Figure 7.
Power spectrum for various excitation frequencies (a) 4 Hz, (b) 6 Hz, (c) 8 Hz, (d) 10 Hz.

Figure 8.
Cable test setup.

Figure 9.
Displacement time history (Impact case) (a) 50 FPS, (b) 50 FPS (filtered), (c) 120 FPS, (d) 120 FPS (filtered).
Figure 9.
Displacement time history (Impact case) (a) 50 FPS, (b) 50 FPS (filtered), (c) 120 FPS, (d) 120 FPS (filtered).

Figure 10.
Displacement time history (sinusoidal excitation case) (a) 50 FPS, (b) 50 FPS (filtered), (c) 120 FPS, (d) 120 FPS (filtered).
Figure 10.
Displacement time history (sinusoidal excitation case) (a) 50 FPS, (b) 50 FPS (filtered), (c) 120 FPS, (d) 120 FPS (filtered).

Figure 11.
Peak-picking result with regard to the PSD response.

Figure 12.
Linear regression result.

Figure 13.
Comparison of tension estimation results of the sensor-based conventional method and the proposed method.
Figure 13.
Comparison of tension estimation results of the sensor-based conventional method and the proposed method.


Table 1.
Stay-cable specifications.
| Parameters | Value |
|---|---|
| Cable length (L) | 11.8 m |
| Cable mass per unit length (W) | 4.229 kg/m |
| Cable section area (A) | 0.0014 m |
| Cable diameter (D) | 42.2 mm |
| Inclination angle () | 18.72 |
Table 2.
Natural mode frequencies of cable in experiment.
| Mode (n) | 1 | 2 | 3 | 4 | 5 |
|---|---|---|---|---|---|
| Natural frequency (Hz) | 3.28 | 6.68 | 9.96 | 13.24 | 16.52 |
Disclaimer/Publisher’s Note: The statements, opinions and data contained in all publications are solely those of the individual author(s) and contributor(s) and not of MDPI and/or the editor(s). MDPI and/or the editor(s) disclaim responsibility for any injury to people or property resulting from any ideas, methods, instructions or products referred to in the content. |
© 2023 by the authors. Licensee MDPI, Basel, Switzerland. This article is an open access article distributed under the terms and conditions of the Creative Commons Attribution (CC BY) license (https://creativecommons.org/licenses/by/4.0/).
Share and Cite
MDPI and ACS Style
Kim, I.-H.; Jung, H.-J.; Yoon, S.; Park, J.W. Dynamic Response Measurement and Cable Tension Estimation Using an Unmanned Aerial Vehicle. Remote Sens. 2023, 15, 4000. https://doi.org/10.3390/rs15164000
AMA Style
Kim I-H, Jung H-J, Yoon S, Park JW. Dynamic Response Measurement and Cable Tension Estimation Using an Unmanned Aerial Vehicle. Remote Sensing. 2023; 15(16):4000. https://doi.org/10.3390/rs15164000
Chicago/Turabian StyleKim, In-Ho, Hyung-Jo Jung, Sungsik Yoon, and Jong Woong Park. 2023. "Dynamic Response Measurement and Cable Tension Estimation Using an Unmanned Aerial Vehicle" Remote Sensing 15, no. 16: 4000. https://doi.org/10.3390/rs15164000
Note that from the first issue of 2016, this journal uses article numbers instead of page numbers. See further details here.