
DBH Estimation for Individual Tree: Two-Dimensional Images or Three-Dimensional Point Clouds?


1
College of Resource Environment and Tourism, Capital Normal University, Beijing 100048, China
2
Resource and Environmental Research Center, Chinese Academy of Fishery Sciences, Beijing 100141, China
3
Engineering Research Center of Spatial Information Technology, Ministry of Education, Capital Normal University, Beijing 100048, China
*
Author to whom correspondence should be addressed.
Remote Sens. 2023, 15(16), 4116; https://doi.org/10.3390/rs15164116
Submission received: 12 July 2023
/
Revised: 13 August 2023
/
Accepted: 19 August 2023
/
Published: 21 August 2023
Abstract
:Accurate forest parameters are crucial for ecological protection, forest resource management and sustainable development. The rapid development of remote sensing can retrieve parameters such as the leaf area index, cluster index, diameter at breast height (DBH) and tree height at different scales (e.g., plots and stands). Although some LiDAR satellites such as GEDI and ICESAT-2 can measure the average tree height in a certain area, there is still a lack of effective means for obtaining individual tree parameters using high-resolution satellite data, especially DBH. The objective of this study is to explore the capability of 2D image-based features (texture and spectrum) in estimating the DBH of individual tree. Firstly, we acquired unmanned aerial vehicle (UAV) LiDAR point cloud data and UAV RGB imagery, from which digital aerial photography (DAP) point cloud data were generated using the structure-from-motion (SfM) method. Next, we performed individual tree segmentation and extracted the individual tree crown boundaries using the DAP and LiDAR point cloud data, respectively. Subsequently, the eight 2D image-based textural and spectral metrics and 3D point-cloud-based metrics (tree height and crown diameters) were extracted from the tree crown boundaries of each tree. Then, the correlation coefficients between each metric and the reference DBH were calculated. Finally, the capabilities of these metrics and different models, including multiple linear regression (MLR), random forest (RF) and support vector machine (SVM), in the DBH estimation were quantitatively evaluated and compared. The results showed that: (1) The 2D image-based textural metrics had the strongest correlation with the DBH. Among them, the highest correlation coefficient of −0.582 was observed between dissimilarity, variance and DBH. When using textural metrics alone, the estimated DBH accuracy was the highest, with a RMSE of only 0.032 and RMSE% of 16.879% using the MLR model; (2) Simply feeding multi-features, such as textural, spectral and structural metrics, into the machine learning models could not have led to optimal results in individual tree DBH estimations; on the contrary, it could even reduce the accuracy. In general, this study indicated that the 2D image-based textural metrics have great potential in individual tree DBH estimations, which could help improve the capability to efficiently and meticulously monitor and manage forests on a large scale.
1. Introduction
The tree diameter at breast height (DBH) is the diameter of the trunk at 1.3 m above the ground surface [1]. The DBH is one of the most important growth indicators of trees, which can reflect its growth status and age. It has been widely used to estimate forest attributes, including tree vigor [2], biomass [3], volume [4] and carbon stock [5], and to characterize forest dynamics [6] at individual tree, plot or stand levels. The accurate and efficient estimation of the DBH is of great scientific significance for grasping the situation of a forest’s resources.
However, traditional ground-based methods (such as diameter tape and calipers) are time-consuming and labor-intensive [7,8]. In addition, they can also be challenging in many ways, including reasons such as the complexity of the forest structure, local topography, difficult accessibility and subjectivity in measurements. Although the terrestrial laser scanner (TLS) has been employed as an effective means to measure the DBH and large crowns with high precision [9,10], its measurement range is relatively restricted due to the limited observation angles and occlusion caused by surrounding objects. In recent years, the airborne laser scanner (ALS) and digital aerial photography (DAP) [11,12,13,14] have been found and used in extensive applications in forestry surveys, allowing for the extraction of feature parameters from high-density point clouds. However, they are limited in terms of data processing and forestry parameter extraction over large areas, making it impossible to estimate individual tree DBHs on a large scale. While research has shown that a collaborative approach combining the TLS with ALS can improve accuracy while expanding the coverage area [15], global navigation satellite system (GNSS) support is often necessary with the TLS, which is usually challenging to achieve in densely forested regions. While satellite remote sensing offers extensive coverage and the capacity to derive texture and spectral metrics for the DBH estimation, it is constrained by its inherent limitations of having a low spatial resolution. As a consequence, obtaining accurate DBHs for individual trees is often unfeasible, leading to DBH estimations primarily at the plot and/or stand levels. Recently, satellite-based LiDAR data, such as GEDI and ICEsat-2, have been widely used in forest applications, capable of measuring tree heights but not being able to directly obtain the DBHs [16,17]. In addition, owing to their large footprint, it is also not possible to accurately obtain the DBHs of individual trees. Notably, most point-cloud-based methods heavily rely on point cloud information and do not fully utilize the variety of features embedded within the imagery. To our knowledge, there is currently no mature remote sensing method based on 2D images that can be used to obtain individual tree DBHs. Fortunately, there has been a growing emergence of sub-meter-resolution satellites, such as Beijing-3, SkySat, WorldView-3, etc. These satellites have the ability to identify individual trees, thereby achieving large-scale and high-precision forest monitoring. Consequently, it is imminent that DBH estimation based on image features is explored.
However, to our best knowledge, previous studies using imagery features mostly applied to forest inventory [18], forest structural parameters [19], stand quality characteristics [20] and tree species classification [21]. These studies were mostly based on the plot or stand level, with limited research specifically focused on individual trees. As for individual trees, textural and spectral metrics are commonly used for tree species classification or segmentation [22,23]. To our knowledge, it is not yet common to estimate individual tree DBHs based on 2D image features (e.g., textural and spectral metrics).
The objective of this study was to explore the practicality of using 2D image-based individual tree features for individual tree DBH estimations, i.e., textural metrics and spectral indices, which are common and necessary in modern forest inventories. Specifically, we obtained UAV RGB imagery and performed individual tree segmentation using the point cloud based on the structure-from-motion (SfM) method to obtain individual tree crown boundaries. Subsequently, based on these boundaries, we extracted individual tree features such as textural metrics and spectral indices from 2D images. To evaluate the effectiveness of these metrics, the accuracy of the 2D image-based and 3D point-cloud-based features in the DBH estimations was compared with the reference DBHs obtained from ground measurements. Furthermore, we quantitatively evaluated the performance of different models, namely, multiple linear regression (MLR), random forest (RF) and support vector machine (SVM) models. This study could potentially provide a more accurate and efficient method for individual tree DBH estimations in forest inventories, which have broad implications for improving sustainable forest management activities.
2. Materials and Methods
2.1. Study Area
The study area is located on the Saihanba Mechanized Forest Farm (42°02′~42°36′N, 116°51′~117°39′E), Chengde City, Hebei Province, China, with an elevation ranging from 1010 to 1940 m above sea level. The area has a typical semi-arid and semi-humid temperate continental monsoon climate. The annual average temperature is −1.3 °C, with an average snow cover lasting for seven months. The average annual precipitation is 460.3 mm.
The main tree species in the study area was Larix principis-rupprechtii, which comprised two sites (Figure 1). The top row in Figure 1 represents site 1, covering an area of 7500 m2 and measuring approximately 100 m × 75 m. The trees on this site had heights ranging from 14.90 m to 20.80 m and DBHs ranging from 0.129 m to 0.379 m. The bottom row in Figure 1 represents site 2, which covered an area of approximately 2025 m2 and corresponded to dimensions of 45 m × 45 m. The trees on this site had heights ranging from 8.42 m to 13.49 m and DBHs ranging from 0.123 m to 0.240 m.
2.2. Data Acquisition and Pre-Processing
2.2.1. UAV Data Acquisition and Pre-Processing
Data acquisition was performed on 27 July 2022, during which time no clouds were visible, using a quadrotor UAV DJI M300RTK equipped with a DJI L1 camera to collect the data. The DJI L1 sensor comprised two sensors: the RGB sensor and Lidar sensor. It could simultaneously acquire RGB and LiDAR data. The RGB image pixel size was 4864 × 3648 and the focal length of the lens was 8.8 mm; the ranging accuracy of the L1 LiDAR was 3 cm@100 m and the FOV was 70.4° × 4.5°. In the experiment, the UAV was flown twice, covering two different study sites. The UAV had a weight of 3.6 kg and a maximum take-off weight of 9 kg, enabling it to carry out its operations effectively with a flight time of up to 55 min, ensuring sufficient duration for data collection. During the flights, the UAV maintained a height of 8 0 m and a speed of 3.5 m/s. Additionally, the course overlapping and side overlapping were set to 85% and 80%, respectively.
The RGB and LiDAR data were then processed; the former could generate 2D RGB ortho-imagery (including texture and spectral information) from which DAP point cloud data were generated using the SfM method, while the latter could obtain LiDAR point clouds. All texture and spectral information came from the RGB ortho-imagery. To link trees detected from different data with the corresponding trees in the field, the data registration was conducted using the iterative closest point (ICP) algorithm [24,25]. Finally, a total of 166 trees were collected with an average tree height of 15.78 m, the maximum height being 20 m and the minimum 8 m.
2.2.2. Field Data
The TLS system offers highly accurate DBH measurements by directly analyzing point cloud data and fitting circles to the stem points of individual trees at breast height. Previous studies using TLS demonstrated its high accuracy in measuring the tree DBH, with an error not exceeding 1 cm [26,27,28]. In this study, the DBH was derived from the TLS as a reference value. At the same time of the UAV flights, the TLS data were acquired using a Stonex X300 laser scanner. The accuracy of the TLS system was ±4 nm@50 m, with a measurement distance capability of up to 300 m. To acquire the TLS point clouds, a single echo and fine mode were employed, providing a comprehensive view of 360° horizontally and 180° vertically.
The TLS point cloud data underwent pre-processing, which included processes such as georeferencing, segmentation, filtering, generating digital surface models (DSMs) and feature extraction [15]. Ultimately, the location and DBH of each tree were obtained. There were a total of 166 trees, with an average DBH of 0.195 m. The maximum and minimum DBH values were 0.379 m and 0.123 m, respectively.
2.3. Metric Parameter Extraction and Selection
Two-dimensional image-based individual tree textural metrics, spectral indices and 3D point-cloud-based structural metrics were extracted for individual tree DBH estimates. Firstly, the point cloud data (DAP point cloud and LiDAR point cloud) were pre-processed though segmentation and filtering to obtain a normalized digital surface model (CHM). Based on the CHM, the distinct crown boundaries of individual trees were extracted using the region growing algorithm, allowing for the tree height (H) and crown diameter (CD) to be extracted. The processes were implemented in Point Cloud Automata (PCA) v3.7. It was found that the extracted tree crown boundaries were consistent with the results obtained through visual interpretation, and the difference between the two was not significant. Then, the textural metrics and spectral indices of each tree were calculated from the 2D RGB imagery based on the individual tree crown boundaries extracted from the DAP point cloud and LiDAR point cloud, respectively. Specifically, using the zonal statistics method with crown boundaries of individual trees, the average values of eight VIs and textural metrics were calculated (Table 1). It should be noted that eight textural metrics were extracted though the use of the grey level co-occurrence matrix (GLCM) [29]. Finally, a Pearson correlation analysis was conducted to evaluate the relationship between the extracted features (including spectral indices, textural metrics and structural metrics, such as H and CD) and the reference DBH derived from the TLS data. Among all the metrics, features that exhibited a significant relationship with the DBH (p-value < 0.01) were selected for the DBH modeling.
2.4. DBH Modeling and Validation
In this study, multiple linear regression (MLR), random forest (RF) and support vector machine (SVM) algorithms were employed to build the DBH estimation models. The texture metrics, spectral indices, structural index and their combinations selected based on Section 2.3 were taken as the input parameters of the DBH prediction models. Specifically, features that exhibited a significant correlation with the DBH (p-value < 0.01) were included. Among all samples, 70% was used for the training and 30% for the validation of the DBH estimation models. Meanwhile, the root mean square error (RMSE) and RMSE% were calculated to evaluate the accuracy of the DBH estimation models. The validation metrics were calculated using the following equation:
where and are the estimated and observed values, respectively, n is the number of observations and is the average observed value. It should be noted that the results of the DBH prediction using the metrics calculated based on individual tree crown boundaries extracted from the DAP point clouds were called DAP-based, while those extracted from the LiDAR point clouds were called LiDAR-based.
3. Results
3.1. Relationship between DBH and Different Metrics
Pearson’s correlation coefficients (r) between the DBH and metrics (textural metrics, spectral indices and structural metrics) are shown in Figure 2. In general, the DBH was significantly correlated (p < 0.01) with most metrics, except for the relationship between Corr and DBH based on the DAP point clouds (Corr_DAP), Mean_DAP and the relationship between Corr and DBH based on the LiDAR point clouds (Corr_LiDAR). Among these features, some textural metrics showed the highest correlation with the DBH, such as Dissi_DAP, Var_DAP, Dissi_LiDAR and Contr_LiDAR, with the highest correlation coefficients being −0.582 and −0.575 for the DAP-based and LiDAR-based predictions, respectively, followed by structural metrics with a correlation coefficient of approximately 0.5. Compared with the textural and structural metrics, spectral indices were less correlated with the DBH.
Metrics that exhibited a significant correlation with the DBH (p-value < 0.01) were selected; then, the selected metrics were grouped into three datasets based on the LiDAR point cloud and DAP point cloud, respectively. As for the LiDAR point cloud, the three sets were VIs (i.e., r, g, b, VARI, NGRDI, GLI, EXGR and EXG), TexM (i.e., ASM, Entro, Dissi, Contr, Homo, Var and Mean) and StrM (i.e., H and CD); for the DAP point cloud, the three sets were VIs (i.e., r, g, b, VARI, NGRDI, GLI, EXGR and EXG), TexM (i.e., ASM, Entro, Dissi, Contr, Homo and Var) and StrM (i.e., H and CD). The DBH estimation was performed using individual metrics as well as their combinations. Table 2 shows the different metric sets of DBH estimations based on the LiDAR and DAP point clouds, respectively.
According to the metric source, the metric sets were divided into two groups. The first group consisted of metric sets extracted solely from 2D images, including TexM, VIs and TexM + VIs. The second group comprised a combination of metric sets derived from both 2D images and 3D point clouds (composed metrics), including StrM, TexM + StrM, VIs + StrM and TexM + VIs + StrM.
3.2. DBH Estimated Using 2D Image-Based Metrics
This section shows the accuracy results of estimating the DBH based on metrics obtained from 2D images, the metric sets including TexM, VIs and TexM + VIs. The specific metrics included in the three metric sets are shown in Table 2, and the accuracy results using the 2D image-based metrics are shown in Table 3. The results indicated that using TexM achieved the highest accuracy regardless of the model used. The accuracy of the DBH estimation for the LiDAR-based segmentation results and DAP-based segmentation results showed a consistent conclusion. Among different models, the MLR model showed the highest accuracy, with a RMSE of 0.032 and a RMSE% of 16.88%. However, when employing VIs, the accuracy was notably weaker, with a lowest RMSE of 0.051 (RMSE% = 26.83%) obtained using the SVM model. When combining TexM and VIs, the estimation accuracy did not show a signification improvement compared to using TexM alone. Nevertheless, when compared to using VI alone, the accuracy slightly improved.
3.3. DBH Estimated Using Composed Metrics
This section shows the accuracy results of the DBH estimations based on metrics obtained from composed metrics, the metric sets including StrM, TexM + StrM, VIs + StrM and TexM + VIs + StrM. The specific metrics included in the four metric sets are shown in Table 2, and the accuracy results using the composed metrics are shown in Table 4. The results showed that using VIs + StrM had the highest accuracy, but it was still lower than that of TexM’s. When comparing different models, the MLR model still showed the highest accuracy in estimating the DBH, with a RMSE of 0.033 and a RMSE% of 17.40%. For TexM + VIs + StrM, the model performed poorly, with the lowest RMSE of 0.052 (RMSE% = 27.15%). Interestingly, the combination of multiple features (TexM + VIs + StrM) did not improve the accuracy of the DBH estimations; on the contrary, this had a detrimental effect, leading to a decrease in accuracy.
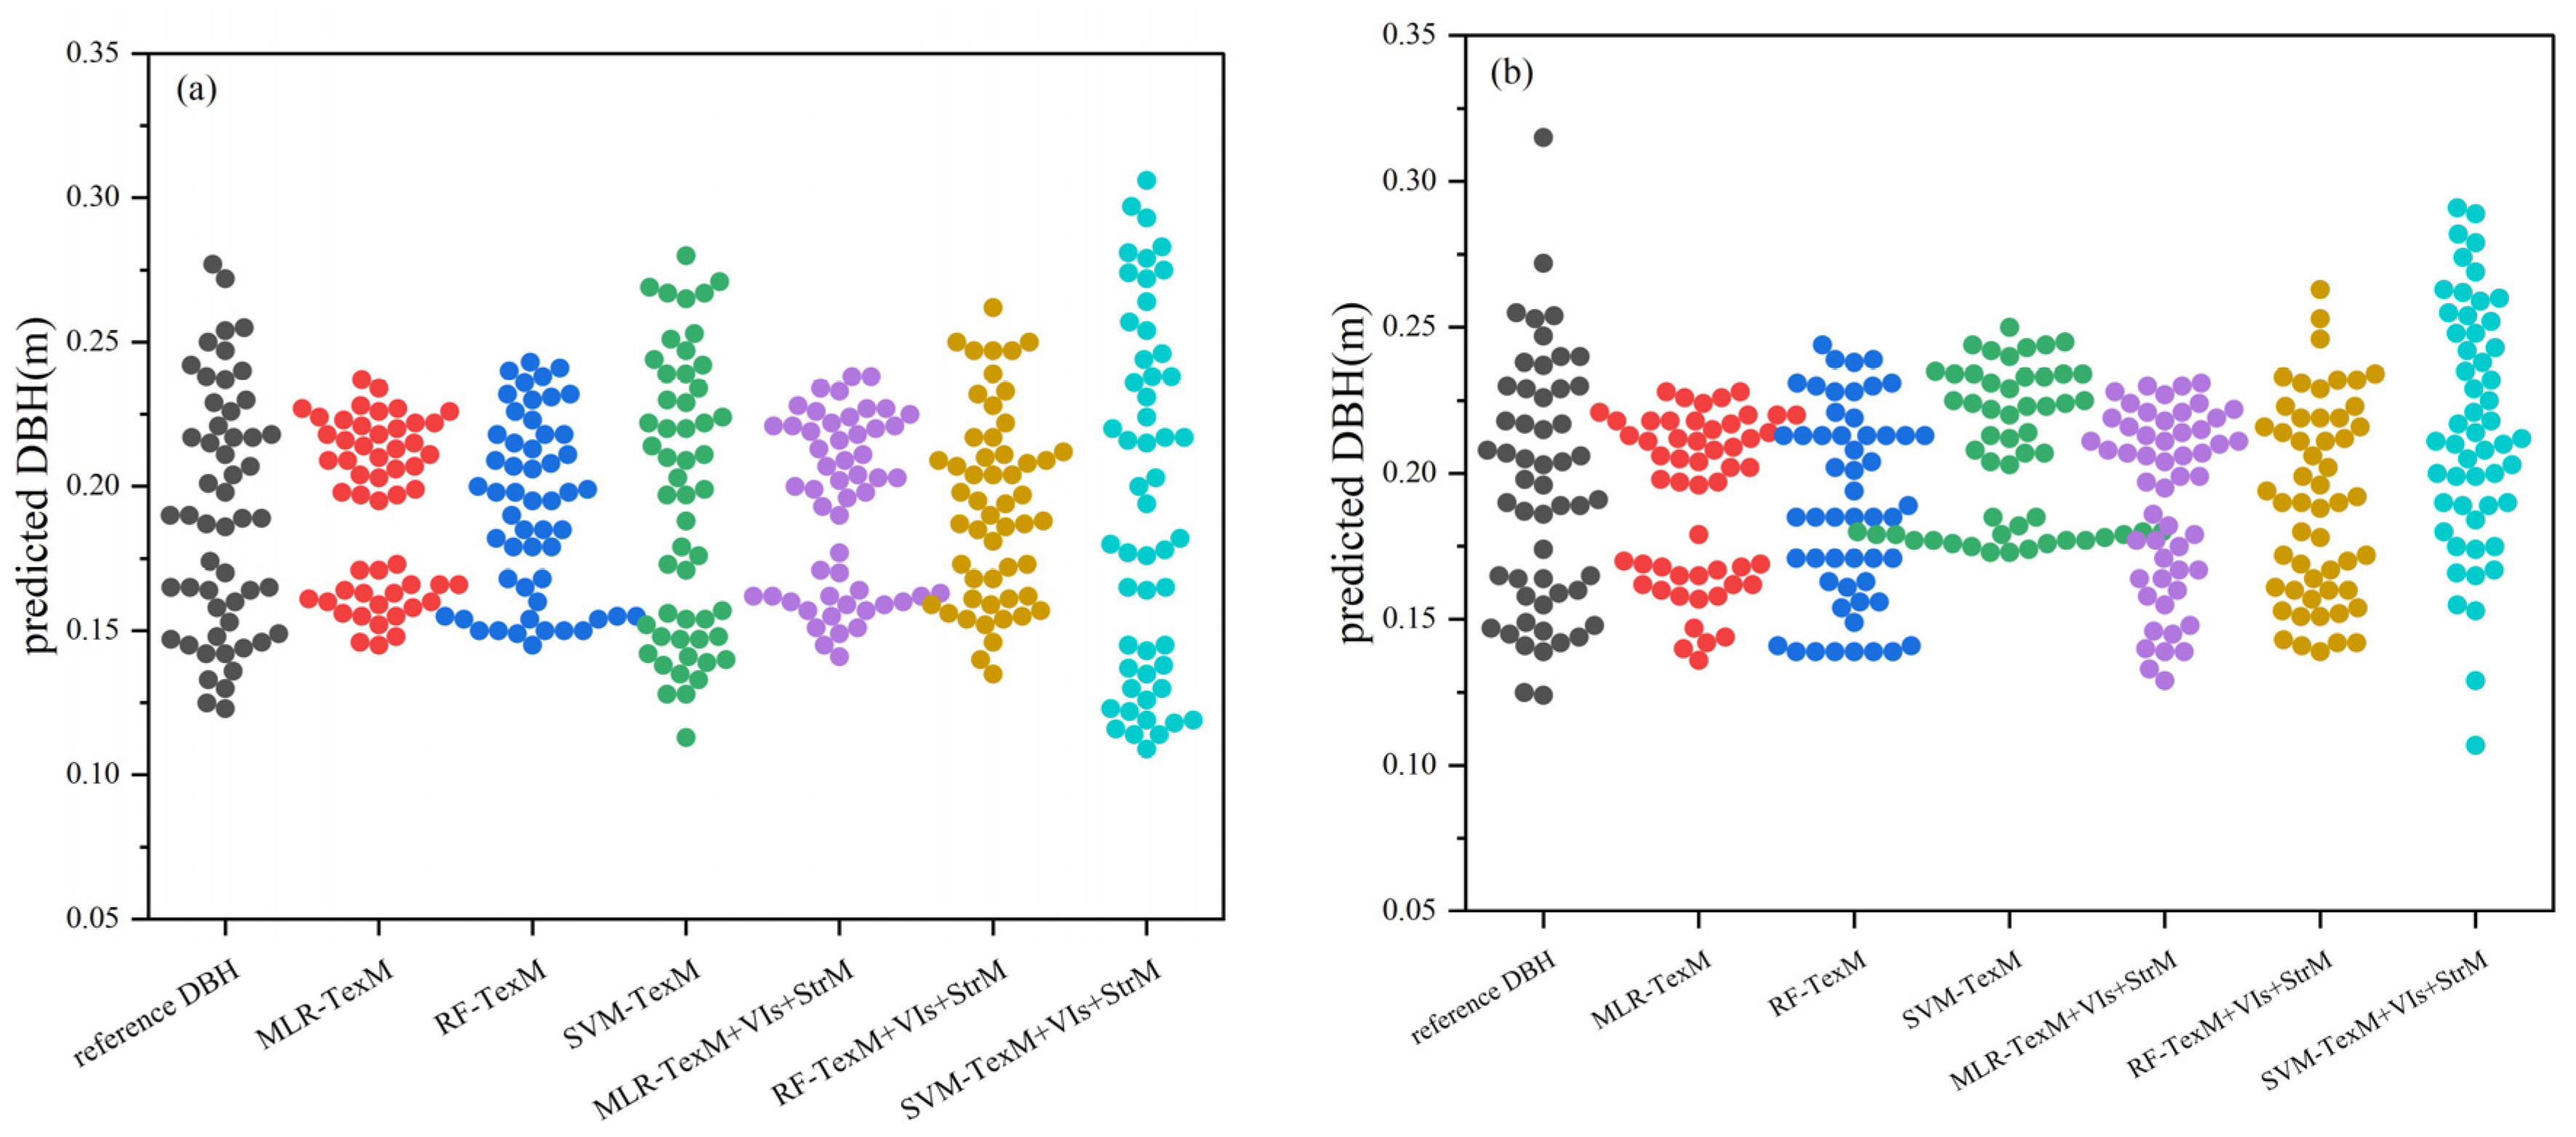
Figure 3 shows the DBH prediction results based on different metric sets, which clearly showed the differences in DBH prediction values. The X-axis represents the different metric sets based on the three models (MLR, RF and SVM), while the Y-axis represents the predicted DBH results. For MLR-TeXM, the method predicted DBH results with a clear stratification phenomenon, whether it was derived from DAP-based or LiDAR-based estimates. It was intriguing to note that the LiDAR-based data tended to yield overestimated values, whereas DAP-based data tended to produce underestimated values (except for the SVM model).
From Figure 3, it could be observed that the spatial distribution of DBHs predicted with the SVM model appeared to closely resemble the observed DBH values. However, despite this visual similarity, both the RMSE% and bias% indicated that the prediction accuracy of the SVM model was the lowest among the models evaluated. Regarding the MLR model, when TexM was employed, the estimated bias% for the DBH was 1.31% and −1.67% for the LiDAR-based and DAP-based estimates, respectively. This suggested that the MLR model, when utilizing TexM, exhibited a slightly positive bias for LiDAR-based data and a slight negative bias for DAP-based data.
4. Discussion
4.1. Effect of 2D Images on DBH Estimation
In forest parameter estimations, texture features are mostly used for plot and stand levels, and texture can improve the estimation accuracy of parameters such as the H and DBH [35,36]. In this study, there was a significant correlation between the texture of individual trees and the DBH. Additionally, the results revealed that, compared with relying solely on structural data, incorporating the individual tree textures along with structural information could improve the accuracy. Interestingly, the textural metrics could arguably have been the most important metrics for the DBH estimations. The textural metrics provided the highest accuracy in estimating the DBH; however, to our knowledge, no relevant reports have been found thus far. One possible reason is that for the specific tree species in this study, the textural metrics could provide additional information on their spatial patterns and variability of growth status [37]. Further research is needed on other tree species.
Due to the high cost of acquiring and processing high-density point clouds on a large scale, accurately estimating the DBH has become a challenging task. However, as shown in Table 3, the results indicated that utilizing texture features alone yielded the highest DBH accuracy. In other words, adding other features such as spectral and structural metrics did not improve the accuracy, and to some extent could even reduce the estimation accuracy. This indicated that it is feasible to only use textural metrics extracted from 2D images for individual tree DBH estimations without relying on tree heights. This significantly enhances the possibility of acquiring large-scale DBH estimations based on remote sensing images. Moreover, it could also have a positive impact on improving the estimation accuracy of the forest volume, biomass, forest stock, etc. [38,39,40]. This may arguably be fortunate for satellite applications.
Many studies have confirmed multi/hyper-spectral information to be highly suitable for forest research [41,42]. However, this study only used three RGB bands of low-cost consumer-grade cameras rather than multi/hyper-spectral data. This may be the reason why the spectral information could not improve the DBH estimation results, because there was minimal variation in spectral information between these three bands. The average values for r, g and b were 0.30 (SD = 0.008), 0.43 (SD = 0.013) and 0.27 (SD = 0.009), respectively. This would make it difficult to distinguish small differences in the growth status of different trees in spectral spaces, especially in the case of managed forests where the trees are generally in similar growth stages. Additionally, when using VIs alone, whether using the MLR, RF or SVM models, the accuracy of predicting the DBH was lower than of using TexM, as shown in Table 3. In summary, textural metrics were more effective than spectral indices in distinguishing the growth status. Further research is needed on applications that could provide red-edge, near-infrared and shortwave infrared images.
4.2. Effect of 3D Point Clouds on DBH Estimation
The three-dimensional point cloud data has undoubtedly great advantages in forest research, such as the TLS being able to measure accurate DBHs and LiDAR UAVs being able to accurately obtain tree heights and crown diameters. Estimating the DBH from the tree height and crown diameter is a widely recognized approach in the field [43,44,45]. However, in practical applications, it is extremely difficult to obtain the tree height and DBH in a large area, especially for individual trees, where it is almost impossible to obtain the DBH. While techniques such as GEDI and ICEsat2 (ATL08) can provide tree height data, they do have limitations [46,47]. GEDI has a coarse resolution of 25 m and relies on large footprint data, whereas ICEsat-2 has a variable resolution and a revisit period of 91 days. Therefore, obtaining highly accurate tree heights over large areas remains a challenge. In this study, it was found that texture had a significant advantage in estimating the DBH, as both its correlation with the DBH and estimation accuracy were better than the tree height. This was consistent with the statement in [48], that texture was more correlated with AGB than tree height. The first possible reason is that the trees in this study belonged to artificial forests, resulting in less significant changes in the tree height (H) and crown diameter (CD) between trees. As trees grow, competitiveness can limit the growth rate of the crown size and cause them to have similar heights [49]. The second reason may be that this study utilized too few structural features (only H and CD). Previous studies have shown that neighborhood- and geometry-related features extracted from 3D point clouds could identify species with similar spectral responses [50]. Therefore, accuracy may be further improved accordingly by injecting such features.
In terms of the quality of the 3D point clouds, although the LiDAR UAV has been proven to be able to obtain more accurate tree heights [51,52], this study found that there was little difference in the tree parameters extracted from the LiDAR UAV and DAP UAV, e.g., the R2 of the tree height between the two was 0.985 and the RMSE was 0.501 (RMSE% = 3.18%). Therefore, if using 3D point clouds for DBH estimations, the lower cost and higher efficiency of the DAP point cloud be a more suitable source of information on forest stand inventory parameters [53]. However, it should be noted that this may have been due to the relatively flat terrain of the study area and the relatively large gaps between trees. However, for more complex environments, such as complex terrains and densely vegetated areas, [54] showed that filtering methods may have an impact on the results, so further research should be conducted on this aspect.
4.3. Advantages and Challenges
This study proved that textural metrics from 2D imagery were feasible in estimating individual tree DBHs with high accuracy. Notably, this approach was found to be more effective than those relying on structural metrics derived from 3D point clouds. However, it should be noted that individual tree segmentation was a pre-requisite for extracting textural metrics. The importance of obtaining an accurate segmentation result for individual trees could not be overstated, as it greatly affected the textural metrics of each tree and, subsequently, impacted the overall accuracy of the DBH estimations. Unfortunately, it is not easy to achieve accurate individual tree segmentations on satellite imagery. Although the spatial/spectral resolution of commercial satellite imagery has greatly improved, effectively reducing the impact of the terrain and within-canopy shadows remains a significant challenge, since forests are usually grown on hilly or mountainous areas.
Another challenge is extracting textures from individual tree crown boundaries. This challenge comes from the fact that satellite imagery is usually not orthographic such as that of UAV imagery. Due to satellite orbit settings, shooting modes, the large field of view angle of sensors, etc., the acquired images may be oblique rather than orthographic, which can lead to the texture potentially being derived from the side of a tree instead of its top [55]. Obviously, there can be differences in textures between the top-view and side-view, so it is necessary to further investigate this impact. Another aspect of this challenge is the spatial resolution. At present, the resolution of most satellite images is not as high as that of UAV images. Therefore, changes in spatial resolution could bring large-scale effects to textures and affect its role in DBH estimations. We briefly explored the impact of this change by down-sampling the RGB images to 30 cm to match the spatial resolution of Worldview-3 [56]. By comparing the results before and after down-sampling, it was found that the correlation between dissimilarity, contrast and variance obtained from different resolutions and DBH remained almost unchanged, and the estimated DBH accuracy using the MLR model decreased by only 3% (RMSE = 0.040). This could be attributed to the advantage of linear relationships, which tend to have smaller spatial scaling effects on heterogeneous surfaces between images of different resolutions [57].
For the method’s adaptability in this study, although the dataset of 166 total tree samples may not have been large, it came from two different sites, and the tree heights and DBH statistical characteristics indicated that they also had differences, so it could still be argued that this method was good to a certain extent. In the future, we plan to increase the number of samples, site types, tree species, etc. Moreover, as could be seen, this study selected two sites, representing relatively typical areas with tree heights ranging from 8 m to 21 m and DBHs ranging from 0.123 m to 0.379 m. The predictive accuracy of the DBH in this study was relatively high. However, for areas with smaller or larger DBHs and different growth environments (latitude, terrain, climate, etc.), the method proposed in this article may not be entirely applicable, and further research is needed in the future.
5. Conclusions
In this study, to explore the practicality of using 2D image-based features in individual tree DBH estimations, we extracted textural and spectral metrics from 2D images and structural metrics from 3D point clouds based on the tree crown boundaries of each tree. We also calculated the correlation coefficients between these parameters and the DBH, and quantitatively evaluated their accuracy in estimating the DBH. The results showed that the textural metrics derived from 2D images showed a strong correlation and the best accuracy with the individual tree DBHs than the spectral and structural metrics and all metrics combination. Moreover, the DBH estimation accuracy for the MLR model was greater than for the RF and SVM models. In short, our study demonstrated the capacity of using 2D images to estimate individual tree DBHs, providing the possibility for large-scale individual tree DBH estimations using high-resolution satellite data.
Author Contributions
Conceptualization, Z.M. and L.D.; methodology, Z.M. and Z.L.; software, Z.M., Z.L. and Y.W.; validation, Z.M., Z.L. and L.D.; formal analysis, Z.M.; investigation, Z.L., Y.W. and L.D.; resources, L.D.; data curation, Z.M. and Y.W.; writing—original draft preparation, Z.M.; writing—review and editing, Z.M. and L.D.; visualization, Z.M.; supervision, L.D.; project administration, L.D.; funding acquisition, L.D. All authors have read and agreed to the published version of the manuscript.
Funding
This research was funded by the R&D program of Beijing Municipal Education Commission (No. KZ202210028045).
Data Availability Statement
Data can be made available upon request.
Conflicts of Interest
The authors declare no conflict of interest.
References
- West, P.W. Tree and Forest Measurement; Springer: Berlin/Heidelberg, Germany; New York, NY, USA, 2004. [Google Scholar]
- Fu, L.; Duan, G.; Ye, Q.; Meng, X.; Liu, Q. Prediction of Individual Tree Diameter Using a Nonlinear Mixed-Effects Modeling Approach and Airborne LiDAR Data. Remote Sens. 2020, 12, 1066. [Google Scholar] [CrossRef]
- Dyderski, M.K.; Pawlik, A.; Chwistek, K.; Czarnota, P. Tree aboveground biomass increment and mortality in temperate mountain forests: Tracing dynamic changes along 25-year monitoring period. For. Ecol. Manag. 2023, 540, 121054. [Google Scholar] [CrossRef]
- Abegg, M.; Bösch, R.; Kükenbrink, D.; Morsdorf, F. Tree volume estimation with terrestrial laser scanning—Testing for bias in a 3D virtual environment. Agric. For. Meteorol. 2023, 331, 109348. [Google Scholar] [CrossRef]
- Chimdessa, T. Forest carbon stock variation with altitude in bolale natural forest, Western Ethiopia. Glob. Ecol. Conserv. 2023, 45, e2537. [Google Scholar] [CrossRef]
- Wu, X.; Zhou, S.; Xu, A.; Chen, B. Passive measurement method of tree diameter at breast height using a smartphone. Comput. Electron. Agric. 2019, 163, 104875. [Google Scholar] [CrossRef]
- Chave, J.; Andalo, C.; Brown, S.; Cairns, M.A.; Chambers, J.Q.; Eamus, D.; Fölster, H.; Fromard, F.; Higuchi, N.; Kira, T.; et al. Tree allometry and improved estimation of carbon stocks and balance in tropical forests. Oecologia 2005, 145, 87–99. [Google Scholar] [CrossRef]
- Martin, M.; Xinlian, L.; Peter, S.; Peter, V.; Juraj, E.; Franti Ek, C.; Daniel, T.; Imon, S.; Ján, M. Evaluation of Close-Range Photogrammetry Image Collection Methods for Estimating Tree Diameters. Int. J. Geo-Inf. 2018, 7, 93. [Google Scholar] [CrossRef]
- Ahmed, S.; Pretzsch, H. TLidar-based crown shape indicates tree ring pattern in Norway spruce (Picea abies (L.) H. Karst) trees across competition gradients. A modeling and methodological approach. Ecol. Indic. 2023, 148, 110116. [Google Scholar] [CrossRef]
- Watt, P.J.; Donoghue, D.N.M. Measuring forest structure with terrestrial laser scanning. Int. J. Remote Sens. 2005, 26, 1437–1446. [Google Scholar] [CrossRef]
- Heleno, S. Assessment of the Influence of Survey Design and Processing Choices on the Accuracy of Tree Diameter at Breast Height (DBH) Measurements Using UAV-Based Photogrammetry. Drones 2021, 5, 43. [Google Scholar] [CrossRef]
- Iizuka, K.; Kosugi, Y.; Noguchi, S.; Iwagami, S. Toward a comprehensive model for estimating diameter at breast height of Japanese cypress (Chamaecyparis obtusa) using crown size derived from unmanned aerial systems. Comput. Electron. Agric. 2022, 192, 106579. [Google Scholar] [CrossRef]
- Jucker, T.; Caspersen, J.; Chave, J.; Antin, C.; Barbier, N.; Bongers, F.; Dalponte, M.; van Ewijk, K.Y.; Forrester, D.I.; Haeni, M.; et al. Allometric equations for integrating remote sensing imagery into forest monitoring programmes. Glob. Chang. Biol. 2017, 23, 177–190. [Google Scholar] [CrossRef]
- Maltamo, M.; Meht Talo, L.; Valbuena, R.; Vauhkonen, J.; Packalen, P. Airborne laser scanning for tree diameter distribution modelling: A comparison of different modelling alternatives in a tropical single-species plantation. Forestry 2017, 91, 121–131. [Google Scholar] [CrossRef]
- Guo, L.; Wu, Y.; Deng, L.; Hou, P.; Zhai, J.; Chen, Y. A Feature-Level Point Cloud Fusion Method for Timber Volume of Forest Stands Estimation. Remote Sens. 2023, 15, 2995. [Google Scholar] [CrossRef]
- Rishmawi, K.; Huang, C.; Zhan, X. Monitoring Key Forest Structure Attributes across the Conterminous United States by Integrating GEDI LiDAR Measurements and VIIRS Data. Remote Sens. 2021, 13, 442. [Google Scholar] [CrossRef]
- Shaobo, X.; Cheng, W.; Xiaohuan, X.I.; Shezhou, L.; Hongcheng, Z. Point cloud filtering and tree height estimation using airborne experiment data of ICESat-2. J. Remote Sens. 2014, 18, 1199–1207. [Google Scholar] [CrossRef]
- Tuominen, S.; Pekkarinen, A. Performance of different spectral and textural aerial photograph features in multi-source forest inventory. Remote Sens. Environ. 2005, 94, 256–268. [Google Scholar] [CrossRef]
- Ozdemir, I.; Karnieli, A. Predicting forest structural parameters using the image texture derived from WorldView-2 multispectral imagery in a dryland forest, Israel. Int. J. Appl. Earth Obs. Geoinf. 2011, 13, 701–710. [Google Scholar] [CrossRef]
- Díaz-Varela, R.; Álvarez-Álvarez, P.; Diaz-Varela, E.; Calvo-Iglesias, S. Prediction of stand quality characteristics in sweet chestnut forests in NW Spain by combining terrain attributes, spectral textural features and landscape metrics. For. Ecol. Manag. 2011, 261, 1962–1972. [Google Scholar] [CrossRef]
- Sibiya, B.; Lottering, R.; Odindi, J. Discriminating commercial forest species using image texture computed from a WorldView-2 pan-sharpened image and partial least squares discriminant analysis. Remote Sens. Appl. Soc. Environ. 2021, 23, 100605. [Google Scholar] [CrossRef]
- Qin, H.; Zhou, W.; Yao, Y.; Wang, W. Individual tree segmentation and tree species classification in subtropical broadleaf forests using UAV-based LiDAR, hyperspectral, and ultrahigh-resolution RGB data. Remote Sens. Environ. 2022, 280, 113143. [Google Scholar] [CrossRef]
- Samal, A.; Brandle, J.R.; Zhang, D. Texture as the basis for individual tree identification. Inf. Sci. 2006, 176, 565–576. [Google Scholar] [CrossRef]
- Besl, P.J.; Mckay, H.D. A method for registration of 3-D shapes. IEEE Trans. Pattern Anal. Mach. Intell. 1992, 14, 239–256. [Google Scholar] [CrossRef]
- Shimizu, K.; Nishizono, T.; Kitahara, F.; Fukumoto, K.; Saito, H. Integrating terrestrial laser scanning and unmanned aerial vehicle photogrammetry to estimate individual tree attributes in managed coniferous forests in Japan. Int. J. Appl. Earth Obs. Geoinf. 2022, 106, 102658. [Google Scholar] [CrossRef]
- Bazezew, M.N.; Hussin, Y.A.; Kloosterman, E.H. Integrating Airborne LiDAR and Terrestrial Laser Scanner forest parameters for accurate above-ground biomass/carbon estimation in Ayer Hitam tropical forest, Malaysia. Int. J. Appl. Earth Obs. Geoinf. 2018, 73, 638–652. [Google Scholar] [CrossRef]
- Henning, J.G.; Radtke, P.J. Detailed stem measurements of standing trees from ground-based scanning lidar. For. Sci. 2006, 52, 67–80. [Google Scholar]
- Zhang, Z.; Wang, T.; Skidmore, A.K.; Cao, F.; She, G.; Cao, L. An improved area-based approach for estimating plot-level tree DBH from airborne LiDAR data. For. Ecosyst. 2023, 10, 100089. [Google Scholar] [CrossRef]
- Haralick, R.M.; Shanmugam, K.; Dinstein, I. Textural Features for Image Classification. IEEE Trans. Syst. Man Cybern. 1973, 6, 610–621. [Google Scholar] [CrossRef]
- Meyer, G.E.; Neto, J.C. Verification of color vegetation indices for automated crop imaging applications. Comput. Electron. Agric. 2008, 63, 282–293. [Google Scholar] [CrossRef]
- Woebbecke, D.M.; Meyer, G.E.; Bargen, K.V.; Mortensen, D.A. Color Indices for Weed Identification Under Various Soil, Residue, and Lighting Conditions. Trans. Asae 1995, 38, 259–269. [Google Scholar] [CrossRef]
- Neto, J.C. A Combined Statistical-Soft Computing Approach for Classification and Mapping Weed Species in Minimum -Tillage Systems; University of Nebraska: Lincoln, NE, USA, 2004. [Google Scholar]
- Louhaichi, M.; Borman, M.M.; Johnson, D.E. Spatially Located Platform and Aerial Photography for Documentation of Grazing Impacts on Wheat. Geocarto Int. 2001, 16, 65–70. [Google Scholar] [CrossRef]
- Gitelson, A.A.; Kaufman, Y.J.; Stark, R.; Rundquist, D. Novel algorithms for remote estimation of vegetation fraction. Remote Sens. Environ. 2002, 80, 76–87. [Google Scholar] [CrossRef]
- Bohlin, J.; Wallerman, J.; Fransson, J.E.S.; Sveriges, L. Forest variable estimation using photogrammetric matching of digital aerial images in combination with a high-resolution DEM. Scand. J. For. Res. 2012, 27, 692–699. [Google Scholar] [CrossRef]
- Tompalski, P.; White, J.C.; Coops, N.C.; Wulder, M.A. Quantifying the contribution of spectral metrics derived from digital aerial photogrammetry to area-based models of forest inventory attributes. Remote Sens. Environ. 2019, 234, 111434. [Google Scholar] [CrossRef]
- Yue, J.; Yang, G.; Tian, Q.; Feng, H.; Xu, K.; Zhou, C. Estimate of winter-wheat above-ground biomass based on UAV ultrahigh-ground-resolution image textures and vegetation indices. Isprs-J. Photogramm. Remote Sens. 2019, 150, 226–244. [Google Scholar] [CrossRef]
- Jayathunga, S.; Owari, T.; Tsuyuki, S. The use of fixed–wing UAV photogrammetry with LiDAR DTM to estimate merchantable volume and carbon stock in living biomass over a mixed conifer–broadleaf forest. Int. J. Appl. Earth Obs. Geoinf. 2018, 73, 767–777. [Google Scholar] [CrossRef]
- Kotivuori, E.; Kukkonen, M.; Mehtätalo, L.; Maltamo, M.; Korhonen, L.; Packalen, P. Forest inventories for small areas using drone imagery without in-situ field measurements. Remote Sens. Environ. 2020, 237, 111404. [Google Scholar] [CrossRef]
- Tian, H.; Zhu, J.; He, X.; Chen, X.; Jian, Z.; Li, C.; Ou, Q.; Li, Q.; Huang, G.; Liu, C.; et al. Using machine learning algorithms to estimate stand volume growth of Larix and Quercus forests based on national-scale Forest Inventory data in China. For. Ecosyst. 2022, 9, 100037. [Google Scholar] [CrossRef]
- Puliti, S.; Gobakken, T.; Ørka, H.O.; Næsset, E. Assessing 3D point clouds from aerial photographs for species-specific forest inventories. Scand. J. For. Res. 2017, 32, 68–79. [Google Scholar] [CrossRef]
- Zheng, H.; Cheng, T.; Zhou, M.; Li, D.; Yao, X.; Tian, Y.; Cao, W.; Zhu, Y. Improved estimation of rice aboveground biomass combining textural and spectral analysis of UAV imagery. Precis. Agric. 2019, 20, 611–629. [Google Scholar] [CrossRef]
- Mensah, S.; Pienaar, O.L.; Kunneke, A.; du Toit, B.; Seydack, A.; Uhl, E.; Pretzsch, H.; Seifert, T. Height—Diameter allometry in South Africa’s indigenous high forests: Assessing generic models performance and function forms. For. Ecol. Manag. 2018, 410, 1–11. [Google Scholar] [CrossRef]
- Meyer, H.A. A Mathematical Expression for Height Curves. J. For. 1940, 38, 415–420. [Google Scholar]
- Tuan, N.T.; Dinh, T.T.; Long, S.H. Height-diameter relationship for Pinus koraiensis in Mengjiagang Forest Farm of Northeast China using nonlinear regressions and artificial neural network models. J. For. Sci. 2019, 65, 134–143. [Google Scholar] [CrossRef]
- Markus, T.; Neumann, T.; Martino, A.; Abdalati, W.; Brunt, K.; Csatho, B.; Farrell, S.; Fricker, H.; Gardner, A.; Harding, D. The Ice, Cloud, and land Elevation Satellite-2 (ICESat-2): Science requirements, concept, and implementation. Remote Sens. Environ. 2017, 190, 260–273. [Google Scholar] [CrossRef]
- Torresani, M.; Rocchini, D.; Alberti, A.; Moudrý, V.; Heym, M.; Thouverai, E.; Kacic, P.; Tomelleri, E. LiDAR GEDI derived tree canopy height heterogeneity reveals patterns of biodiversity in forest ecosystems. Ecol. Inform. 2023, 76, 102082. [Google Scholar] [CrossRef]
- Mao, P.; Qin, L.; Hao, M.; Zhao, W.; Luo, J.; Qiu, X.; Xu, L.; Xiong, Y.; Ran, Y.; Yan, C.; et al. An improved approach to estimate above-ground volume and biomass of desert shrub communities based on UAV RGB images. Ecol. Indic. 2021, 125, 107494. [Google Scholar] [CrossRef]
- Verma, N.K.; Lamb, D.W.; Reid, N.; Wilson, B. An allometric model for estimating DBH of isolated and clustered Eucalyptus trees from measurements of crown projection area. For. Ecol. Manag. 2014, 236, 125–132. [Google Scholar] [CrossRef]
- Carbonell-Rivera, J.P.; Torralba, J.; Estornell, J.; Ruiz, L.Á.; Crespo-Peremarch, P. Classification of Mediterranean Shrub Species from UAV Point Clouds. Remote Sens. 2022, 14, 199. [Google Scholar] [CrossRef]
- Clark, M.L.; Clark, D.B.; Roberts, D.A. Small-footprint lidar estimation of sub-canopy elevation and tree height in a tropical rain forest landscape. Remote Sens. Environ. 2004, 91, 68–89. [Google Scholar] [CrossRef]
- Hilker, T.; Leeuwen, M.V.; Coops, N.C.; Wulder, M.A.; Newnham, G.J.; Jupp, D.L.B.; Culvenor, D.S. Comparing canopy metrics derived from terrestrial and airborne laser scanning in a Douglas-fir dominated forest stand. Trees 2010, 24, 819–832. [Google Scholar] [CrossRef]
- Kalacska, M.; Chmura, G.L.; Lucanus, O.; Bérubé, D.; Arroyo-Mora, J.P. Structure from motion will revolutionize analyses of tidal wetland landscapes. Remote Sens. Environ. 2017, 23, 177–190. [Google Scholar] [CrossRef]
- Fan, J.; Dai, W.; Wang, B.; Li, J.; Yao, J.; Chen, K. UAV-Based Terrain Modeling in Low-Vegetation Areas: A Framework Based on Multiscale Elevation Variation Coefficients. Remote Sens. 2023, 15, 3569. [Google Scholar] [CrossRef]
- Morrison, W.; Grimmond, S.; Kotthaus, S. Simulating satellite urban land surface temperatures: Sensitivity to sensor view angle and assumed landscape complexity. Remote Sens. Environ. 2023, 293, 113579. [Google Scholar] [CrossRef]
- Rizeei, H.M.; Shafri, H.Z.M.; Mohamoud, M.A.; Pradhan, B.; Kalantar, B. Oil Palm Counting and Age Estimation from WorldView-3 Imagery and LiDAR Data Using an Integrated OBIA Height Model and Regression Analysis. J. Sens. 2018, 2018, 2536327. [Google Scholar] [CrossRef]
- Chen, J.M. Spatial Scaling of a Remotely Sensed Surface Parameter by Contexture. Remote Sens. Environ. 1999, 69, 30–42. [Google Scholar] [CrossRef]
Figure 1.
Study area. Details of site 1 (top row) and site 2 (bottom row). The left column represents the RGB images, the middle column represents the LiDAR point clouds and the right column represents the individual tree segmentation results based on LiDAR point cloud.
Figure 1.
Study area. Details of site 1 (top row) and site 2 (bottom row). The left column represents the RGB images, the middle column represents the LiDAR point clouds and the right column represents the individual tree segmentation results based on LiDAR point cloud.
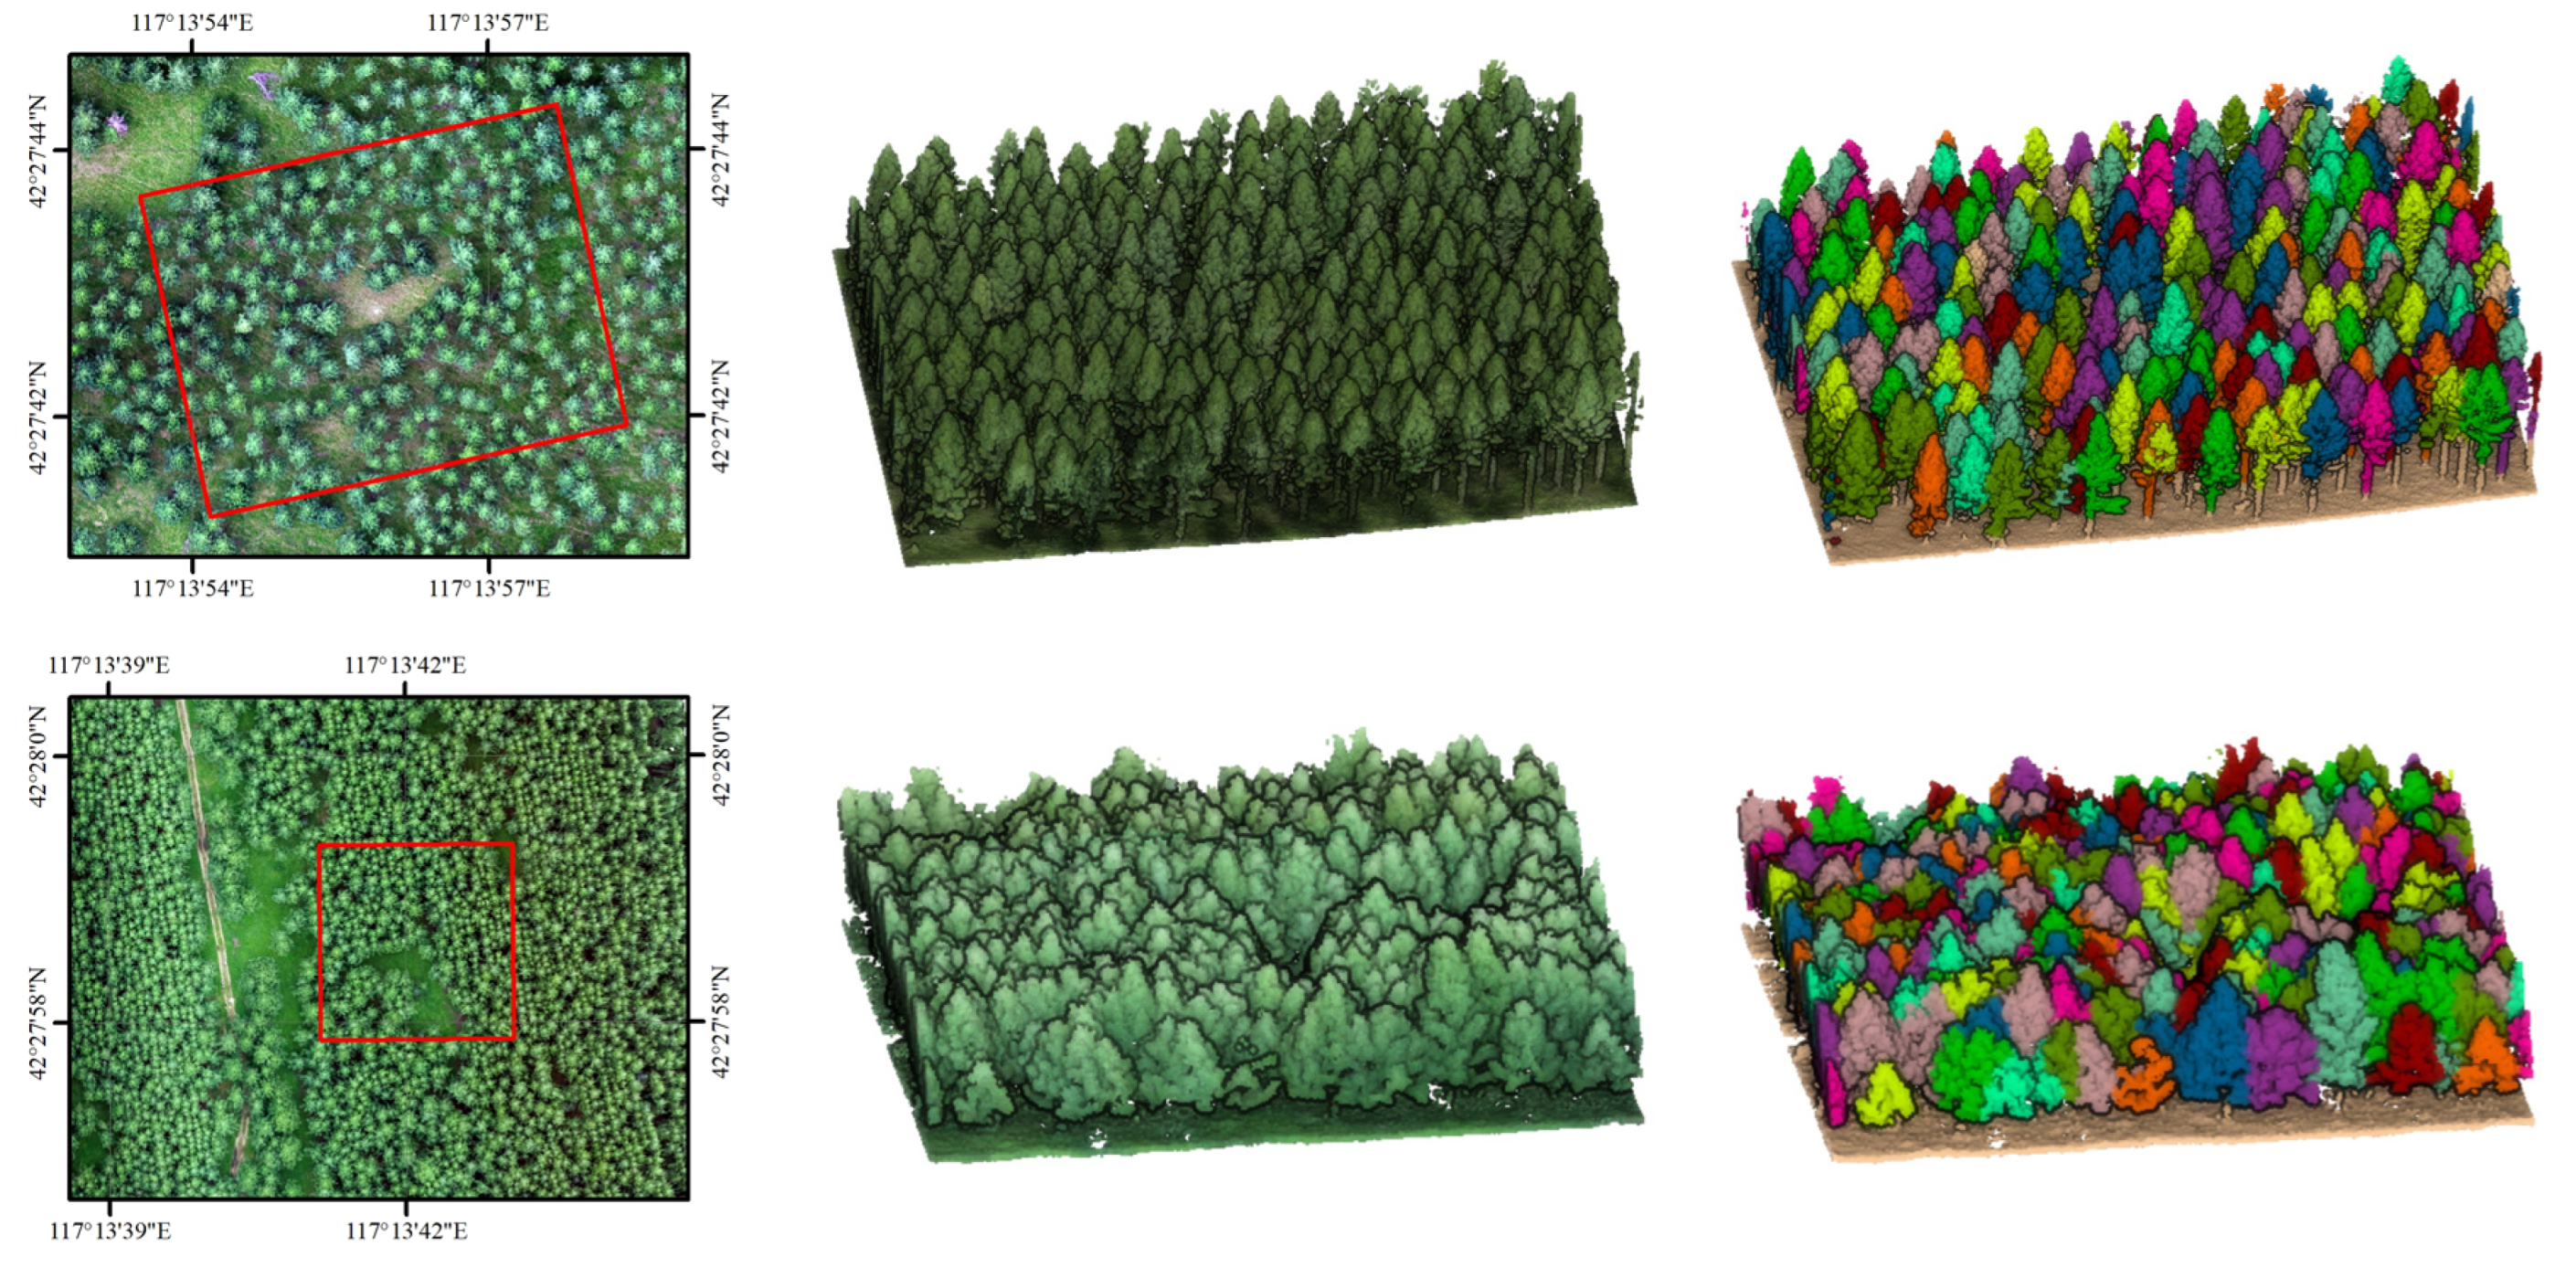
Figure 2.
Person’s correlation coefficient between DBH and extracted metrics.
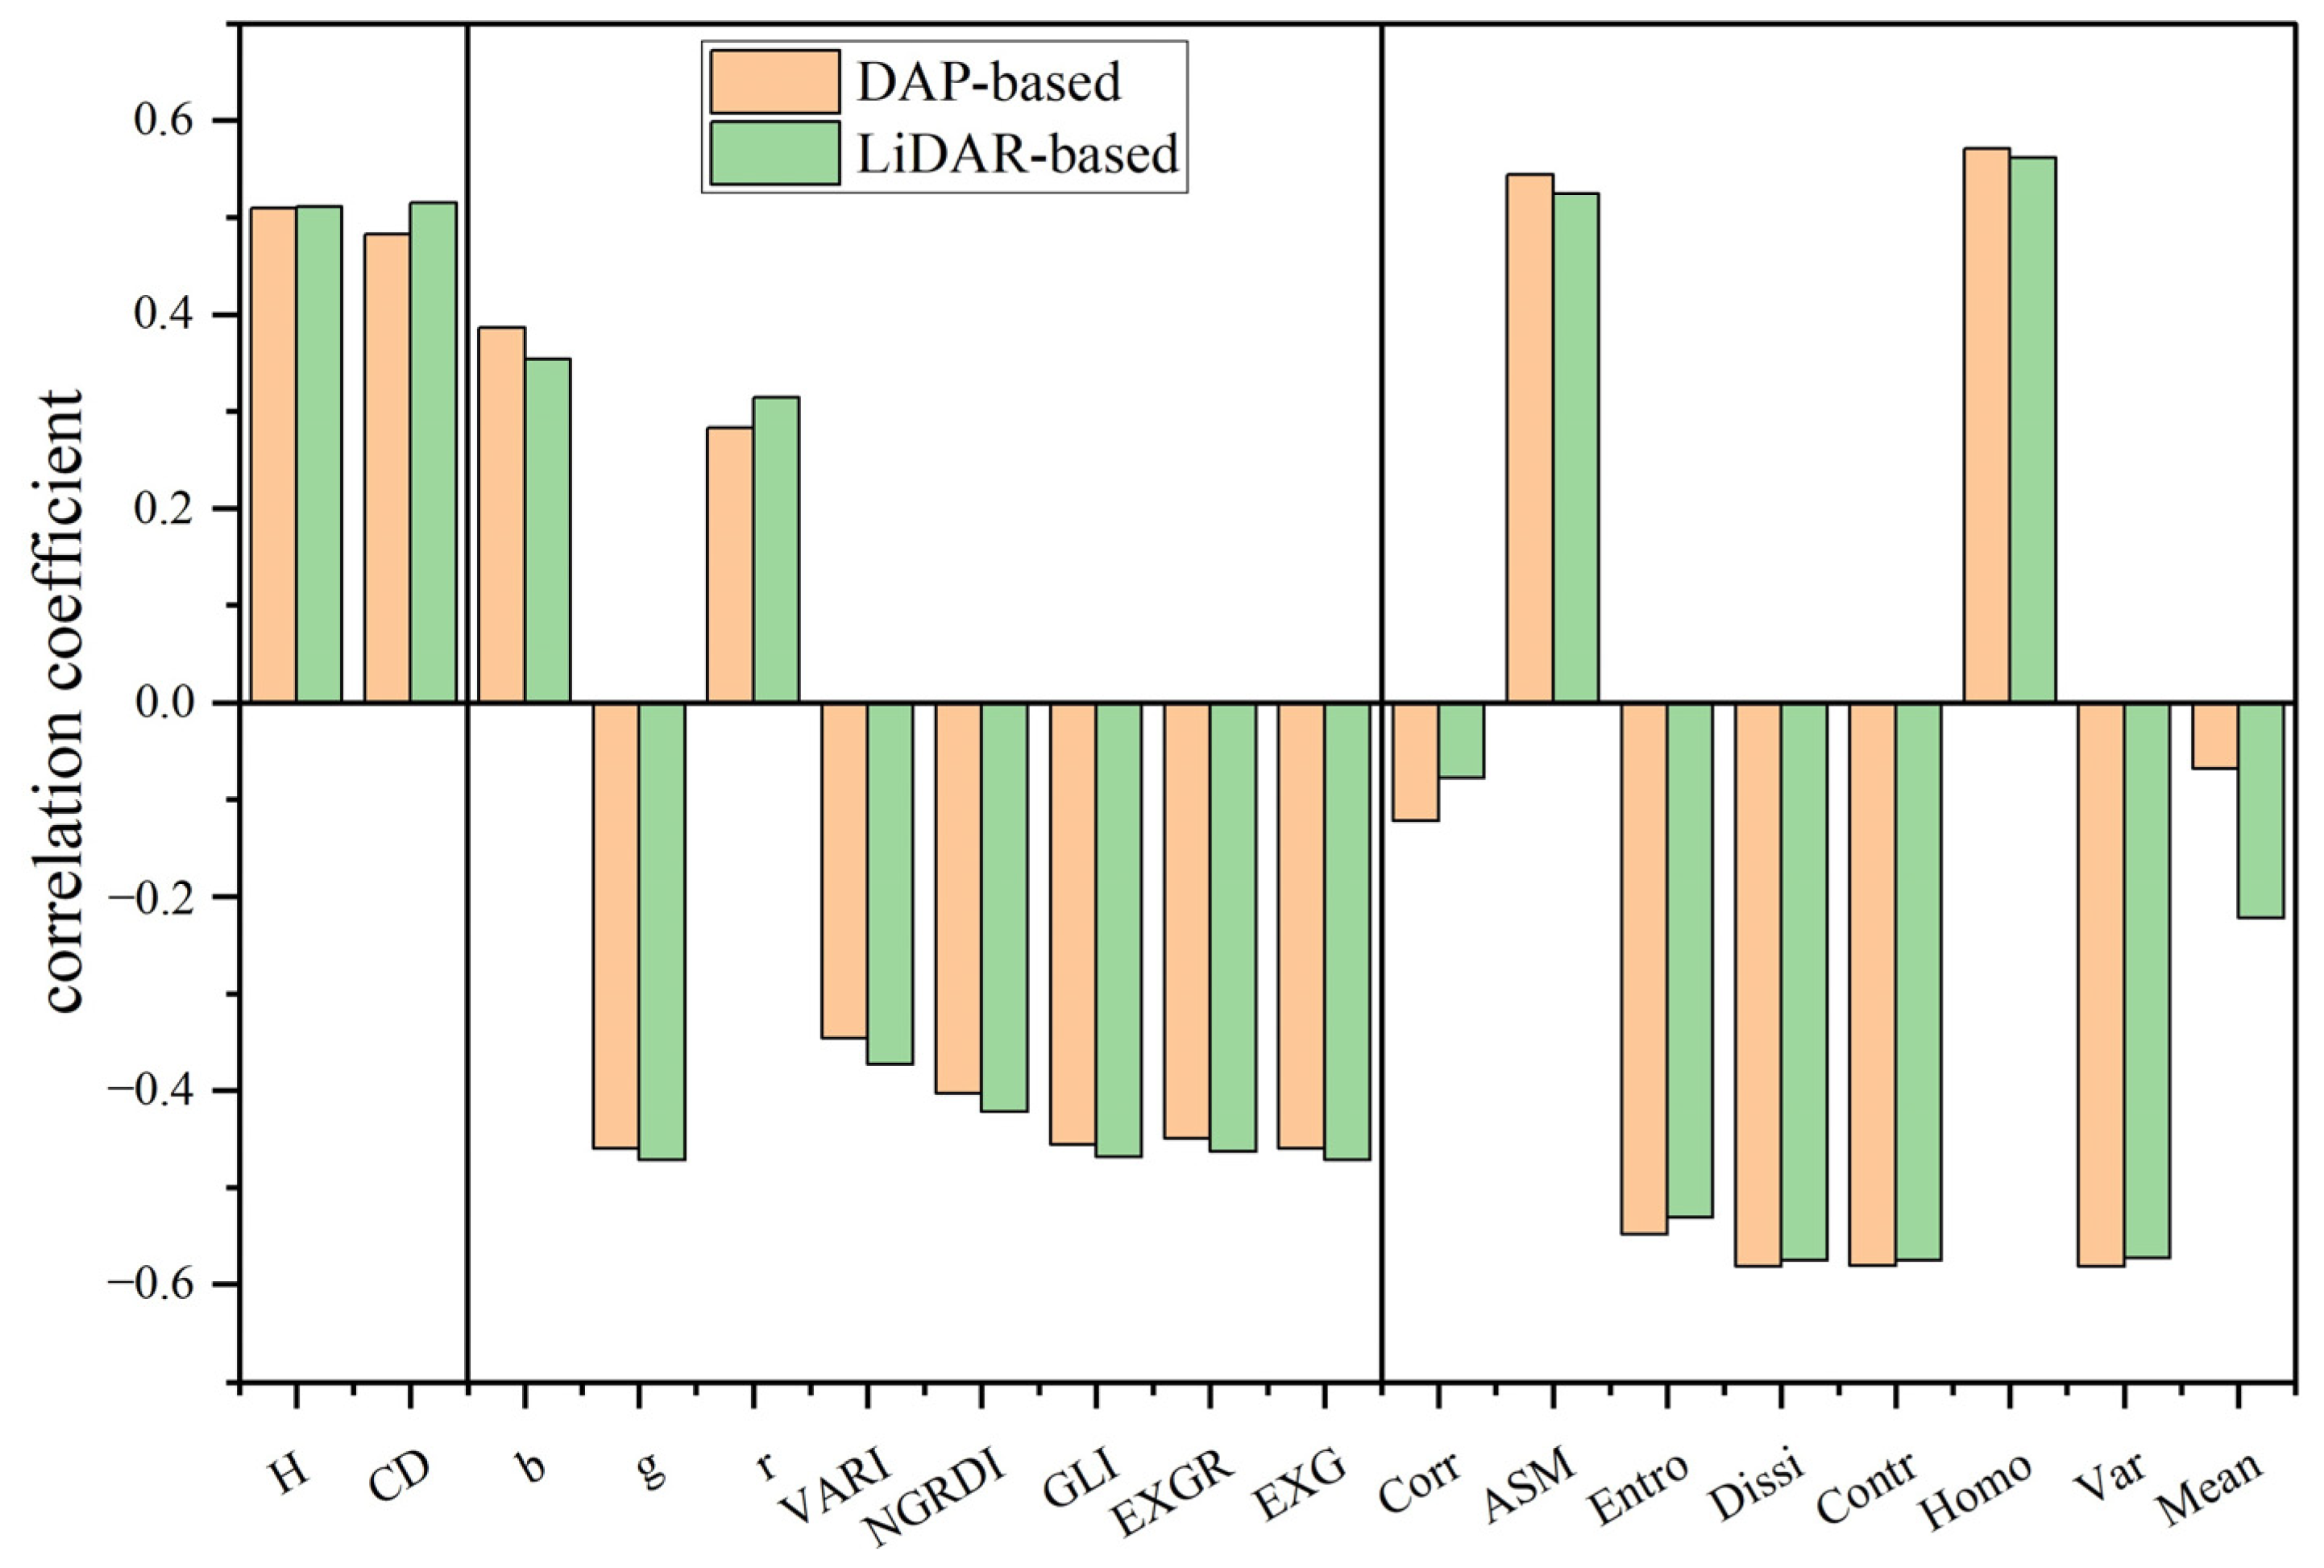
Figure 3.
DBH prediction results based on different metric sets: (a) the individual tree crown boundaries were derived from LiDAR point cloud; (b) the individual tree crown boundaries were derived from DAP point cloud. The X-axis represents the different metric sets based on three models (MLR, RF and SVM), while the Y-axis represents the predicted results of DBH.

Table 1.
Definitions of the visible spectral indices and textural metrics.
| Metrics | Description | Reference | |
|---|---|---|---|
| Spectral indices | Normalized redness intensity (r) | R/(R + G + B) | [30] |
| Normalized greenness intensity (g) | G/(R + G + B) | [30] | |
| Normalized blueness intensity (b) | B/(R + G + B) | [30] | |
| Excess green index (ExG) | 2g − r − b | [31] | |
| Excess green minus excess red index (ExGR) | 3g − 2.4r − b | [32] | |
| Green leaf index (GLI) | (2G – B − R)/(2G + B + R) | [33] | |
| Normalized green–red difference index (NGRDI) | (G − R)/(G + R) | [34] | |
| Visible atmospherically resistant index (VARI) | (G − R)/(G + R − B) | [34] | |
| Textural metrics | Mean | Mean of GLCM | [29] |
| Var | Variance of GLCM | ||
| Homo | Homogeneity of GLCM | ||
| Contr | Contrast of GLCM | ||
| Dissi | Dissimilarity of GLCM | ||
| Entro | Entropy of GLCM | ||
| ASM | Angular second moment of GLCM | ||
| Corr | Correlation of GLCM |
R, G and B represent raw values of red, green and blue bands, respectively.
Table 2.
The metric sets for DBH estimation based on LiDAR point cloud and DAP point cloud.
| Metric Sets | Contained Metrics | No. | |
|---|---|---|---|
| Based on LiDAR point cloud | TexM | ASM, Entro, Dissi, Contr, Homo, Var, Mean | 7 |
| VIs | r, g, b, VARI, NGRDI, GLI, EXGR, EXG | 8 | |
| StrM | H, CD | 2 | |
| TexM + VIs | ASM, Entro, Dissi, Contr, Homo, Var, Mean, r, g, b, VARI, NGRDI, GLI, EXGR, EXG | 15 | |
| TexM + StrM | ASM, Entro, Dissi, Contr, Homo, Var, Mean, H, CD | 9 | |
| VIs + StrM | r, g, b, VARI, NGRDI, GLI, EXGR, EXG, H, CD | 10 | |
| TexM + VIs + StrM | ASM, Entro, Dissi, Contr, Homo, Var, Mean, r, g, b, VARI, NGRDI, GLI, EXGR, EXG, H, CD | 17 | |
| Based on DAP point cloud | TexM | ASM, Entro, Dissi, Contr, Homo, Var | 6 |
| VIs | r, g, b, VARI, NGRDI, GLI, EXGR, EXG | 8 | |
| StrM | H, CD | 2 | |
| TexM + VIs | ASM, Entro, Dissi, Contr, Homo, Var, r, g, b, VARI, NGRDI, GLI, EXGR, EXG | 14 | |
| TexM + StrM | ASM, Entro, Dissi, Contr, Homo, Var, H, CD | 8 | |
| VIs + StrM | r, g, b, VARI, NGRDI, GLI, EXGR, EXG, H, CD | 10 | |
| TexM + VIs + StrM | ASM, Entro, Dissi, Contr, Homo, Var, r, g, b, VARI, NGRDI, GLI, EXGR, EXG, H, CD | 16 |
Table 3.
Accuracy results of DBH estimation using 2D image-based metrics.
| Model | Metric Sets | LiDAR-Based | DAP-Based | ||
|---|---|---|---|---|---|
| RMSE | RMSE% | RMSE | RMSE% | ||
| MLR | TexM | 0.032 | 16.879 | 0.034 | 17.454 |
| VIs | 0.033 | 17.392 | 0.035 | 17.903 | |
| TexM + VIs | 0.032 | 16.744 | 0.035 | 17.869 | |
| RF | TexM | 0.035 | 18.566 | 0.036 | 18.646 |
| VIs | 0.037 | 19.494 | 0.037 | 19.033 | |
| TexM + VIs | 0.037 | 19.401 | 0.036 | 18.246 | |
| SVM | TexM | 0.043 | 22.599 | 0.035 | 17.933 |
| VIs | 0.051 | 26.831 | 0.047 | 24.075 | |
| TexM + VIs | 0.047 | 24.825 | 0.041 | 21.155 | |
Table 4.
Accuracy results of DBH estimations using composed metrics.
| Model | Metric Sets | LiDAR-Based | DAP-Based | ||
|---|---|---|---|---|---|
| RMSE | RMSE% | RMSE | RMSE% | ||
| MLR | StrM | 0.034 | 17.609 | 0.033 | 16.907 |
| TexM + StrM | 0.033 | 17.534 | 0.034 | 17.447 | |
| VIs + StrM | 0.033 | 17.403 | 0.034 | 17.396 | |
| TexM + VIs + StrM | 0.033 | 17.308 | 0.035 | 17.869 | |
| RF | StrM | 0.037 | 19.152 | 0.038 | 19.365 |
| TexM + StrM | 0.038 | 19.899 | 0.038 | 19.740 | |
| VIs + StrM | 0.035 | 18.419 | 0.036 | 18.668 | |
| TexM + VIs + StrM | 0.039 | 20.476 | 0.037 | 18.723 | |
| SVM | StrM | 0.054 | 28.483 | 0.050 | 25.589 |
| TexM + StrM | 0.047 | 24.797 | 0.036 | 18.479 | |
| VIs + StrM | 0.040 | 20.773 | 0.052 | 26.834 | |
| TexM + VIs + StrM | 0.052 | 27.152 | 0.050 | 25.502 | |
Disclaimer/Publisher’s Note: The statements, opinions and data contained in all publications are solely those of the individual author(s) and contributor(s) and not of MDPI and/or the editor(s). MDPI and/or the editor(s) disclaim responsibility for any injury to people or property resulting from any ideas, methods, instructions or products referred to in the content. |
© 2023 by the authors. Licensee MDPI, Basel, Switzerland. This article is an open access article distributed under the terms and conditions of the Creative Commons Attribution (CC BY) license (https://creativecommons.org/licenses/by/4.0/).
Share and Cite
MDPI and ACS Style
Mao, Z.; Lu, Z.; Wu, Y.; Deng, L. DBH Estimation for Individual Tree: Two-Dimensional Images or Three-Dimensional Point Clouds? Remote Sens. 2023, 15, 4116. https://doi.org/10.3390/rs15164116
AMA Style
Mao Z, Lu Z, Wu Y, Deng L. DBH Estimation for Individual Tree: Two-Dimensional Images or Three-Dimensional Point Clouds? Remote Sensing. 2023; 15(16):4116. https://doi.org/10.3390/rs15164116
Chicago/Turabian StyleMao, Zhihui, Zhuo Lu, Yanjie Wu, and Lei Deng. 2023. "DBH Estimation for Individual Tree: Two-Dimensional Images or Three-Dimensional Point Clouds?" Remote Sensing 15, no. 16: 4116. https://doi.org/10.3390/rs15164116
Note that from the first issue of 2016, this journal uses article numbers instead of page numbers. See further details here.