Technical Note

Classifying a Highly Polymorphic Tree Species across Landscapes Using Airborne Imaging Spectroscopy

by
Megan M. Seeley
1,2,*,
Nicholas R. Vaughn
1,
Brennon L. Shanks
3,
Roberta E. Martin
1,4,
Marcel König
1 and
Gregory P. Asner
1,2,4
1
Center for Global Discovery and Conservation Science, Arizona State University, Hilo, HI 96720, USA
2
School of Geographical Sciences and Urban Planning, Arizona State University, Tempe, AZ 85281, USA
3
Department of Chemical Engineering, University of Utah, Salt Lake City, UT 84112, USA
4
School of Ocean Futures, Arizona State University, Hilo, HI 96720, USA
*
Author to whom correspondence should be addressed.
Remote Sens. 2023, 15(18), 4365; https://doi.org/10.3390/rs15184365
Submission received: 24 July 2023 / Revised: 21 August 2023 / Accepted: 2 September 2023 / Published: 5 September 2023

Abstract

:
Vegetation classifications on large geographic scales are necessary to inform conservation decisions and monitor keystone, invasive, and endangered species. These classifications are often effectively achieved by applying models to imaging spectroscopy, a type of remote sensing data, but such undertakings are often limited in spatial extent. Here we provide accurate, high-resolution spatial data on the keystone species Metrosideros polymorpha, a highly polymorphic tree species distributed across bioclimatic zones and environmental gradients on Hawai’i Island using airborne imaging spectroscopy and LiDAR. We compare two tree species classification techniques, the support vector machine (SVM) and spectral mixture analysis (SMA), to assess their ability to map M. polymorpha over 28,000 square kilometers where differences in topography, background vegetation, sun angle relative to the aircraft, and day of data collection, among others, challenge accurate classification. To capture spatial variability in model performance, we applied Gaussian process classification (GPC) to estimate the spatial probability density of M. polymorpha occurrence using only training sample locations. We found that while SVM and SMA models exhibit similar raw score accuracy over the test set (96.0% and 93.4%, respectively), SVM better reproduces the spatial distribution of M. polymorpha than SMA. We developed a final 2 m × 2 m M. polymorpha presence dataset and a 30 m × 30 m M. polymorpha density dataset using SVM classifications that have been made publicly available for use in conservation applications. Accurate, large-scale species classifications are achievable, but metrics for model performance assessments must account for spatial variation of model accuracy.

Graphical Abstract

1. Introduction

Conservation decision-making relies on the quantification and monitoring of forested ecosystem health across large landscapes. Spatially mapping rare, endangered, keystone, or invasive tree species is necessary to understand habitat quality, model future forest assemblages, protect a particular species, and manage ecosystem services, among other conservation goals. While the number of studies reporting tree species classifications is increasing, few classify single species across large geographic extents [1]. Large-scale single-species classifications have many logistical considerations that challenge accurate species mapping such as intraspecific variation [1], canopy and understory species turnover [2,3], subcanopy shading [4,5], date of image acquisition [4], and computational limitations [6]. Further, traditional metrics for evaluating model performance do not capture the spatial variability of model accuracy [7,8] and are therefore impractical for classifications on large geographic scales. Due to the pressing need for these data in conservation applications, it is important to address these challenges associated with tree species classifications over large geographic extents.
Metrosideros polymorpha (‘ōhi’a lehua) is an ideal overstory tree species to address these challenges due to its prevalence in many bioclimatic zones, high intra-specific variation, and the need for accurate spatial data of this keystone species endemic to Hawai’i (Figure S1). Approximately half of the vegetative biomass [9] and 80% of the native forest basal area [10] in the state of Hawai’i is M. polymorpha. As a major component of native Hawaiian forests, M. polymorpha provides habitat to many endemic plants and animals [11], is culturally important to Native Hawaiians [12,13], and sustains vital ecosystem services such as groundwater recharge [14]. M. polymorpha, and therefore native Hawaiian forest ecosystems, is in decline due to the introduction of invasive species and Rapid ‘Ohi’a Dead (ROD), a widespread disease that has led to millions of M. polymorpha mortalities [15]. M. polymorpha not only represents a keystone species in decline but its existence across multiple ecosystems from sea level to 7150 m elevation and on a range of soil substrates from bare lava flows to late successional flows [16] allows us to investigate methods of mapping a single species across diverse landscapes. While studies have compared the spectral similarity of plants across ecosystems, they largely investigated the effect of species turnover on spectral variation [6,17]. The M. polymorpha model system [18] allows us to assess the intraspecific variation of one species across bioclimatic zones. Further, M. polymorpha is highly polymorphic, exhibiting heritable morphological and chemical differences across environmental gradients [19,20,21,22,23]. On Hawai’i Island, M. polymorpha has four described varieties, many of which hybridize naturally, which exist in specific habitats and have distinct morphologic, chemical, and spectral characteristics [22,23,24].
Despite the prominence of M. polymorpha on the landscape, spatial data of M. polymorpha does not exist at the resolution necessary to inform many native forest conservation decision-making processes. For example, the Hawai’i Gap Analysis Project (HI-GAP) developed spatial data of forest classes including M. polymorpha and mixed M. polymorpha stands, but these data were developed in 2001 using 30 m × 30 m Landsat imagery [25]. While this map is useful for approximating locations where M. polymorpha may exist, the resolution is too coarse for detailed spatial analyses, and it includes many classification errors due to the lack of high spatial and spectral information in Landsat data. Current, high-resolution spatial information on M. polymorpha is needed for watershed-level decision-making models being developed for Hawai’i Island [26,27,28], refining ROD monitoring methods, and defining a baseline species distribution of M. polymorpha to track future range shifts.
To develop novel and high-resolution (2 m × 2 m) spatial data of M. polymorpha in support of these conservation efforts, we used a fusion of airborne imaging spectroscopy and light detection and ranging (LiDAR) data. Imaging spectroscopy is a process of image formation that captures reflectance across a continuous portion of the visible to short-wave infrared (VSWIR) spectrum in short wavelength intervals (~10 nm). These high-spectral resolution data capture surface chemistry [29,30], and because each species has a unique chemical fingerprint [31], imaging spectroscopy allows for accurate species classifications [2,32,33,34,35,36,37]. LiDAR, which uses pulsed lasers to quantify the surface structure, has been fused with imaging spectroscopy data to reduce the spectral influence of canopy shading and provide precise geolocation [38,39]. Prior work has used imaging spectroscopy from multiple sites across the United States to develop classifications and demonstrated that accurate classifications on large geographic scales are possible [3,40].
Using airborne imaging spectroscopy and LiDAR data processed over 28,000 km2 of area at a 2 m spatial resolution, we developed a spatial dataset of M. polymorpha canopies across Hawai’i Island with two classification techniques, support vector machine (SVM) and spectral mixture analysis (SMA). We assessed how well these methods can classify a single highly polymorphic tree species across a large geographic area. Classification performance was assessed by test set accuracy metrics and a comparison with estimated spatial probability densities calculated with Gaussian process classification (GPC). The final products include an accurate, high-resolution dataset of a keystone species available to conservationists and decision-makers seeking to protect native Hawaiian forests.

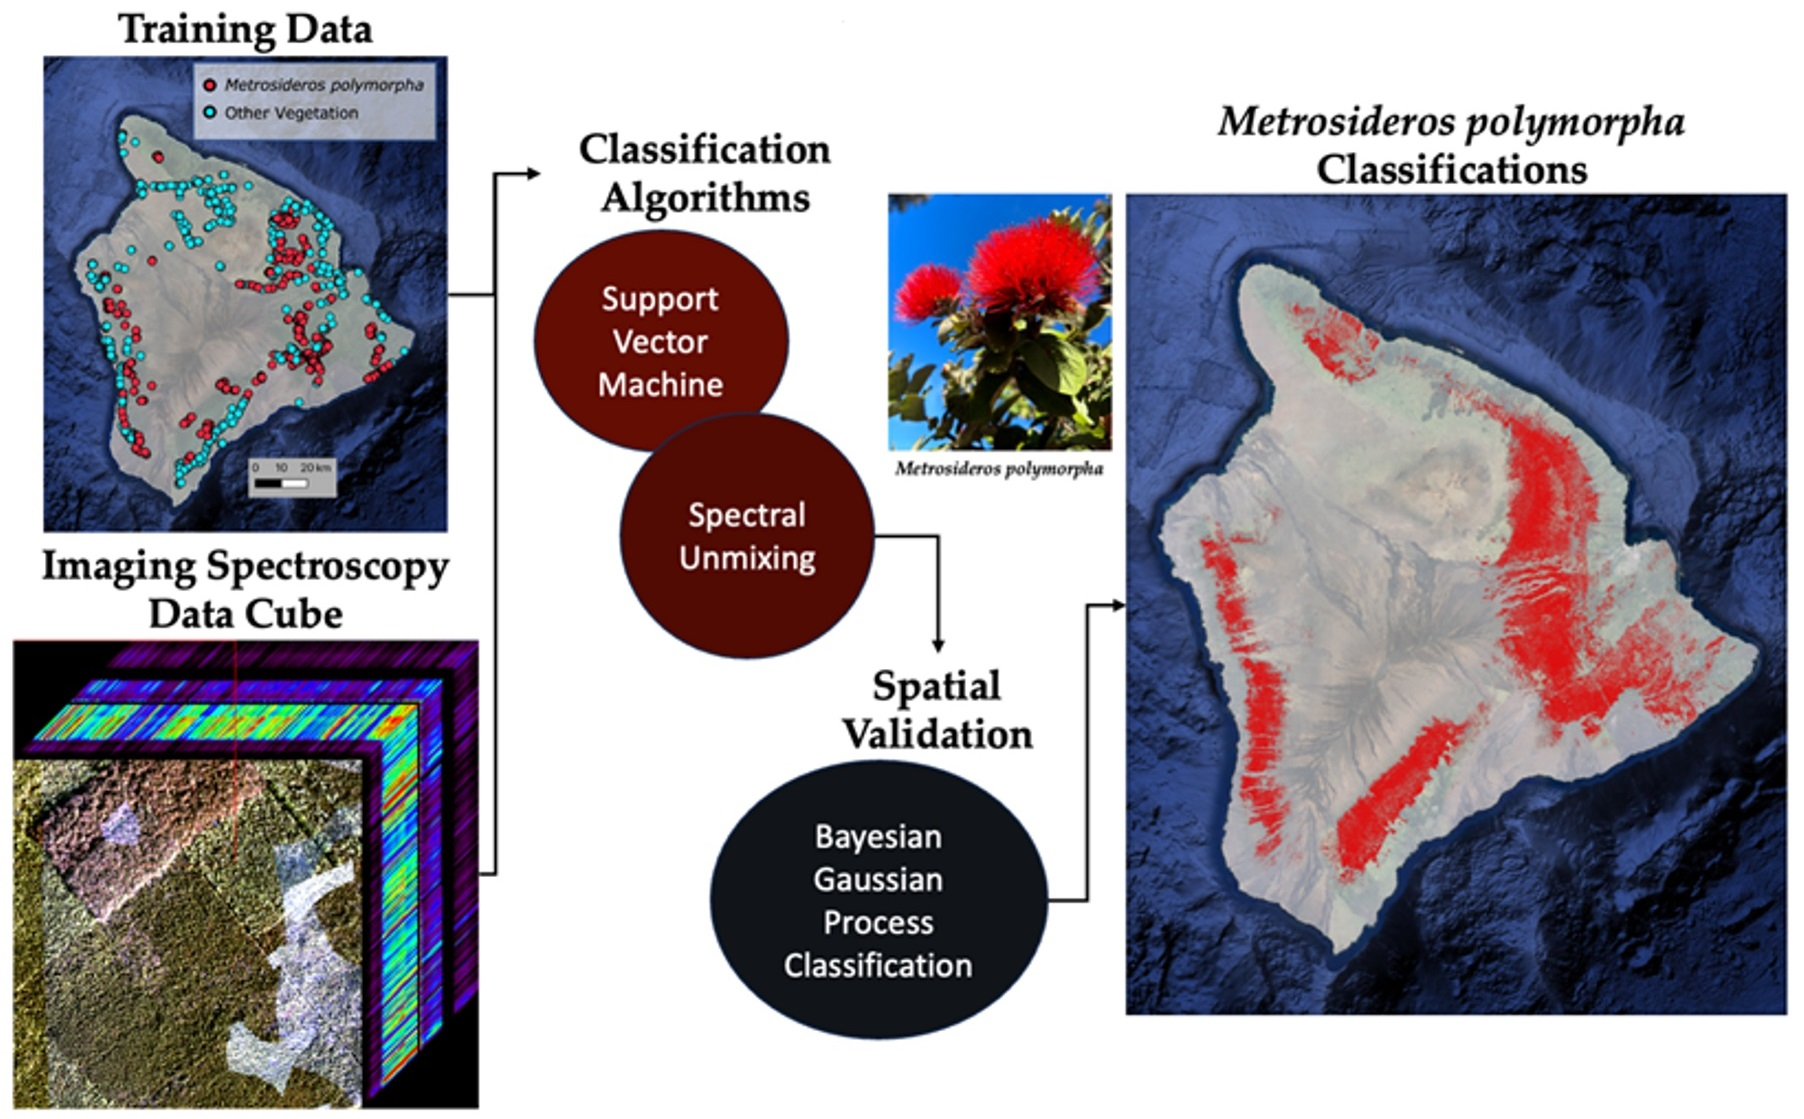
2. Materials and Methods

Imaging spectroscopy data were collected across Hawai’i Island by the Global Airborne Observatory (GAO) in January 2019, with some regions filled in with the most recent data from previous campaigns in January 2016, July 2017, and January 2018 [38]. In addition to the high-fidelity imaging spectrometer (380–2510 nm), the GAO houses a boresight-aligned dual-laser LiDAR scanner. LiDAR data were used to generate a surface elevation map and precise time-synced position and orientation data that were used to orthorectify VSWIR spectroscopy data to a 2 m × 2 m spatial resolution. After orthorectification, VSWIR data were corrected for atmospheric effects and processed to retrieve hemispherical-direction reflectance values with ACORN v6.0 (Atmospheric CORrection Now; AIG LLC; Boulder, CO, USA) [41,42]. Cloud-free mosaics were developed by first removing clouds and cloud shadows from individual flight-line-level reflectance maps using a mixture of automated cloud detection provided by a trained neural network model and manual revision of the produced cloud and cloud shadow outlines. The cleaned flight line maps were then manually layered based on minimizing flight line edge artifacts as observed in true color composites. Mosaics were developed based on the optimal layer order. VSWIR surface reflectance data across Hawai’i Island were then brightness-normalized by dividing each VSWIR channel by the vector norm of the entire VSWIR spectrum for each pixel after removing bands affected by atmospheric water absorption features. Brightness normalization is a means to control for variation in reflectance caused by properties not related to foliar chemistry such as subpixel shade, leaf orientation relative to viewing and sun angles, and leaf volume [43]. Regions where differences between flight lines caused erroneous classifications were further processed using bidirectional reflectance distribution function (BRDF) adjustments. BRDF effects result from the anisotropic scattering of remote sensing targets, where the basic atmospheric correction model assumes a flat, evenly diffuse surface. Empirical kernel models were fit to the reflectance and observation angle data, and spectra were adjusted to a standard observation angle using the difference between the observed spectra and their modeled BRDF spectra [44]. Next, the data were filtered to obtain pixels representing photosynthetic vegetation. Normalized difference vegetation index (NDVI) data were calculated using bands at 650 nm and 860 nm of the VSWIR data, and all pixels under a 0.7 NDVI threshold were removed. Understory and shaded portions of the canopy were filtered from the data using top-of-canopy height (TCH) surface maps generated from LiDAR and a shade mask generated using a ray tracing technique on the LiDAR-derived surface elevation map [38,45]. TCH surface maps were used to remove pixels below two meters.

2.1. Training Data Collection

In the summer of 2022 through the spring of 2023, 5366 canopies were delineated and identified as either M. polymorpha or “other vegetation” largely via field surveys (Figure 1; Figure S2). 1713 crowns represented M. polymorpha canopies, and 3653 were of other species. Crowns of other species were grouped and represented all the background vegetation spectra that the classification models discriminated from M. polymorpha. Field data were collected using Garmin Glo GPS connected to tablets with GAO TCH, true and false color composites, and preliminary M. polymorpha classifications developed using a support vector machine (SVM). These data were brought into the field to increase crown delineation accuracy. Data were collected using a combination of field excursions, helicopter surveys, and Google Street View. While data were collected across elevation and soil substrate age gradients, observations were primarily concentrated along roadways and other easily accessible sites (Figure 1). In addition to canopy location data collected specifically for the M. polymorpha mapping effort, canopy delineations from Balzotti et al. [32] and Weingarten et al. [46] were included in the training data as they used similar methods of delineating crowns in 2019 GAO data. Canopy spectra used to train the classification algorithms were generated by averaging all pixels from the filtered VSWIR reflectance data within each tree crown (Figure S2).

2.2. Species Classification

We compared the performance of two classification algorithms—support vector machine (SVM) and spectral mixture analysis (SMA)—in distinguishing M. polymorpha from other vegetation across Hawai’i Island. SVM and SMA were selected as both demonstrate high accuracy in imaging spectroscopy vegetation classifications [2,32,33,34,36,47,48,49]. For both classification algorithms, crown spectra data were randomly separated into training (70%) and test (30%) datasets to assess model performance.
SMA assumes that an image pixel spectrum is the linear combination of the abundant materials weighted by their fractional coverage and that this mixed signal can be unmixed using combinations of “pure” endmember spectra representing different thematic classes. This method has been successfully used for forest species classifications across many ecosystems [33,34], including those in Hawai’i [36]. We used Multiple Endmember Spectral Mixture Analysis [50] on the full VSWIR spectra with automatic band selection, which allows endmembers and the number of classes used for SMA to change on a per-pixel basis. We used a two-endmember MESMA model, which assumes that each pixel is either M. polymorpha or other vegetation plus a shade fraction [50,51]. Because we brightness-normalized the data, no shade was used in the fitting procedure.
As computational time increases with the number of possible endmember combinations and endmembers from the same class are often spectrally similar, we pruned the spectral library by clustering training spectra and creating new endmember spectra from the mean reflectance of similar endmembers. Endmember similarity was determined using hierarchical clustering of the spectra within the training data, with a distance matrix computed using the spectral angle. To determine the optimal maximum inter-cluster distance, we tested a range of distances and used the one that achieved the highest accuracy on the test dataset. For clusters with endmembers representing both M. polymorpha and other vegetation, we averaged spectra within the cluster based on their classification to create multiple endmembers. Other parameters within MESMA such as the maximum RMSE and shade threshold did not affect accuracy. The MESMA model used to classify GAO data across Hawai’i Island included a spectral library developed by reducing all the training data available into 2238 training points via the hierarchical clustering described above. While most pixels were classified as entirely M. polymorpha or other vegetation due to the high resolution of the imaging spectroscopy dataset (2 m × 2 m), we used a threshold of 0.5 to develop a binary M. polymorpha presence/absence dataset.
Similar to SMA, SVM classifiers are commonly used in imaging spectroscopy applications [2,32,49]. SVMs efficiently handle highly dimensional datasets by maximizing the distance between training data and decision boundaries between the two categories in feature space [2,52,53]. SVMs typically outperform other supervised classifiers such as random forest in imaging spectroscopy classification applications [47,48,49]. We optimized hyperparameter selection (kernel coefficient and regulation parameter) of a radial kernel SVM using a grid search in the scikit-learn package (version 0.24.1) [54] in Python (version 3.6.9). We used Youden’s J statistic, which uses the sensitivity and specificity of the model, to determine the optimal classification threshold [55].
Throughout the model training process, we noted that traditional classification metrics such as accuracy did not sufficiently describe model performance, particularly concerning the spatial distribution of the model predictions. To characterize the spatial variability in model performance, we compared SVM- and SMA-derived M. polymorpha maps with an independently trained spatial probability density map estimated using Gaussian process classification (GPC) in scikit-learn with a radial kernel [54]. GPC is a probabilistic classification technique that is used to assign expected class probabilities with the Bayes theorem [56]. The GPC estimates the probability of observing M. polymorpha as a function of the x- and y-coordinates of the habitat range, providing a benchmark to validate the spatial accuracy of the spectral models (Figure S3). While the GPC as a predictor for M. polymorpha presence is limited by the sampling design, it is a useful tool for validating the SVM and SMA results as it can identify areas that have high and low M. polymorpha presence probability based on the training dataset. In regions without training data, the GPC has a middle probability (50/50) of M. polymorpha presence. The GPC trained on the training dataset achieved a 94% accuracy on the test dataset.
SVM and SMA were then applied to island-wide VSWIR reflectance data filtered to exclude shaded portions of the canopy, non-photosynthetic features as determined by the NDVI threshold, and vegetation less than 2 m. To fill gaps in the canopy resulting from the shade masking, classification data were interpolated using the inverse distance weighting technique available in the rasterio package fill module v. 1.2.10. We then compared the accuracies of the two models as well as their island-wide classifications of M. polymorpha relative to the Bayesian GPC. The best M. polymorpha classification was used to develop a high-resolution (2 m × 2 m) canopy map. This high-resolution map was then down-sampled into a coarse-density product by aggregating the 2 m × 2 m binary pixels onto a 30 m × 30 m grid via the mean function.

3. Results

3.1. Model Performance

We compared two classification techniques to assess their performance on the test dataset and 2 m × 2 m GAO data across Hawai’i Island (Figure 2; Table 1). The results showed that SVM outperformed SMA. The SMA model achieved an accuracy of 93.4% and a precision of 88.7%, while the SVM achieved an accuracy of 96.0% and a precision of 91.9% (Table 1). Further, the false positive rate was 1.5 percent higher for SMA (5.6%) than SVM (4.1%). Applied to the entire island, this two percent difference led to over 684 million more misclassified pixels for SMA than SVM (Figure 2). Interestingly, these misclassifications were often observed in geographically distinct regions from where the SVM predicted M. polymorpha to exist, often at lower elevations (Figure 2c). Moreover, false positives from SMA frequently occurred in regions with a low probability of M. polymorpha existing according to the Bayesian GPC (Figure 2c). Disagreement between the models was spatially arranged; 30.8% of pixels classified as M. polymorpha by SMA and not by SVM were in regions of low M. polymorpha according to the Bayesian GCP probability (<0.33). Only 13.9% of pixels classified as M. polymorpha by SVM but not SMA were in these regions of low M. polymorpha probability according to the GCP (Table 2).
SMA was also more likely to misclassify M. polymorpha canopies as the true positive rate for SMA (91.2%) was 3.6% lower than that of the SVM (94.8%; Table 1). These false negatives most often occurred where M. polymorpha forests were predicted to be densest by the SVM (Figure 2c) and where Bayesian GPC indicated that M. polymorpha was most likely to occur. Furthermore, 47.5% of the pixels predicted as M. polymorpha by SVM but not SMA were in regions of high M. polymorpha likelihood (>0.66). In these regions, SVM predicted denser M. polymorpha forests than SMA. Given the superior performance of SVM over SMA, the results obtained from SVM classification were utilized to generate the final M. polymorpha classification products. These include a high-resolution (2 m × 2 m) canopy map (Figure 2a) and a 30 m × 30 m canopy density map (Figure 3).

3.2. Metrosideros Polymorpha Distribution

Hawai’i Island spans 10,430 km2, 2739 km2 of which is forested, and 1626 km2 of these forests are M. polymorpha according to the 2 m × 2 m SVM distribution map. M. polymorpha comprises 59.4% of forest canopies on Hawai’i Island. We compared the existing HI-GAP M. polymorpha coverage map (Figure S4) with our updated M. polymorpha 30 m × 30 m canopy density map. According to HI-GAP, M. polymorpha covered 2346 km2 in 2001. Moreover, 2063 km2 of the HI-GAP M. polymorpha coverage map overlapped with our density map. In these overlapping regions, our density map had a mean and median coverage of 0.84% and 0.98%, respectively. Using the density of M. polymorpha canopies in this area, we calculated that approximately 1743 km2 of M. polymorpha canopies exist in this region of overlap. Regions that were not included in the HI-GAP map had lower M. polymorpha canopy densities, with mean and median percent coverage of 0.53 and 0.54, respectively. This region included 751 km2 of M. polymorpha canopies. We assume that most of these canopies existed 18 years before GAO data collection and the difference is largely a result of higher spatial (2 m × 2 m scaled to 30 m × 30 m) and spectral resolution afforded by airborne imaging spectroscopy as compared to the multispectral 30 m × 30 m spaceborne Landsat sensor.

4. Discussion

4.1. High-Resolution Model Comparison

In classifying a single, highly polymorphic species across a large geographic extent, SVM outperformed SMA. Not only did the SVM have higher performance metrics in this and other Hawai’i-based imaging spectroscopy classification studies [15,32], but when evaluated in our study, SMA resulted in many false positives outside the current range of M. polymorpha. SMA was included in this study as it has been suggested as a means of circumventing issues related to background signals and mixed pixels [1,3] and therefore is especially useful when classifying species across a broad range of ecosystems. The relatively poor performance of SMA may be attributed to the reduced variability in the spectral library [3]. While we attempted to include much of the spectral variability of the initial training dataset through hierarchical clustering, the MESMA spectral library included less variability than the original training data used by the SVM. By collecting a large training dataset that included M. polymorpha crowns with different vegetation understories and stand compositions, the SVM learned many of the possible M. polymorpha reflectance signatures and was, therefore, able to achieve higher accuracy and precision than SMA. Aggregating training data using hierarchical clustering for the SMA model likely removed much of the variation in M. polymorpha pixels and may have exacerbated noise from show-through and mixed pixels. Here, we needed to balance model performance with computation time as the full spectral library of 5366 crowns was too computationally expensive to run MESMA even using a supercomputer.

4.2. Considerations for Future Large-Scale Modeling Efforts

As imaging spectroscopy technology advances and becomes more widely available via spaceborne sensors [57,58,59,60], it will become increasingly important to address challenges associated with large-scale vegetation classifications. Many of these challenges were present in this mapping effort as differences in topography, background vegetation, sun angle relative to the aircraft, and day of data collection, among others, challenged the accurate classification of M. polymorpha as they have for other species [1,4]. While we used atmospheric correction, brightness normalization, shade masking, and bidirectional reflectance distribution function because these techniques reduce variation in reflectance spectra between mosaiced flight lines [4,38], we still needed to adjust our field sampling to capture the reflectance variation across flight lines. Yet sampling across flight lines in the field was not possible in all regions due to accessibility issues, and this will likely be the case for classifications of other species, especially in tropical regions. While helicopter surveys helped to fill gaps in our ground-based field sampling, the expense and difficulty of identifying and delineating crowns from above is prohibitive for many classification endeavors. In future spaceborne applications, differences in reflectance resulting from satellite passes will need to be addressed to achieve seamless classification maps, especially as some techniques such as shade masking will likely not be possible due to lower spatial resolutions.
Differences in background vegetation and stand characteristics across the study area as well as morphological and spectral variation of M. polymorpha across environmental gradients [19,20,61,62] challenged the development of this large-scale M. polymorpha spatial distribution dataset. Here, we attempted to classify M. polymorpha growing on lava flows and manicured lawns as well as individuals existing in largely alien forests and M. polymorpha-dominated stands. While the high spatial resolution (2 m × 2 m) of our imaging spectroscopy data helped circumvent this issue, mixed pixels at the edges of canopies challenged our classifications. Further, stands dominated by M. polymorpha have different understory vegetation across Hawai’i Island, from the invasive Psidium cattleianum (strawberry guava) to the native Dicranopteris linearis (Uluhe fern). Differences in understory can cause classification inaccuracies due to show-through [63]. As differences in canopy density and species dominance within a stand are other factors in the spectral separability [3,35], the diverse canopy structure and density of M. polymorpha across the island likely led to different accuracies based on stand structure.
Another challenge to mapping M. polymorpha across Hawai’i Island was assessing model performance across a large geographic region. Both the SVM and SMA models achieved high classification accuracies (>93%), but conservationists referencing results from the SMA model would waste valuable time in geographic regions with high false positive rates of M. polymorpha. We employed Bayesian GPC to address this shortcoming of traditional model metrics and assess model performance spatially. While the GPC, like the spectral classification models, was biased based on our crown sampling locations, it provided a means to determine where and how the classification models were erroneous. For example, we were able to assess disagreements between the SVM and SMA outside the training dataset. While the training dataset was extensive, it biased our ability to fully assess model performance as we could not entirely capture the variability of M. polymorpha nor that of the other vegetation. We believe that employing spatial validation techniques such as the Bayesian GPC model, while not routinely used for species classification validation currently, will improve future large-scale classification efforts.

5. Conclusions

Large-scale vegetation classifications have many practical uses in conservation decision-making [64,65,66,67]. For example, this island-wide dataset of the keystone species M. polymorpha can be used to improve disease-tracking models and as input for watershed-level decision-making models [26,27,28]. Until recently, these decision-making processes relied on a mapping effort from 2001, and while these data were useful for approximating M. polymorpha across Hawai’i Island, especially in regions with dense M. polymorpha stands, it did not include up to 316 km2 of M. polymorpha canopies, which are typically found in regions with low M. polymorpha canopy density. To achieve routine species classifications at large spatial scales, we need to address not only the issues discussed above but also questions of spatial resolution [68] and training data collection [49]. The upcoming spaceborne imaging spectrometers will collect data at 30 m × 30 m resolution while the data used here were 2 m × 2 m. Further, this project required extensive fieldwork to collect over 5000 training points, but designing better methods of planning sampling schemes across ecosystems and environmental gradients that would require less fieldwork but lead to similar results would make mapping projects like this more feasible.

Supplementary Materials

The following supporting information can be downloaded at: https://www.mdpi.com/article/10.3390/rs15184365/s1, Figure S1: Metrosideros polymorpha (‘ohi’a lehua) in bloom.; Figure S2: Mean spectra of Metrosideros polymorpha and other vegetation in the spectral library; Figure S3: Location of the 5366 crowns collected across Hawai’i Island to train the classification models; Figure S4: 2001 HI-GAP Metrosideros polymorpha extent as estimated using Landsat data.

Author Contributions

Conceptualization, M.M.S., G.P.A. and R.E.M.; methodology, all authors; data curation, N.R.V.; fieldwork, M.M.S.; code development, M.M.S., B.L.S. and M.K.; formal analysis, M.M.S. and B.L.S.; writing—original draft preparation, M.M.S.; writing—review and editing, all authors; funding acquisition, M.M.S. and G.P.A. All authors have read and agreed to the published version of the manuscript.

Funding

This research was funded by the National Science Foundation Doctoral Dissertation Improvement Grant (Award Number 2218932).

Data Availability Statement

Crown data used for model training and all M. polymorpha data products are publically available in Figshare at 10.6084/m9.figshare.23992620, accessed on 1 September 2023.

Acknowledgments

The Global Airborne Observatory (GAO) is managed by the Center for Global Discovery and Conservation Science at Arizona State University. The GAO is made possible by support from private foundations, visionary individuals, and Arizona State University.

Conflicts of Interest

The authors declare no conflict of interest.

References

  1. Fassnacht, F.E.; Latifi, H.; Stereńczak, K.; Modzelewska, A.; Lefsky, M.; Waser, L.T.; Straub, C.; Ghosh, A. Review of studies on tree species classification from remotely sensed data. Remote Sens. Environ. 2016, 186, 64–87. [Google Scholar] [CrossRef]
  2. Baldeck, C.A.; Asner, G.P.; Martin, R.E.; Anderson, C.B.; Knapp, D.E.; Kellner, J.R.; Wright, S.J. Operational Tree Species Mapping in a Diverse Tropical Forest with Airborne Imaging Spectroscopy. PLoS ONE 2015, 10, e0118403. [Google Scholar] [CrossRef] [PubMed]
  3. Roth, K.L.; Roberts, D.A.; Dennison, P.E.; Alonzo, M.; Peterson, S.H.; Beland, M. Differentiating plant species within and across diverse ecosystems with imaging spectroscopy. Remote Sens. Environ. 2015, 167, 135–151. [Google Scholar] [CrossRef]
  4. Laybros, A.; Schläpfer, D.; Féret, J.-B.; Descroix, L.; Bedeau, C.; Lefevre, M.-J.; Vincent, G. Across Date Species Detection Using Airborne Imaging Spectroscopy. Remote Sens. 2019, 11, 789. [Google Scholar] [CrossRef]
  5. Lopatin, J.; Dolos, K.; Kattenborn, T.; Fassnacht, F.E. How canopy shadow affects invasive plant species classification in high spatial resolution remote sensing. Remote Sens. Ecol. Conserv. 2019, 5, 302–317. [Google Scholar] [CrossRef]
  6. Roth, K.L.; Dennison, P.E.; Roberts, D.A. Comparing endmember selection techniques for accurate mapping of plant species and land cover using imaging spectrometer data. Remote Sens. Environ. 2012, 127, 139–152. [Google Scholar] [CrossRef]
  7. Comber, A.; Fisher, P.; Brunsdon, C.; Khmag, A. Spatial analysis of remote sensing image classification accuracy. Remote Sens. Environ. 2012, 127, 237–246. [Google Scholar] [CrossRef]
  8. Yu, Q.; Gong, P.; Tian, Y.; Pu, R.; Yang, J. Factors Affecting Spatial Variation of Classification Uncertainty in an Image Object-based Vegetation Mapping. Photogramm. Eng. Remote Sens. 2008, 74, 1007–1018. [Google Scholar] [CrossRef]
  9. Mortenson, L.A.; Hughes, R.F.; Friday, J.B.; Keith, L.M.; Barbosa, J.M.; Friday, N.J.; Liu, Z.; Sowards, T.G. Assessing spatial distribution, stand impacts and rate of Ceratocystis fimbriata induced ‘ōhi‘a (Metrosideros polymorpha) mortality in a tropical wet forest, Hawai‘i Island, USA. For. Ecol. Manag. 2016, 377, 83–92. [Google Scholar] [CrossRef]
  10. Loope, L.; Hughes, F.; Keith, L.; Harrington, R.; Hauff, R.; Friday, J.B.; Ewig, C.; Bennett, G.; Cannon, P.; Atkinson, C.; et al. Guidance Document for Rapid Ohia Death: Background for the 2017–2019 ROD Strategic Response Plan; University of Hawaii, College of Tropical Agriculture and Human Resources: Honolulu, HI, USA, 2016. [Google Scholar]
  11. Pratt, T.; Atkinson, C.; Banko, P.C.; Jacobi, J.; Woodworth, B. Conservation Biology of Hawaiian Forest Birds; Yale University Press: London, UK, 2009; Available online: https://yalebooks.yale.edu/9780300141085/conservation-biology-of-hawaiian-forest-birds (accessed on 4 August 2022).
  12. Chow, E.T. The Sovereign Nation of Hawai’i: Resistance in the Legacy of “Aloha ‘Oe”. SUURJ Seattle Univ. Undergrad. Res. J. 2018, 2, 15. [Google Scholar]
  13. Westervelt, W.D. Hawaiian Legends of Volcanoes (Mythology); Ellis Press: Los Angeles, CA, USA, 1916. [Google Scholar]
  14. Kagawa, A.; Sack, L.; Duarte, K.; James, S. Hawaiian native forest conserves water relative to timber plantation: Species and stand traits influence water use. Ecol. Appl. Publ. Ecol. Soc. Am. 2009, 19, 1429–1443. [Google Scholar] [CrossRef] [PubMed]
  15. Vaughn, N.R.; Asner, G.P.; Brodrick, P.G.; Martin, R.E.; Heckler, J.W.; Knapp, D.E.; Hughes, R.F. An Approach for High-Resolution Mapping of Hawaiian Metrosideros Forest Mortality Using Laser-Guided Imaging Spectroscopy. Remote Sens. 2018, 10, 502. [Google Scholar] [CrossRef]
  16. Wagner, W.L.; Herbst, D.R.; Sohmer, S.H. Manual of the Flowering Plants of Hawai’i; University of Hawaii Press: Honolulu, HI, USA, 1990; ISBN 978-0-8248-8577-9. Available online: https://www.degruyter.com/document/isbn/9780824885779/html?lang=en (accessed on 20 April 2023).
  17. Somers, B.; Asner, G.P. Invasive Species Mapping in Hawaiian Rainforests Using Multi-Temporal Hyperion Spaceborne Imaging Spectroscopy. IEEE J. Sel. Top. Appl. Earth Obs. Remote Sens. 2013, 6, 351–359. [Google Scholar] [CrossRef]
  18. Vitousek, P.M. Nutrient Cycling and Limitation: Hawai’i as a Model System; Princeton University Press: Princeton, NJ, USA, 2004; Available online: http://www.jstor.org/stable/j.ctv39x77c (accessed on 23 September 2022).
  19. Cordell, S.; Goldstein, G.; Mueller-Dombois, D.; Webb, D.; Vitousek, P.M. Physiological and morphological variation in Metrosideros polymorpha, a dominant Hawaiian tree species, along an altitudinal gradient: The role of phenotypic plasticity. Oecologia 1998, 113, 188–196. [Google Scholar] [CrossRef] [PubMed]
  20. Joel, G.; Aplet, G.; Vitousek, P.M. Leaf Morphology Along Environmental Gradients in Hawaiian Metrosideros Polymorpha. Biotropica 1994, 26, 17–22. [Google Scholar] [CrossRef]
  21. Martin, R.E.; Asner, G.P.; Sack, L. Genetic variation in leaf pigment, optical and photosynthetic function among diverse phenotypes of Metrosideros polymorpha grown in a common garden. Oecologia 2007, 151, 387–400. [Google Scholar] [CrossRef]
  22. Stacy, E.A.; Johansen, J.B.; Sakishima, T.; Price, D.K.; Pillon, Y. Incipient radiation within the dominant Hawaiian tree Metrosideros polymorpha. Heredity 2014, 113, 334–342. [Google Scholar] [CrossRef]
  23. Stacy, E.A.; Johansen, J.B.; Sakishima, T.; Price, D.K. Genetic analysis of an ephemeral intraspecific hybrid zone in the hypervariable tree, Metrosideros polymorpha, on Hawai‘i Island. Heredity 2016, 117, 173–183. [Google Scholar] [CrossRef]
  24. Seeley, M.M.; Stacy, E.A.; Martin, R.E.; Asner, G.P. Foliar functional and genetic variation in a keystone Hawaiian tree species estimated through spectroscopy. Oecologia 2023, 202, 15–28. [Google Scholar] [CrossRef]
  25. U.S. Geological Survey Gap. Analysis Program GAP/LANDFIRE National Terrestrial Ecosystems 2011; U.S. Geological Survey: Reston, VA, USA, 2011.
  26. Pascual, A.; Giardina, C.P.; Povak, N.A.; Hessburg, P.F.; Asner, G.P. Integrating ecosystem services modeling and efficiencies in decision-support models conceptualization for watershed management. Ecol. Model. 2022, 466, 109879. [Google Scholar] [CrossRef]
  27. Pascual, A.; Giardina, C.P.; Povak, N.A.; Hessburg, P.F.; Heider, C.; Salminen, E.; Asner, G.P. Optimizing invasive species management using mathematical programming to support stewardship of water and carbon-based ecosystem services. J. Environ. Manag. 2022, 301, 113803. [Google Scholar] [CrossRef] [PubMed]
  28. Povak, N.A.; Hessburg, P.F.; Giardina, C.P.; Reynolds, K.M.; Heider, C.; Salminen, E.; Salter, R.B.; MacKenzie, R.A. A watershed decision support tool for managing invasive species on Hawai‘i Island, USA. For. Ecol. Manag. 2017, 400, 300–320. [Google Scholar] [CrossRef]
  29. Boardman, J.W.; Green, R.O. Exploring the spectral variability of the Earth as measured by AVIRIS in 1999. In Proceedings of the Ninth JPL Airborne Earth Science Workshop; Jet Propulsion Laboratory: Pasadena, CA, USA, 2000. Available online: https://trs.jpl.nasa.gov/handle/2014/16602 (accessed on 3 January 2023).
  30. Green, R.O.; Boardman, J.W. Exploration of the relationship between information content and signal-to-noise ratio and spatial resolution in AVIRIS spectral data. Spectrum 2000, 7. [Google Scholar]
  31. Asner, G.P.; Martin, R.E. Airborne spectranomics: Mapping canopy chemical and taxonomic diversity in tropical forests. Front. Ecol. Environ. 2009, 7, 269–276. [Google Scholar] [CrossRef]
  32. Balzotti, C.S.; Asner, G.P.; Adkins, E.D.; Parsons, E.W. Spatial drivers of composition and connectivity across endangered tropical dry forests. J. Appl. Ecol. 2020, 57, 1593–1604. [Google Scholar] [CrossRef]
  33. Chakravortty, S.; Shah, E.; Chowdhury, A.S. Application of Spectral Unmixing Algorithm on Hyperspectral Data for Mangrove Species Classification. In Proceedings of the Applied Algorithms; Gupta, P., Zaroliagis, C., Eds.; Springer International Publishing: Cham, Switzerland, 2014; pp. 223–236. [Google Scholar]
  34. Pontius, J.; Hanavan, R.P.; Hallett, R.A.; Cook, B.D.; Corp, L.A. High spatial resolution spectral unmixing for mapping ash species across a complex urban environment. Remote Sens. Environ. 2017, 199, 360–369. [Google Scholar] [CrossRef]
  35. Shang, X.; Chisholm, L.A. Classification of Australian Native Forest Species Using Hyperspectral Remote Sensing and Machine-Learning Classification Algorithms. IEEE J. Sel. Top. Appl. Earth Obs. Remote Sens. 2014, 7, 2481–2489. [Google Scholar] [CrossRef]
  36. Somers, B.; Asner, G.P. Tree species mapping in tropical forests using multi-temporal imaging spectroscopy: Wavelength adaptive spectral mixture analysis. Int. J. Appl. Earth Obs. Geoinf. 2014, 31, 57–66. [Google Scholar] [CrossRef]
  37. Torabzadeh, H.; Leiterer, R.; Hueni, A.; Schaepman, M.E.; Morsdorf, F. Tree species classification in a temperate mixed forest using a combination of imaging spectroscopy and airborne laser scanning. Agric. For. Meteorol. 2019, 279, 107744. [Google Scholar] [CrossRef]
  38. Asner, G.P.; Knapp, D.E.; Boardman, J.; Green, R.O.; Kennedy-Bowdoin, T.; Eastwood, M.; Martin, R.E.; Anderson, C.; Field, C.B. Carnegie Airborne Observatory-2: Increasing science data dimensionality via high-fidelity multi-sensor fusion. Remote Sens. Environ. 2012, 124, 454–465. [Google Scholar] [CrossRef]
  39. Féret, J.-B.; Asner, G.P. Mapping tropical forest canopy diversity using high-fidelity imaging spectroscopy. Ecol. Appl. 2014, 24, 1289–1296. [Google Scholar] [CrossRef]
  40. Marconi, S.; Weinstein, B.G.; Zou, S.; Bohlman, S.A.; Zare, A.; Singh, A.; Stewart, D.; Harmon, I.; Steinkraus, A.; White, E.P. Continental-scale hyperspectral tree species classification in the United States National Ecological Observatory Network. Remote Sens. Environ. 2022, 282, 113264. [Google Scholar] [CrossRef]
  41. Miller, C.J. Performance assessment of ACORN atmospheric correction algorithm. In Proceedings of the Algorithms and Technologies for Multispectral, Hyperspectral, and Ultraspectral Imagery VIII; SPIE: Bellingham, WA, USA, 2002; Volume 4725, pp. 438–449. Available online: https://www.spiedigitallibrary.org/conference-proceedings-of-spie/4725/0000/Performance-assessment-of-ACORN-atmospheric-correction-algorithm/10.1117/12.478777.full (accessed on 21 December 2021).
  42. Schaepman-Strub, G.; Schaepman, M.; Martonchik, J.; Schaaf, C. What’s in a Satellite Albedo Product? IEEE Int. Symp. Geosci. Remote Sens. 2006, 2848–2852. [Google Scholar]
  43. Feilhauer, H.; Asner, G.P.; Martin, R.E.; Schmidtlein, S. Brightness-normalized Partial Least Squares Regression for hyperspectral data. J. Quant. Spectrosc. Radiat. Transf. 2010, 111, 1947–1957. [Google Scholar] [CrossRef]
  44. Colgan, M.S.; Baldeck, C.A.; Féret, J.-B.; Asner, G.P. Mapping Savanna Tree Species at Ecosystem Scales Using Support Vector Machine Classification and BRDF Correction on Airborne Hyperspectral and LiDAR Data. Remote Sens. 2012, 4, 3462–3480. [Google Scholar] [CrossRef]
  45. Asner, G.P.; Knapp, D.E.; Kennedy-Bowdoin, T.; Jones, M.O.; Martin, R.E.; Boardman, J.W.; Field, C.B. Carnegie Airborne Observatory: In-flight fusion of hyperspectral imaging and waveform light detection and ranging for three-dimensional studies of ecosystems. J. Appl. Remote Sens. 2007, 1, 013536. [Google Scholar] [CrossRef]
  46. Weingarten, E.; Martin, R.; Hughes, F.; Vaughn, N.; Schafron, E.; Asner, G.P. Early Detection of a Tree Pathogen using Airborne Remote Sensing. Ecol. Appl. 2021, 21, e2519. [Google Scholar] [CrossRef]
  47. Dalponte, M.; Bruzzone, L.; Gianelle, D. Tree species classification in the Southern Alps based on the fusion of very high geometrical resolution multispectral/hyperspectral images and LiDAR data. Remote Sens. Environ. 2012, 123, 258–270. [Google Scholar] [CrossRef]
  48. Dalponte, M.; Ørka, H.O.; Gobakken, T.; Gianelle, D.; Næsset, E. Tree Species Classification in Boreal Forests With Hyperspectral Data. IEEE Trans. Geosci. Remote Sens. 2013, 51, 2632–2645. [Google Scholar] [CrossRef]
  49. Feret, J.-B.; Asner, G.P. Tree Species Discrimination in Tropical Forests Using Airborne Imaging Spectroscopy. IEEE Trans. Geosci. Remote Sens. 2013, 51, 73–84. [Google Scholar] [CrossRef]
  50. Crabbé, A.H.; Somers, B.; Roberts, D.A.; Halligan, K.; Dennison, P.; Dudley, K. MESMA QGIS Plugin. 2020. Available online: https://bitbucket.org/kul-reseco/mesma (accessed on 1 November 2022).
  51. Roberts, D.A.; Gardner, M.; Church, R.; Ustin, S.; Scheer, G.; Green, R.O. Mapping Chaparral in the Santa Monica Mountains Using Multiple Endmember Spectral Mixture Models. Remote Sens. Environ. 1998, 65, 267–279. [Google Scholar] [CrossRef]
  52. Camps-Valls, G.; Gomez-Chova, L.; Calpe-Maravilla, J.; Martin-Guerrero, J.D.; Soria-Olivas, E.; Alonso-Chorda, L.; Moreno, J. Robust support vector method for hyperspectral data classification and knowledge discovery. IEEE Trans. Geosci. Remote Sens. 2004, 42, 1530–1542. [Google Scholar] [CrossRef]
  53. Melgani, F.; Bruzzone, L. Classification of hyperspectral remote sensing images with support vector machines. IEEE Trans. Geosci. Remote Sens. 2004, 42, 1778–1790. [Google Scholar] [CrossRef]
  54. Pedregosa, F.; Varoquaux, G.; Gramfort, A.; Michel, V.; Thirion, B.; Grisel, O.; Blondel, M.; Prettenhofer, P.; Weiss, R.; Dubourg, V.; et al. Scikit-learn: Machine Learning in Python. J. Mach. Learn. Res. 2011, 12, 2825–2830. [Google Scholar]
  55. Youden, W.J. Index for rating diagnostic tests. Cancer 1950, 3, 32–35. [Google Scholar] [CrossRef] [PubMed]
  56. Rasmussen, C.E. Gaussian Processes in Machine Learning. In Advanced Lectures on Machine Learning; Bousquet, O., von Luxburg, U., Rätsch, G., Eds.; Lecture Notes in Computer Science; Springer: Berlin/Heidelberg, Germany, 2004; Volume 3176, pp. 63–71. ISBN 978-3-540-23122-6. Available online: http://link.springer.com/10.1007/978-3-540-28650-9_4 (accessed on 19 April 2023).
  57. Culver, T.; Rydeen, A.; Dix, M.; Camello, M.; Gallaher, M.; Lapidus, D.; Brown, E.; Lee, C.; Luvall, J.; Stavros, N.; et al. SBG User Needs and Valuation Study; RTI Innovation Advisors: Durham, NC, USA, 2020. [Google Scholar]
  58. Iwasaki, A.; Tanii, J.; Kashimura, O.; Ito, Y. Prelaunch Status of Hyperspectral Imager Suite (Hisui). In Proceedings of the IGARSS 2019–2019 IEEE International Geoscience and Remote Sensing Symposium, Yokohama, Japan, 28 July–2 August 2019; pp. 5887–5890. [Google Scholar]
  59. Lopinto, E.; Ananasso, C. The Prisma Hyperspectral Mission. In Proceedings of the 33rd EARSeL Symposium, Towards Horizon, Matera, Italy, 3–6 June 2013; Volume 12. [Google Scholar]
  60. Müller, R.; Alonso, K.; Krawczyk, H.; Bachmann, M.; Cerra, D.; Krutz, D.; Dietrich, D.; Gerasch, B.; Ziel, V.; Heiden, U.; et al. Overview and Status of the DESIS Mission. In Proceedings of the 9th Whispers Conference, Amsterdam, The Netherlands, 23–26 September 2018. [Google Scholar]
  61. Martin, R.E.; Asner, G.P. Leaf Chemical and Optical Properties of Metrosideros polymorpha across Environmental Gradients in Hawaii. Biotropica 2009, 41, 292–301. [Google Scholar] [CrossRef]
  62. Seeley, M.M.; Martin, R.E.; Vaughn, N.R.; Thompson, D.R.; Dai, J.; Asner, G.P. Quantifying the Variation in Reflectance Spectra of Metrosideros polymorpha Canopies across Environmental Gradients. Remote Sens. 2023, 15, 1614. [Google Scholar] [CrossRef]
  63. Jensen, R.R.; Hardin, P.J.; Hardin, A.J. Classification of urban tree species using hyperspectral imagery. Geocarto Int. 2012, 27, 443–458. [Google Scholar] [CrossRef]
  64. Callaghan, J.; McAlpine, C.; Mitchell, D.; Thompson, J.; Bowen, M.; Rhodes, J.; Jong, C.d.; Domalewski, R.; Scott, A.; Callaghan, J.; et al. Ranking and mapping koala habitat quality for conservation planning on the basis of indirect evidence of tree-species use: A case study of Noosa Shire, south-eastern Queensland. Wildl. Res. 2011, 38, 89–102. [Google Scholar] [CrossRef]
  65. Fremout, T.; Thomas, E.; Gaisberger, H.; Van Meerbeek, K.; Muenchow, J.; Briers, S.; Gutierrez-Miranda, C.E.; Marcelo-Peña, J.L.; Kindt, R.; Atkinson, R.; et al. Mapping tree species vulnerability to multiple threats as a guide to restoration and conservation of tropical dry forests. Glob. Chang. Biol. 2020, 26, 3552–3568. [Google Scholar] [CrossRef]
  66. Jonsson, M.; Bengtsson, J.; Gamfeldt, L.; Moen, J.; Snäll, T. Levels of forest ecosystem services depend on specific mixtures of commercial tree species. Nat. Plants 2019, 5, 141–147. [Google Scholar] [CrossRef] [PubMed]
  67. Maciel, E.A.; Martins, F.R. Rarity patterns and the conservation status of tree species in South American savannas. Flora 2021, 285, 151942. [Google Scholar] [CrossRef]
  68. Roth, K.L.; Roberts, D.A.; Dennison, P.E.; Peterson, S.H.; Alonzo, M. The impact of spatial resolution on the classification of plant species and functional types within imaging spectrometer data. Remote Sens. Environ. 2015, 171, 45–57. [Google Scholar] [CrossRef]
Figure 1. Location of the 5366 crowns collected across Hawai’i Island to train the classification models. Red represents all Metrosideros polymorpha canopies, and blue represents all other vegetation types.
Remotesensing 15 04365 g001
Figure 2. Metrosideros polymorpha classifications: (a) SVM, (b) SMA. Red indicates where M. polymorpha canopies are located according to each model. (c) Comparison of SVM and SMA classifications. Yellow: M. polymorpha presence predicted by SVM only, Blue: M. polymorpha presence predicted by SMA only. Gaussian process classification heatmap and contour lines indicating M. polymorpha likelihood (white: Unlikely, darker: High likelihood).
Remotesensing 15 04365 g002
Figure 3. Metrosideros polymorpha density map. The resolution is 30 m × 30 m.
Remotesensing 15 04365 g003
Table 1. Confusion matrix for the SMA and support vector machine (SVM) classifications of M. polymorpha on test datasets (2 m × 2 m).
Predicted
Spectral Mixture AnalysisSupport Vector Machine
M. polymorphaOther VegetationM. polymorphaOther Vegetation
ActualM. polymorpha4784649727
Other Vegetation611025441042
Table 2. Island-wide assessment of support vector machine (SVM) and SMA classification relative to Bayesian GPC spatial classification. Values indicate the percentage of 2 m × 2 m pixels that were classified as M. polymorpha by one model and not the other in regions of high (>0.66), low (<0.33), and medium probability of M. polymorpha according to Bayesian GPC based on training data spatial information.
High M. polymorpha LikelihoodLow M. polymorpha LikelihoodMedium M. polymorpha Likelihood
Support Vector Machine47.513.938.9
Spectral Mixture Analysis29.430.639.8
Disclaimer/Publisher’s Note: The statements, opinions and data contained in all publications are solely those of the individual author(s) and contributor(s) and not of MDPI and/or the editor(s). MDPI and/or the editor(s) disclaim responsibility for any injury to people or property resulting from any ideas, methods, instructions or products referred to in the content.

